Article

The Impact of Canopy on Nutrient Fluxes through Rainfall Partitioning in a Mixed Broadleaf and Coniferous Forest

1
CAS Key Laboratory of Forest Ecology and Silviculture, Institute of Applied Ecology, Chinese Academy of Sciences, Shenyang 110016, China
2
College of Resources and Environment, University of Chinese Academy of Sciences, Beijing 100049, China
3
Research Station of Changbai Mountain Forest Ecosystems, Chinese Academy of Sciences, Yanbian 133600, China
*
Author to whom correspondence should be addressed.
Forests 2024, 15(4), 623; https://doi.org/10.3390/f15040623
Submission received: 30 January 2024 / Revised: 8 March 2024 / Accepted: 27 March 2024 / Published: 29 March 2024
(This article belongs to the Section Forest Hydrology)

Abstract

:
Rainfall constitutes the primary input in the nutrient flux within forest ecosystems. The forest canopy modulates this flux by partitioning rainfall and selectively absorbing or adding nutrients. In mixed forests, variation in tree species composition regulates rainwater chemical composition, potentially leading to spatial heterogeneity in nutrient distribution and influencing nutrient cycling processes. This study examined the partitioning of rainfall into throughfall and stemflow, as well as their associated nutrient concentrations and fluxes, in a mixed broadleaf and coniferous forest on Changbai Mountain in Northeast China. We observed a rising trend in nutrient contents from rainfall to throughfall and then stemflow. The nutrient contents of stemflow varied largely with tree species due to the differences in canopy structure and bark morphological characteristics. The nutrient input contributed by throughfall and stemflow was 92.30 kg ha−1 during the observation period, and most elements underwent passive leaching through washout except for F and Na+. We note that the nutrient fluxes in stemflow differed among tree species, with Pinus koraiensis (PK) delivering more acid group anions and Quercus mongolica (QM) providing more cations. Our research provides new insights into nutrient cycling within mixed forest canopies, sparking a transformative advancement in forest management and protection strategies through hydrochemistry-driven solutions.

1. Introduction

Nutrient inputs have a significant impact on plant growth and the nutrient cycle in forest ecosystems, and rainfall is an important hydrological highway for nutrient transport [1,2], thus playing a crucial role in the stability of forest ecosystems. The forest canopy can significantly modulate nutrient fluxes by partitioning rainfall and selectively absorbing or adding nutrients [3]. Therefore, exploring the rainfall redistribution and nutrient input characteristics as influenced by the forest canopy is of great significance for a better understanding of the nutrient cycling processes and stability mechanisms of forest ecosystems.
The forest canopy affects rainfall redistribution by partitioning it into interception, stemflow, and throughfall [4,5]. The combination of throughfall and stemflow is called net precipitation, in which throughfall generally accounts for 60%–80% of the rainfall, while stemflow accounts for only 2%–6% [6]. This partition is affected by many factors, including vegetation characteristics (e.g., canopy structure, tree height, and bark roughness) [7,8,9], rainfall characteristics (e.g., amount, intensity, duration, and interval time) [10,11], and meteorological conditions (e.g., wind speed and direction and air temperature) [12]. Specifically, stemflow is primarily influenced by vegetation traits such as bark texture, diameter at breast height (DBH), and the ratio of canopy height to width [13], whereas throughfall and interception are primarily influenced by vegetation traits and meteorological conditions [14].
Rainfall redistribution in the forest canopy subsequently affects the chemical properties of rainwater through the accumulation of dry deposition materials and secondary metabolites secreted by plants. These substances are washed away by rain and enter the forest via throughfall and stemflow, increasing the complexity of rainfall composition to a large extent [15,16]. For example, previous studies found that a large number of metal ions initially present in rainfall are leached out and a portion of ammonium ions are absorbed after passing through the canopy [17,18]. The nutrient concentrations of throughfall and stemflow are reported to be higher than the initial rainfall; the nutrient concentrations of stemflow especially can be up to 20 times higher than throughfall and rainfall [19,20]. This is mainly because the longer contact time with bark during stemflow allows soluble nutrients to be leached out more efficiently.
Stemflow also acts as a link between the forest canopy and ground soil through the transport of animal remains, plant tissue, and other organic matter to the soil [21,22]. Stemflow has a considerable impact on the moisture conditions, physical and chemical properties, nutritional status, and microbial composition of the soil around the tree stem [23,24]. For example, stemflow leads to higher nutrient and water contents in the areas covered by a vegetation canopy compared to bare land, which is called the fertile island effect [25,26,27,28]. Most studies regarding stemflow’s effect on soil water and nutrients focused on the whole forest stand [29,30,31,32], ignoring the areas near the stem under the canopy. However, differences in stemflow characterizations may result in spatial variations in soil nutrients, especially in mixed forests [33].
The impact of the canopy on rainfall varies largely with the type of forest, due to differences in tree species composition and age structure. Previous studies found that evergreen coniferous forests are more likely to acidify rainwater and precipitate a large amount of acid anions, whereas deciduous broad-leaved forests can increase the pH of rainwater and tend to precipitate metal cations [3]. Trees at different growth stages influence nutrient composition mainly through phenological changes in seasonal canopy (e.g., leaf emergence, flowering, and leaf falling) [34]. In mixed forests, both tree species and age structure vary largely, making the canopy structure and bark morphology more complex. As a result, the impact of different tree species on the hydrochemistry process is still unclear in mixed forests.
To answer these questions, this study investigated the variations in the amounts and the nutrient contents between the rainfall, throughfall, and stemflow of different tree species in broadleaf and coniferous mixed forests on Changbai Mountain in Northeast China using a canopy budget model and chemical analysis. We tested three hypotheses: (1) different tree species have distinct patterns of stemflow generation; (2) the nutrients in throughfall and stemflow are different from rainfall; and (3) the nutrients in stemflow vary greatly between different tree species. The aim of the study is to (1) reveal the rainfall redistribution process in mixed forests and clarify the difference in hydrological processes among different species; (2) evaluate the effect of the forest canopy of forest hydrochemistry; and (3) quantify the nutrient fluxes from the canopy to the forest floor. Thus, this study will contribute to the understanding of the pattern of nutrient inputs through rainfall events in mixed temperate forests.

2. Materials and Methods

2.1. Research Site

This study was conducted in a mixed broadleaf and coniferous forest in the Changbai Mountain National Natural Reserve in Northeast China (42°24′ N, 128°05′ E, altitude 768 m). The area is a basalt platform with a north slope and flat terrain with a slope of 3.28°. The region has a temperate continental mountain climate affected by monsoon, with an annual precipitation of 700–800 mm and an annual mean temperature of 3.6 °C. The rainy season is mainly from June to August. The forest type in the research site is a mature primary mixed broadleaf and coniferous forest, with high homogeneity in stand landscape, adequate vegetation representation, and little human interference. The forest floor is covered by albic dark brown forest soil with a thickness of around 40 cm. The dominant tree species are Acer mono (AM), Tilia amurensis (TA), Pinus koraiensis (PK), Quercus mongolica (QM), and Fraxinus mandshurica (FM). The structural attributes of the forest stand and the five dominant tree species are listed in Table 1.

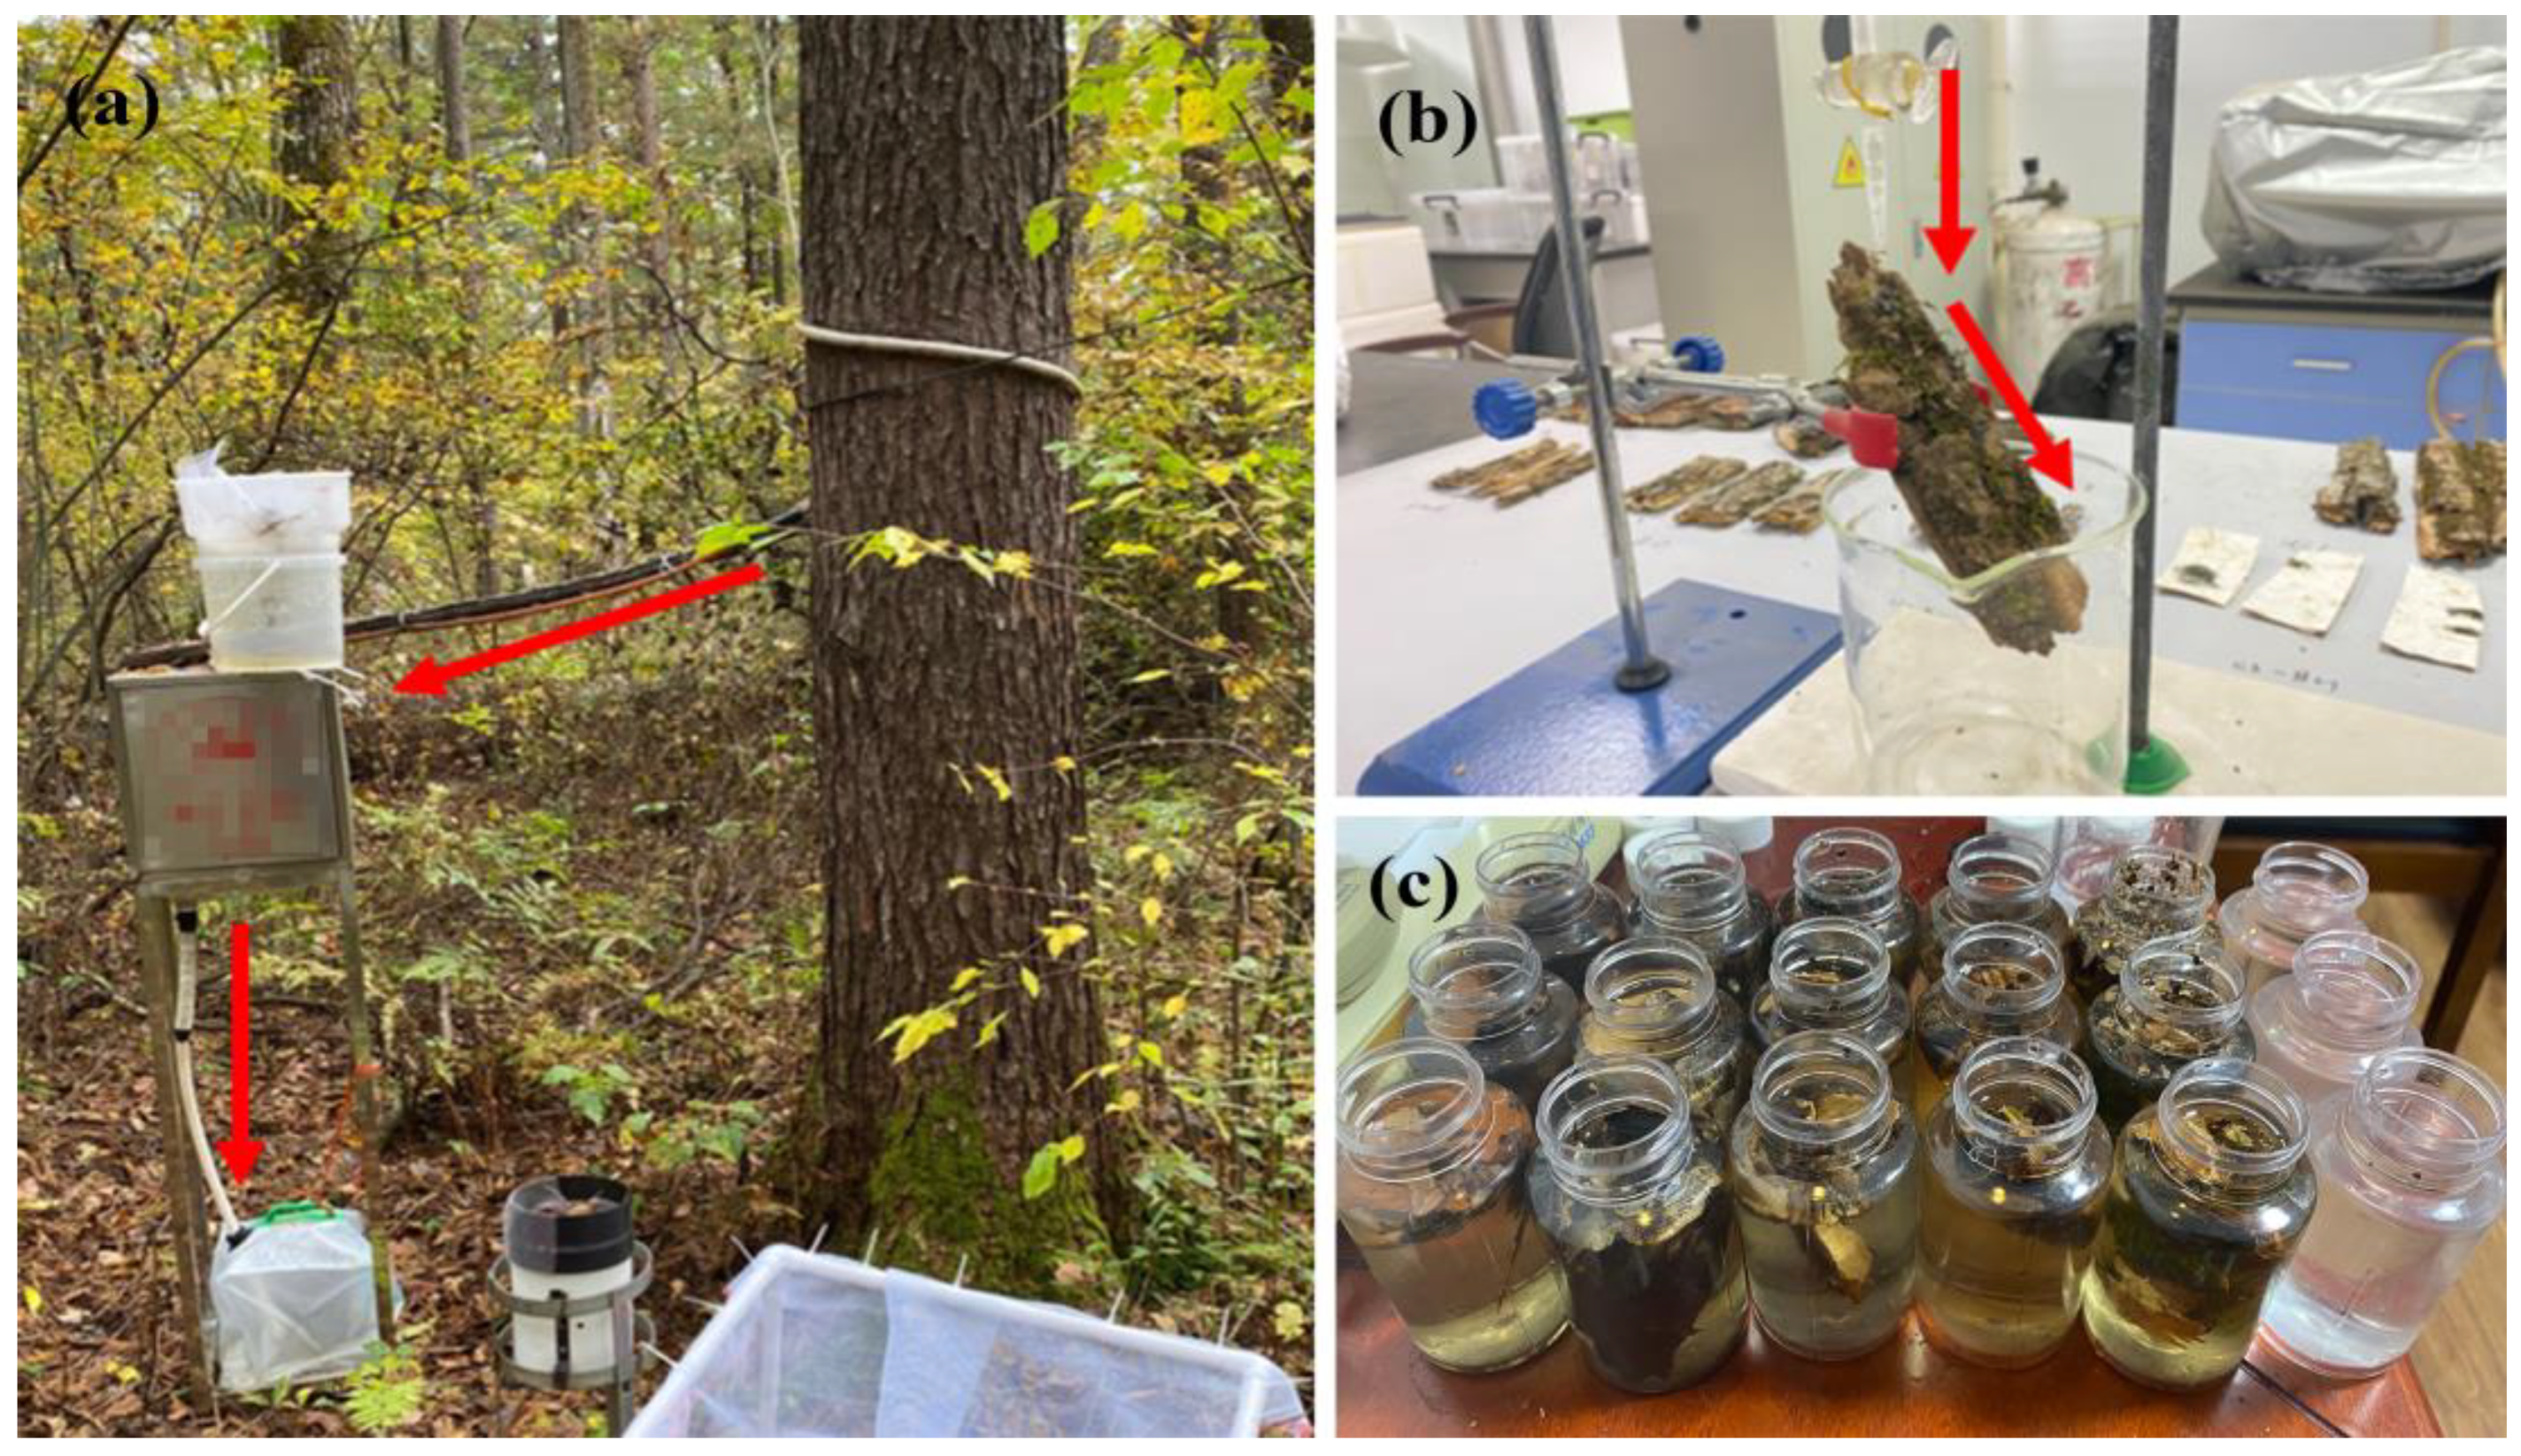
2.2. Field Measurement and Sample Collection

We studied the effect of the canopy on rainfall distribution and nutrient concentration by comparing the water content and nutrient fluxes in throughfall, stemflow, and rainfall samples during the 2021 growing season. The study was carried out within a 60 m × 100 m plot. We measured the amount of rainfall, throughfall, and stemflow of different tree species for each rain event using automatic rain gauges. A rain event was considered independent when there was no rainfall for an interval of 4 h or more. Meanwhile, we collected rainwater samples at least three times a month for chemical analysis, and a total of 10 precipitation events were sampled. Additionally, to investigate the impact of stemflow from different tree species on soil properties, we collected soil and measured the soil pH near the stem. The specific methods for rainfall measurement and sample collection are described below.
Rainfall: We measured rainfall in an open field outside the experimental plot using three automatic rain gauges (HOBO RG3-M, Onset, MA, USA; measuring range, 0–127 cm h−1; accuracy, ±1.0%; resolution, 0.2 mm). Meanwhile, we placed three self-made buckets, with a diameter of 20 cm and a depth of 30 cm, near the rain gauges to collect rainwater samples. In order to avoid disturbances from splashing dust, the buckets were placed 50 cm above the ground. The water from each collector was stored in polypropylene bottles (20 mL each) previously washed with deionized water to ensure that the subsamples were not contaminated. All collectors were cleaned before each rainfall event. The samples were promptly brought back to the laboratory and stored at −20 °C.
Throughfall: We measured the throughfall and collected samples using the same instruments and methods as for rainfall. Twelve additional collectors were placed across the plot randomly. The pretreatment of the samples was as same as for rainfall.
Stemflow: We measured the stemflow from five dominant tree species. According to the average DBH, we selected three trees for each tree species and fifteen trees in total. Stemflow was collected using plastic tubing with a 30 mm inner diameter (Figure 1a). The top part of the tube was cut in half and fixed around the trunk at a height of 1.2 m above the ground with stainless steel thumbtacks and then sealed with a neutral silicone sealant [35]. The bottom part of the plastic tubing was put into a collection box with a rain gauge in it, and the stemflow in the collection box was drawn into a sampling bag with a pipe. The pretreatment of the samples was as same as for the rainfall and throughfall.
Soil samples: We collected soil samples from beneath 15 trees similar to the sample trees used for collecting stemflow. Soil samples were collected using a drill at four depths of 0–10 cm, 10–20 cm, 20–30 cm, and 30–40 cm underground and at locations of 0 cm, 50 cm, 100 cm, 150 cm, and 200 cm from the stem in four orthogonal directions. Four soil samples, each taken at the same distance and depth in four directions, were mixed to create one composite sample. And a total of 20 composite soil samples were collected under each sample tree. The soil samples were tabbed and brought back to the laboratory for air-drying and later use.
Bark measurement: We collected 15 cm × 4 cm bark samples (the edge was deep to the xylic part) on a sunny day after a week without rain. In the laboratory, we measured the water retention capacity and leachability of the nutrient elements of the bark. To determine the bark’s water retention capacity, the bark was fixed at an angle of 45 degrees, and water was uniformly dropped vertically at a rate of 1 mL min−1. The time taken for the first drop of water to flow out of the bark was recorded (Figure 1b). To determine the leachability of nutrient elements, different bark samples were soaked with fresh rainwater, and the total dissolved solids (TDSs), which reflects the amounts of dissolved matter in water in ppm, were measured every hour until the measured values were stable (Figure 1c).

2.3. pH and Nutrient Concentration Analysis of Collected Samples

Three raw rainfall samples and fifteen stemflow samples were collected after each selected rainfall event. Considering both workload and sample representativeness, we randomly collected 4 samples from the 12 throughfall collectors each time. In total, 220 water samples were used for chemical analysis.
We measured the pH and nutrient concentrations of the collected water samples. pH was measured on site using a pH meter (PB-10, Sartorius, Göttingen, Germany). Water samples were filtered through cellulose acetate filter (pore size 0.45 μm) and divided into two parts. One part was used to directly measure the concentrations of NO3, SO42−, Cl, and F using an ion chromatograph (ICS-5000, Thermo Corp., Waltham, MA, USA). The other part was first acidified with nitric acid, and then used to measure the concentrations of K+, Ca2+, Na+, and Mg2+ using inductively coupled plasma optical emission spectroscopy (ICP-OES 5100, Agilent, Santa Clara, CA, USA).
We determined the soil pH using the following method. After air-drying, the soil samples were first passed through a mesh sieve with a 2 mm aperture, then 10 g (accurate to 0.01 g) of the sample was put into a 50 mL beaker, to which 25 mL of pure water without CO2 was added. The solution was stirred with a mixer for 1 min to make sure the soil particles were fully dispersed. The solution was allowed to stand for 30 min, and then a pH meter (the same model as above) was used to measure pH.

2.4. Data Analysis

The average values shown on the rain gauges for rainfall or throughfall observation were taken as the measure of stand rainfall or throughfall depth. In order to reveal the rainfall redistribution pattern, we first upscaled the tree-level stemflow to the stand level using the following Equation (1) [36,37]:
S F = i = 1 n m · V i A · 10 3
where SF is the stand stemflow depth (mm), m is the number of trees belonging to a certain tree species, Vi is the average stemflow volume (mL) collected from a certain species, A is the area of the study plot (m2), and n is the number of tree species (n = 5).
To quantify the nutrient inputs from stemflow, throughfall, and rainfall, we determined the volume-weighted means per event E, calculated using Equation (2) [3,37]:
C = n = 1 i C i E · V i , E n = 1 i V i , E
where C represents the mean concentration of a certain nutrient (mg L−1), Ci,E represents the nutrient concentration of the water sample in the collector i (mg L−1), and Vi,E represents the amount of water in collector i after rainfall event E (mm). Then, the input of a certain nutrient was computed using the following Equation (3) [37]:
I = C · V 100
where I is the nutrient input from a rainfall event (kg ha−1), C is the mean nutrient concentration in water samples (mg L−1), and V is the total amount of water sampled (mm).
The total wet input was measured as the sum of the solutes in the stemflow and throughfall. The canopy exchange effect was measured as the difference between total wet input and precipitation deposition, which was estimated by Equation (4) [3,38]:
I N = I T + I S I P
where IN is the canopy exchange effect (kg ha−1), IT is the throughfall deposition (kg ha−1), Is is the stemflow deposition (kg ha−1), and IP is the precipitation deposition (kg ha−1).

2.5. Statistical Analysis

We used one-way analysis of variance (ANOVA) to compare the differences in nutrient concentrations between the rainfall, throughfall, and stemflow of different tree species. Since the nutrient concentration data did not meet the normal distribution, we transformed the data using the lg10 function to make them roughly meet this requirement. Additionally, we used linear regression analysis to test the correlations between throughfall, rainfall, stemflow, and rainfall. All statistical analyses were performed using IBM SPSS Statistics 26 (IBM, Armonk, NY, USA).

3. Results

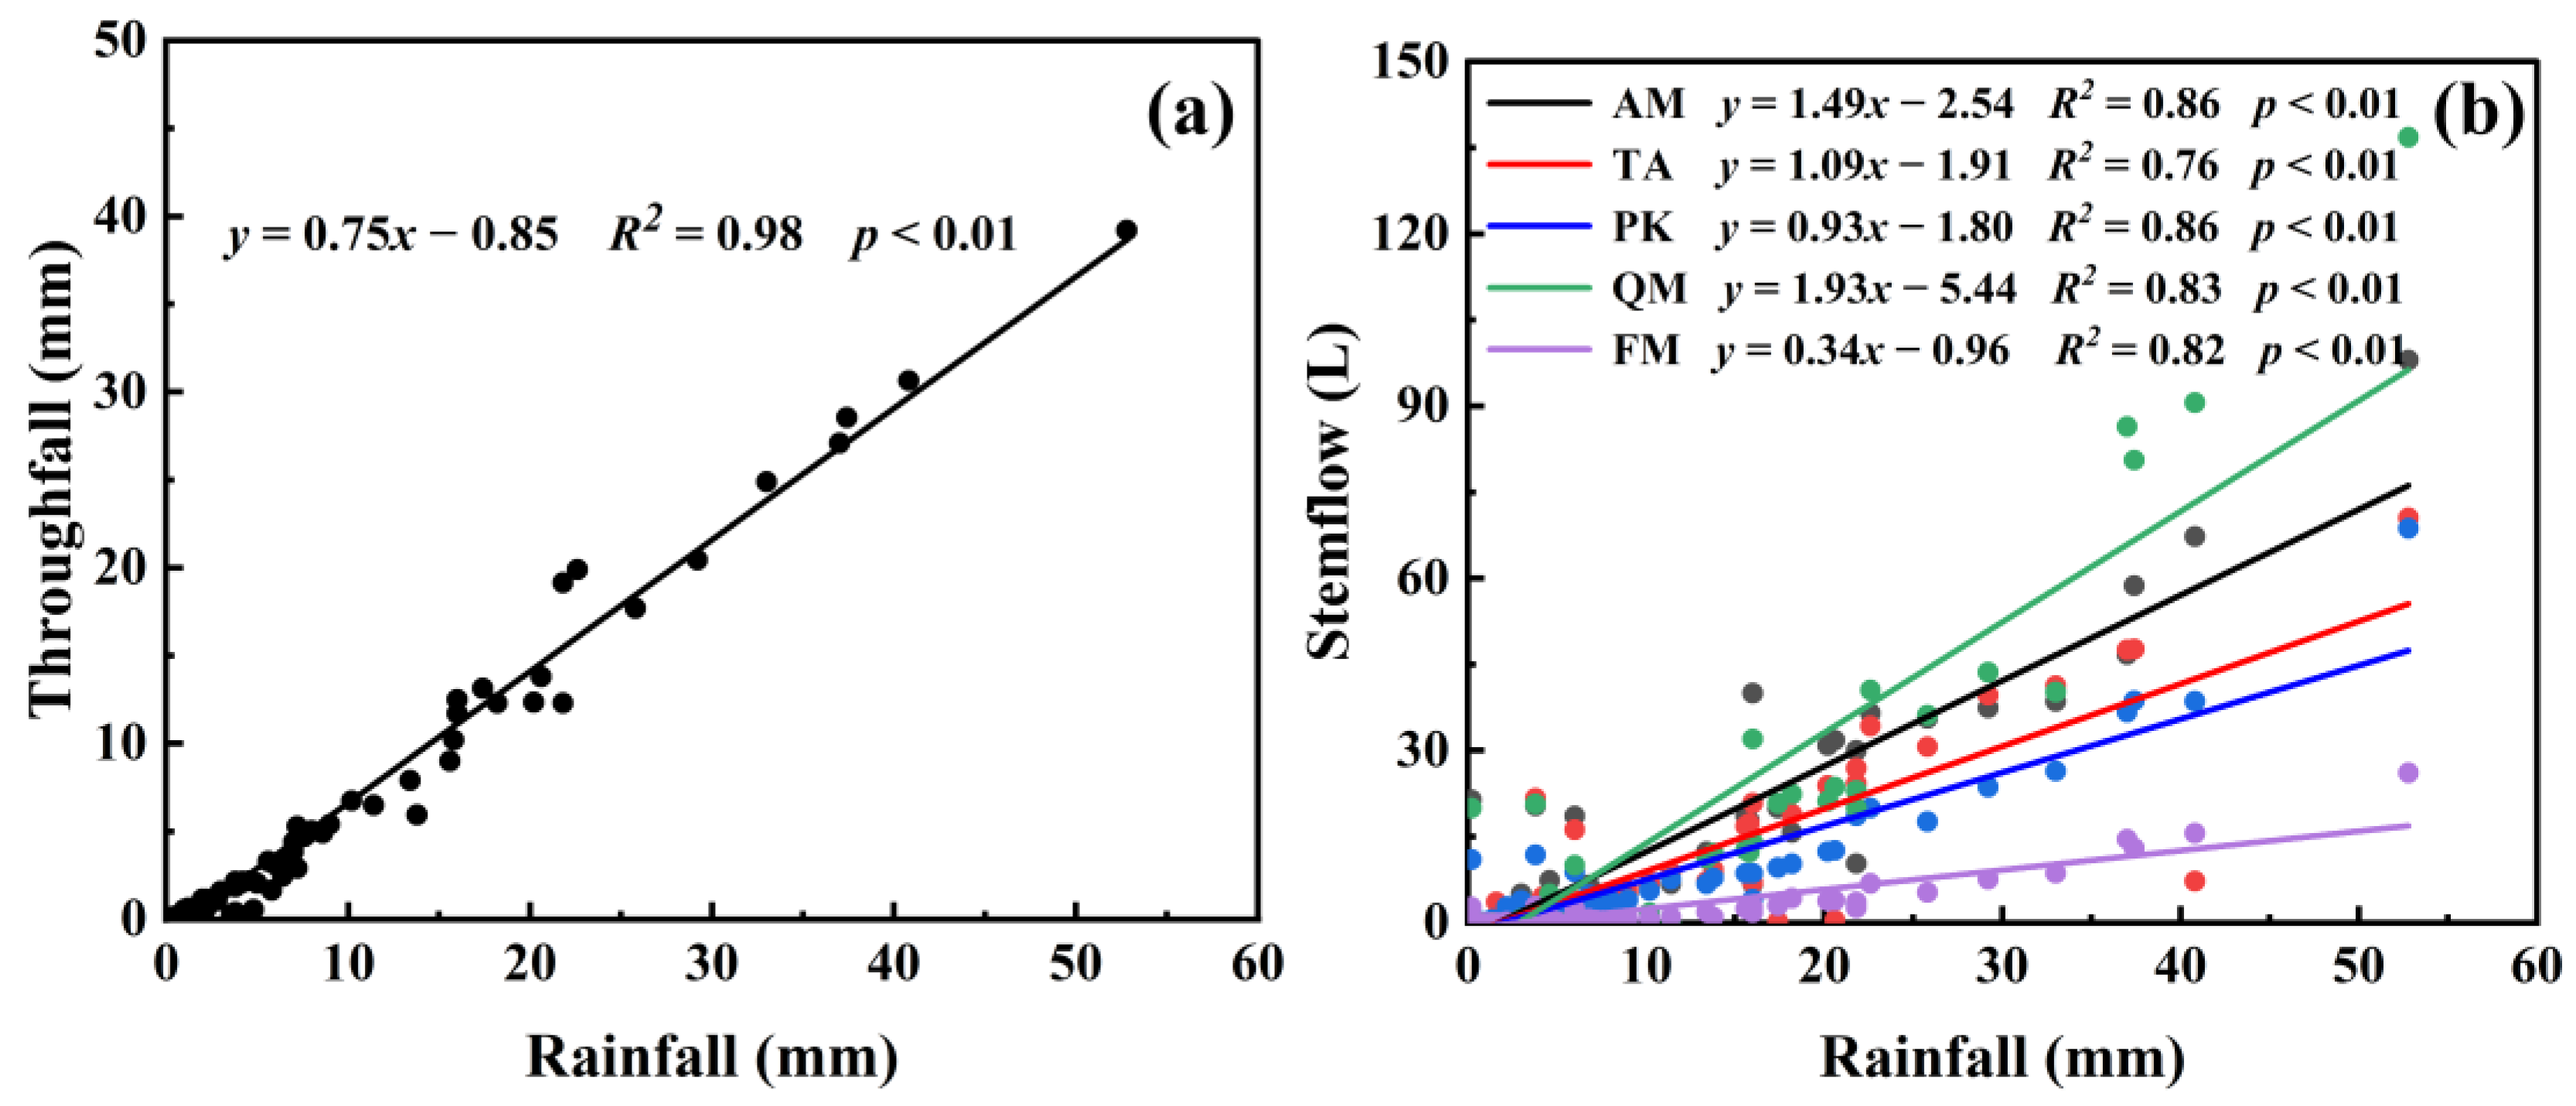
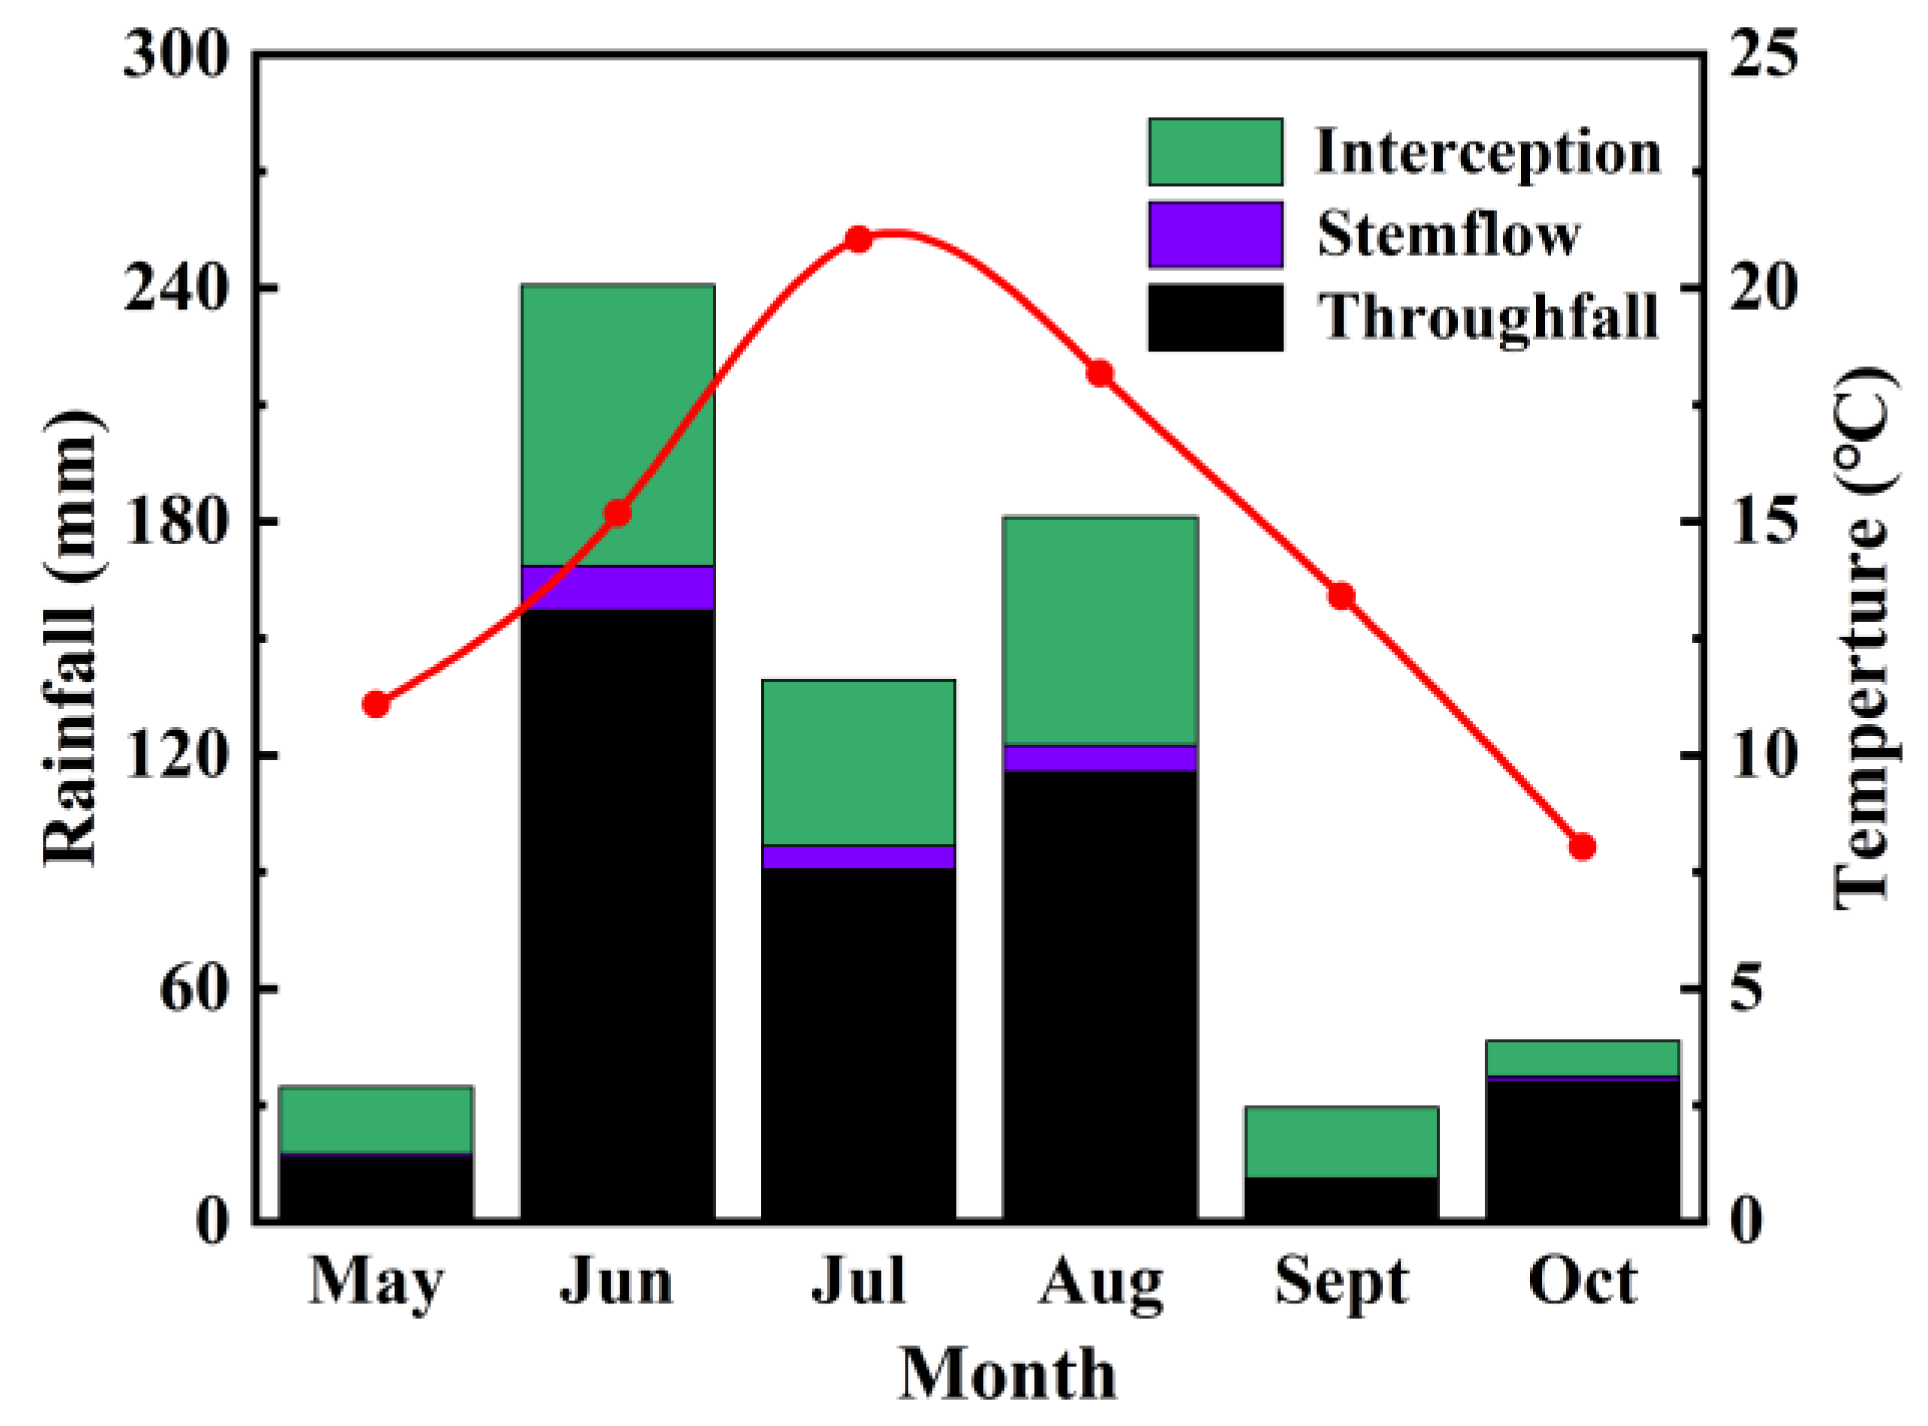
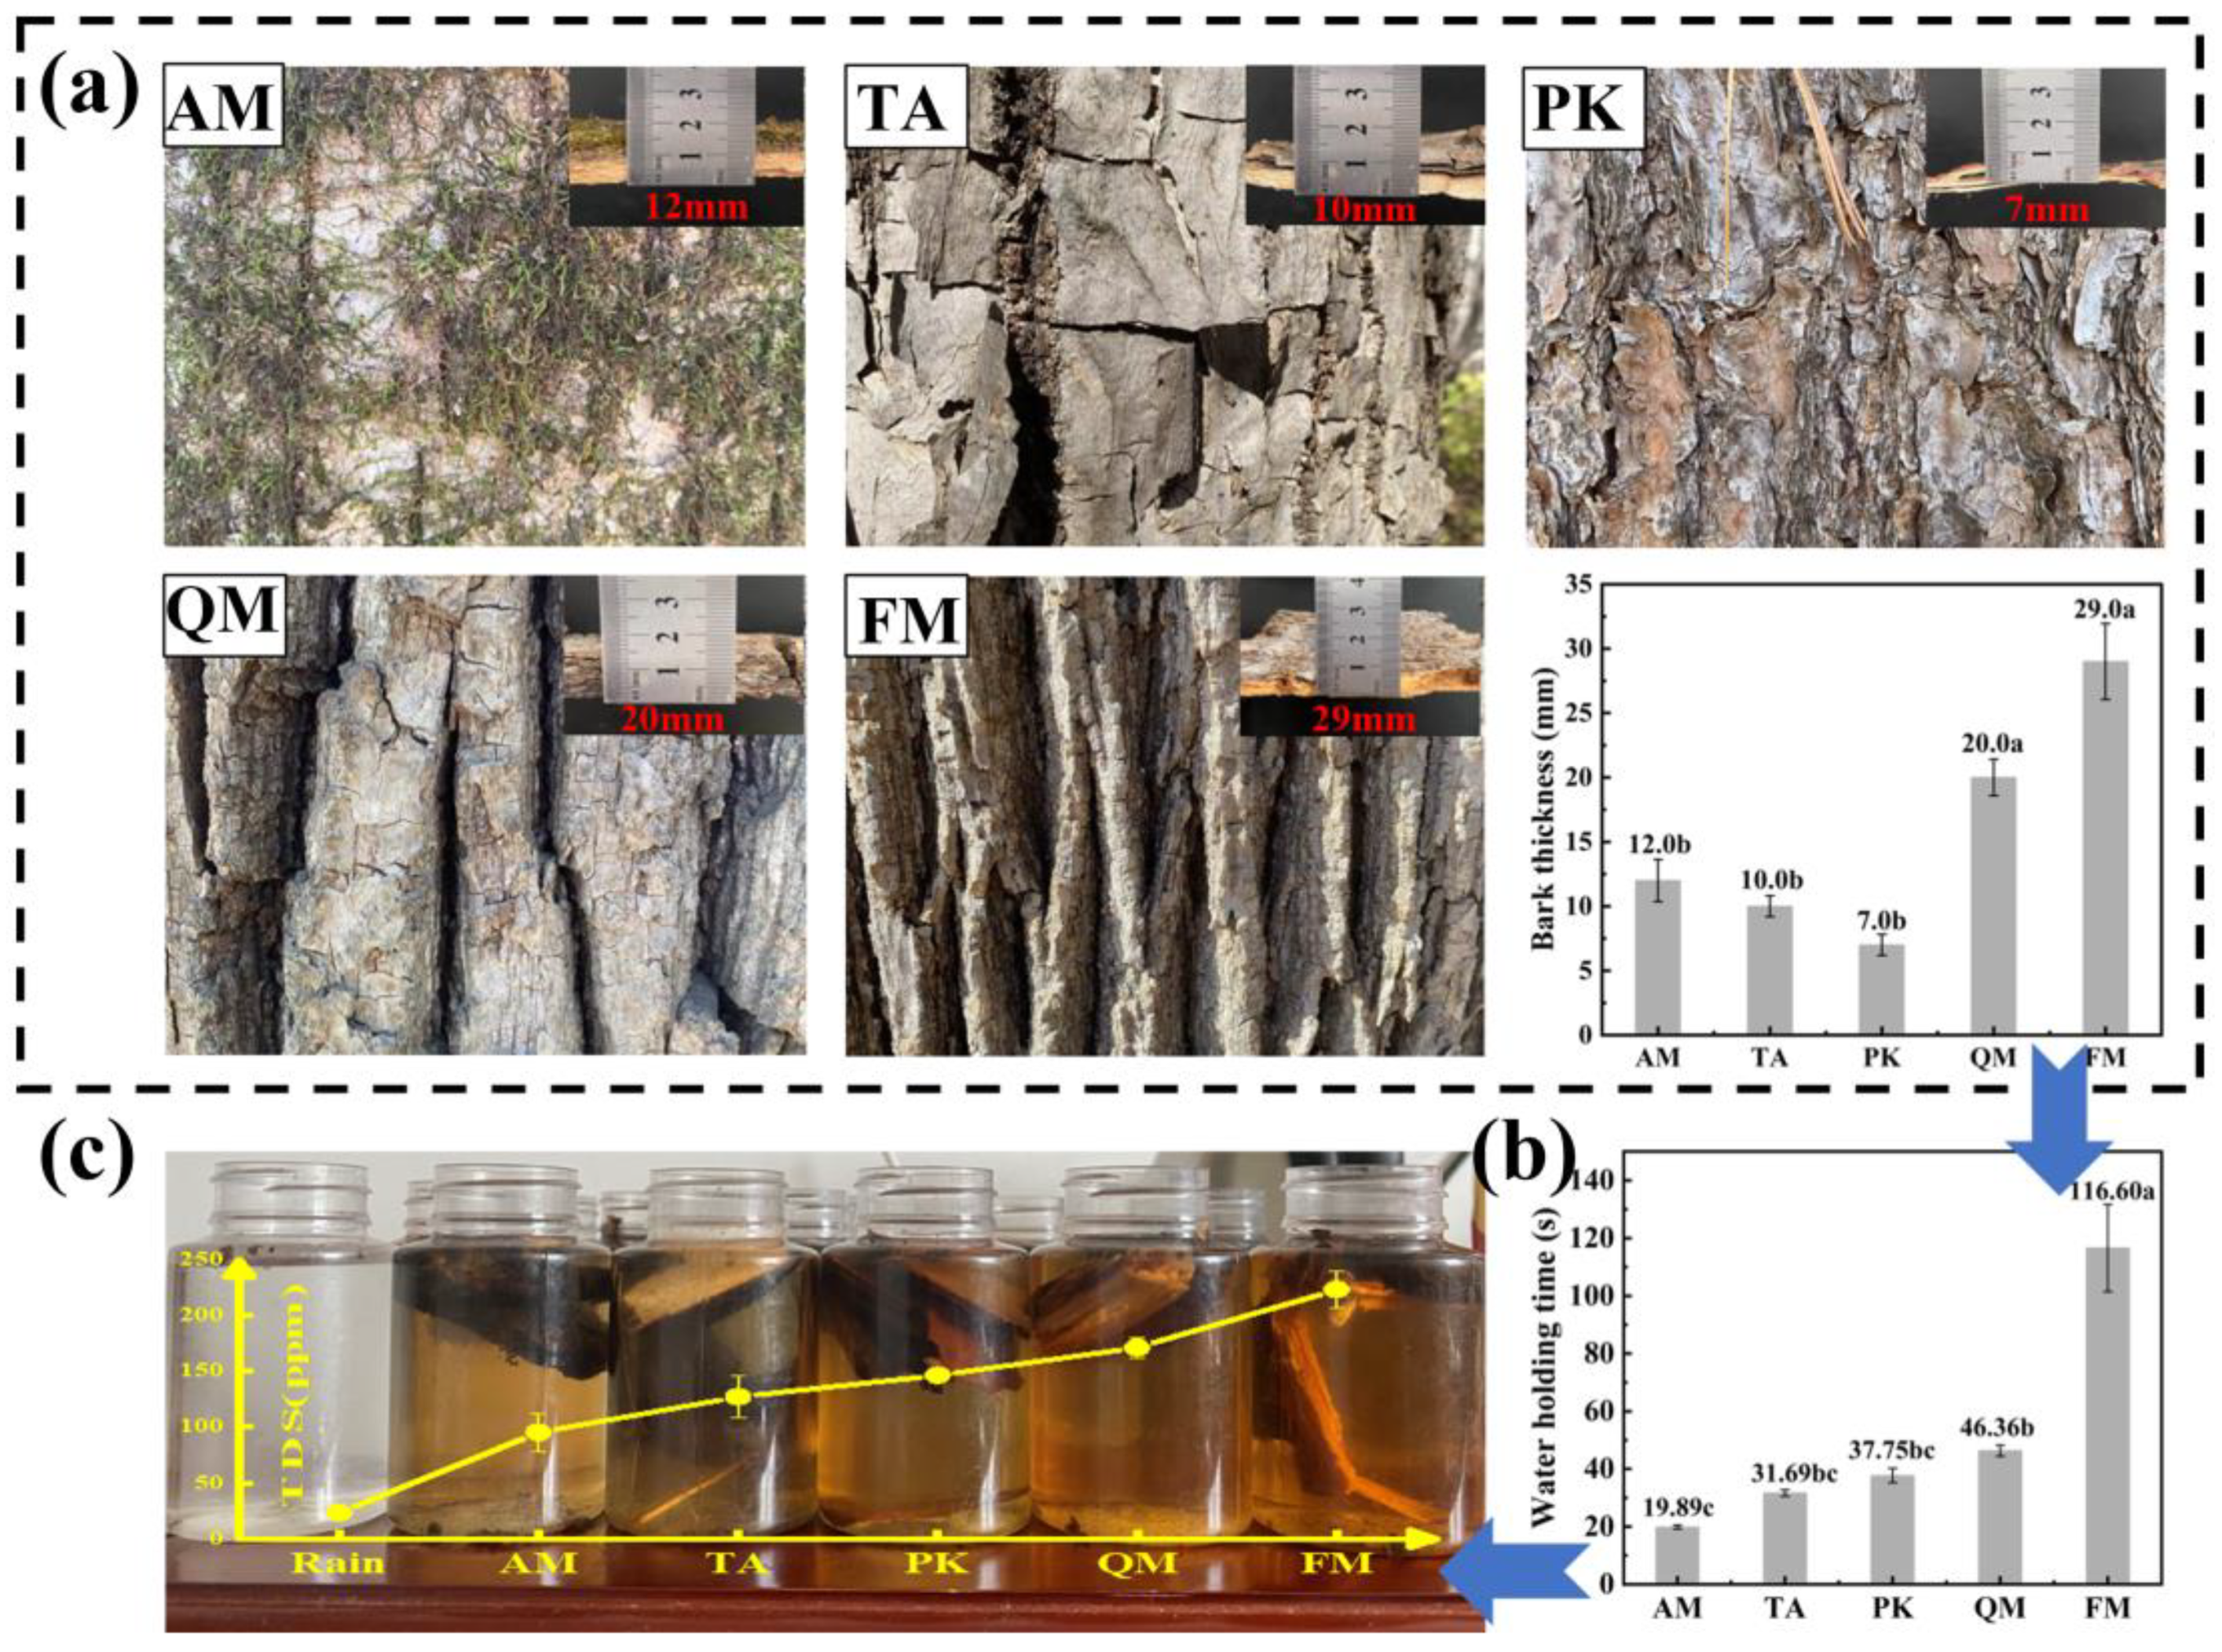
3.1. Rainfall Redistribution

The total precipitation during the 2021 growing season (1 May to 31 October) was 672.2 mm. It was distributed unevenly, with the highest and lowest amounts being 240.8 and 29.40 mm, occurring in July and September, respectively. Rainfall mainly occurred in June, July, and August, accounting for 83.52% of the total precipitation during the study period. Throughfall accounted for the largest portion of precipitation (the total amount was 427.45 mm during the observation period), representing 63.59% of the total precipitation. Interception was the second largest rainfall fraction with a total amount of 218.12 mm, accounting for 32.45% of the total precipitation. The yield of stemflow was small, at 26.63 mm, which accounted for only 3.96% of the total precipitation (Figure 2).
Tree species significantly affected the rain distribution. The yields of throughfall and stemflow were generally closely related to rainfall. There was a very significant linear positive correlation between throughfall or stemflow and rainfall (p < 0.01), where throughfall (mm) and rainfall (mm), in particular, had a good fitting result (R2 = 0.98). According to the fitting equation, throughfall started when rainfall was greater than 1.13 mm (Figure 3a). There was a difference in the coefficient of determination between the stemflow (L) of different tree species and rainfall (0.76 < R2 < 0.86). The fitting equation showed that the QM species had the most difficulty generating stemflow, but the large slope of the fitted curve showed that once the rainfall exceeded a certain threshold, QM had the largest stemflow. On the contrary, FM began to produce stemflow at a smaller rainfall amount, but the slope of its fitting equation was the smallest, indicating that under the same rainfall conditions, it had the smallest stemflow amount (Figure 3b). These differences in rainfall partitioning exerted a profound effect on nutrient redistribution.

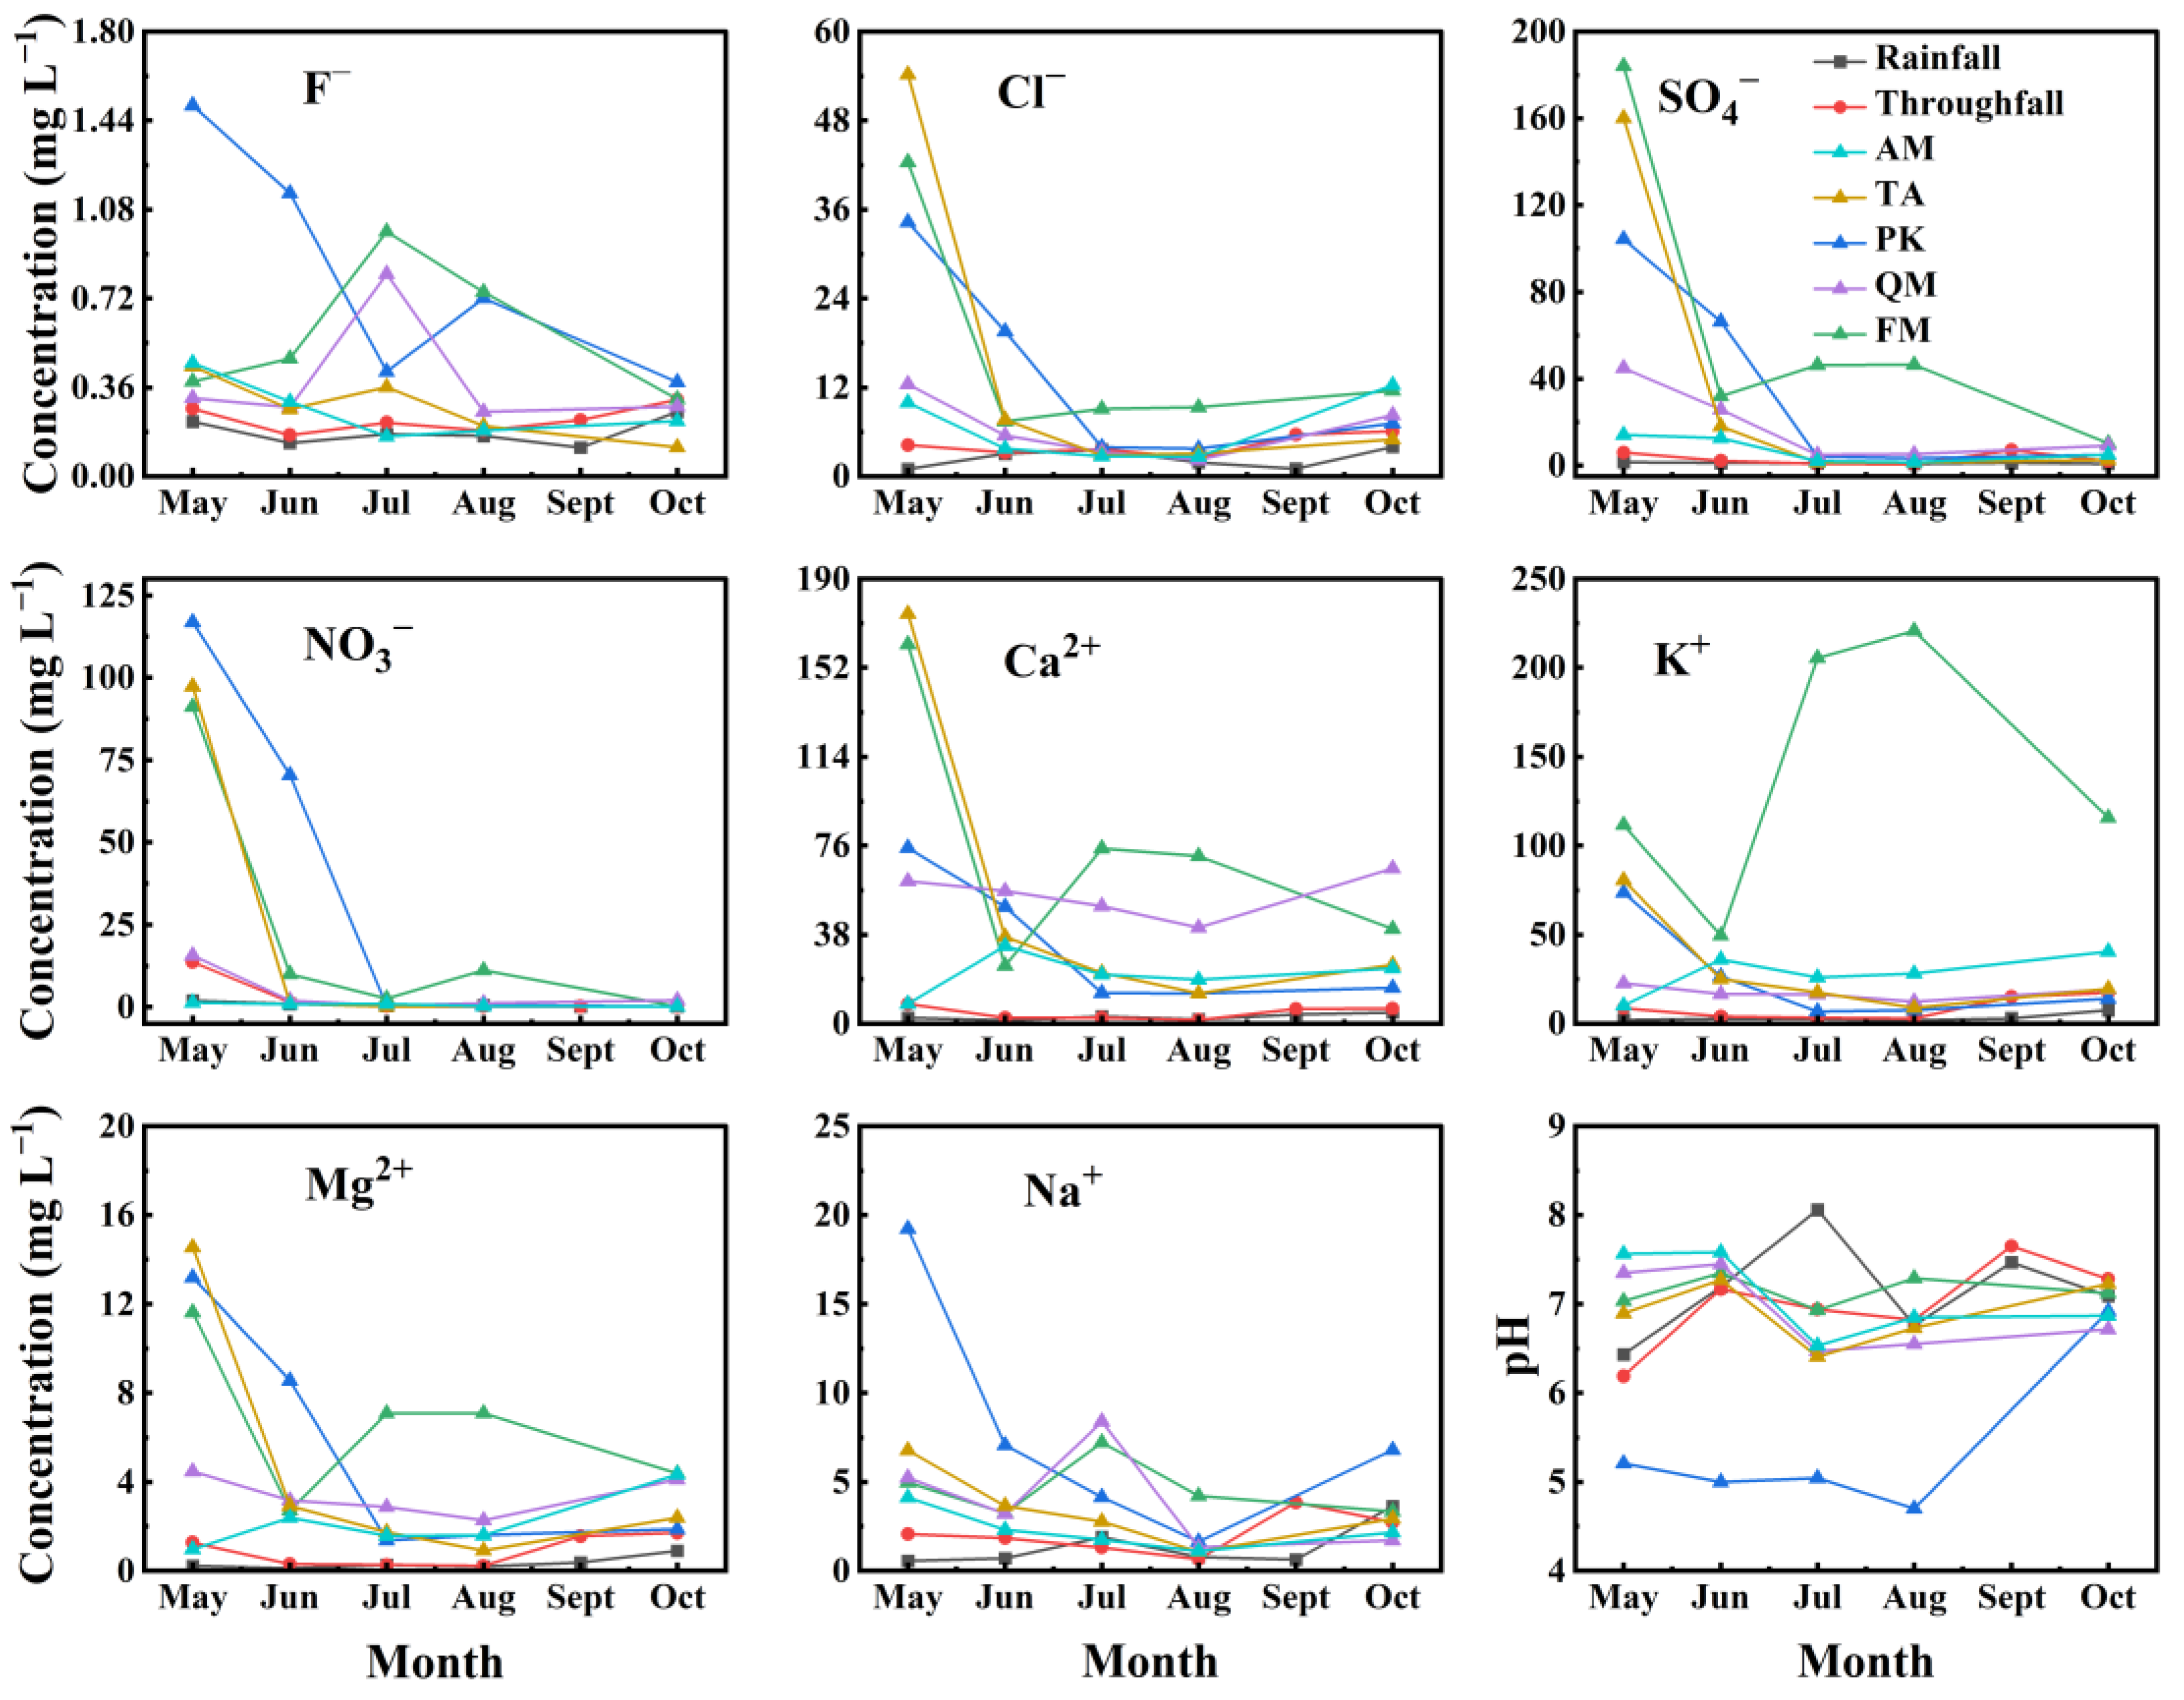
3.2. Variation in Nutrient Concentration across Different Tree Species

Most of the nutrients were more concentrated in throughfall and stemflow, but there was no significant difference between throughfall and rainfall (p > 0.05). The nutrient concentrations in stemflow were usually higher than those in rainfall and throughfall (except NO3 in AM stemflow, which was more concentrated in throughfall), and there was a significant effect of the tree species on nutrient concentrations. The stemflow of FM was generally enriched with more nutrients, and the concentrations of SO42− and K+ in the stemflow of this species were significantly higher than those of the other four tree species (Table 2, p < 0.05). The concentrations of nutrients in the stemflow of each species were 1.32–53.96 times higher than the concentrations in rainfall, with the greatest variation being for K+ in the stemflow of FM, whereas the concentration of NO3 in the stemflow of AM was only 1.32 times that of the rainfall.
This diversity was influenced by the bark structure. The prolonged retention of rainfall within the canopy resulted in increased nutrient leaching, consequently elevating the concentration of nutrients in the stemflow. Figure 4a reflects the surface structure of bark samples from different species. FM and QM exhibited rougher barks than the other tree species. Additionally, FM had the thickest bark, allowing it to retain stemflow for a longer duration. In the experiments, to determine the water holding time of the bark samples, we discovered that FM exhibited a significantly longer water retention time compared to the other tree species (Figure 4b), thereby confirming our earlier hypothesis. The leaching of nutrient elements from barks varied among different tree species. As illustrated in Figure 4c, FM had the highest TDS value, indicating that more nutrients can be leached from the bark of this species. This is also a contributing factor to the elevated nutrient concentrations observed in its stemflow.

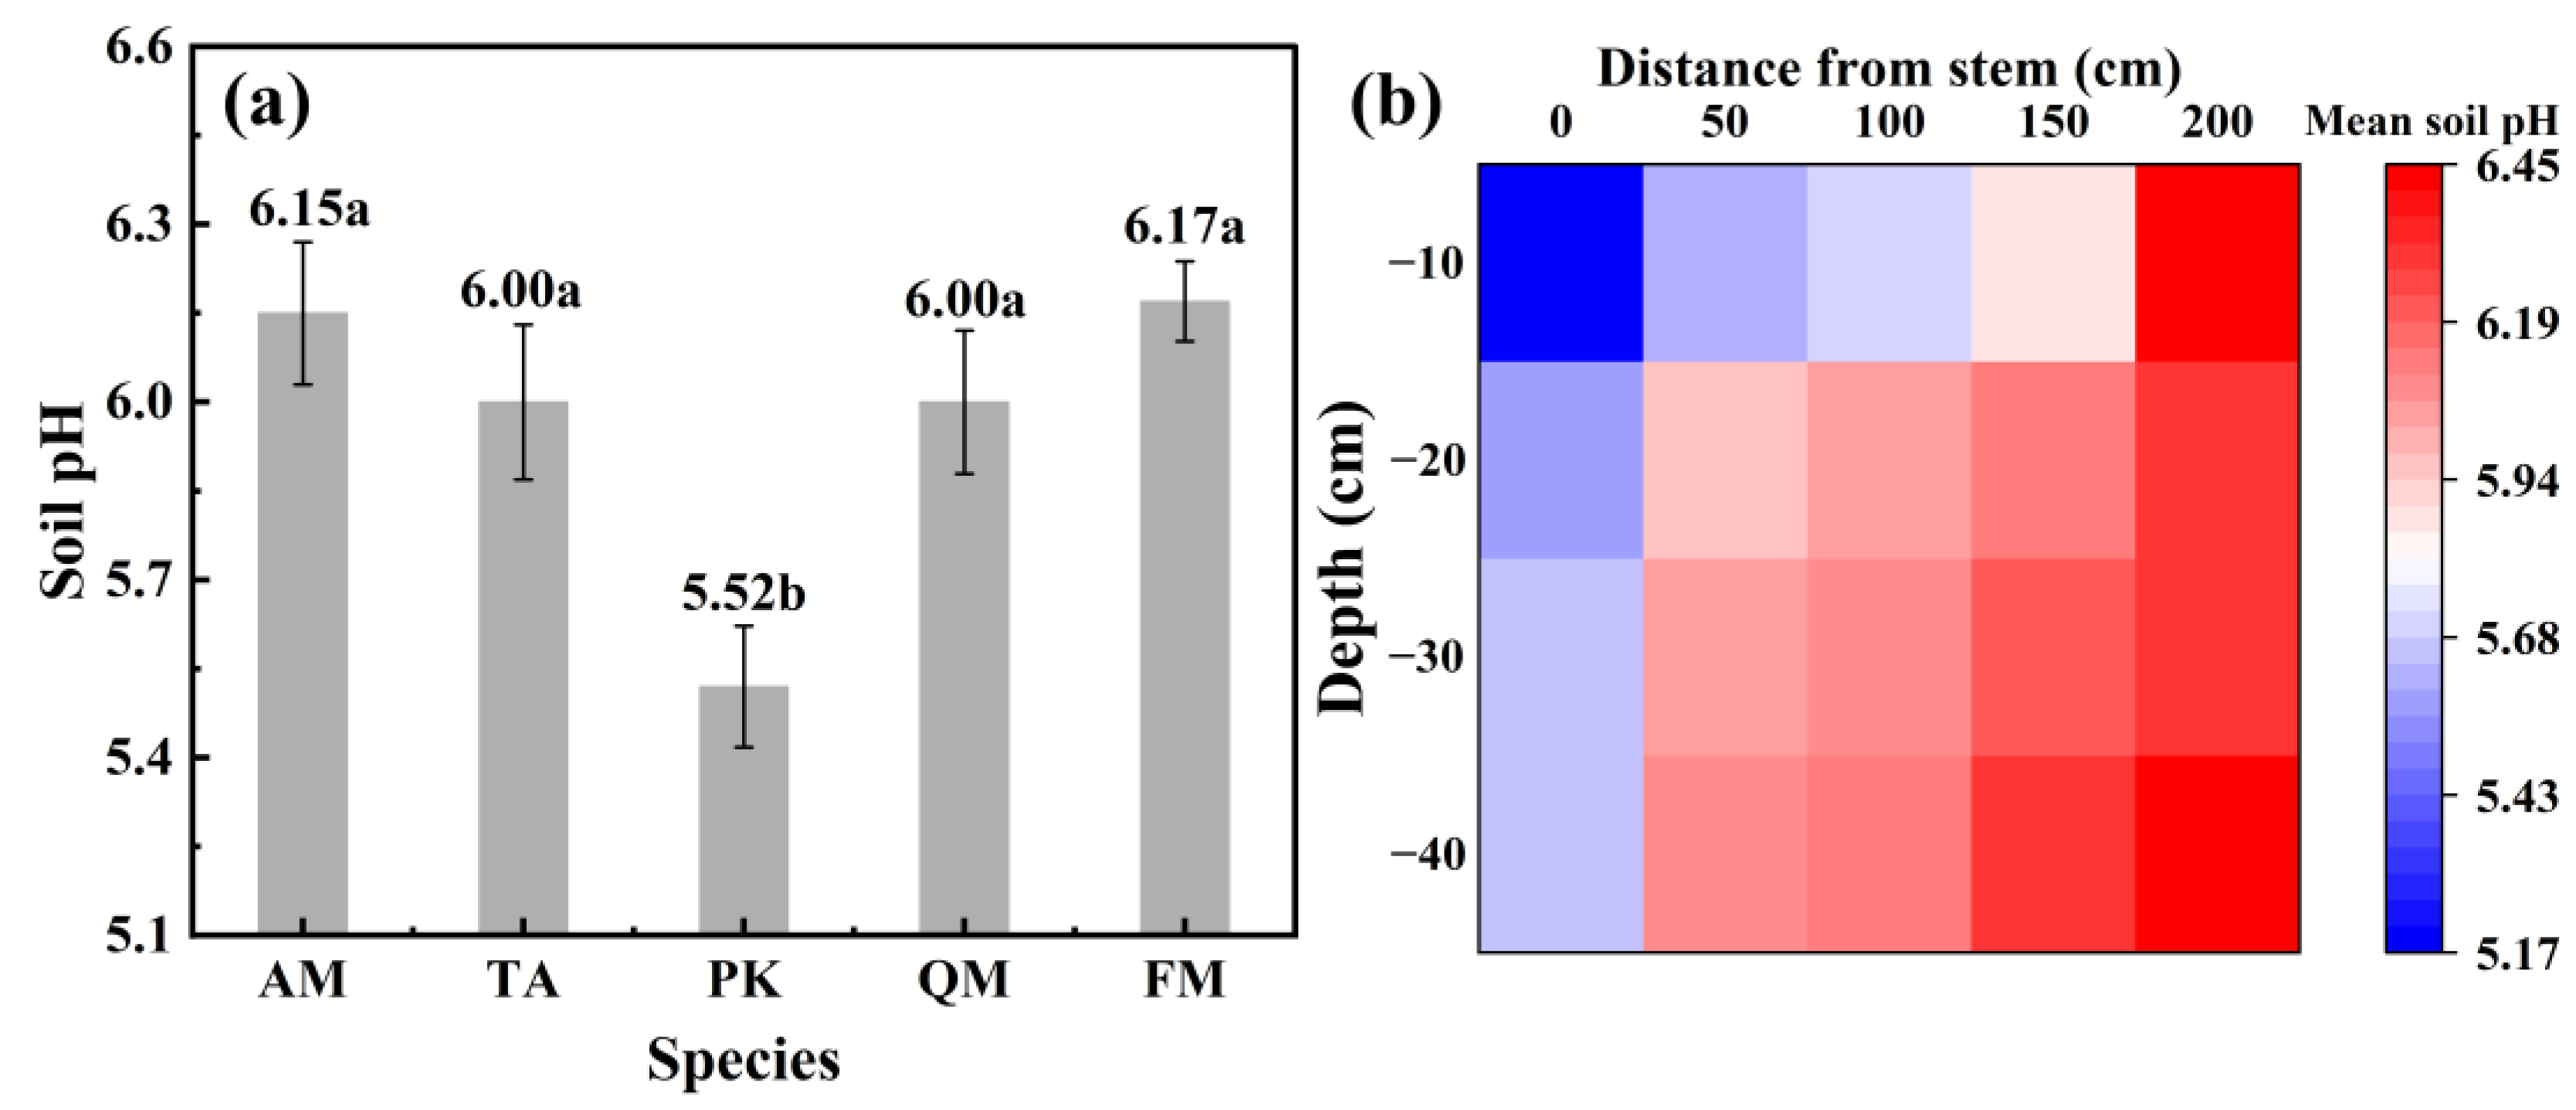
3.3. The Impact of Stemflow on Soil pH and Temporal Dynamics of Water Chemistry

The pH of throughfall was slightly lower than that of rainfall, but there was no significant difference (p > 0.05). Meanwhile, the stemflow of PK was obviously acidified, and the pH was significantly lower than that of the rainfall, throughfall, and stemflow from the other four tree species (p < 0.05). The dramatically low pH of the stemflow in this species would profoundly change the soil microenvironment around its stem. We found that the acidified stemflow significantly reduced the pH of the soil surrounding the PK trees (Figure 5a). This acidification effect weakened with the increase in distance from the stem and the increase in depth from the surface (Figure 5b).
We observed that the concentration of nutrients in stemflow varied over time. The nutrient concentrations of most elements were high in the early growing season, then decreased over time and gradually stabilized at a low level. However, there was a peak in nutrient concentrations (especially Ca2+, K+, and Mg2+) in the stemflow of FM in the middle of the growing season. In contrast to the stemflow, the nutrient concentrations in rainfall and throughfall exhibited no significant temporal dynamics and remained constant (Figure 6).

3.4. Nutrient Fluxes through Different Water Input Pathways

The nutrient fluxes were affected by the combination of rainfall partitioning and changes in chemical composition. Table 3 demonstrates the amounts of different nutrient inputs through rainfall, throughfall, and stemflow. It can be observed that the nutrient input through rainfall and throughfall was substantial during the observation period, with a total of 71.52 kg ha−1 and 67.26 kg ha−1, respectively. Among these, the highest nutrient input was K+. The nutrient input through stemflow was comparatively limited, totaling 25.04 kg ha−1. The total wet input was calculated as the sum of the throughfall and stemflow nutrient inputs, with the canopy exchange effect reflecting the impact of the canopy on nutrient inputs. The total wet input was 92.30 kg ha−1, and most nutrients were leached out after the rainfall passed through the canopy (21.86 kg ha−1 in total), except for F and Na+ (−1.07 kg ha−1). The nutrient with the largest positive canopy exchange effect was K+, which increased by 10.79 kg ha−1 during the study period, and the nutrient with the largest negative canopy effect was Na+, which decreased by 0.92 kg ha−1 (Table 3).
The nutrient inputs from stemflow can significantly modify the composition of the soil around the tree trunks. In this study, it was observed that nutrient inputs from stemflow exhibited significant variations among tree species. To facilitate a more comprehensive comparison of these differences, we computed the stemflow nutrient fluxes for an individual tree belonging to a specific species (Table 4). As the only coniferous tree, PK contributed the largest flux of acid anions (31.26 g tree−1), whereas QM contributed the largest flux of cations (57.16 g tree−1). QM had a significantly higher Ca2+ input (39.75 g tree−1) than other tree species (p < 0.05), while FM had a significantly lower input (7.55 g tree−1, p < 0.05). The K+ input of AM and FM was significantly higher than that of other tree species (p < 0.05), with fluxes of 22.63 g tree−1 and 20.82 g tree−1, respectively. For both TA and QM, the greatest nutrient input was observed to be Ca2+, with values of 16.68 g tree−1 and 39.75 g tree−1, respectively.

4. Discussion

4.1. Morphological Characteristics of Trees Affect Nutrient Concentrations in Stemflow

Our research clearly indicates that the concentrations of most nutrient elements were significantly enriched in stemflow, but only slightly enriched in throughfall compared to the raw rainfall. This phenomenon is consistent with previous findings [39,40].
Stemflow nutrient concentrations varied between tree species; such differences were mainly related to the canopy morphology, characterized by DBH, branch angle, and bark roughness [41,42]. Trees with a large DBH generally have larger tree heights and bark areas, and they allow stemflow to move up the trunk for a longer time, increasing the leaching of nutrient elements and in turn producing higher stemflow concentrations [43]. The results of this study were generally consistent with this pattern, but AM, which had the smallest body size (in terms of DBH and height), had relatively large stemflow production. Moreover, the concentrations of K+ and Ca2+ in the AM stemflow showed small differences to those of PK, TA, and QM, which had much larger body sizes. This suggests that stemflow concentration was not only related to DBH, but may be also related to physiological differences [37]. For example, secondary metabolites produced by trees can dissolve in stemflow, thus largely influencing the chemical composition.
Many previous studies also found an obvious rainfall acidification effect caused by coniferous canopies [44,45]. In this study, the pH of throughfall decreased slightly compared to raw rainwater, whereas the pH of the stemflow from PK was significantly lower than in the other trees. This may be attributed to the rosin secreted by PK, which is a kind of acidic compound that can be dissolved in stemflow and thus decrease the pH. Based on this, coniferous species should be carefully selected as afforestation trees in acidified soil zones to avoid the acidification of soil and acidic runoff in the watershed.
In addition, the bark of trees can also affect nutrient concentrations. Firstly, the roughness of the bark affects the contact time with stemflow. Rainwater passes through rough bark less easily than smooth bark. Thus, rough bark has a longer contact time with stemflow compared to the smooth bark, enriching it with more nutrient elements [2,46]. Similar results were also obtained in this study (Figure 4b). The chemical composition of bark and its leachability also had a huge impact on the nutrient concentration of stemflow [47]. In this study, QM and FM trees leached more elements, indicating a larger ion exchange with rainwater (Figure 4c). These differences among species ultimately led to the variability in stemflow nutrient concentrations among tree species.

4.2. Throughfall and Stemflow Fluxes Vary between Different Regions and Forest Types

Throughfall and stemflow are important pathways for nutrient inputs in forest cover areas and are essential to forest ecosystems [38,48]. These pathways have been affected by climate change in different areas and forest types. In Table 5, we summarize numerous studies conducted in different climatic zones, including the temperate, subtropical, and tropical zones. Cold climate zones were not included because of the limited number of studies in these regions. Most studies calculated the nutrient fluxes of Cl, SO42−, NO3, Ca2+, K+, Mg2+, and Na+ through stemflow and throughfall, and the results varied across studies [37,46,49,50,51]. Overall, the nutrients found in the largest amounts were SO42−, NO3, Ca2+, and K+. This study’s findings are similar to some of the previous studies’ in that the nutrients with the highest inputs were Ca2+ and K+ [37,46,49,52]; however, other studies have noted that SO42− and NO3 were the major nutrients [50,51].
Significant variations in total nutrient inputs can be observed between different climatic zones. Generally, the research indicates higher levels of nutrient inputs in subtropical regions compared to both temperate and tropical zones. Moreover, minimal disparities are observed between the temperate and subtropical zones [37,46,49,53]. The observed variations are attributed to distinct environmental conditions. In temperate regions, limited annual rainfall constrains nutrient inputs [50,53]. Conversely, the abundant rainfall in the tropics leads to nutrient dilution in both throughfall and stemflow [46,49,52]. In contrast, subtropical regions achieve the highest nutrient inputs through a blend of moderate rainfall and optimal nutrient concentrations [37,51].
Forest types can also significantly influence nutrient inputs [54,55]. It has been observed that evergreen coniferous forests have greater nutrient inputs than broadleaf forests [50]. This phenomenon could be attributed to the enhanced exchange of ions between the abundance of turpentine in coniferous species and rainwater, resulting in higher nutrient levels in both throughfall and stemflow [50]. Primary forests are generally acknowledged to exhibit higher nutrient inputs compared to secondary forests [56]. Nutrient inputs measured in this study surpassed those in secondary forests within the same climatic zone [50,53], with similar trends observed in other climatic zones [46,49]. This is because primary forests typically possess a more intricate canopy structure, exerting a greater influence on nutrient inputs.
Climate change-induced alterations in precipitation patterns have led to reduced rainfall in arid regions and increased precipitation in humid areas [57], which poses a threat to the nutrient inputs from rainfall in temperate and tropical regions. The degradation of primary forests as a result of overharvesting tends to simplify the structures of forests, making the canopy less effective in nutrient modification. All these alterations significantly impact nutrient inputs, consequently modifying nutrient cycling patterns. This study was conducted to complement the investigation of the influence of the temperate forest canopy on nutrient inputs.

5. Conclusions

This study investigated the impact of the canopy on nutrient fluxes through rainfall partitioning in a mixed broadleaf and coniferous forest by measuring the variations in the amounts and concentrations of nutrients in the rainfall, throughfall, and stemflow of different tree species. Our results illustrated that the forest canopy significantly affected rainfall redistribution and nutrient content, and this impact varied largely between tree species due to the differences in their canopy structures and bark morphology. In general, throughfall and stemflow had more enriched nutrient and chemical elements than rainfall, especially the stemflow, which had the greatest enrichment. Specially, FM yielded less stemflow, but the nutrient contents were much higher in this species than in others because of its thicker and rougher bark. QM generated more stemflow because of its funnel shape, with its wide leaves intercepting more rainfall.
After rainfall passed through the canopy, most nutrient fluxes increased, except for F and Na+, and the stemflow deposition of nutrients was different between species. The acidic secretion produced by PK acidified the stemflow, leading to a higher input of acid anions in its stemflow, whereas QM contributed the largest flux of cations. Such variation may change the soil microenvironment (including, but not limited to, soil pH) around the tree. Based on this study, coniferous tree species should be carefully selected for afforestation in areas heavily affected by soil acidification.
This study only briefly explores the differences in stemflow among tree species and their impact on the soil beneath the canopy. More in-depth research will be needed in the future to reveal the underlying mechanisms. And there is a lack of relevant research in cold climate zones currently. Conducting more related work in these areas may help us to better understand and protect the forest ecosystems in these regions.

Author Contributions

Conceptualization, J.Y., A.W. and J.W.; Funding Acquisition, L.S. and J.W.; Investigation, J.Y. and G.D.; Methodology, J.Y.; Project Administration, A.W. and J.W.; Resources, A.W. and G.D.; Supervision, A.W.; Validation, J.W.; Visualization, J.Y.; Writing—Original Draft, J.Y.; Writing—Review and Editing, L.S., Y.L., Y.Z., W.F. and J.W. All authors have read and agreed to the published version of the manuscript.

Funding

This research was funded by the National Natural Science Foundation of China, grant numbers 32271873 and 31971728, and the Natural Science Foundation of Liaoning Province, grant number 2023-MS-027.

Data Availability Statement

The data are available on request from the corresponding author.

Conflicts of Interest

The authors declare no conflicts of interest.

References

  1. Van Stan, J.T.; Ponette-Gonzalez, A.G.; Swanson, T.; Weathers, K.C. Throughfall and stemflow are major hydrologic highways for particulate traffic through tree canopies. Front. Ecol. Environ. 2021, 19, 404–410. [Google Scholar] [CrossRef]
  2. Parker, G.G. Throughfall and Stemflow in the Forest Nutrient Cycle. In Advances in Ecological Research; MacFadyen, A., Ford, E.D., Eds.; Academic Press: Cambridge, MA, USA, 1983; Volume 13, pp. 57–133. [Google Scholar] [CrossRef]
  3. Sun, X.C.; Zhang, Z.; Cao, Y.H.; Liu, L.; Hu, F.L.; Lu, X.Q. Canopy modification of base cations deposition in a subtropical broadleaved forest: Spatial characteristics, canopy budgets and acid neutralizing capacity. For. Ecol. Manag. 2021, 482, 118863. [Google Scholar] [CrossRef]
  4. Stubbins, A.; Guillemette, F.; Van Stan, J.T. Throughfall and Stemflow: The Crowning Headwaters of the Aquatic Carbon Cycle. In Precipitation Partitioning by Vegetation: A Global Synthesis; Van Stan, J.T., Gutmann, E., Friesen, J., Eds.; Springer: Cham, Switzerland, 2020; pp. 121–131. [Google Scholar] [CrossRef]
  5. Levia, D.F.; Keim, R.F.; Carlyle-Moses, D.E.; Frost, E.E. Throughfall and Stemflow in Wooded Ecosystems. In Forest Hydrology and Biogeochemistry: Synthesis of Past Research and Future Directions; Levia, D.F., Carlyle-Moses, D., Tanaka, T., Eds.; Springer: Dordrecht, The Netherlands, 2011; pp. 425–443. [Google Scholar] [CrossRef]
  6. Zhang, Y.F.; Yuan, C.; Chen, N.; Levia, D.F. Rainfall partitioning by vegetation in China: A quantitative synthesis. J. Hydrol. 2023, 617, 128946. [Google Scholar] [CrossRef]
  7. Yan, T.; Wang, Z.H.; Liao, C.G.; Xu, W.Y.; Wan, L. Experimental data on the adsorption of water by branches and leaves as affected by different the morphological characteristics of plants. Data Brief 2021, 34, 106689. [Google Scholar] [CrossRef] [PubMed]
  8. Yan, T.; Wang, Z.H.; Liao, C.G.; Xu, W.Y.; Wan, L. Effects of the morphological characteristics of plants on rainfall interception and kinetic energy. J. Hydrol. 2021, 592, 125807. [Google Scholar] [CrossRef]
  9. Scavotto, N.; Siegert, C.M.; Alexander, H.D.; Varner, J.M. Bark and crown morphology drive differences in rainwater distribution in an upland oak forest. For. Ecol. Manag. 2024, 553, 121642. [Google Scholar] [CrossRef]
  10. Zhang, Q.F.; Lv, X.Z.; Yu, X.X.; Ni, Y.X.; Ma, L.; Liu, Z.Q. Species and spatial differences in vegetation rainfall interception capacity: A synthesis and meta-analysis in China. Catena 2022, 213, 106223. [Google Scholar] [CrossRef]
  11. Grunicke, S.; Queck, R.; Bernhofer, C. Long-term investigation of forest canopy rainfall interception for a spruce stand. Agric. For. Meteorol. 2020, 292, 108125. [Google Scholar] [CrossRef]
  12. Zabret, K.; Sraj, M. How Characteristics of a Rainfall Event and the Meteorological Conditions Determine the Development of Stemflow: A Case Study of a Birch Tree. Front. For. Glob. Chang. 2021, 4, 663100. [Google Scholar] [CrossRef]
  13. Tonello, K.C.; Van Stan, J.T.; Rosa, A.G.; Balbinot, L.; Pereira, L.C.; Bramorski, J. Stemflow variability across tree stem and canopy traits in the Brazilian Cerrado. Agric. For. Meteorol. 2021, 308, 108551. [Google Scholar] [CrossRef]
  14. Yue, K.; De Frenne, P.; Fornara, D.A.; Van Meerbeek, K.; Li, W.; Peng, X.; Ni, X.; Peng, Y.; Wu, F.; Yang, Y.; et al. Global patterns and drivers of rainfall partitioning by trees and shrubs. Glob. Chang. Biol. 2021, 27, 3350–3357. [Google Scholar] [CrossRef] [PubMed]
  15. Staelens, J.; Houle, D.; De Schrijver, A.; Neirynck, J.; Verheyen, K. Calculating dry deposition and canopy exchange with the canopy budget model: Review of assumptions and application to two deciduous forests. Water Air Soil Pollut. 2008, 191, 149–169. [Google Scholar] [CrossRef]
  16. Hyder, P.W.; Fredrickson, E.L.; Estell, R.E.; Lucero, M.E. Transport of phenolic compounds from leaf surface of creosotebush and tarbush to soil surface by precipitation. J. Chem. Ecol. 2002, 28, 2475–2482. [Google Scholar] [CrossRef] [PubMed]
  17. Fan, H.B.; Hong, W. Estimation of dry deposition and canopy exchange in Chinese fir plantations. For. Ecol. Manag. 2001, 147, 99–107. [Google Scholar] [CrossRef]
  18. Matsumoto, K.; Ogawa, T.; Ishikawa, M.; Hirai, A.; Watanabe, Y.; Nakano, T. Organic and inorganic nitrogen deposition on the red pine forests at the northern foot of Mt. Fuji, Japan. Atmospheric Environ. 2020, 237, 117676. [Google Scholar] [CrossRef]
  19. Sheng, H.C.; Guo, N.; Ren, S.Y.; Zhang, J.W.; Ju, C.Y.; Cai, T.J. Hydrochemical fluxes in rainfall, throughfall, and stemflow in Pinus sylvestris var. mongolica plantation, northeast China. Glob. Nest J. 2021, 23, 333–339. [Google Scholar] [CrossRef]
  20. Dowtin, A.L.; Siegert, C.M.; Levia, D.F. Comparisons of flux-based stemflow enrichment ratios for two Quercus spp. within the megalopolis of the eastern USA. Urban Ecosyst. 2021, 24, 675–690. [Google Scholar] [CrossRef]
  21. Lima, M.T.; Urso-Guimarães, M.V.; Van Stan, J.T.; Tonello, K.C. Stemflow metazoan transport from common urban tree species (São Paulo, Brazil). Ecohydrology 2022, 16, 2517. [Google Scholar] [CrossRef]
  22. Guidone, M.; Gordon, D.A.; Van Stan, J.T. Living particulate fluxes in throughfall and stemflow during a pollen event. Biogeochemistry 2021, 153, 323–330. [Google Scholar] [CrossRef]
  23. Teachey, M.E.; Ottesen, E.A.; Pound, P.; Van Stan, J.T., II. Under the canopy: Disentangling the role of stemflow in shaping spatial patterns of soil microbial community structure underneath trees. Environ. Microbiol. 2022, 24, 4001–4012. [Google Scholar] [CrossRef]
  24. Metzger, J.C.; Filipzik, J.; Michalzik, B.; Hildebrandt, A. Stemflow Infiltration Hotspots Create Soil Microsites Near Tree Stems in an Unmanaged Mixed Beech Forest. Front. For. Glob. Chang. 2021, 4, 701293. [Google Scholar] [CrossRef]
  25. Yang, B.; Wang, R.; Xiao, H.; Cao, Q.Q.; Liu, T. Spatio-temporal variations of soil water content and salinity around individual Tamarix ramosissima in a semi-arid saline region of the upper Yellow River, Northwest China. J. Arid Environ. 2018, 10, 101–114. [Google Scholar] [CrossRef]
  26. Li, C.J.; Li, Y.; Ma, J. Spatial heterogeneity of soil chemical properties at fine scales induced by Haloxylon ammodendron (Chenopodiaceae) plants in a sandy desert. Ecol. Res. 2011, 26, 385–394. [Google Scholar] [CrossRef]
  27. Wang, H.F.; Cai, Y.; Yang, Q.; Gong, Y.M.; Lv, G.H. Factors that alter the relative importance of abiotic and biotic drivers on the fertile island in a desert-oasis ecotone. Sci. Total Environ. 2019, 697, 134096. [Google Scholar] [CrossRef]
  28. Whitford, W.G.; Anderson, J.; Rice, P.M. Stemflow contribution to the ‘fertile island’ effect in creosotebush, Larrea tridentata. J. Arid Environ. 1997, 35, 451–457. [Google Scholar] [CrossRef]
  29. Sheng, H.C.; Guo, N.; Ju, C.Y.; Cai, T.J. Variation of nutrient fluxes by rainfall redistribution processes in the forest canopy of an urban larch plantation in northeast China. J. For. Res. 2022, 33, 1259–1269. [Google Scholar] [CrossRef]
  30. Jana, P.; Dasgupta, S.; Todaria, N.P. Throughfall and stemflow nutrient flux in deodar and oak forests, Garhwal Himalaya, India. Water Supply 2021, 21, 1649–1656. [Google Scholar] [CrossRef]
  31. Luna-Robles, E.O.; Cantu-Silva, I.; Gonzalez-Rodriguez, H.; Marmolejo-Monsivais, J.G.; Yanez-Diaz, M.I.; Bejar-Pulido, S.J. Nutrient input via gross rainfall, throughfall and stemflow in scrubland species in northeastern Mexico. Rev. Chapingo Ser. Cienc. For. Ambient. 2019, 25, 235–251. [Google Scholar] [CrossRef]
  32. Duval, T.P. Rainfall partitioning through a mixed cedar swamp and associated C and N fluxes in Southern Ontario, Canada. Hydrol. Process. 2019, 33, 1510–1524. [Google Scholar] [CrossRef]
  33. Turtscher, S.; Grabner, M.; Berger, T.W. Reconstructing Soil Recovery from Acid Rain in Beech (Fagus sylvatica) Stands of the Vienna Woods as Indicated by Removal of Stemflow and Dendrochemistry. Water Air Soil Pollut. 2019, 230, 30. [Google Scholar] [CrossRef]
  34. Lombardo, L.; Trujillo, C.; Vanwalleghem, T.; Gomez, J.A. Organic carbon fluxes by precipitation, throughfall and stemflow in an olive orchard in Southern Spain. Plant Biosyst. 2018, 152, 1039–1047. [Google Scholar] [CrossRef]
  35. Pinos, J.; Llorens, P.; Latron, J. High-resolution temporal dynamics of intra-storm isotopic composition of stemflow and throughfall in a Mediterranean Scots pine forest. Hydrol. Process. 2022, 36, 14641. [Google Scholar] [CrossRef]
  36. Fan, J.L.; Oestergaard, K.T.; Guyot, A.; Lockington, D.A. Measuring and modeling rainfall interception losses by a native Banksia woodland and an exotic pine plantation in subtropical coastal Australia. J. Hydrol. 2014, 515, 156–165. [Google Scholar] [CrossRef]
  37. Tonello, K.C.; Rosa, A.G.; Pereira, L.C.; Matus, G.N.; Guandique, M.E.G.; Navarrete, A.A. Rainfall partitioning in the Cerrado and its influence on net rainfall nutrient fluxes. Agric. For. Meteorol. 2021, 303, 108372. [Google Scholar] [CrossRef]
  38. Tan, S.Y.; Zhao, H.R.; Yang, W.Q.; Tan, B.; Ni, X.Y.; Yue, K.; Zhang, Y.; Wu, F.Z. The effect of canopy exchange on input of base cations in a subalpine spruce plantation during the growth season. Sci. Rep. 2018, 8, 9373. [Google Scholar] [CrossRef] [PubMed]
  39. Lu, J.; Zhang, S.X.; Fang, J.P.; Yan, H.A.; Li, J.R. Nutrient Fluxes in Rainfall, Throughfall, and Stemflow in Pinus densata Natural Forest of Tibetan Plateau. Clean 2017, 45, 1600008. [Google Scholar] [CrossRef]
  40. Germer, S.; Zimmermann, A.; Neill, C.; Krusche, A.V.; Elsenbeer, H. Disproportionate single-species contribution to canopy-soil nutrient flux in an Amazonian rainforest. For. Ecol. Manag. 2012, 267, 40–49. [Google Scholar] [CrossRef]
  41. Cayuela, C.; Levia, D.F.; Latron, J.; Llorens, P. Particulate Matter Fluxes in a Mediterranean Mountain Forest: Interspecific Differences Between Throughfall and Stemflow in Oak and Pine Stands. J. Geophys. Res. Atmos. 2019, 124, 5106–5116. [Google Scholar] [CrossRef]
  42. Pypker, T.G.; Levia, D.F.; Staelens, J.; Van Stan, J.T. Canopy Structure in Relation to Hydrological and Biogeochemical Fluxes. In Forest Hydrology and Biogeochemistry: Synthesis of Past Research and Future Directions; Levia, D.F., Carlyle-Moses, D., Tanaka, T., Eds.; Springer: Dordrecht, The Netherlands, 2011; pp. 371–388. [Google Scholar] [CrossRef]
  43. Schooling, J.T.; Levia, D.F.; Carlyle-Moses, D.E.; Dowtin, A.L.; Brewer, S.E.; Donkor, K.K.; Borden, S.A.; Grzybowski, A.A. Stemflow chemistry in relation to tree size: A preliminary investigation of eleven urban park trees in British Columbia, Canada. Urban For. Urban Green. 2017, 21, 129–133. [Google Scholar] [CrossRef]
  44. De Schrijver, A.; Geudens, G.; Augusto, L.; Staelens, J.; Mertens, J.; Wuyts, K.; Gielis, L.; Verheyen, K. The effect of forest type on throughfall deposition and seepage flux: A review. Oecologia 2007, 153, 663–674. [Google Scholar] [CrossRef]
  45. Hamdan, K.; Schmidt, M. The influence of bigleaf maple on chemical properties of throughfall, stemflow, and forest floor in coniferous forest in the Pacific Northwest. Can. J. For. Res. 2012, 42, 868–878. [Google Scholar] [CrossRef]
  46. Hofhansl, F.; Wanek, W.; Drage, S.; Huber, W.; Weissenhofer, A.; Richter, A. Controls of hydrochemical fluxes via stemflow in tropical lowland rainforests: Effects of meteorology and vegetation characteristics. J. Hydrol. 2012, 452, 247–258. [Google Scholar] [CrossRef]
  47. Levia, D.F.; Herwitz, S.R. Physical properties of water in relation to stemflow leachate dynamics: Implications for nutrient cycling. Can. J. For. Res. 2000, 30, 662–666. [Google Scholar] [CrossRef]
  48. You, Y.Y.; Xiang, W.H.; Ouyang, S.; Zhao, Z.H.; Chen, L.; Zeng, Y.L.; Lei, P.F.; Deng, X.W.; Wang, J.R.; Wang, K.L. Hydrological fluxes of dissolved organic carbon and total dissolved nitrogen in subtropical forests at three restoration stages in southern China. J. Hydrol. 2020, 583, 124656. [Google Scholar] [CrossRef]
  49. Hofhansl, F.; Wanek, W.; Drage, S.; Huber, W.; Weissenhofer, A.; Richter, A. Topography strongly affects atmospheric deposition and canopy exchange processes in different types of wet lowland rainforest, Southwest Costa Rica. Biogeochemistry 2010, 106, 371–396. [Google Scholar] [CrossRef]
  50. Berger, T.W.; Untersteiner, H.; Schume, H.; Jost, G. Throughfall fluxes in a secondary spruce (Picea abies), a beech (Fagus sylvatica) and a mixed spruce–beech stand. For. Ecol. Manag. 2008, 255, 605–618. [Google Scholar] [CrossRef]
  51. Jiang, Z.Y.; Zhi, Q.Y.; Van Stan, J.T.; Zhang, S.Y.; Xiao, Y.H.; Chen, X.Y.; Yang, X.; Zhou, H.Y.; Hu, Z.M.; Wu, H.W. Rainfall partitioning and associated chemical alteration in three subtropical urban tree species. J. Hydrol. 2021, 603, 127109. [Google Scholar] [CrossRef]
  52. Dawoe, E.K.; Barnes, V.R.; Oppong, S.K. Spatio-temporal dynamics of gross rainfall partitioning and nutrient fluxes in shaded-cocoa (Theobroma cocoa) systems in a tropical semi-deciduous forest. Agrofor. Syst. 2017, 92, 397–413. [Google Scholar] [CrossRef]
  53. Coble, A.A.; Hart, S.C. The significance of atmospheric nutrient inputs and canopy interception of precipitation during ecosystem development in piñon–juniper woodlands of the southwestern USA. J. Arid Environ. 2013, 98, 79–87. [Google Scholar] [CrossRef]
  54. Chen, Z.; Wang, Y.H.; Chen, R.S.; Ni, X.; Cao, J. Effects of Forest Type on Nutrient Fluxes in Throughfall, Stemflow, and Litter Leachate within Acid-Polluted Locations in Southwest China. Int. J. Environ. Res. Public Health 2022, 19, 2810. [Google Scholar] [CrossRef]
  55. Arisci, S.; Rogora, M.; Marchetto, A.; Dichiaro, F. The role of forest type in the variability of DOC in atmospheric deposition at forest plots in Italy. Environ. Monit. Assess. 2012, 184, 3415–3425. [Google Scholar] [CrossRef] [PubMed]
  56. Xu, Q.C.; Wu, F.Z.; Peng, Y.; Hedenec, P.; Ni, X.Y.; Tan, S.Y.; Huang, Y.B.; Yue, K. Effects of Forest Transformation on the Fluxes of Potassium, Calcium, Sodium, and Magnesium Along with Rainfall Partitioning. Pol. J. Environ. Stud. 2023, 32, 4341–4351. [Google Scholar] [CrossRef] [PubMed]
  57. Arfanuzzaman, M.; Betts, R.A.; Gelfan, A.; Hirabayashi, Y.; Lissner, T.K.; Gunn, E.L.; Liu, J.; Morgan, R.; Mwanga, S.; Supratid, S. Water. In Climate Change 2022—Impacts, Adaptation and Vulnerability: Working Group II Contribution to the Sixth Assessment Report of the Intergovernmental Panel on Climate Change; Cambridge University Press: Cambridge, UK, 2022; pp. 551–712. [Google Scholar] [CrossRef]
Figure 1. Pictures of the (a) stemflow collection system, (b) water retention time bark experiment, and (c) nutrient element leachability test (The red arrows indicate the direction of water flow).
Forests 15 00623 g001
Figure 2. Monthly variation in air temperature and amount of throughfall, stemflow, and interception.
Forests 15 00623 g002
Figure 3. The amount of throughfall (a) and stemflow (b) from different tree species for each rainfall event. The linear regression lines are shown in the inset. Circles of different colors represent different species of trees. Acer mono (AM, black), Tilia amurensis (TA, red), Pinus koraiensis (PK, blue), Quercus mongolica (QM, green), and Fraxinus mandshurica (FM, purple).
Forests 15 00623 g003
Figure 4. Differences in bark properties of five dominant tree species. (a) Bark morphology and thickness of different species; (b) results of water holding time experiment; (c) the leachability of nutrient elements of different barks. One-way analysis of variance (ANOVA) was used to compare the differences among tree barks. Error bars represent the standard error (n = 3). Values with different letters (a–c) were significantly different at p < 0.05. Acer mono (AM), Tilia amurensis (TA), Pinus koraiensis (PK), Quercus mongolica (QM), and Fraxinus mandshurica (FM).
Forests 15 00623 g004
Figure 5. The influence of tree species on soil pH near the stem. (a) Average soil pH under different tree species canopies; (b) the spatial variation in mean soil pH under the canopy of PK. One-way analysis of variance (ANOVA) was used to compare the differences in soil pH among tree species. Error bars represent the standard error (n = 20). Values with different letters (a, b) were significantly different at p < 0.05. Acer mono (AM), Tilia amurensis (TA), Pinus koraiensis (PK), Quercus mongolica (QM), and Fraxinus mandshurica (FM).
Forests 15 00623 g005
Figure 6. Monthly variation in chemical characteristics of rainfall, throughfall, and stemflow of different tree species. Acer mono (AM), Tilia amurensis (TA), Pinus koraiensis (PK), Quercus mongolica (QM), and Fraxinus mandshurica (FM).
Forests 15 00623 g006
Table 1. Mean structural attributes of forest stand and five dominant tree species.
ItemDBH (cm)Height (m)Crown Area (m2)Tree Density (Trees ha−1)Leaf Area IndexCanopy Density
Stand50.49 ± 8.9325.67 ± 2.09545 4.92 ± 0.320.80
AM29.30 ± 2.4319.33 ± 0.724.91 ± 0.94140
TA44.59 ± 5.9526.00 ± 1.259.93 ± 1.30100
PK39.81 ± 2.3626.00 ± 0.478.43 ± 0.75166
QM60.51 ± 0.9928.33 ± 0.7217.27 ± 1.9314
FM65.29 ± 0.7728.67 ± 0.2714.79 ± 0.9782
Values (mean ± standard error). Acer mono (AM), Tilia amurensis (TA), Pinus koraiensis (PK), Quercus mongolica (QM), and Fraxinus mandshurica (FM).
Table 2. The mean nutrient concentrations (mg L−1) of different water samples.
Chemical VariableRainfall
(n = 30)
Throughfall
(n = 40)
Stemflow (n = 150)
AMTAPKQMFM
F0.17 ± 0.02 c0.20 ± 0.03 bc0.22 ± 0.02 bc0.28 ± 0.07 bc0.76 ± 0.08 a0.41 ± 0.20 ab0.69 ± 0.16 a
Cl2.44 ± 0.82 b3.45 ± 0.43 b3.46 ± 1.04 b6.09 ± 0.98 b10.05 ± 0.45 ab4.02 ± 0.80 b8.66 ± 1.30 a
SO42−0.90 ± 0.08 e1.50 ± 0.51 de5.84 ± 1.70 bc11.35 ± 2.84 cd27.18 ± 2.40 b13.15 ± 3.36 b39.39 ± 10.49 a
NO30.64 ± 0.10 b0.80 ± 0.80 b0.72 ± 0.25 b2.72 ± 0.39 b26.56 ± 1.60 ab1.34 ± 0.30 ab7.90 ± 1.95 a
Ca2+2.29 ± 0.33 c2.75 ± 0.58 c24.41 ± 2.32 b29.79 ± 3.52 b26.93 ± 1.47 b50.48 ± 4.90 a53.65 ± 11.00 a
K+2.74 ± 0.52 d5.08 ± 1.09 d30.15 ± 2.45 b20.43 ± 2.16 bc15.42 ± 1.54 c15.38 ± 1.11 c147.85 ± 32.77 a
Mg2+0.24 ± 0.05 c0.44 ± 0.12 c1.92 ± 0.31 b2.40 ± 0.28 b4.15 ± 0.37 b2.85 ± 0.28 ab5.33 ± 1.01 a
Na+1.22 ± 0.23 c1.51 ± 0.23 c1.81 ± 0.19 bc2.91 ± 0.40 bc4.97 ± 0.65 b3.87 ± 1.39 abc4.64 ± 0.99 a
pH7.32 ± 0.23 a6.88 ± 0.18 a7.05 ± 0.24 a6.86 ± 0.19 a5.17 ± 0.25 b6.89 ± 0.19 a7.16 ± 0.19 a
Values (mean ± standard error). pH has no unit. One-way analysis of variance (ANOVA) was used to compare the differences among various water samples, and different letters in the same row indicate statistical differences at p < 0.05. Acer mono (AM), Tilia amurensis (TA), Pinus koraiensis (PK), Quercus mongolica (QM), and Fraxinus mandshurica (FM).
Table 3. Nutrient fluxes in water through different pathways and the canopy exchange effect during the growing season.
Type of Water SampleNutrient Input (kg ha−1)
FClSO42−NO3Ca2+K+Mg2+Na+
Rainfall (IP)1.13 16.43 6.02 4.29 15.39 18.43 1.60 8.23
Throughfall (IT)0.86 14.76 6.40 3.41 11.76 21.73 1.88 6.45
Stemflow (IS)0.11 1.67 4.05 2.48 7.61 7.49 0.77 0.85
Total wet input (IT + IS)0.98 16.42 10.45 5.89 19.38 29.22 2.65 7.31
Exchange effect (IT + IS − IP)−0.15 0.01 4.43 1.60 3.98 10.79 1.05 −0.92
A positive value of the exchange effect means that the canopy was a source of nutrients; otherwise, it was a sink.
Table 4. Nutrient fluxes through stemflow for an individual tree across different tree species.
SpeciesNutrient Inputs through Stemflow (g tree−1)
FClSO42−NO3Ca2+K+Mg2+Na+
AM0.17 ± 0.04 a2.59 ± 0.29 ab4.38 ± 0.18 c0.54 ± 0.04 b18.32 ± 0.68 b22.63 ± 1.16 a1.44 ± 0.22 a1.36 ± 0.15 a
TA0.15 ± 0.02 a3.41 ± 0.74 ab6.36 ± 0.88 c1.52 ± 0.05 b16.68 ± 0.78 b11.44 ± 0.42 b1.34 ± 0.09 a1.63 ± 0.32 a
PK0.37 ± 0.04 a4.87 ± 1.38 a13.16 ± 0.25 a12.86 ± 1.16 a13.04 ± 0.87 b7.47 ± 0.41 c2.01 ± 0.46 a2.41 ± 0.69 a
QM0.33 ± 0.14 a3.17 ± 0.72 ab10.35 ± 0.11 b1.05 ± 0.10 b39.75 ± 1.72 a12.11 ± 0.45 b2.25 ± 0.59 a3.05 ± 0.97 a
FM0.10 ± 0.01 a1.22 ± 0.06 b5.55 ± 0.72 c1.11 ± 0.17 b7.55 ± 0.63 c20.82 ± 0.86 a0.75 ± 0.06 a0.65 ± 0.09 a
Values (mean ± standard error). One-way analysis of variance (ANOVA) was used to compare the differences in nutrient inputs among tree species, and different letters in the same column indicate statistical differences at p < 0.05. Acer mono (AM), Tilia amurensis (TA), Pinus koraiensis (PK), Quercus mongolica (QM), and Fraxinus mandshurica (FM).
Table 5. Nutrient inputs through stemflow and throughfall in numerous global studies.
Climate Zone (Location)Forest TypePrecipitation (mm)Nutrient Inputs (Throughfall + Stemflow, kg ha−1)References
ClSO42−NO3Ca2+K+Mg2+Na+
Temperate (Northeast China)Mixed broadleaf and coniferous forest672.216.42 10.45 5.89 19.38 29.22 2.65 7.31 This study
Temperate (southwestern USA)Pinus edulis and Juniperus monosperma3401.68 0.98 3.12 0.90 0.41 0.69 Coble et al. [53]
Temperate (Lower Austria)Secondary spruce9294.60 18.40 36.31 9.50 13.00 2.20 1.60 Berger et al. [50]
Temperate (Lower Austria)Mixed spruce–beech9293.30 12.20 29.23 8.90 8.70 1.00 1.60 Berger et al. [50]
Temperate (Lower Austria)Beech9292.50 11.00 21.70 8.80 8.90 1.00 1.30 Berger et al. [50]
Subtropical (Brazil)Secondary vegetation 97010.79 26.00 28.94 263.92 410.25 75.40 13.65 Tonello et al. [37]
Subtropical (Southern China)Roystonea regia163025.6327.9129.8011.7828.491.533.09Jiang et al. [51]
Subtropical (Southern China)Ficus microcarpa163027.5431.8051.8813.6921.842.263.11Jiang et al. [51]
Subtropical (Southern China)Lagerstroemia speciosa163012.2732.6734.8213.3820.982.763.08Jiang et al. [51]
Tropical (Southwest Costa Rica)Primary rainforest585012.30 12.00 0.90 19.40 51.10 7.10 5.20 Hofhansl et al. [46,49]
Tropical (Southwest Costa Rica)Secondary rainforest58509.30 9.00 0.50 17.30 37.20 5.20 4.90 Hofhansl et al. [46,49]
Tropical (Ghana)Tropical semi-deciduous forest13763.14 11.70 56.90 9.50 Dawoe et al. [52]
Disclaimer/Publisher’s Note: The statements, opinions and data contained in all publications are solely those of the individual author(s) and contributor(s) and not of MDPI and/or the editor(s). MDPI and/or the editor(s) disclaim responsibility for any injury to people or property resulting from any ideas, methods, instructions or products referred to in the content.

