
Analysis of Spatial-Temporal Changes and Driving Factors of Vegetation Coverage in Jiamusi City

Abstract
1. Introduction
2. Materials and Methods
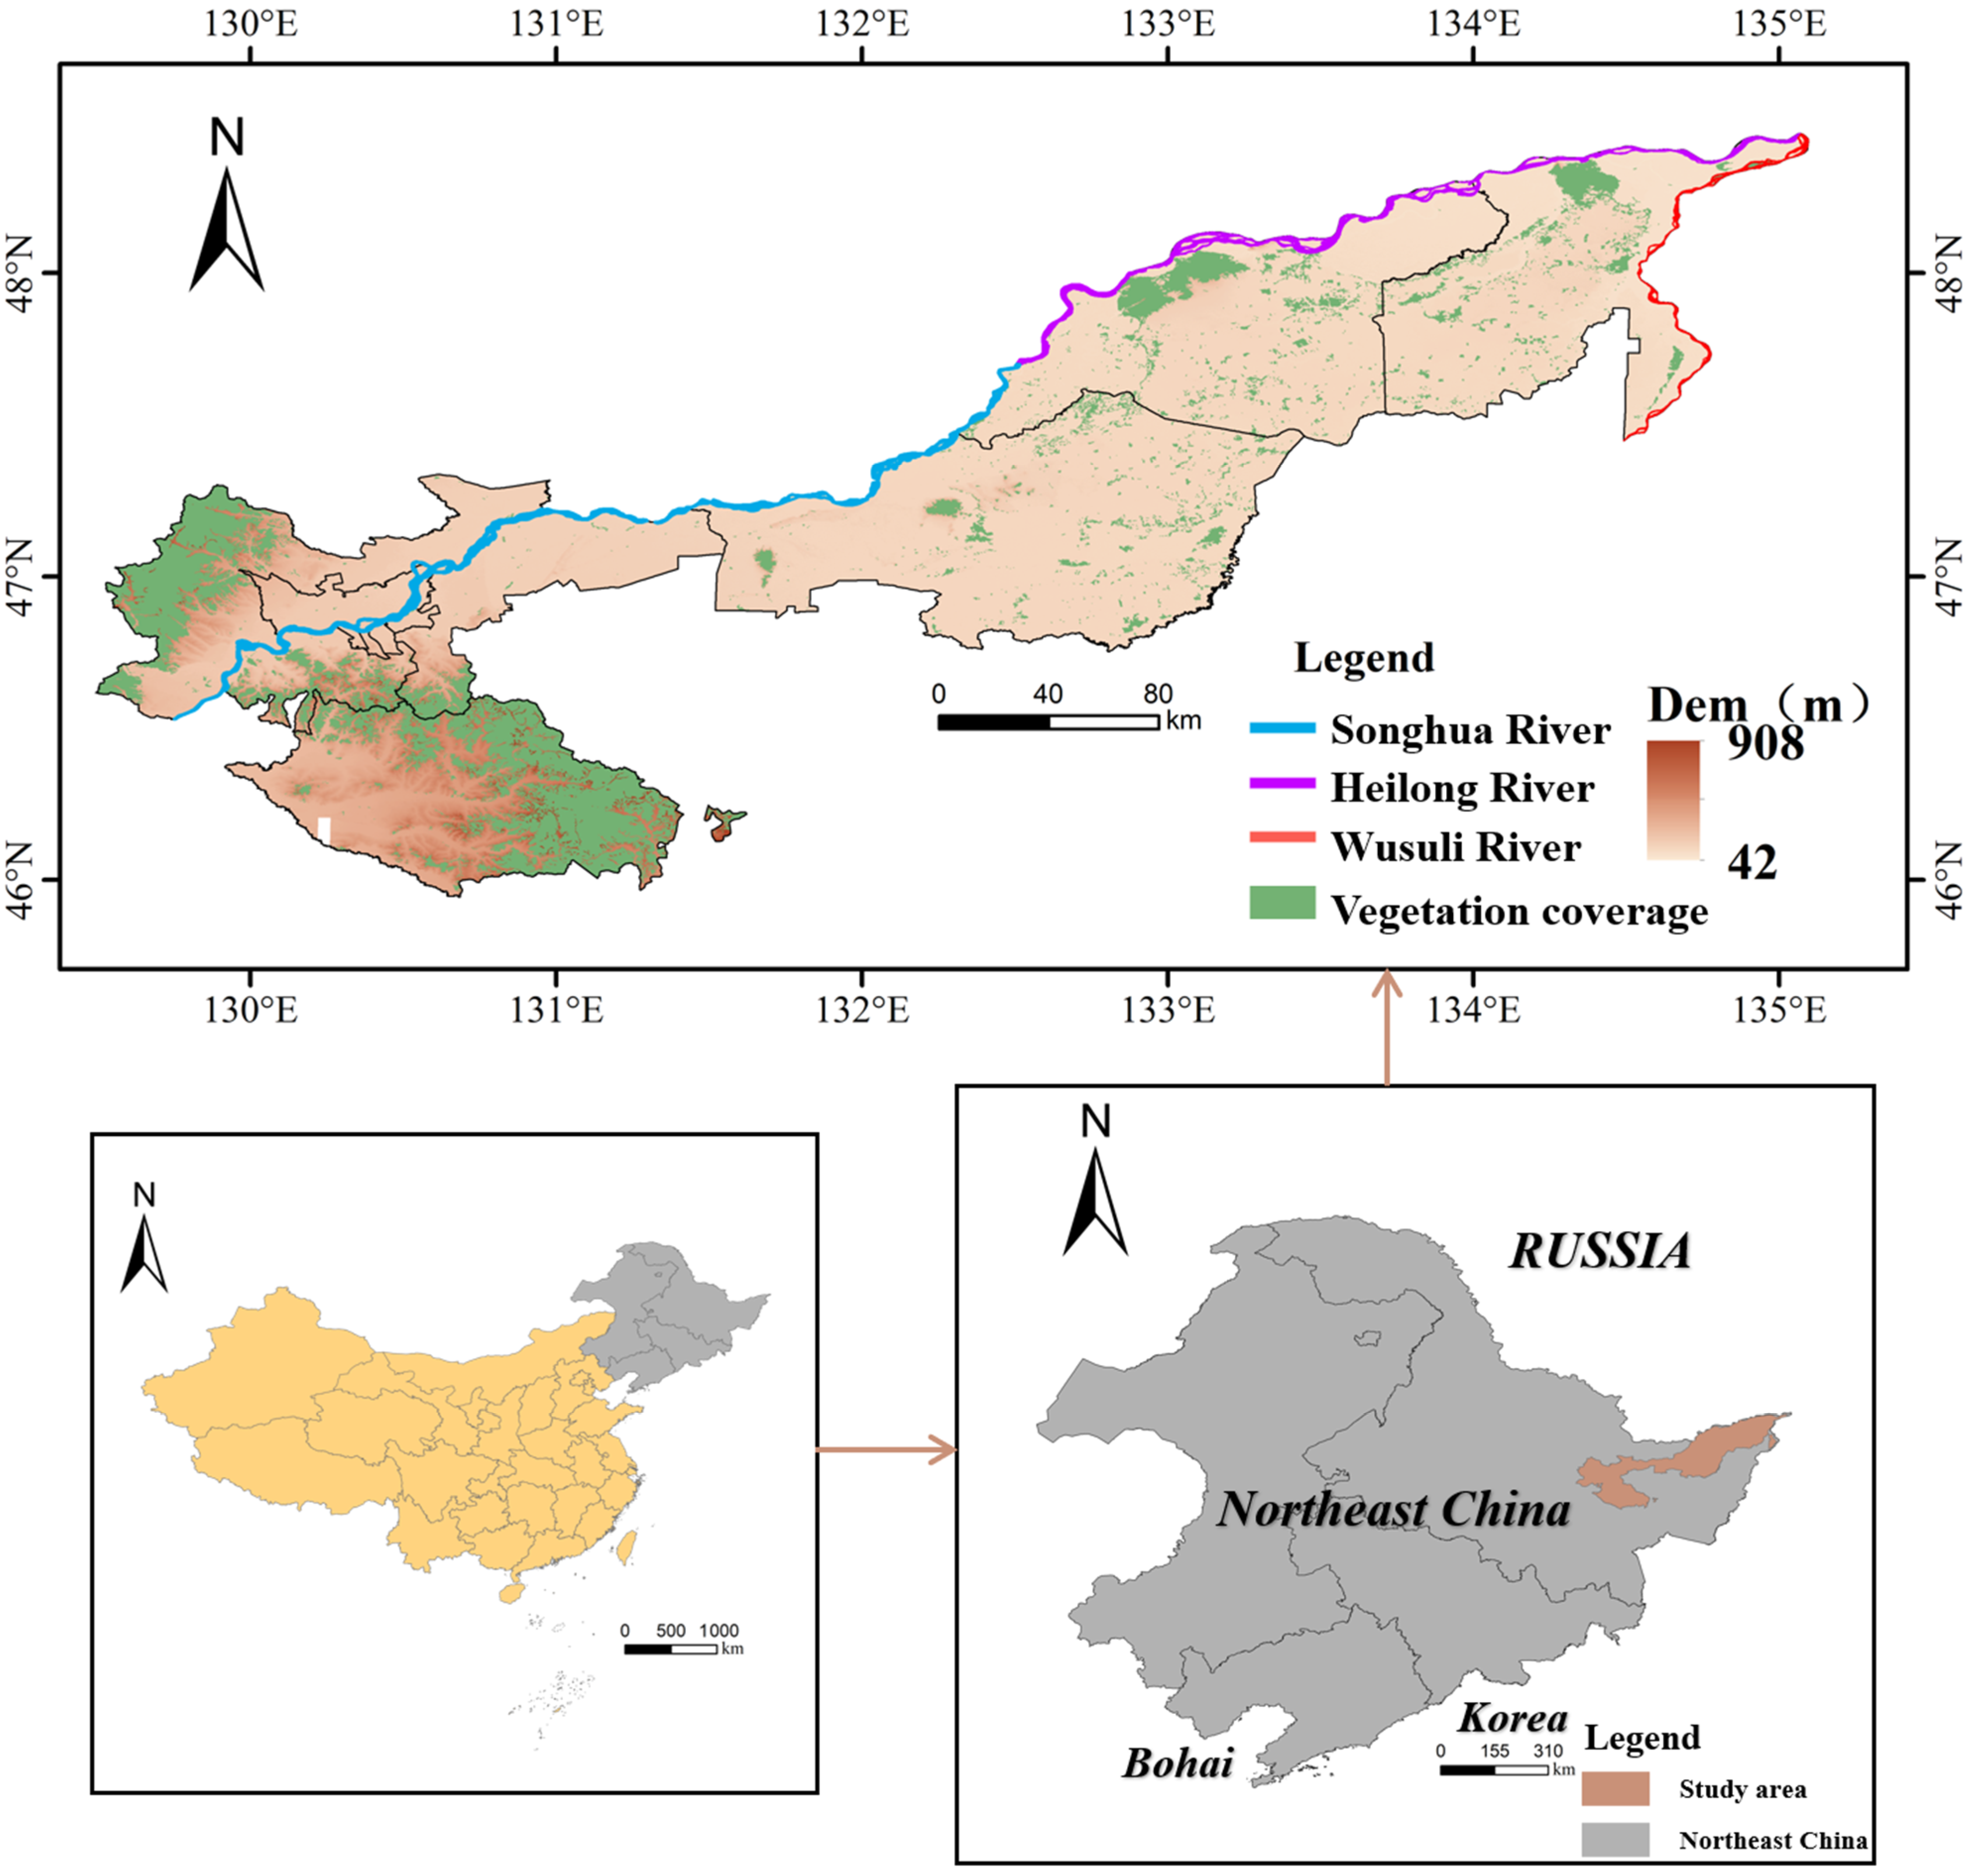
2.1. Study Area
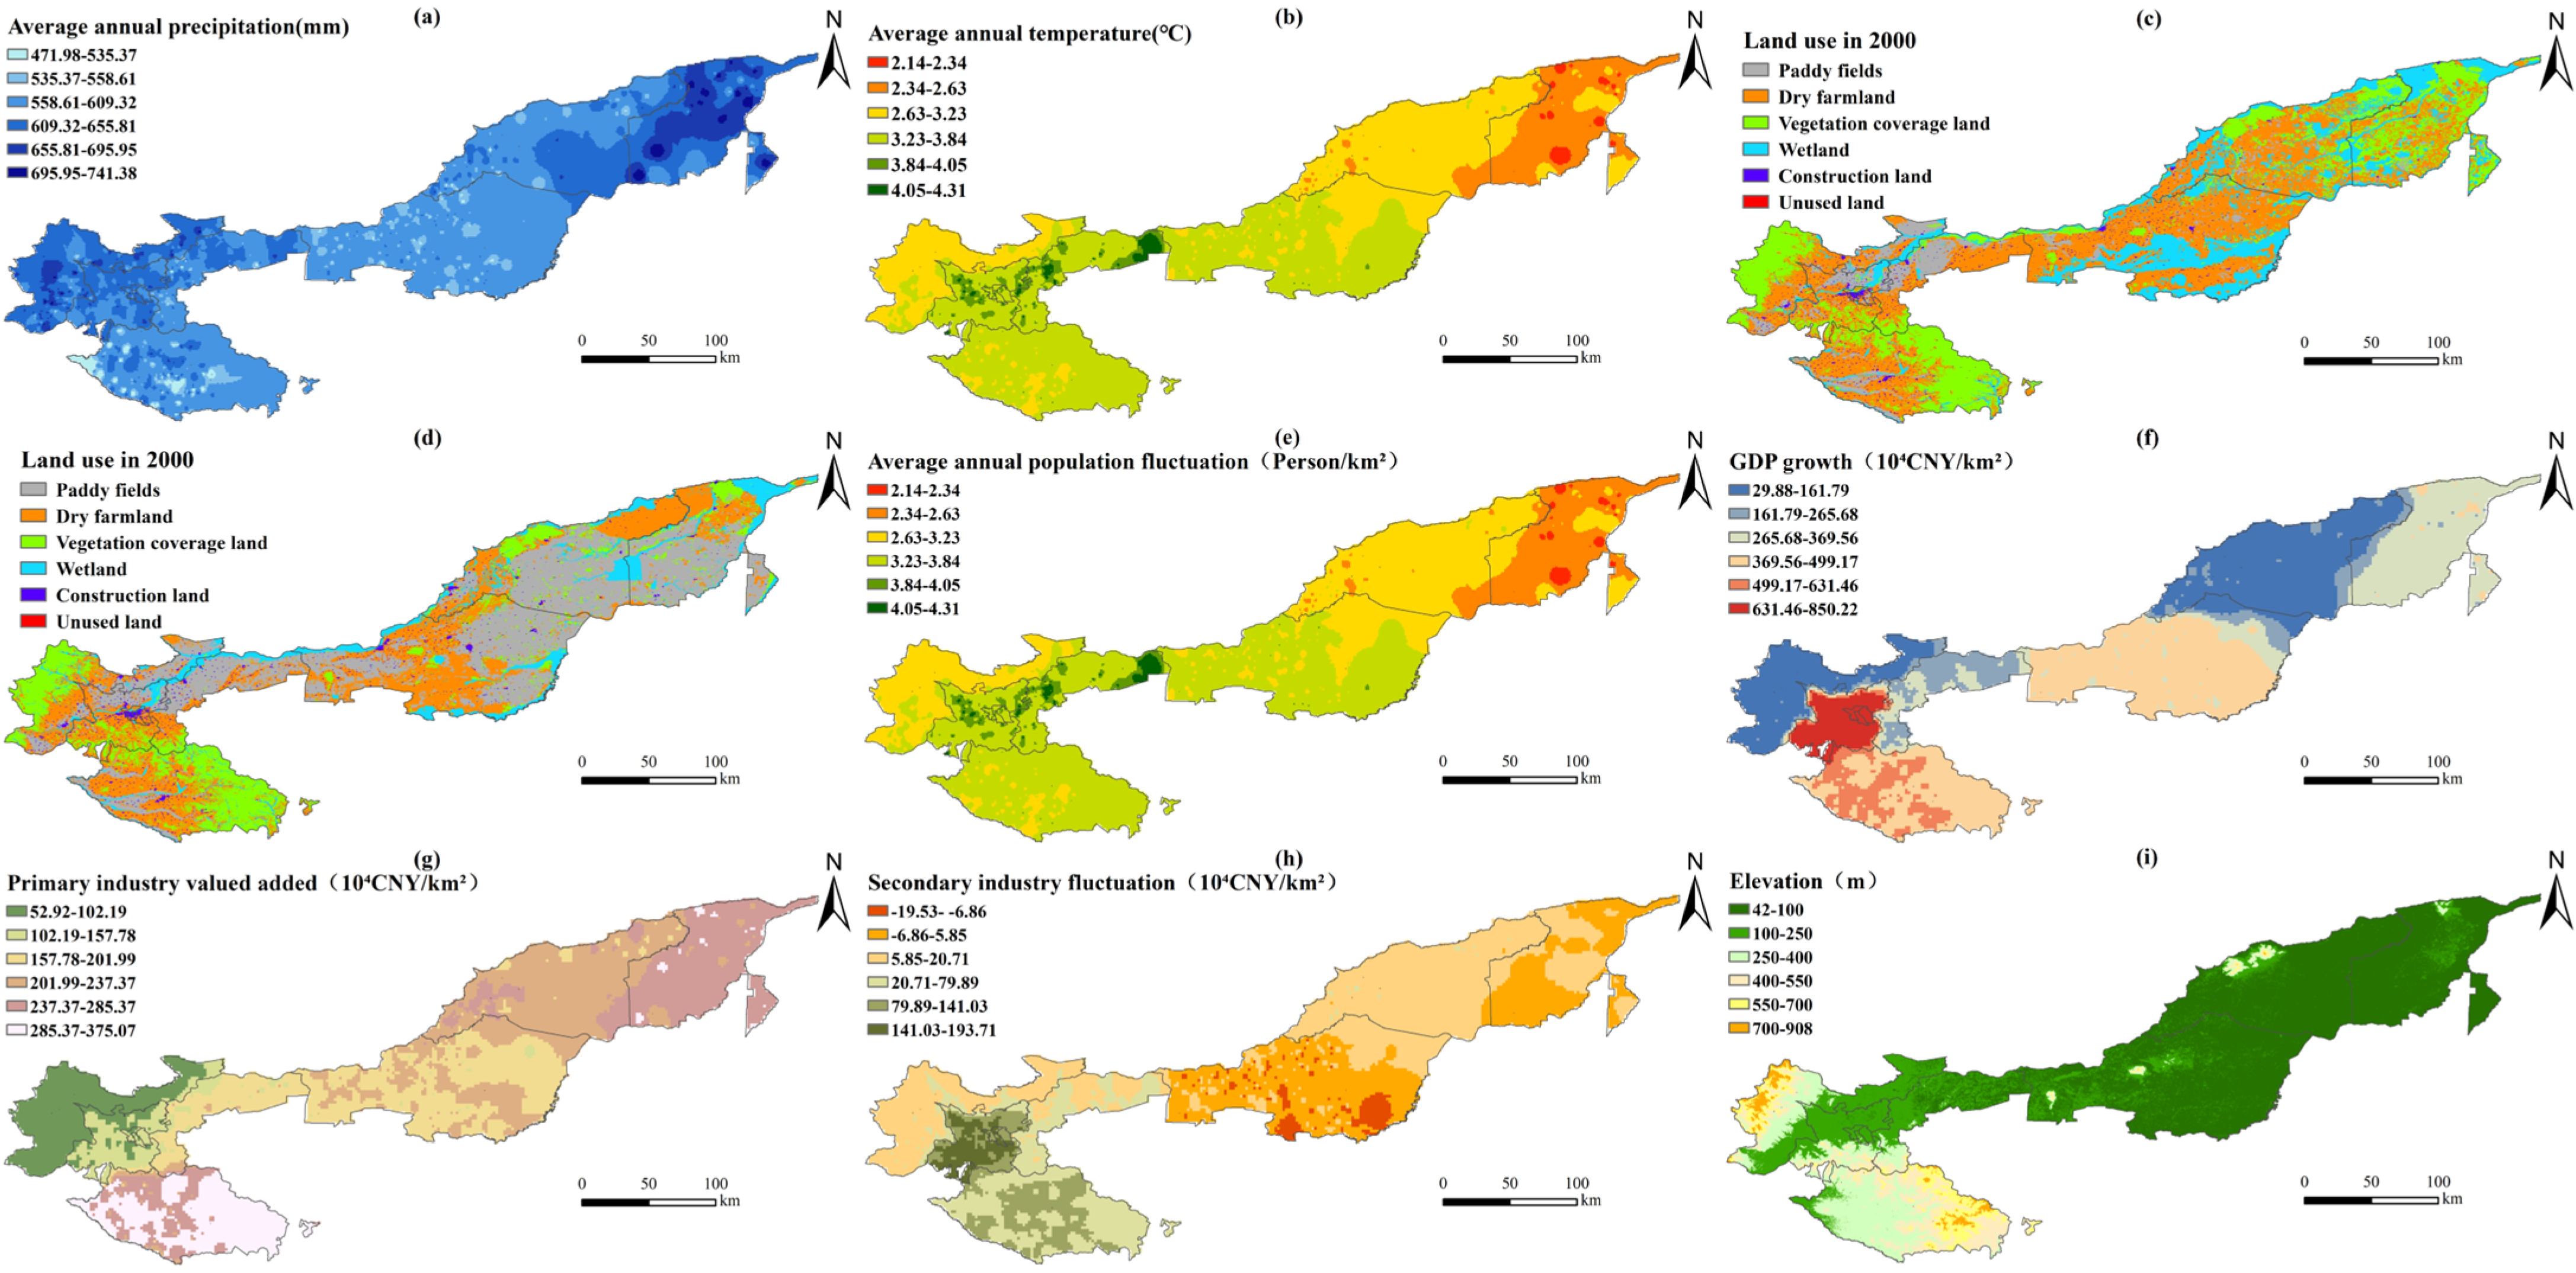
2.2. Data Source
2.3. Methodology
2.3.1. Land Use Analysis
2.3.2. Geodetector
- (1)
- Factor detection
- (2)
- Interaction detection
- (1)
- Calculate the values of and for , denoted as and , respectively.
- (2)
- Calculate the value of during the interaction, denoted as .
- (3)
- Compare , and .
3. Results
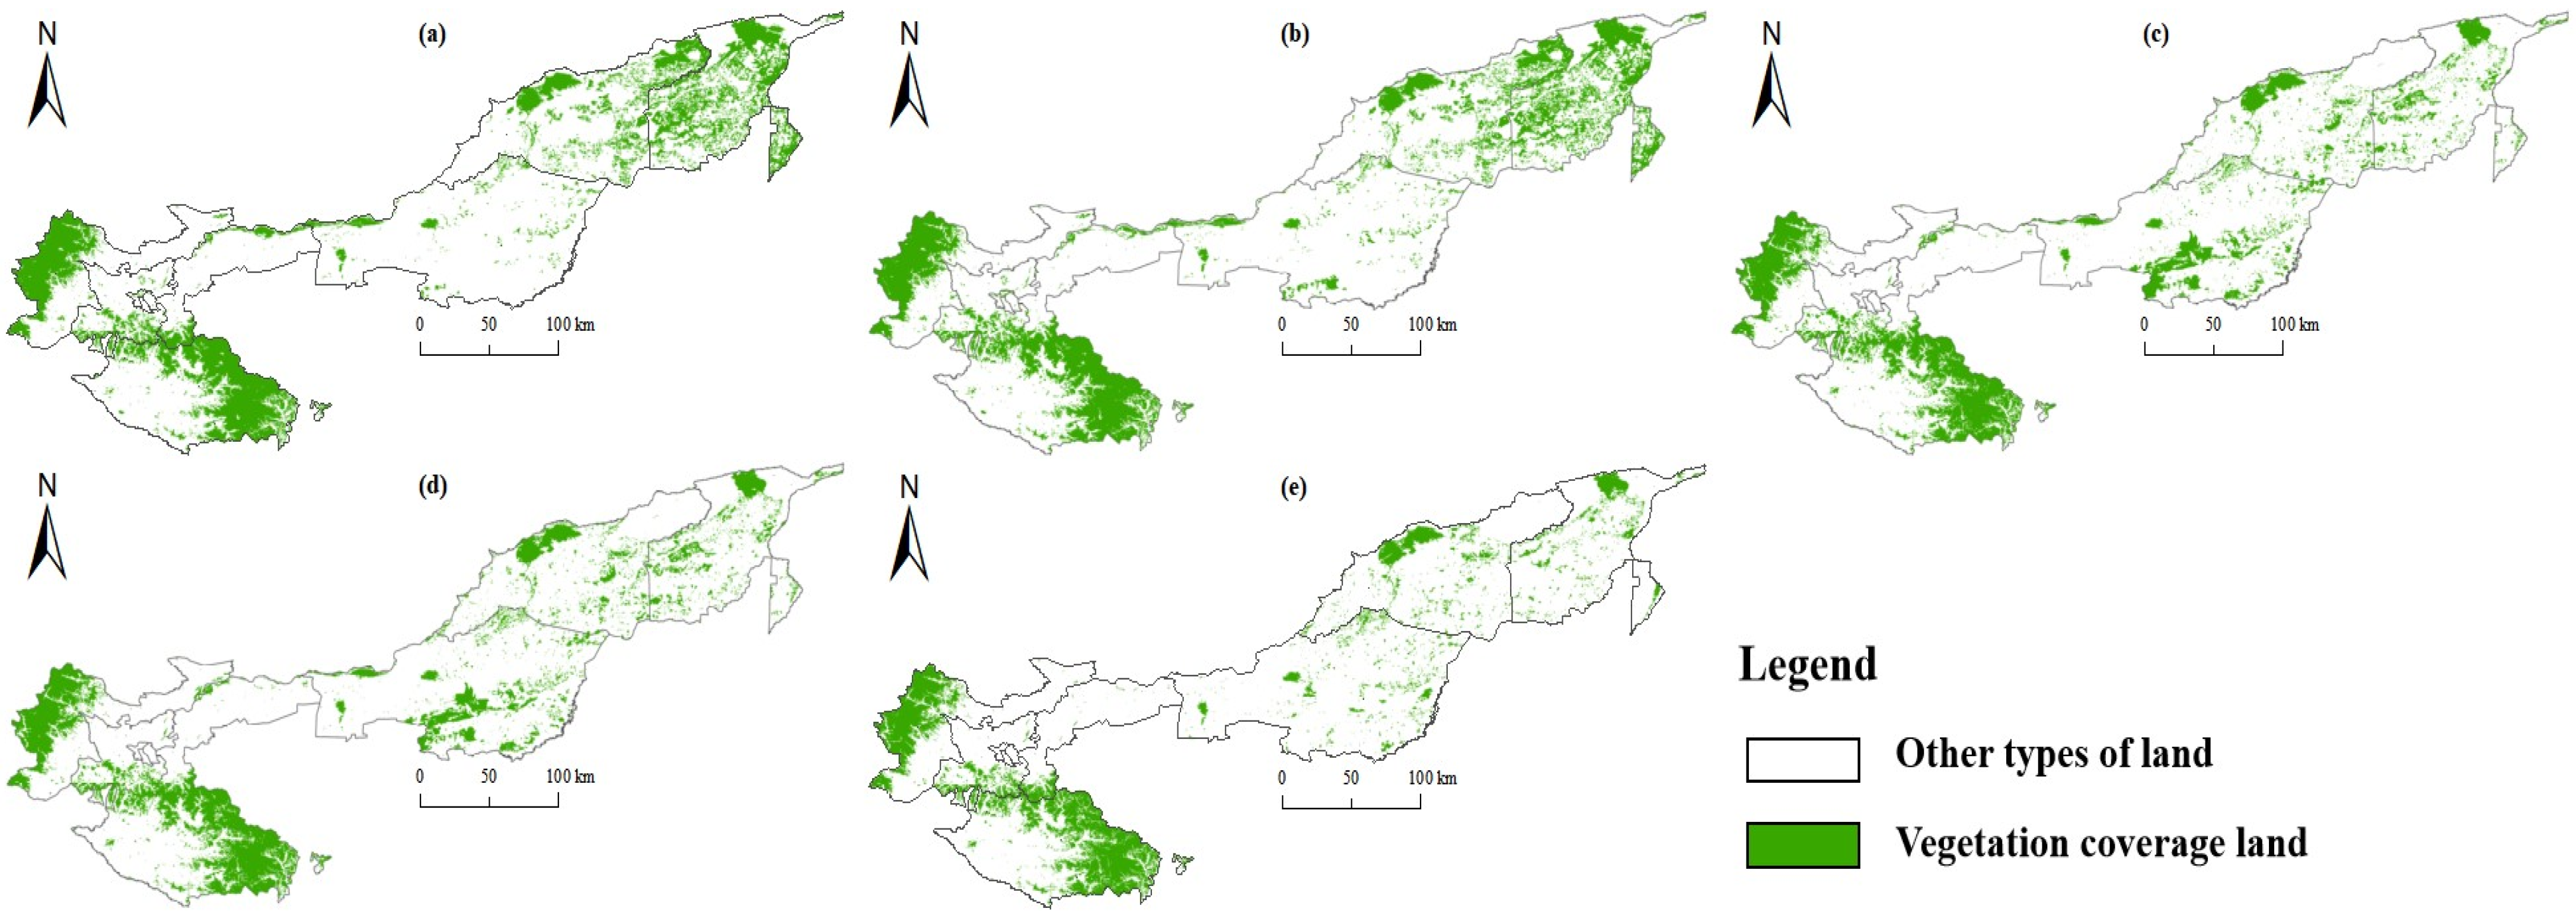
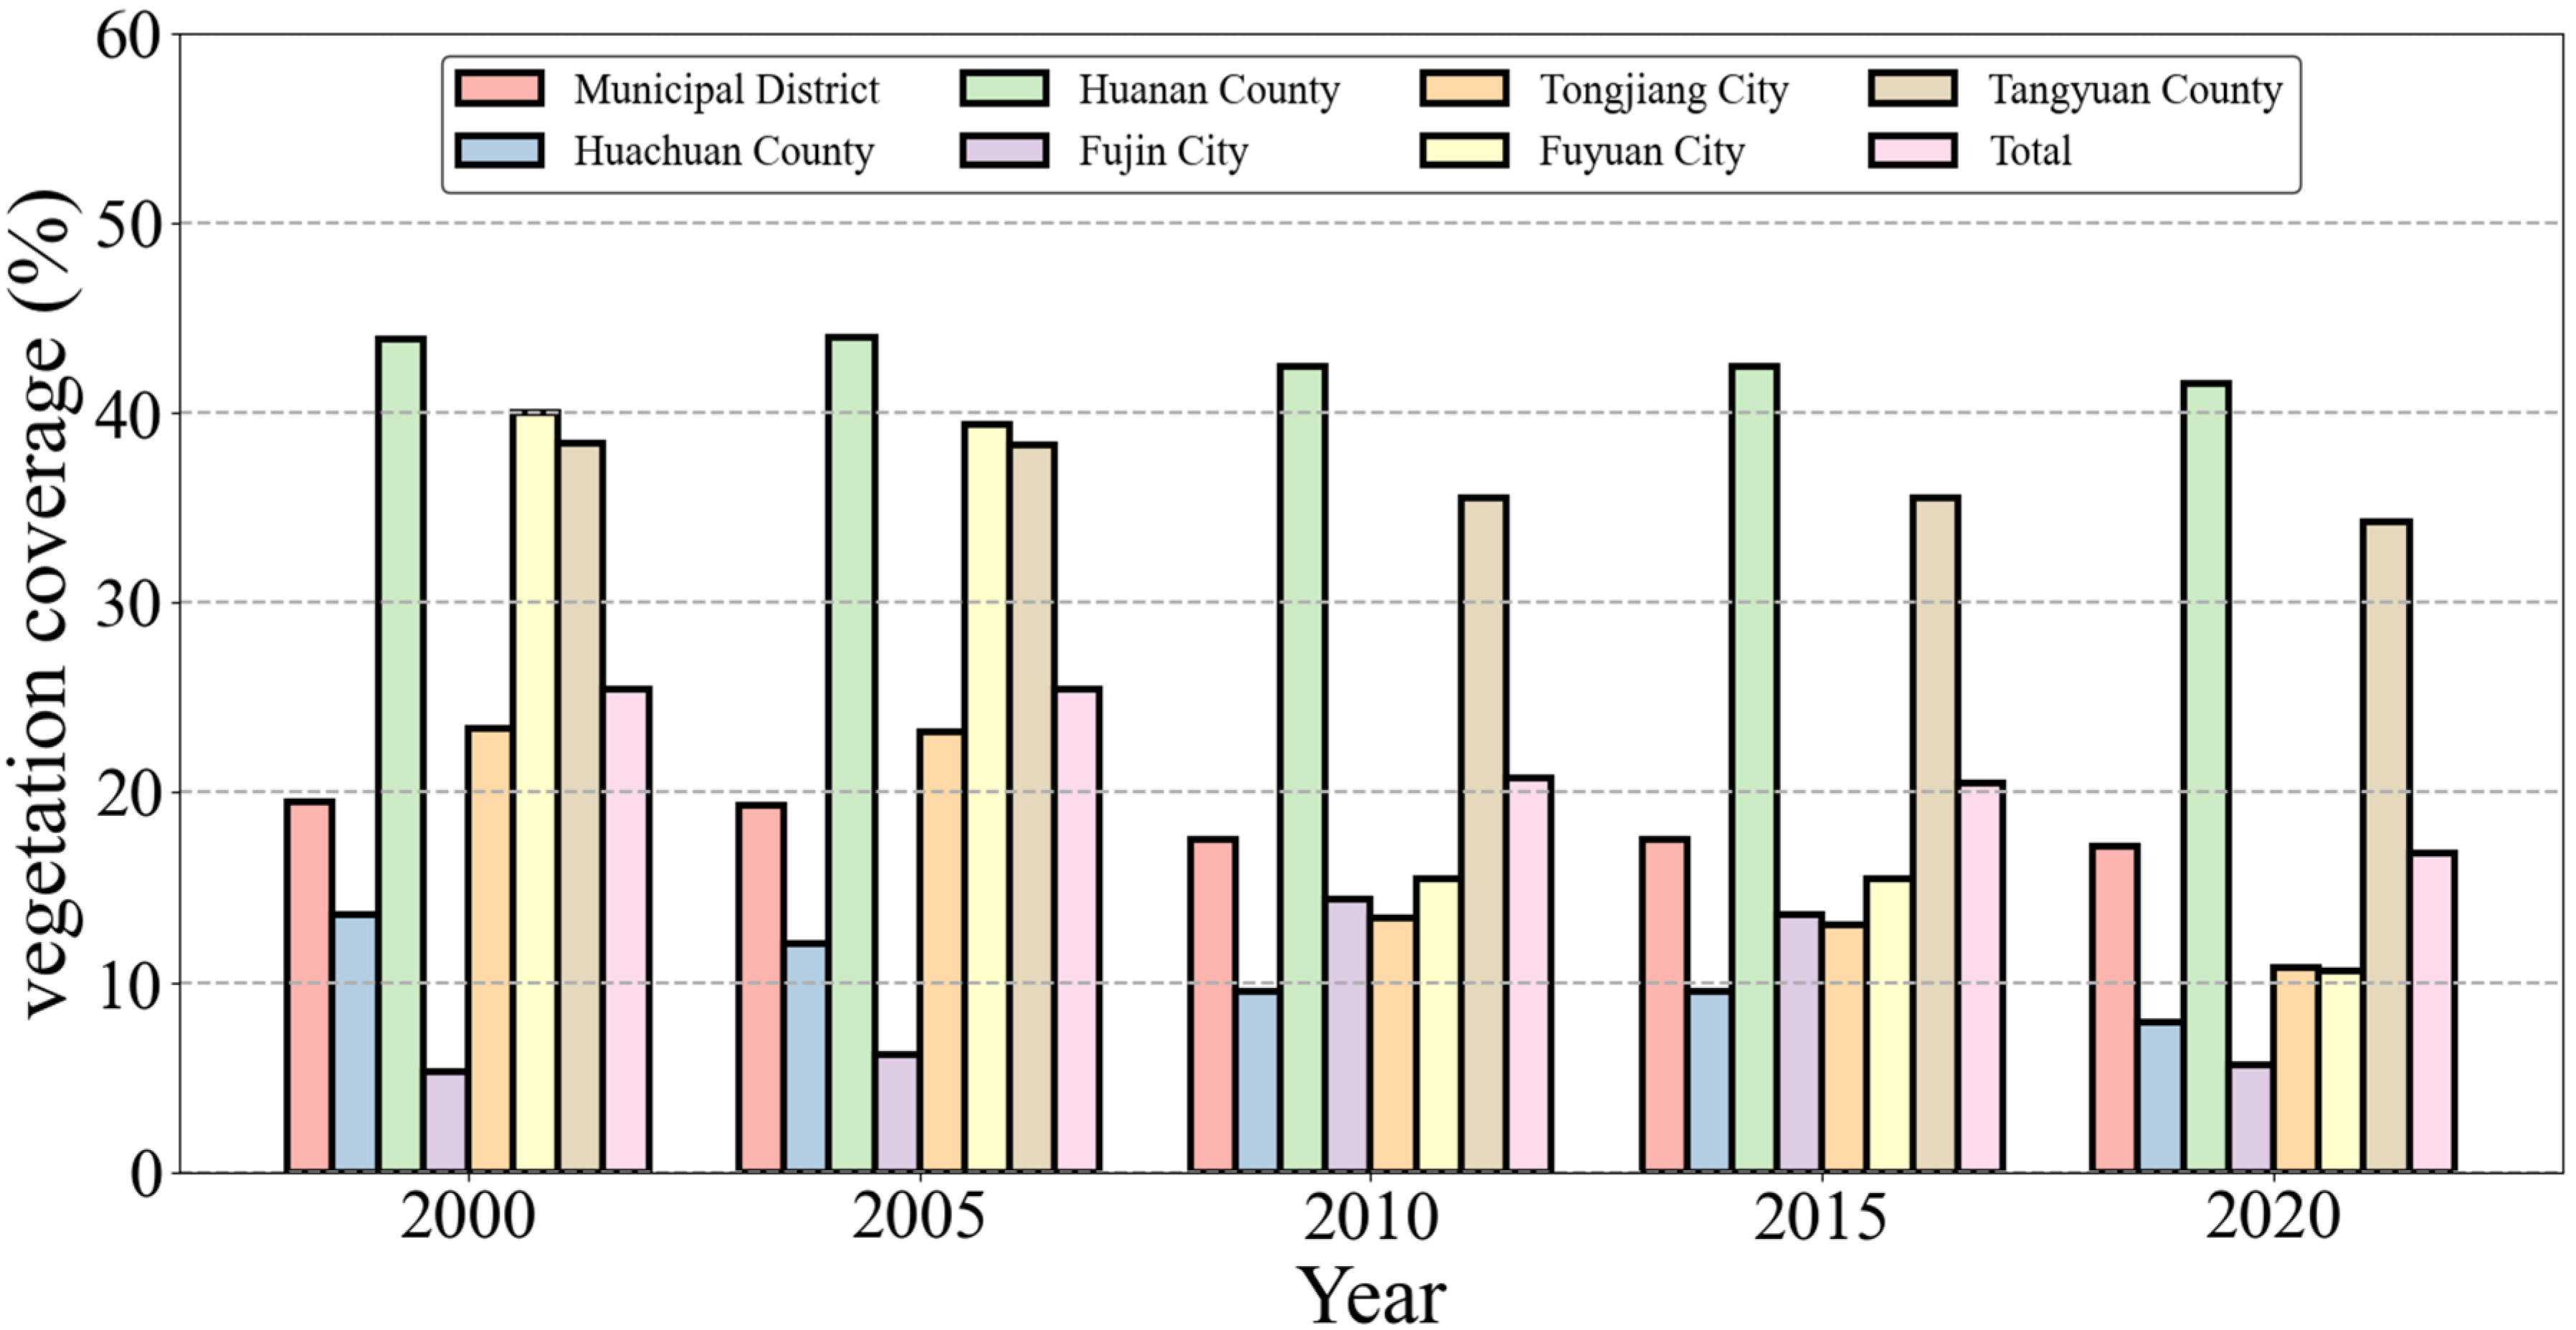
3.1. Analysis of Spatiotemporal Changes in Vegetation Coverage
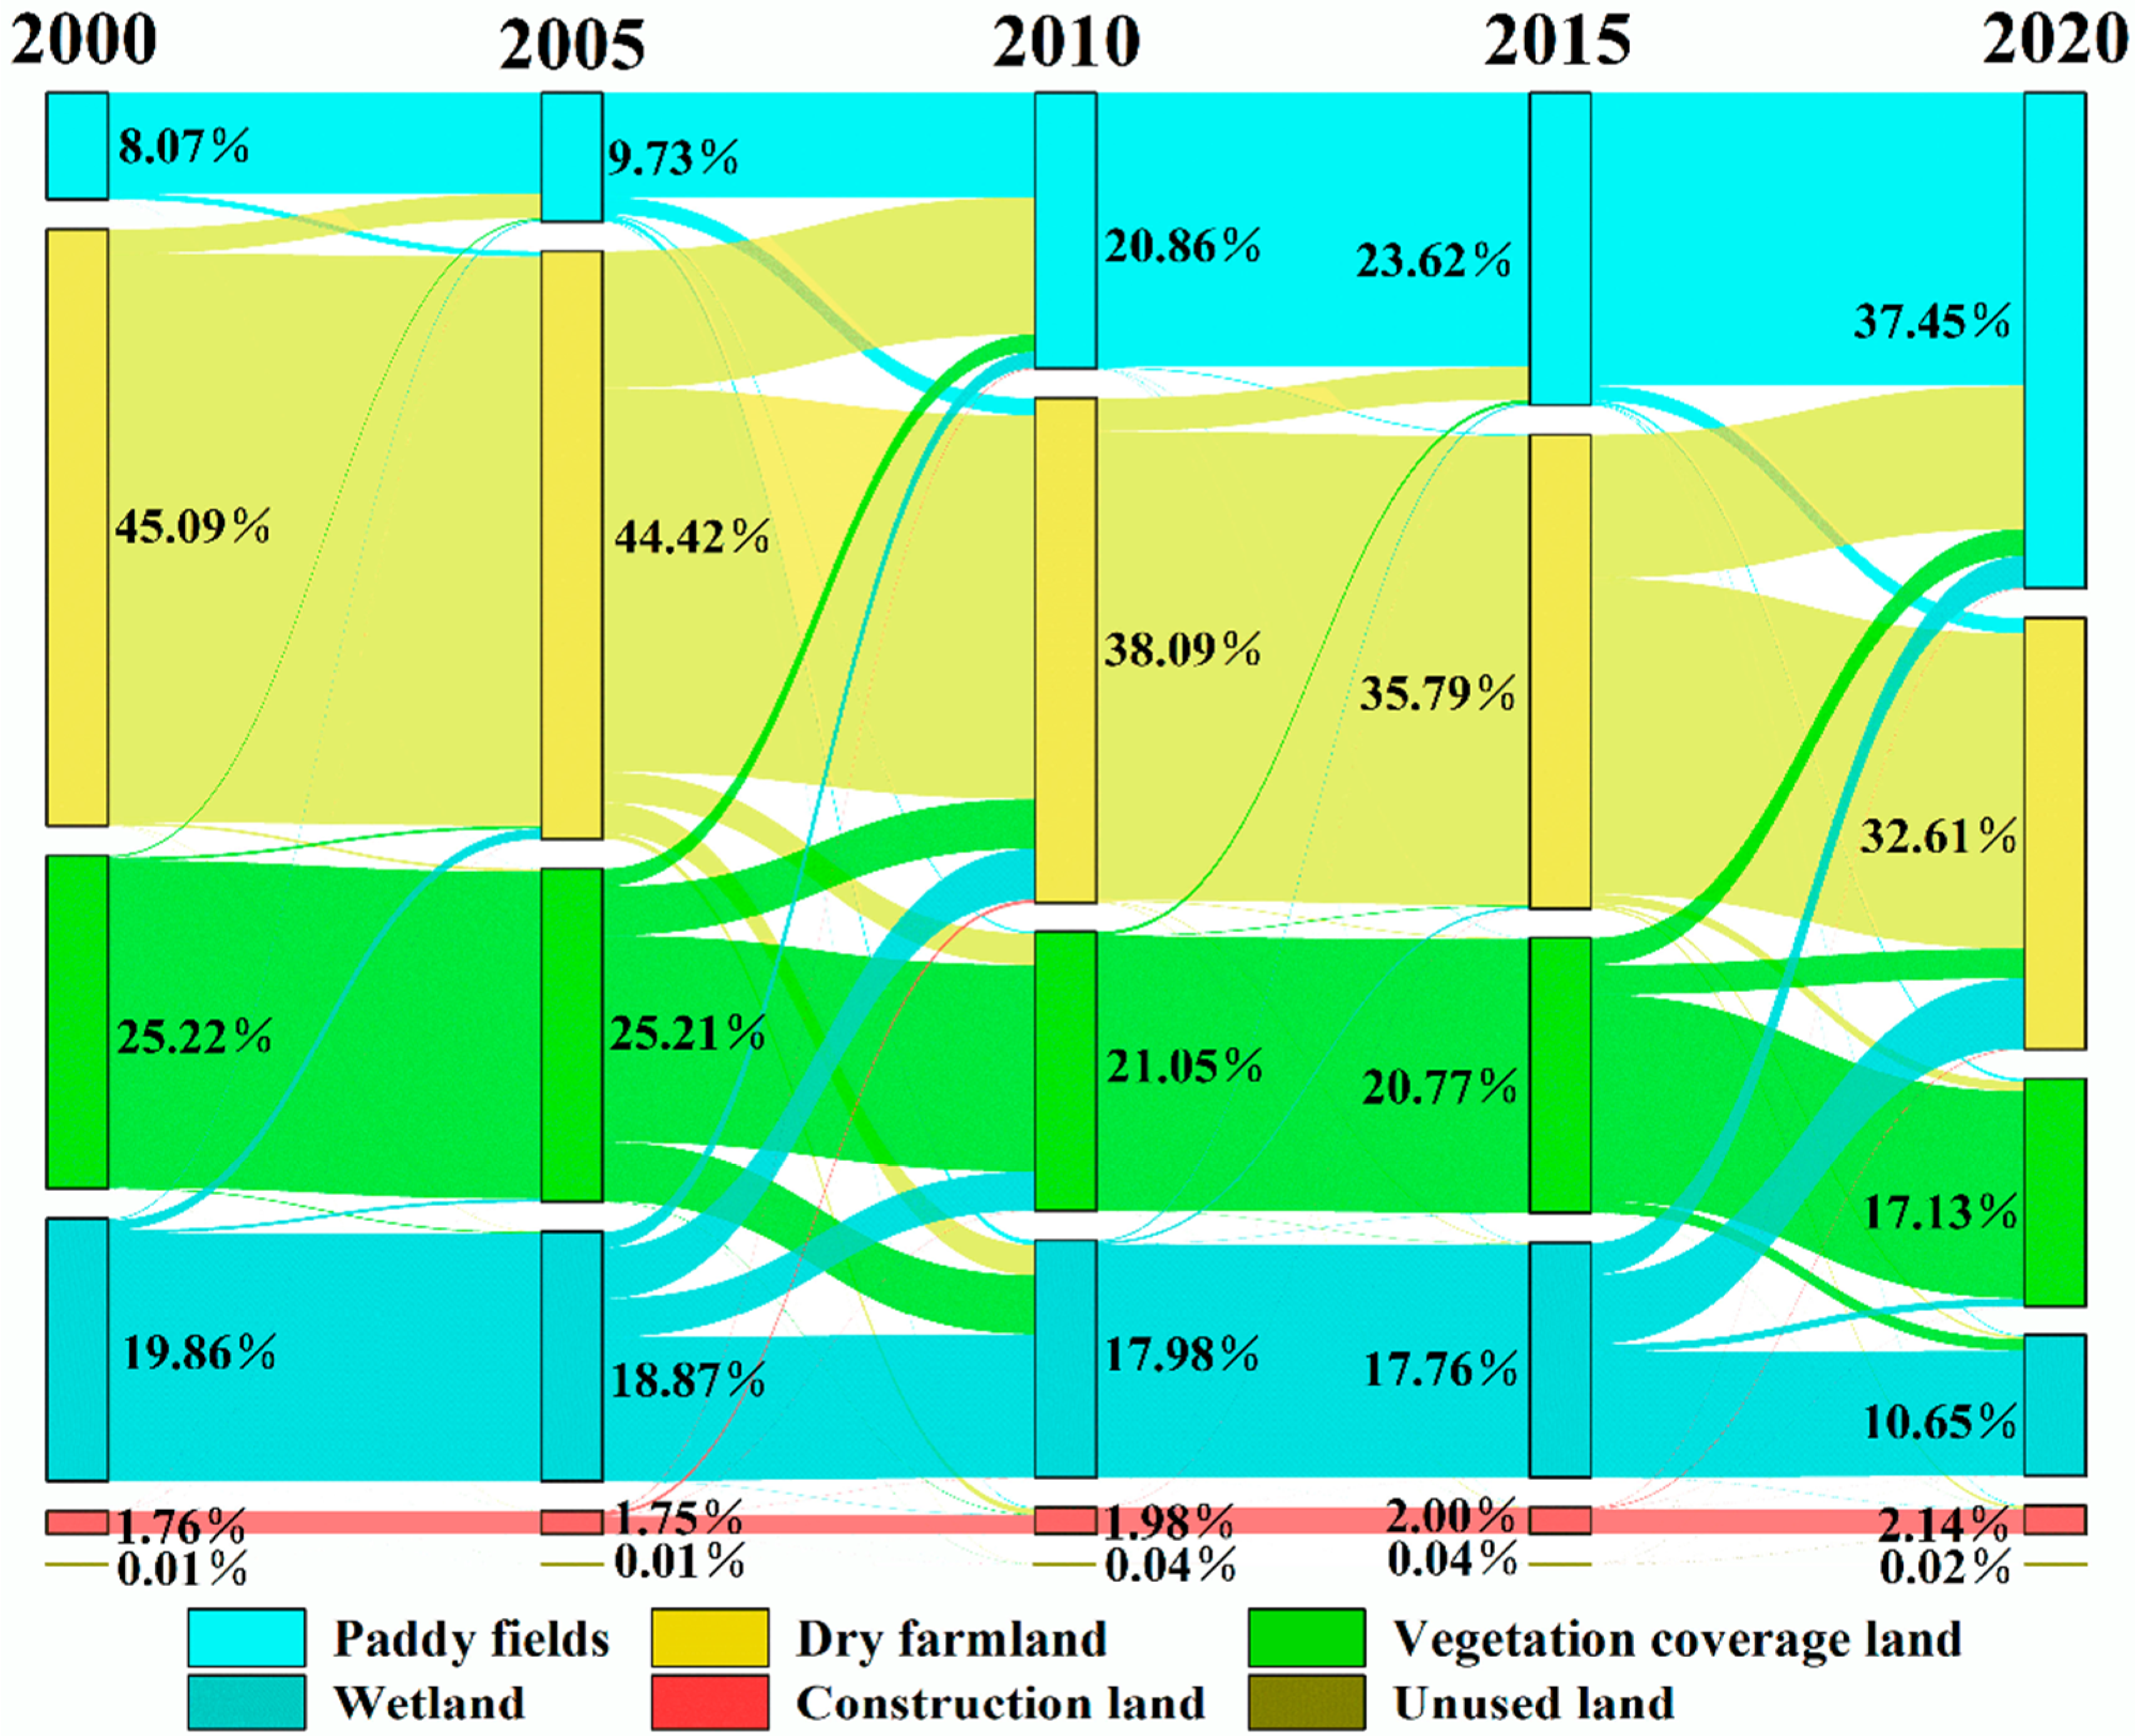
3.2. Land Use Analysis
3.3. Driver Analysis
3.3.1. Analysis of Single Factor Detection Results
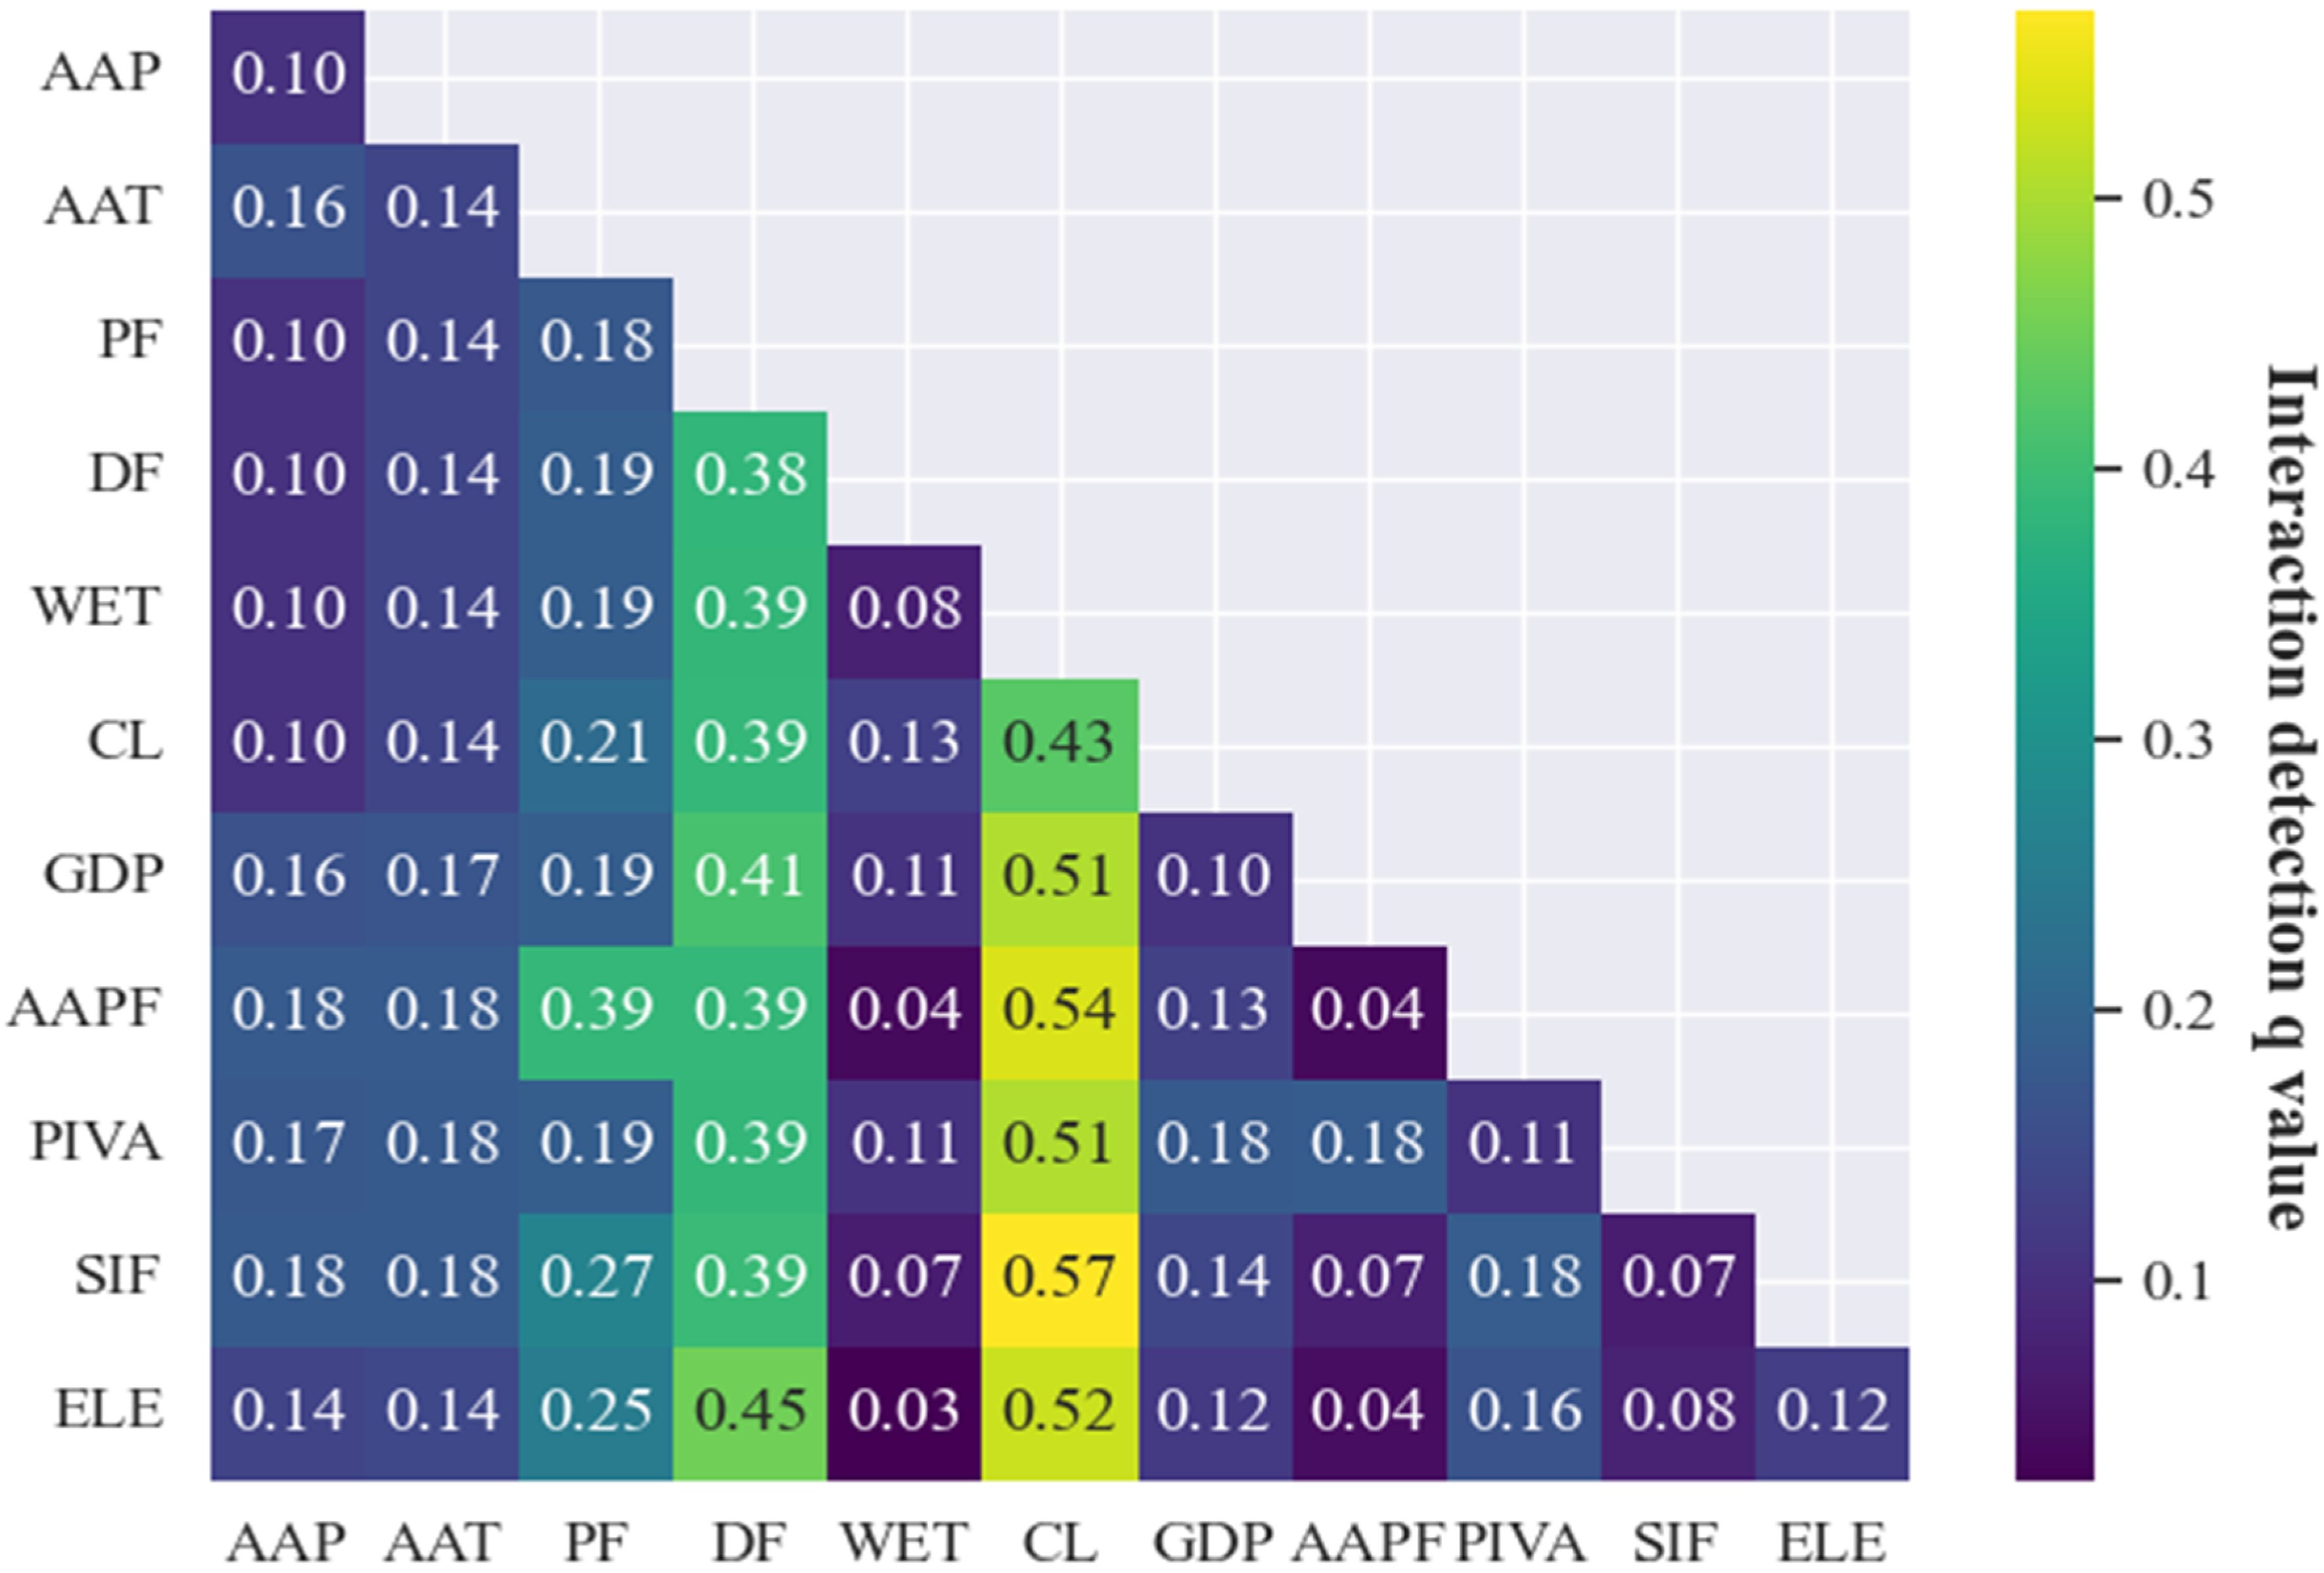
3.3.2. Detection of Factor Interactions
4. Discussion
5. Conclusions
- (1)
- In the past two decades, the vegetation coverage in Jiamusi City, China, has significantly shrunk. This reduction can be attributed to land degradation, intensified farming, and changes in land use patterns. The spatial distribution of vegetation cover in the urban core area has become more concentrated, while the fragmentation in the surrounding areas has intensified.
- (2)
- The results of the Geodetector analysis indicate that climate change, temperature, and precipitation in Jiamusi City have some impact on vegetation coverage, but compared to the influence of human activities, these natural factors play a relatively smaller role. In particular, changes in land use, habitat destruction caused by human activities, and the expansion of construction land have had a significant impact on the reduction of vegetation coverage.
- (3)
- Compared to other similar studies, this research had a specific focus on the Jiamusi region. While these results provide a unique perspective on specific phenomena in this area, they do not constitute a groundbreaking contribution. Rather, they can be seen as a piece of a broader research puzzle, aligning with other studies and providing additional context and understanding for the field. This approach not only promotes a more comprehensive understanding of vegetation coverage changes but also offers important references for future ecological conservation and land use policies.
Author Contributions
Funding
Data Availability Statement
Conflicts of Interest
References
- Li, J.; Wang, J.L.; Zhang, J.; Liu, C.L.; He, S.L.; Liu, L.F. Growing-season vegetation coverage patterns and driving factors in the China-Myanmar Economic Corridor based on Google Earth Engine and geographic detector. Ecol. Indic. 2022, 136, 108620. [Google Scholar] [CrossRef]
- Li, J.; Wang, J.L.; Zhang, J.; Zhang, J.P.; Kong, H. Dynamic changes of vegetation coverage in China-Myanmar economic corridor over the past 20 years. Int. J. Appl. Earth Obs. Geoinf. 2021, 102, 102378. [Google Scholar] [CrossRef]
- Yao, R.; Cao, J.; Wang, L.C.; Zhang, W.W.; Wu, X.J. Urbanization effects on vegetation cover in major African cities during 2001–2017. Int. J. Appl. Earth Obs. Geoinf. 2019, 75, 44–53. [Google Scholar] [CrossRef]
- Myeong, S.; Nowak, D.J.; Duggin, M.J. A temporal analysis of urban forest carbon storage using remote sensing. Remote Sens. Environ. 2006, 101, 277–282. [Google Scholar] [CrossRef]
- Zhang, B.; Yang, Y.-S.; Zepp, H. Effect of vegetation restoration on soil and water erosion and nutrient losses of a severely eroded clayey Plinthudult in southeastern China. CATENA 2004, 57, 77–90. [Google Scholar] [CrossRef]
- Fang, C.-F.; Ling, D.-L. Investigation of the noise reduction provided by tree belts. Landsc. Urban Plan. 2003, 63, 187–195. [Google Scholar] [CrossRef]
- Wang, Z.R.; Niu, D.C.; Hu, Y.G.; Wang, Y.S.; Huang, L.; Liu, Y.B. Changes in soil phosphorus fractions associated with altered vegetation and edaphic conditions across a chronosequSence of revegetated dunes in a desert area. Geoderma 2022, 424, 115995. [Google Scholar] [CrossRef]
- Linden, J.; Gustafsson, M.; Uddling, J.; Watne, A.; Pleijel, H. Air pollution removal through deposition on urban vegetation: The importance of vegetation characteristics. Urban For. Urban Green. 2023, 81, 127843. [Google Scholar] [CrossRef]
- Cai, M.; Xin, Z.; Yu, X. Spatio-temporal variations in PM leaf deposition: A meta-analysis. Environ. Pollut. 2017, 231, 207–218. [Google Scholar] [CrossRef]
- Megahed, Y.; Cabral, P.; Silva, J.; Caetano, M. Land Cover Mapping Analysis and Urban Growth Modelling Using Remote Sensing Techniques in Greater Cairo Region-Egypt. ISPRS Int. J. Geo-Inf. 2015, 4, 1750–1769. [Google Scholar] [CrossRef]
- Kong, Z.; Ling, H.; Deng, M.; Han, F.; Yan, J.; Deng, X.; Wang, Z.; Ma, Y.; Wang, W. Past and projected future patterns of fractional vegetation coverage in China. Sci. Total Environ. 2023, 902, 166133. [Google Scholar] [CrossRef] [PubMed]
- Zuo, Y.F.; Li, Y.H.; He, K.N.; Wen, Y.S. Temporal and spatial variation characteristics of vegetation coverage and quantitative analysis of its potential driving forces in the Qilian Mountains, China, 2000–2020. Ecol. Indic. 2022, 143, 109429. [Google Scholar] [CrossRef]
- Zhu, J.; Zhu, C.; Lu, D.; Wang, G.G.; Zheng, X.; Cao, J.; Zhang, J. Regeneration and succession: A 50-year gap dynamic in temperate secondary forests, Northeast China. For. Ecol. Manag. 2021, 484, 118943. [Google Scholar] [CrossRef]
- Gu, Z.; Duan, X.; Shi, Y.; Li, Y.; Pan, X. Spatiotemporal variation in vegetation coverage and its response to climatic factors in the Red River Basin, China. Ecol. Indic. 2018, 93, 54–64. [Google Scholar] [CrossRef]
- Piao, S.; Cui, M.; Chen, A.; Wang, X.; Ciais, P.; Liu, J.; Tang, Y. Altitude and temperature dependence of change in the spring vegetation green-up date from 1982 to 2006 in the Qinghai-Xizang Plateau. Agric. For. Meteorol. 2011, 151, 1599–1608. [Google Scholar] [CrossRef]
- Sun, H.; Wang, C.; Niu, Z. Analysis of the Vegetation Cover Change and the Relationship between NDVI and Environmental Factors by Using NOAA Time Series Data. J. Remote Sens. 1998, 266, 153–161. [Google Scholar]
- Dong, Q.M.; Zhao, X.Q.; Wu, G.L.; Shi, J.J.; Ren, G.H. A review of formation mechanism and restoration measures of “black-soil-type” degraded grassland in the Qinghai-Tibetan Plateau. Environ. Earth Sci. 2013, 70, 2359–2370. [Google Scholar] [CrossRef]
- He, H.S.; Hao, Z.; Mladenoff, D.J.; Shao, G.; Hu, Y.; Chang, Y. Simulating forest ecosystem response to climate warming incorporating spatial effects in north-eastern China. J. Biogeogr. 2005, 32, 2043–2056. [Google Scholar] [CrossRef]
- Li, G.Q.; Bai, F.; Sang, W.G. Different responses of radial growth to climate warming in Pinus koraiensis and Picea jezoensis var. komarovii at their upper elevational limits in Changbai Mountain, China. Chin. J. Plant Ecol. 2011, 35, 500–511. [Google Scholar] [CrossRef]
- Chen, Q.; Zhou, Q.; Zhang, H.F.; Liu, F.G. Spatial disparity of NDVI response in vegetation growing season to climate change in the Three-River Headwaters Region. Ecol. Environ. Sci. 2010, 19, 1284–1289. [Google Scholar]
- Sun, R.; Liu, C.M.; Zhu, Q.J. Relationship Between the Fractional Vegetation Cover Change and Rainfall in the Yellow River Basin. Acta Geogr. Sin. 2001, 56, 672–680. [Google Scholar]
- Wang, Y.; Chen, X.; Gao, M.; Dong, J. The use of random forest to identify climate and human interference on vegetation coverage changes in southwest China. Ecol. Indic. 2022, 144, 109463. [Google Scholar] [CrossRef]
- Zhuang, L.; Axmacher, J.C.; Sang, W. Different radial growth responses to climate warming by two dominant tree species at their upper altitudinal limit on Changbai Mountain. J. For. Res. 2017, 28, 795–804. [Google Scholar] [CrossRef]
- Hao, J.; Xu, G.; Luo, L.; Zhang, Z.; Li, H. Quantifying the relative contribution of natural and human factors to vegetation coverage variation in coastal wetlands in China. CATENA 2020, 188, 104429. [Google Scholar] [CrossRef]
- Yang, S.; Song, S.; Li, F.; Yu, M.; Yu, G.; Zhang, Q.; Cui, H.; Wang, R.; Wu, Y. Vegetation coverage changes driven by a combination of climate change and human activities in Ethiopia, 2003–2018. Ecol. Inform. 2022, 71, 101776. [Google Scholar] [CrossRef]
- Wang, Y.M.; Zhang, Z.X.; Chen, X. Quantifying Influences of Natural and Anthropogenic Factors on Vegetation Changes Based on Geodetector: A Case Study in the Poyang Lake Basin, China. Remote Sens. 2021, 13, 5081. [Google Scholar] [CrossRef]
- Ren, D.; Envelope, A.C.P. Analysis of the heterogeneity of landscape risk evolution and driving factors based on a combined GeoDa and Geodetector model. Ecol. Indic. 2022, 144, 109568. [Google Scholar] [CrossRef]
- Zhai, H.; Lv, C.; Liu, W.; Yang, C.; Fan, D.; Wang, Z.; Guan, Q. Understanding Spatio-Temporal Patterns of Land Use/Land Cover Change under Urbanization in Wuhan, China, 2000–2019. Remote Sens. 2021, 13, 3331. [Google Scholar] [CrossRef]
- Long, X.; Lin, H.; An, X.; Chen, S.; Qi, S.; Zhang, M. Evaluation and analysis of ecosystem service value based on land use/cover change in Dongting Lake wetland. Ecol. Indic. 2022, 136, 108619. [Google Scholar] [CrossRef]
- Qiao, Y.; Wang, X.; Han, Z.; Tian, M.; Wang, Q.; Wu, H.; Liu, F. Geodetector based identification of influencing factors on spatial distribution patterns of heavy metals in soil: A case in the upper reaches of the Yangtze River, China. Appl. Geochem. 2022, 146, 105459. [Google Scholar] [CrossRef]
- Wang, J.; Xu, C. Geodetector: Principle and prospective. Acta Geogr. Sin. 2017, 72, 116–134. [Google Scholar]
- Chen, S.T.; Guo, B.; Zhang, R.; Zang, W.Q.; Wei, C.X.; Wu, H.W.; Yang, X.; Zhen, X.Y.; Li, X.; Zhang, D.F.; et al. Quantitatively determine the dominant driving factors of the spatial-temporal changes of vegetation NPP in the Hengduan Mountain area during 2000–2015. J. Mt. Sci. 2021, 18, 427–445. [Google Scholar] [CrossRef]
- Xie, Y.; Sha, Z.; Yu, M. Remote sensing imagery in vegetation mapping: A review. J. Plant Ecol. 2008, 1, 9–23. [Google Scholar] [CrossRef]
- Valjarević, A.; Djekić, T.; Stevanović, V.; Ivanović, R.; Jandziković, B. GIS numerical and remote sensing analyses of forest changes in the Toplica region for the period of 1953–2013. Appl. Geogr. 2018, 92, 131–139. [Google Scholar] [CrossRef]
- Wang, Y.F.; Tan, L.; Wang, G.Y.; Sun, X.Y.; Xu, Y.N. Study on the Impact of Spatial Resolution on Fractional Vegetation Cover Extraction with Single-Scene and Time-Series Remote Sensing Data. Remote Sens. 2022, 14, 4165. [Google Scholar] [CrossRef]
- Andres, S.; Adrian, F.; Graciela, M. Assessing the Accuracy of Landsat Vegetation Fractional Cover for Monitoring Australian Drylands. Remote Sens. 2022, 14, 6322. [Google Scholar]
- Zhao, H.; He, H.; Wang, J.; Bai, C.; Zhang, C. Vegetation Restoration and Its Environmental Effects on the Loess Plateau. Sustainability 2018, 10, 4676. [Google Scholar] [CrossRef]
- Feng, L.L.; Jia, Z.Q.; Li, Q.X.; Zhao, A.Z.; Zhao, Y.L.; Zhang, Z.J. Spatiotemporal Change of Sparse Vegetation Coverage in Northern China. J. Indian Soc. Remote Sens. 2019, 47, 359–366. [Google Scholar] [CrossRef]
- Zhang, L.J.; Li, W.L.; Jiang, C.Y.; Zang, S.Y. Examining the century dynamic change of forest oxygen production in Heilongjiang Province, China. Int. J. Environ. Sci. Technol. 2015, 12, 4005–4016. [Google Scholar] [CrossRef][Green Version]
- Gao, J.; Liu, Y. Determination of land degradation causes in Tongyu County, Northeast China via land cover change detection. Int. J. Appl. Earth Obs. Geoinf. 2010, 12, 9–16. [Google Scholar] [CrossRef]
- Tian, J.; Wang, B.; Zhang, C.; Li, W.; Wang, S. Mechanism of regional land use transition in underdeveloped areas of China: A case study of northeast China. Land Use Policy 2020, 94, 104538. [Google Scholar] [CrossRef]
- Seifollahi-Aghmiuni, S.; Kalantari, Z.; Egidi, G.; Gaburova, L.; Salvati, L. Urbanisation-driven land degradation and socioeconomic challenges in peri-urban areas: Insights from Southern Europe. Ambio 2022, 51, 1446–1458. [Google Scholar] [CrossRef] [PubMed]
- Ranjan, A.K.; Gorai, A.K. Characterization of vegetation dynamics using MODIS satellite products over stone-mining dominated Rajmahal Hills in Jharkhand, India. Remote Sens. Appl. Soc. Environ. 2022, 27, 100802. [Google Scholar] [CrossRef]
- Ma, X.; Geng, Y.; Chen, X. Niche evaluation and evolution path selection of forestry enterprises in Northeast state-owned forest region. Glob. Nest J. 2020, 22, 511–521. [Google Scholar]
- Zhang, X.; Wang, W.C.; Fang, X.; Ye, Y.; Zheng, J. Vegetation of Northeast China during the late seventeenth to early twentieth century as revealed by historical documents. Reg. Environ. Chang. 2011, 11, 869–882. [Google Scholar] [CrossRef]
- Liu, D.; Wang, Z.; Song, K.; Zhang, B.; Hu, L.; Huang, N.; Zhang, S.; Luo, L.; Zhang, C.; Jiang, G. Land use/cover changes and environmental consequences in Songnen Plain, Northeast China. Chin. Geogr. Sci. Engl. 2009, 19, 299–305. [Google Scholar] [CrossRef]
- Nagendra, H.; Nagendran, S.; Paul, S.; Pareeth, S. Graying, greening and fragmentation in the rapidly expanding Indian city of Bangalore. Landsc. Urban Plan. 2012, 105, 400–406. [Google Scholar] [CrossRef]
- Bindajam, A.A.; Mallick, J.; Hang, H.T. Assessing landscape fragmentation due to urbanization in English Bazar Municipality, Malda, India, using landscape metrics. Environ. Sci. Pollut. Res. 2023, 30, 68716–68731. [Google Scholar] [CrossRef]
- Wu, H.F.; Zhang, J.Y.; Bao, Z.X.; Wang, G.Q.; Wang, W.S.; Yang, Y.Q.; Wang, J.; Kan, G.Y. The impacts of natural and anthropogenic factors on vegetation change in the Yellow-Huai-Hai River Basin. Front. Earth Sci. 2022, 10, 959403. [Google Scholar] [CrossRef]
- Jing, X.; Yao, W.Q.; Wang, J.H.; Song, X.Y. A study on the relationship between dynamic change of vegetation coverage and precipitation in Beijing’s mountainous areas during the last 20 years. Math. Comput. Model. Int. J. 2011, 54, 1079–1085. [Google Scholar] [CrossRef]
- Chen, M.H.; Zeng, S.D.; Jiang, B.; Wen, Z.F.; Wu, J.; Xia, J. The comprehensive evaluation of how water level fluctuation and temperature change affect vegetation cover variations at a lake of ecological importance (Poyang Lake), China. Ecol. Indic. 2023, 148, 110041. [Google Scholar] [CrossRef]
- Guo, B.; Wang, J.; Mantravadi, V.S.; Zhang, L.; Liu, G. Effect of climate and ecological restoration on vegetation changes in the “Three-River Headwaters” region based on remote sensing technology. Environ. Sci. Pollut. Res. 2022, 29, 16436–16448. [Google Scholar] [CrossRef] [PubMed]
- Loh, P.S.; Alnoor, I.M.; He, S. Impact of Climate Change on Vegetation Cover at South Port Sudan Area. Climate 2020, 8, 114. [Google Scholar] [CrossRef]
- Li, Y.; Zheng, Z.; Qin, Y.; Rong, P. Relative contributions of natural and man-made factors to vegetation cover change of environmentally sensitive and vulnerable areas of China. J. Clean. Prod. 2021, 321, 128917. [Google Scholar] [CrossRef]
- Bai, H.; Li, L.; Wu, Y.; Feng, G.; Gong, Z.; Sun, G. Identifying Critical Meteorological elements for vegetation coverage change in China. Front. Phys. 2022, 10, 3. [Google Scholar] [CrossRef]
- Liu, H.; Zheng, L.; Liao, M. Dynamics of Vegetation Change and Its Relationship with Nature and Human Activities—A Case Study of Poyang Lake Basin, China. J. Sustain. For. 2020, 40, 47–67. [Google Scholar] [CrossRef]
- Li, J.; Peng, S.; Li, Z. Detecting and attributing vegetation changes on China’s Loess Plateau. Agric. For. Meteorol. 2017, 247, 260–270. [Google Scholar] [CrossRef]
- Zhang, M.; Wang, J.M.; Li, S.J. Tempo-spatial changes and main anthropogenic influence factors of vegetation fractional coverage in a large-scale opencast coal mine area from 1992 to 2015. J. Clean. Prod. 2019, 232, 940–952. [Google Scholar] [CrossRef]
- Jian, S.Q.; Zhang, Q.K.; Wang, H.L. Spatial-Temporal Trends in and Attribution Analysis of Vegetation Change in the Yellow River Basin, China. Remote Sens. 2022, 14, 4607. [Google Scholar] [CrossRef]
- Liu, B.; Pan, L.B.; Qi, Y.; Guan, X.; Li, J.S. Land Use and Land Cover Change in the Yellow River Basin from 1980 to 2015 and Its Impact on the Ecosystem Services. Land 2021, 10, 1080. [Google Scholar] [CrossRef]


| Comparative Result | Interaction Type |
|---|---|
| Nonlinearity attenuation | |
| One-factor nonlinearity attenuation | |
| Two-factor enhancement | |
| Mutually independent | |
| Nonlinear enhancement |
| Factor of Influence | Unit |
|---|---|
| Average annual precipitation (AAP) | mm |
| Annual average temperature (AAT) | °C |
| Paddy fields (PF) | km2 |
| Dry farmland (DF) | km2 |
| Wetland (WET) | km2 |
| Construction land (CL) | km2 |
| GDP growth (GDP) | 104 CNY/km2 |
| Average annual population fluctuation (AAPF) | Person/km2 |
| Primary industry valued added (PIVA) | 104 CNY/km2 |
| Secondary industry fluctuation (SIF) | 104 CNY/km2 |
| Elevation (ELE) | m |
| Years | Paddy Fields (PF) | Dry Farmland (DF) | Vegetation Coverage Land (VCL) | Wetland (WET) | Construction Land (CL) | Unused Land (UL) |
|---|---|---|---|---|---|---|
| 2000–2005 | 0.04115 | −0.00298 | −0.00004 | −0.00992 | −0.00008 | 0.01777 |
| 2005–2010 | 0.22875 | −0.02848 | −0.03302 | −0.00941 | 0.02516 | 0.29607 |
| 2010–2015 | 0.02639 | −0.01208 | −0.00260 | −0.00241 | 0.00288 | 0.04993 |
| 2015–2020 | 0.11714 | −0.01780 | −0.03507 | −0.08013 | 0.01366 | −0.10840 |
| 2000–2020 | 0.36399 | −0.02768 | −0.03206 | −0.04638 | 0.02195 | 0.05456 |
| Factor of Influence | q Statistic |
|---|---|
| Average annual precipitation (AAP) | 0.10210 |
| Annual average temperature (AAT) | 0.13669 |
| Paddy fields (PF) | 0.17565 |
| Dry farmland (DF) | 0.38365 |
| Wetland (WET) | 0.07565 |
| Construction land (CL) | 0.42897 |
| GDP growth (GDP) | 0.10459 |
| Average annual population fluctuation (AAPF) | 0.03837 |
| Primary industry valued added (PIVA) | 0.10512 |
| Secondary industry fluctuation (SIF) | 0.06889 |
| Elevation (ELE) | 0.12431 |
Disclaimer/Publisher’s Note: The statements, opinions and data contained in all publications are solely those of the individual author(s) and contributor(s) and not of MDPI and/or the editor(s). MDPI and/or the editor(s) disclaim responsibility for any injury to people or property resulting from any ideas, methods, instructions or products referred to in the content. |
© 2023 by the authors. Licensee MDPI, Basel, Switzerland. This article is an open access article distributed under the terms and conditions of the Creative Commons Attribution (CC BY) license (https://creativecommons.org/licenses/by/4.0/).
Share and Cite
Wang, M.; Wang, Y.; Li, Z.; Zhang, H. Analysis of Spatial-Temporal Changes and Driving Factors of Vegetation Coverage in Jiamusi City. Forests 2023, 14, 1902. https://doi.org/10.3390/f14091902
Wang M, Wang Y, Li Z, Zhang H. Analysis of Spatial-Temporal Changes and Driving Factors of Vegetation Coverage in Jiamusi City. Forests. 2023; 14(9):1902. https://doi.org/10.3390/f14091902
Chicago/Turabian StyleWang, Meibo, Yingbin Wang, Zhijun Li, and Hengfei Zhang. 2023. "Analysis of Spatial-Temporal Changes and Driving Factors of Vegetation Coverage in Jiamusi City" Forests 14, no. 9: 1902. https://doi.org/10.3390/f14091902
APA StyleWang, M., Wang, Y., Li, Z., & Zhang, H. (2023). Analysis of Spatial-Temporal Changes and Driving Factors of Vegetation Coverage in Jiamusi City. Forests, 14(9), 1902. https://doi.org/10.3390/f14091902