Article

Spatiotemporal Analysis of Vegetation Cover in Relation to Its Driving Forces in Qinghai–Tibet Plateau

1
School of Engineering, Tibet University, Lhasa 850032, China
2
Joint Laboratory of Remote Sensing Monitoring of Plateau Surface Environment, Lhasa 850032, China
*
Author to whom correspondence should be addressed.
Forests 2023, 14(9), 1835; https://doi.org/10.3390/f14091835
Submission received: 14 August 2023 / Revised: 6 September 2023 / Accepted: 7 September 2023 / Published: 9 September 2023

Abstract

:
The Tibet Plateau of Qinghai supports complex vegetation types that are ecologically fragile and sensitive to climatic factors. Therefore, it is important to understand the changes in vegetation and the factors responsible for these changes and to maintain the ecosystem balance and promote sustainable development in the region. Therefore, this paper is based on annual SPOT/VEG NDVI (Normalized Difference Vegetation Index) data, land use data, topographic data, temperature data, and precipitation data from 1999 to 2019. The spatiotemporal variation in the NDVI over the Tibetan Plateau in the last 21 years and its response to different driving factors were investigated by using the Theil–Sen slope method, Mann–Kendall test, partial correlation analysis, and geographical detector method. The results showed that (1) the vegetation coverage on the Qinghai–Tibet Plateau showed an increasing trend from 1999 to 2019, with increases in approximately 67.00% of the plateau area. (2) The spatial differences in vegetation coverage were large; notably, low-density vegetation areas decreased obviously, moderate-density vegetation areas accounted for approximately 50% of the total area, high-density vegetation areas were the least common, and the overall growth rate was significant. (3) The NDVI was positively correlated with temperature and precipitation, and a positive correlation was observed in more than 66% of the region. (4) The order of the influence of single driving factors on the NDVI was as follows: precipitation > soil type > altitude > temperature > gradient > slope > population density > GDP. (5) The combined effect of the factors was significantly higher than that of single driving factors, with a notable nonlinear influence. The interactions between meteorological factors, such as precipitation, and topographic factors, such as altitude, were important, with a q-value over 0.79. The results of this study provide some methodological support for the ecological conservation of the Tibetan Plateau, and at the same time establish a scientific and reasonable strategy for vegetation restoration.

1. Introduction

In recent years, with the intensification of global climate change, the impact on terrestrial ecosystems and the corresponding feedback have become popular research topics. Vegetation, as an important component of ecosystems, links soil, the atmosphere, and moisture through energy transfer and material transformation and can be indicative of global changes to a certain extent [1,2]. The Normalized Difference Vegetation Index is an important indicator used to characterize the growth status and quality of vegetation communities, and it is an effective indicator that can quantitatively characterize the growth status of vegetation [3]. At present, scholars around the world have performed extensive research on the characteristics of vegetation change and the corresponding response to climate change using the NDVI.
The Qinghai–Tibet Plateau is the largest plateau in the world and has the highest average altitude of any area on Earth, known as the “roof of the world” and the “third pole of the Earth”; its unique geographical location and complex natural environment make it the largest ecologically fragile area in China, as well as an area highly sensitive to climate change in Asia and even the Northern Hemisphere [4,5]. The Qinghai–Tibet Plateau, with its complex and diverse vegetation types, undulating terrain, and low and relatively concentrated disturbances by human activities, is an ideal site for studying vegetation cover changes and the corresponding response to climate change [6]. However, with the expansion of towns, population migration, livestock development, and ecological construction on the Tibetan Plateau in recent years, the impact of human activities on vegetation of the plateau has been increasing [7], and large anthropogenic changes in land cover types may alter the way vegetation responds to climate variations [8]. Therefore, an increasing number of scholars has started to explore the response of vegetation to human activities and quantified and determined the relative effects of climate change and human activities on vegetation changes.
In previous studies on the relationship between the NDVI and various drivers, scholars [9,10,11,12] first mainly used correlation coefficients to reflect the spatial and temporal correlations between the NDVI and temperature and precipitation, and a few researchers considered the indirect effects of interactions between climate factors on vegetation changes [13,14]; in these studies, partial or complex correlation coefficients were used to analyze the direct and indirect effects of temperature and precipitation on vegetation changes, but no specific magnitude of the driving forces of vegetation change influenced by meteorological factors was obtained. Over time, multiple linear regression [15], artificial neural networks [16], support vector machine models [17], geographically weighted regression [18], residual analysis [19,20], and geographic probes [21,22] have been gradually applied to quantify the effects of temperature, precipitation, land use type, elevation, population, GDP, and other factors on the NDVI [23]. Although previous studies identified the characteristics of vegetation cover changes on the Tibetan Plateau and the corresponding response to climate factors to a certain extent, the influence of climate factors on NDVI changes was not considered. Moreover, the influence of other factors, such as human activities and topographic factors, on vegetation has not been comprehensively studied.
In view of these research gaps, the spatial and temporal variation characteristics of the NDVI on the Tibetan Plateau from 1999 to 2019 are investigated in this paper based on SPOT/VEG NDVI data, land use data, topographic data, and climate data from 1999 to 2019, supplemented by the Theil–Sen slope method and Mann–Kendall test. The aim is to answer the following questions: (1) What are the dynamic spatial and temporal trends of vegetation cover on the Tibetan Plateau over the period 1999–2019? (2) What is the degree of response of the annual mean NDVI to natural factors and human activities, and how do the interactions among different factors affect vegetation growth on the Tibetan Plateau?

2. Data Sources and Research Methods

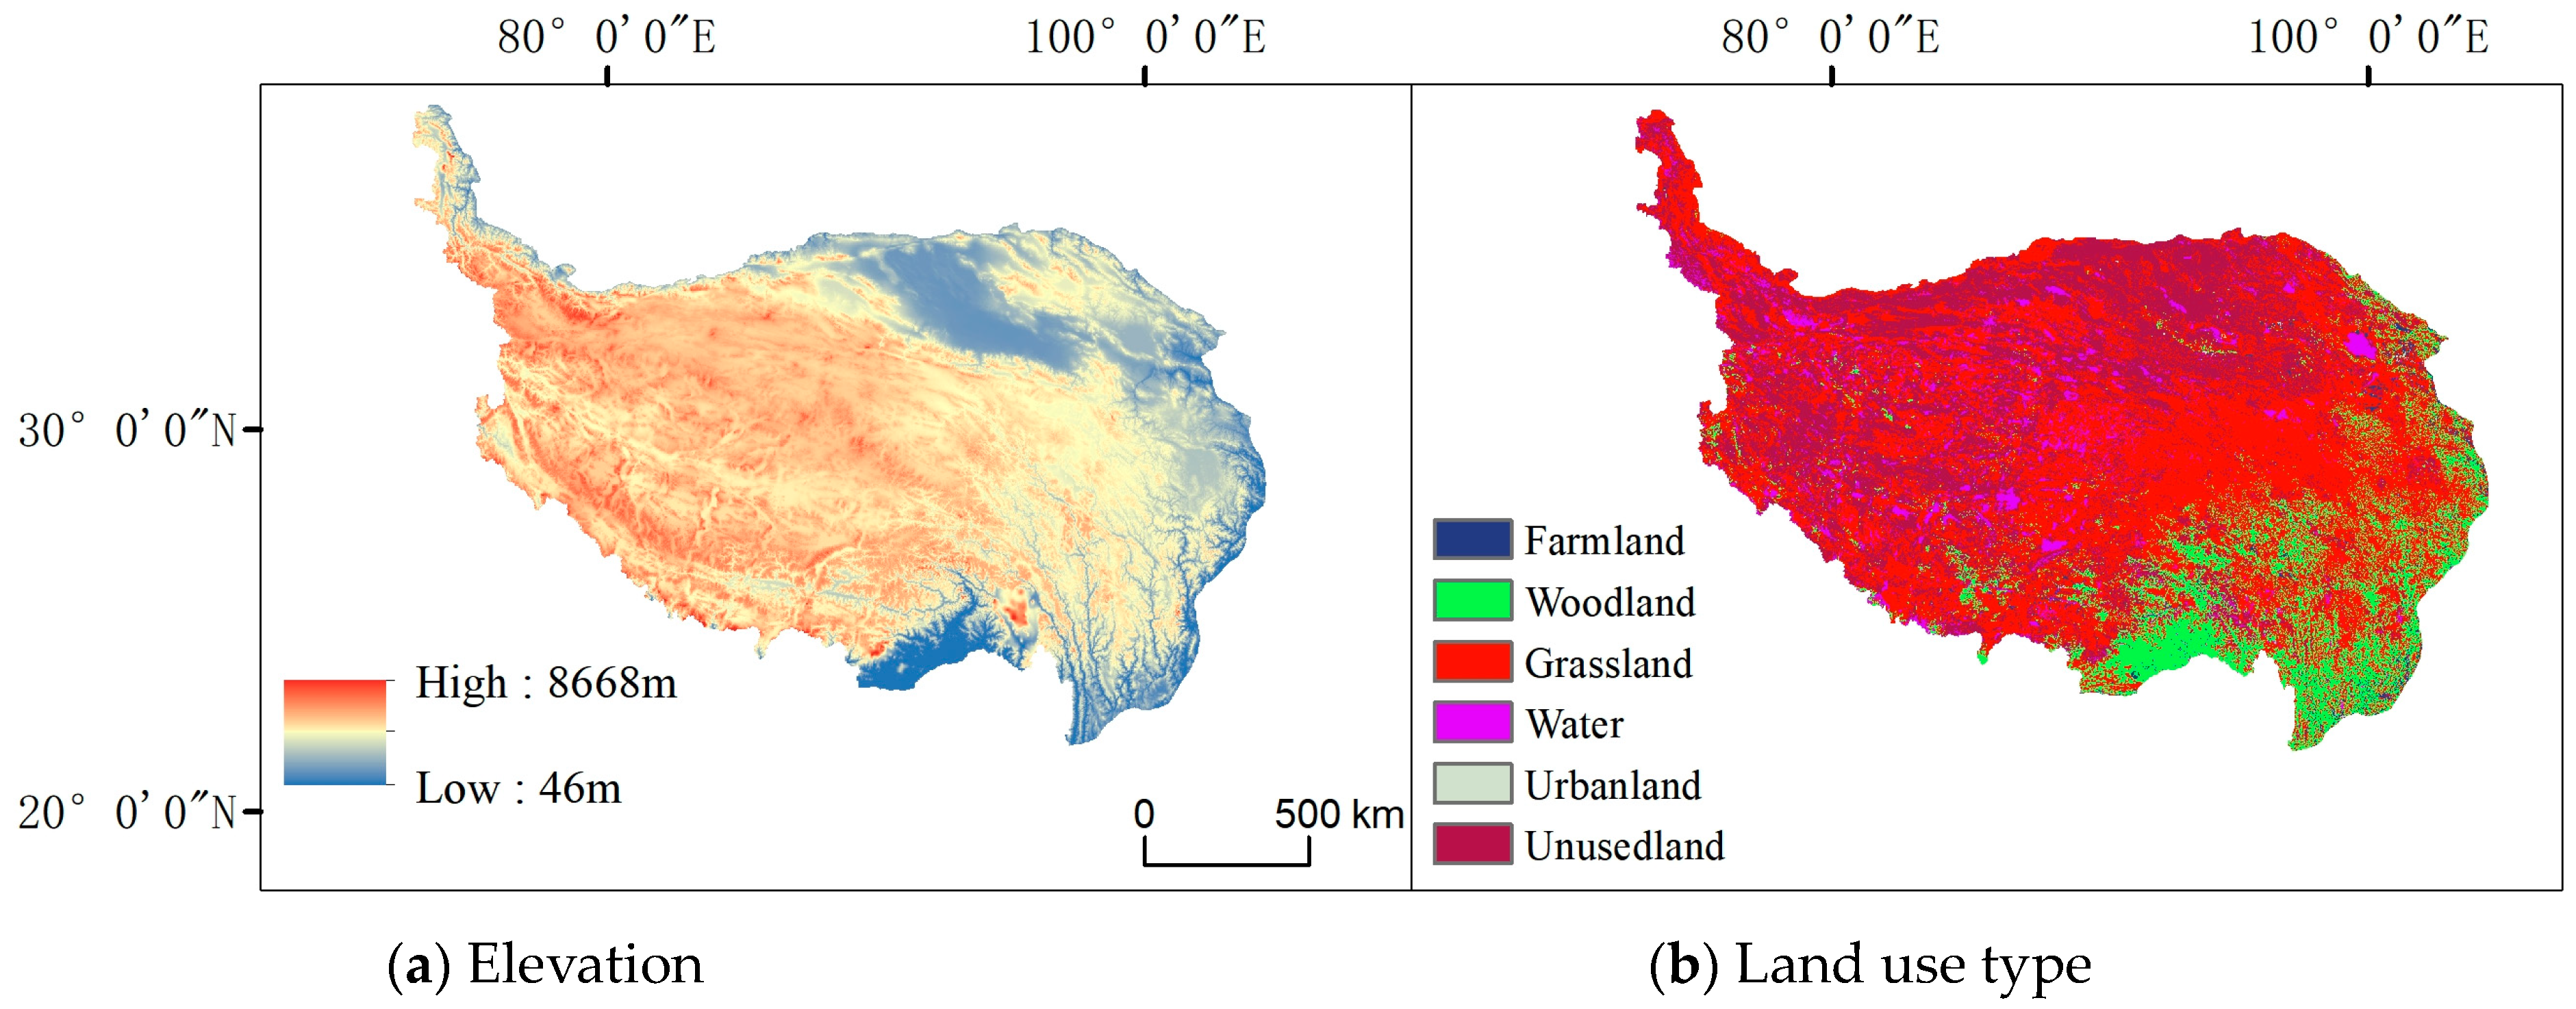
2.1. Study Area Overview

The Qinghai–Tibet Plateau is in Southwest China, from the northern foot of the West Kunlun Mountain–Qilian Mountain Range in the north to the southern foot of the Himalayas and other mountain ranges in the south and from the Hengduan Mountains in the east to the Pamir Plateau in the west. The plateau covers an area from 26°00′12″–39°46′50″ N and 73°18′52″–104°46′59″ E, with an average altitude of 4400 m. The region spans six provinces, namely, Tibet, Xinjiang, Qinghai, Gansu, Yunnan, and Sichuan, and covers a total area of approximately 2.57 million km2, which is 26.8% of the total land area of the country [24]. Due to the unique geographical characteristics of this region, the climate is warm and humid in the southeast and dry and cold in the northwest, with a typical plateau climate, characterized by a dry and clean atmosphere, strong solar radiation, low temperatures, large diurnal temperature differences, small annual variations in major climate factors, low precipitation, and significant differences between seasons. The climate and topography of the Qinghai–Tibet Plateau are characterized by certain longitudinal geographical differences, and the temperature and precipitation generally decrease as the elevation gradually increases from east to west. The land use types in the region are grassland, unused land without any vegetation cover, and forestland, in descending order of abundance, accounting for 48.5%, 32.0%, and 13.2% of the total area of the region, respectively, with water, arable land, and urban land mixed among them (Figure 1).

2.2. Data Sources

2.2.1. NDVI Data

NDVI data were obtained from the Resource and Environment Science and Data Center of the Chinese Academy of Sciences (http://www.resdc.cn). (accessed on 1 July 2023). The annual vegetation index (NDVI) spatial distribution dataset in China was based on a continuous time series of SPOT/VEGETATION NDVI satellite remote sensing data. The product uses the maximum value synthesis method to obtain the NDVI value of each image element, maximizing the removal of the influence of clouds, and generating an annual vegetation index dataset at 1 km resolution since 1998 [25]. For the obtained NDVI data, simple preprocessing was performed, and the year-by-year vegetation index NDVI dataset was calculated based on mask-based cropping in ArcGIS 10.8 and the vector boundary of the Tibetan Plateau using a raster calculator.

2.2.2. Climate Data

The temperature and precipitation data were obtained from the monthly average temperature and precipitation datasets for China from January 1901 to December 2022 provided by the National Earth System Science Data Center (http://www.geodata.cn). (accessed on 1 July 2023), with a spatial resolution of approximately 1 km. This dataset was generated with the Delta spatial downscaling scheme in the Chinese region based on the global 0.5° climate data released by the CRU and the global high-resolution climate data released by WorldClim [26]. The data were validated with data from 496 independent meteorological observation points, and the validation results were deemed to be accurate. The dataset was preprocessed by using ArcGIS 10.8 software to mask, crop, resample, and reproject the mean temperature and rainfall data based on the vector boundary of the Tibetan Plateau to obtain a raster image dataset of year-by-year mean temperature and rainfall with the same image size and coordinate system as the NDVI data. Then, MATLAB R2022b software was used to analyze the Pearson correlations among variables and significance of the raster data.

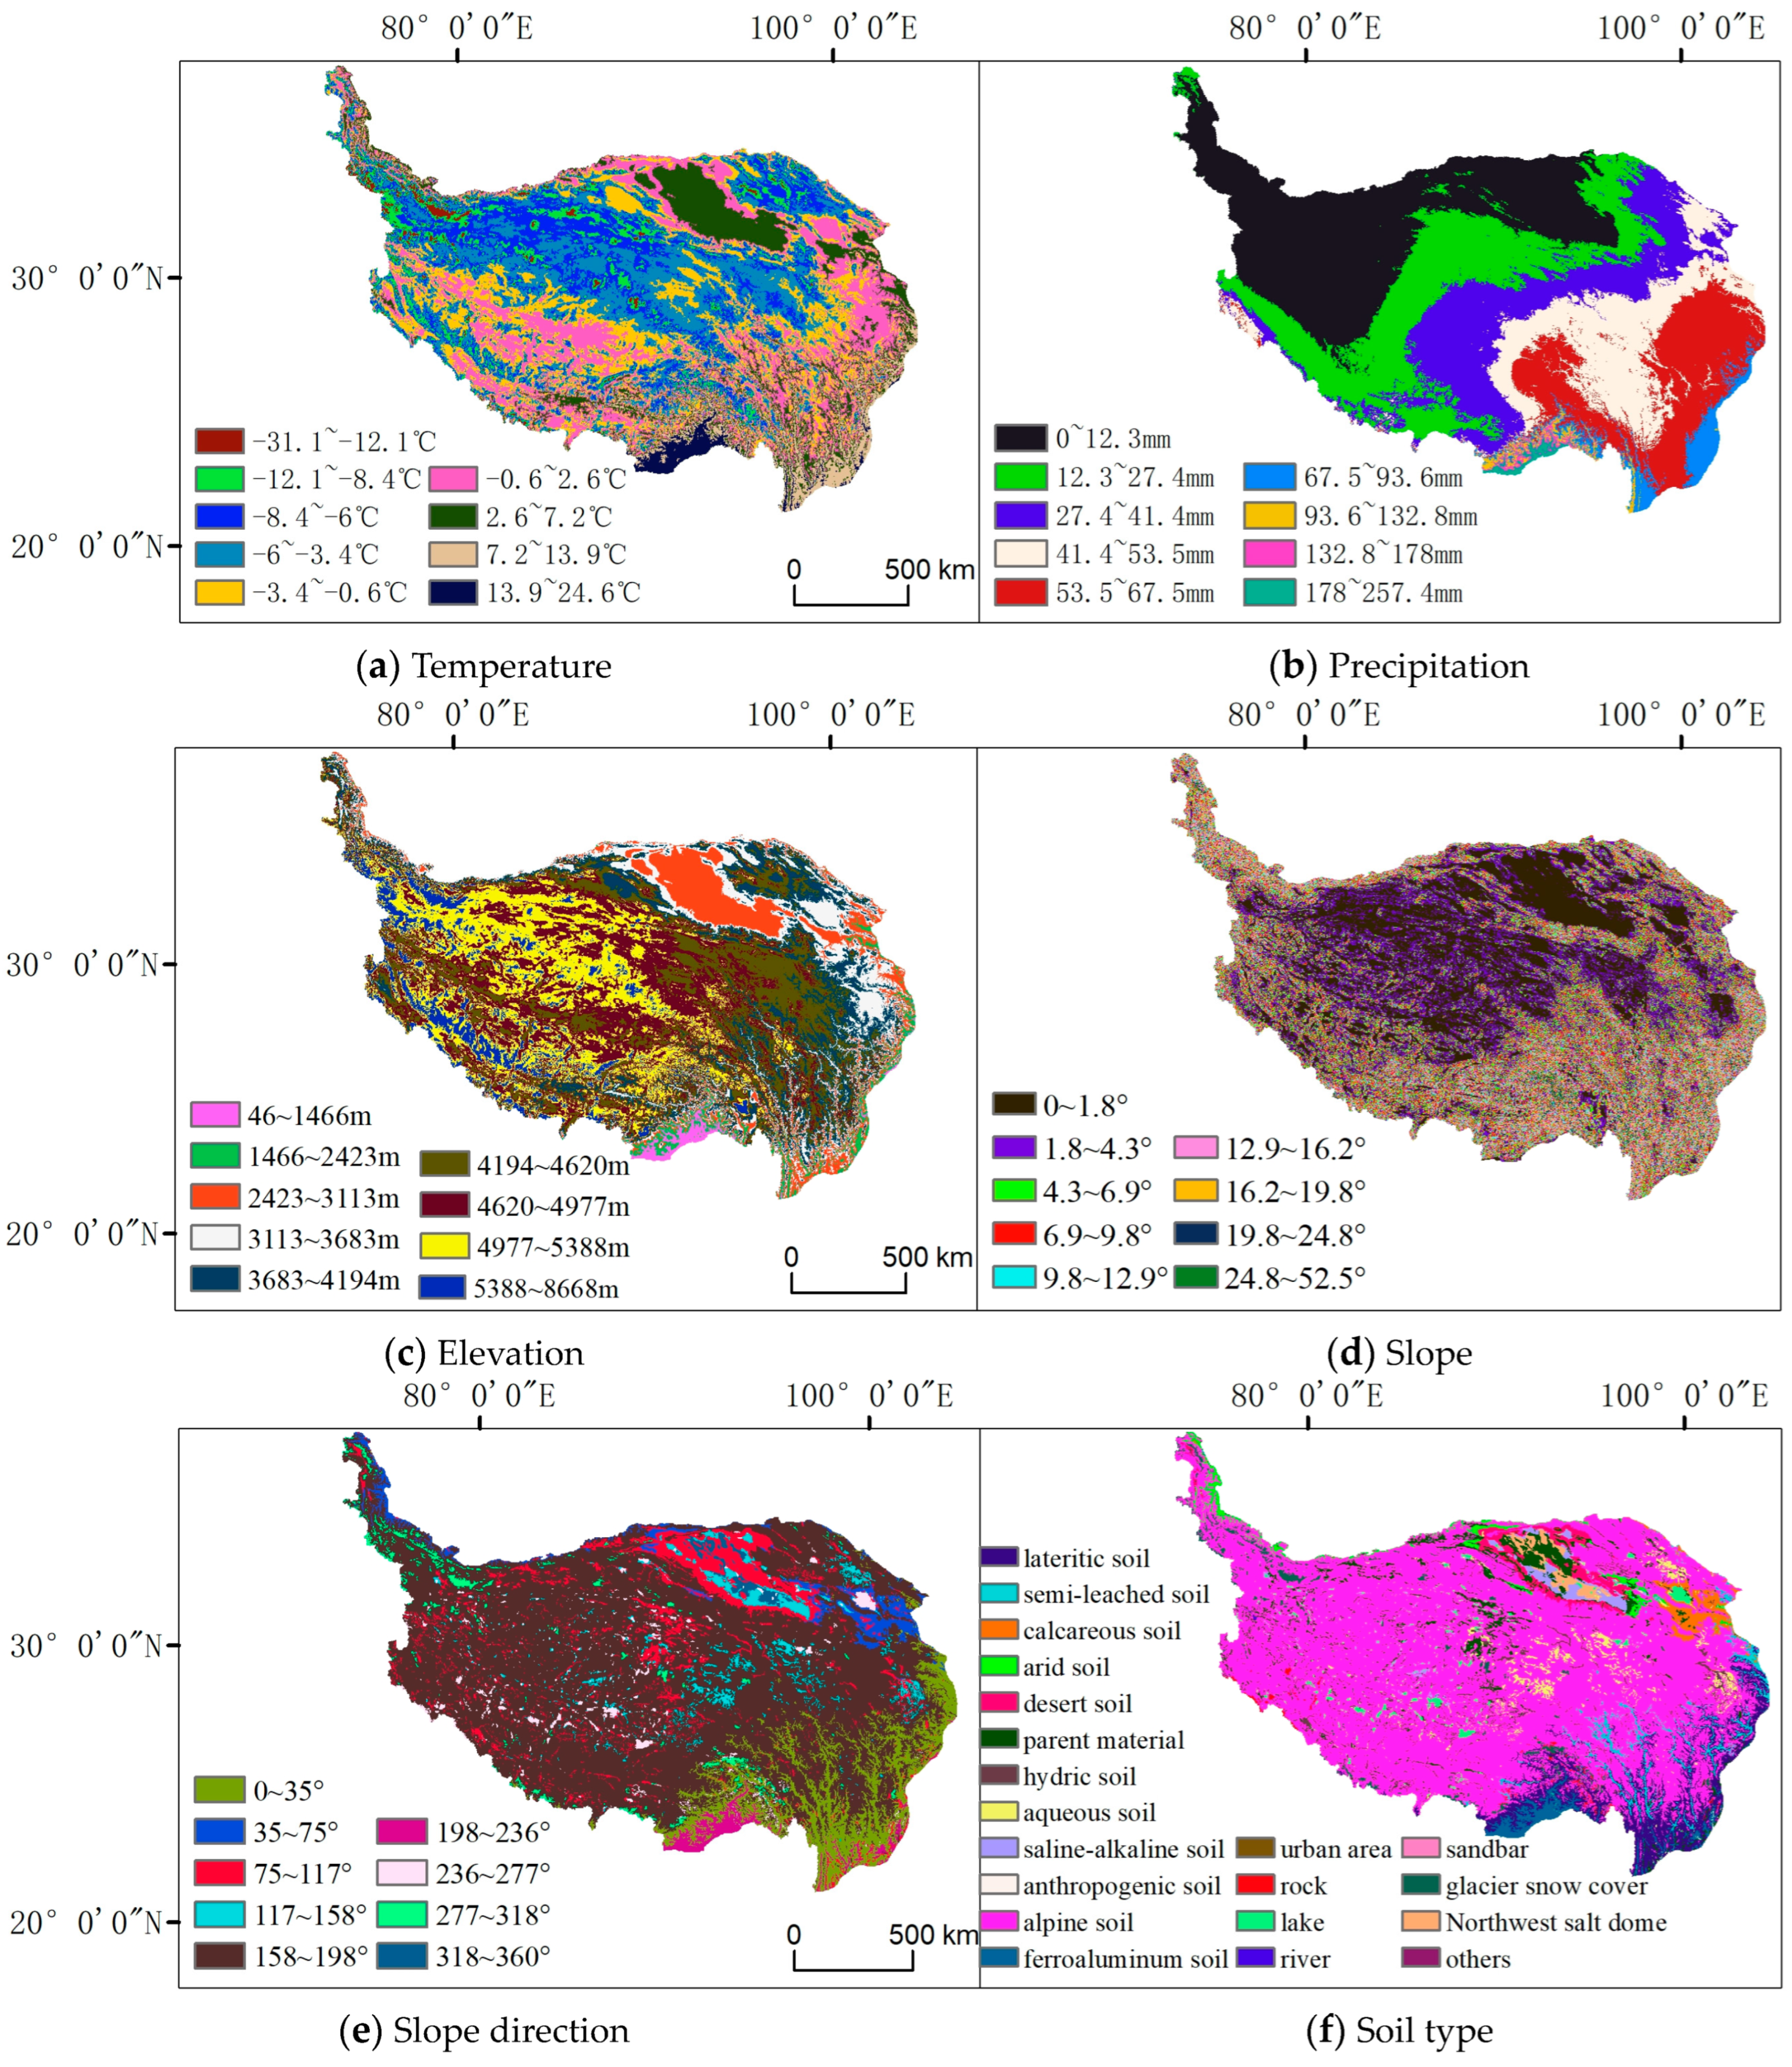
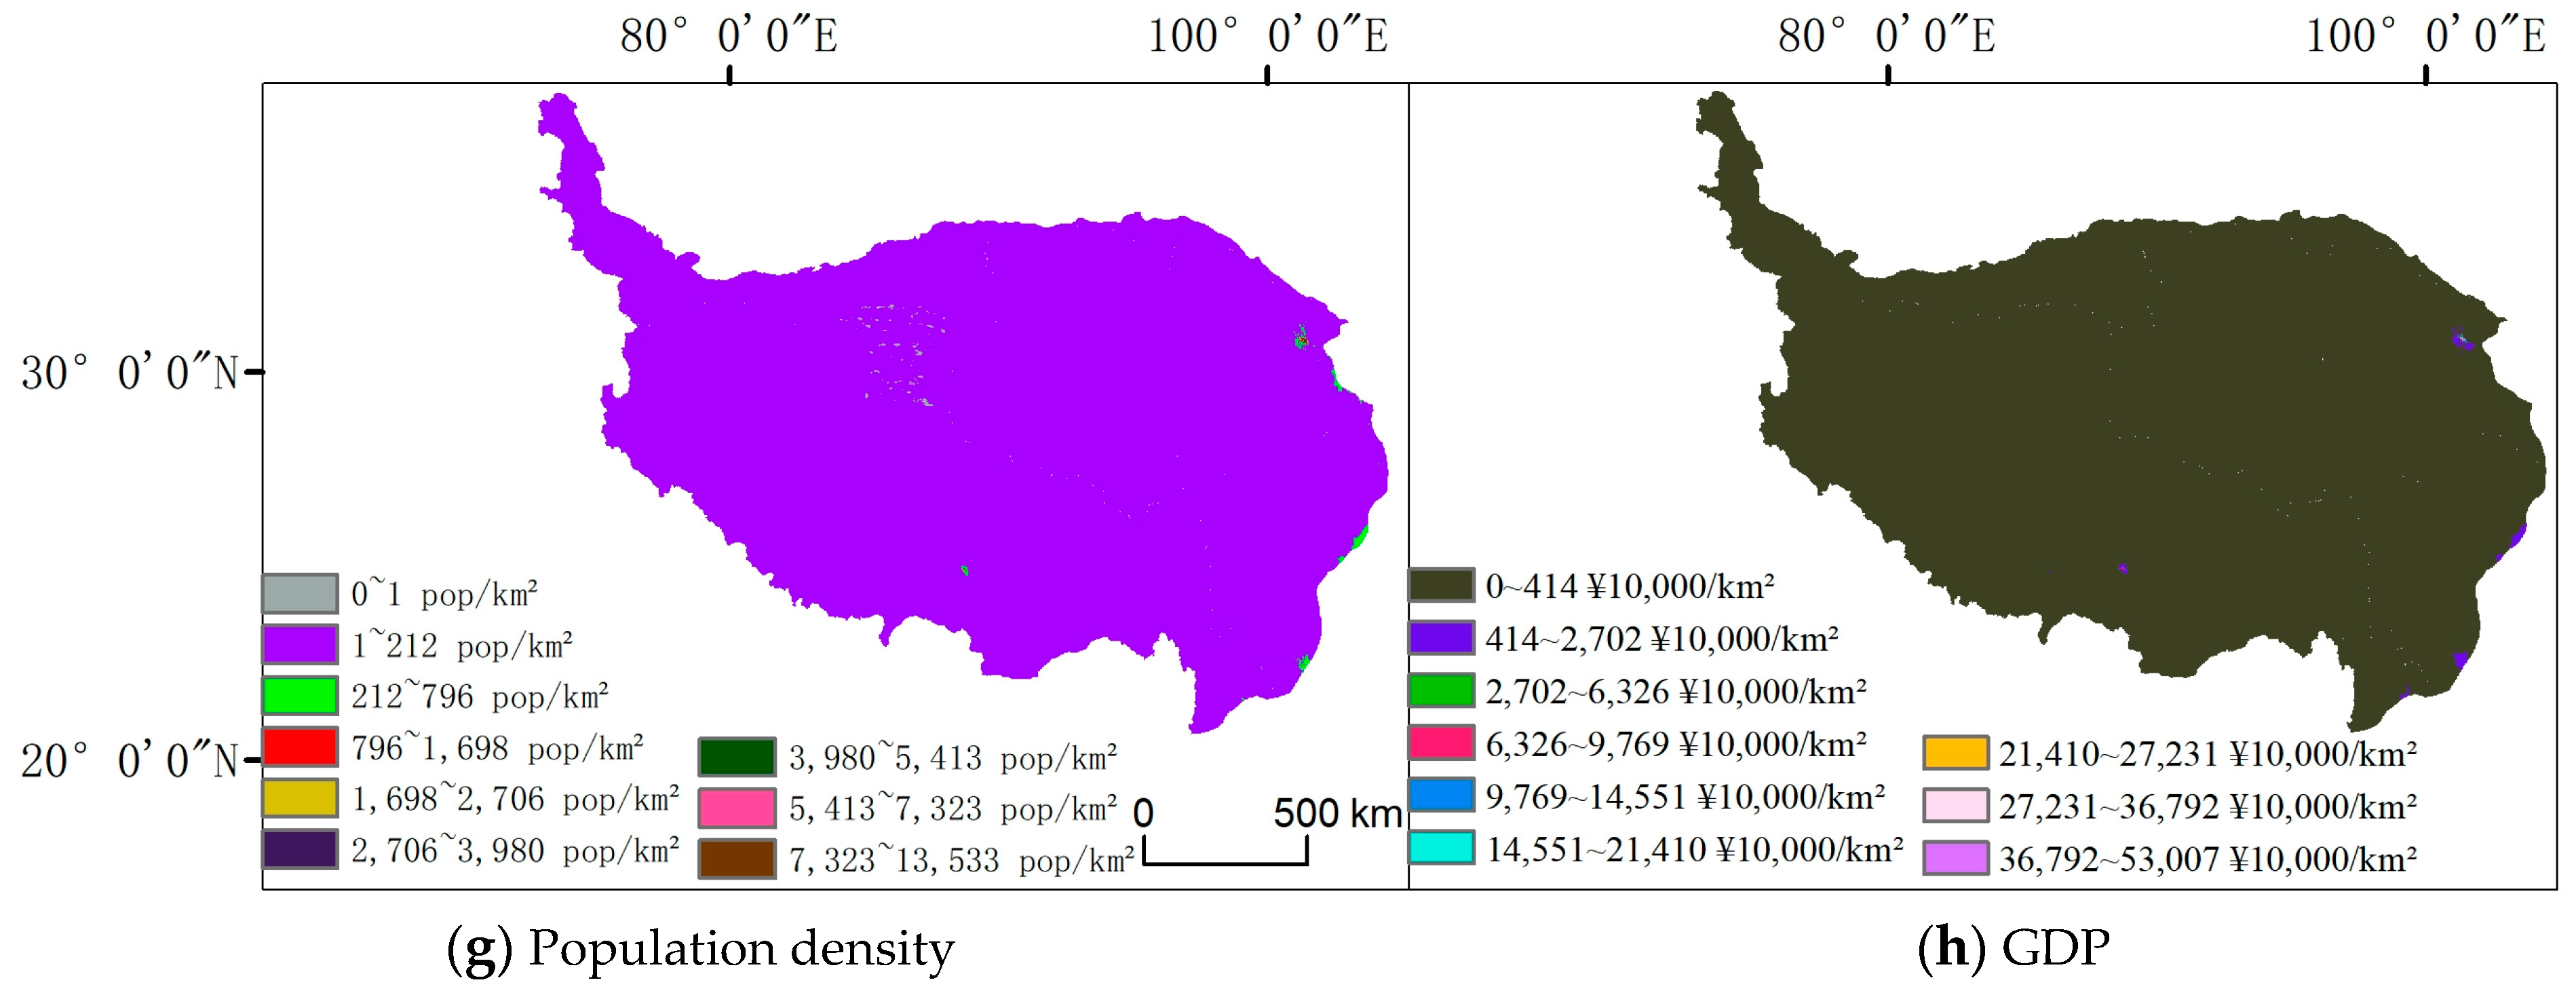
2.2.3. Resource Data

Land use resource data were provided by the Resource and Environment Science and Data Center of the Chinese Academy of Sciences (http://www.resdc.cn). (accessed on 1 July 2023), which provides a thematic database of Chinese national-scale multiperiod land use/land cover constructed based on manual visual interpretation at a resolution of 30 m using Landsat remote sensing imagery from the United States Landsat as the main information source [27]. Soil type data were obtained from the Resource and Environment Science and Data Center of the Chinese Academy of Sciences (http://www.resdc.cn). (accessed on 1 July 2023). These data were digitally generated from the 1:1 million Soil Map of the People’s Republic of China, prepared and published by the National Soil Census Office in 1995. DEM (digital elevation model) data were provided by the National Tibetan Plateau Science and Data Center (http://data.Tpdc.ac.cn). (accessed on 1 July 2023), which generates 1 km data based on 1: 250,000 contour and elevation points in China [28]. Population density and GDP data were obtained from the Data Center for Resource and Environmental Sciences, Chinese Academy of Sciences (http://www.resdc.cn). (accessed on 1 July 2023). Notably, a kilometer-grid dataset of the spatial distributions of population and GDP in China at a spatial resolution of 1 km was obtained, and five periods of data for the years 2000, 2005, 2010, 2015, and 2019 were selected [29,30,31,32]. The above data were masked and cropped based on the vector boundary of the Tibetan Plateau using ArcGIS 10.8 software and then resampled to 1 km resolution and reclassified to obtain the data required for the comprehensive geodetection analysis.

2.3. Research Methodology

2.3.1. Mann–Kendall Test

The Mann–Kendall (MK) test is a nonparametric test, which means that no prior assumptions about the statistical distribution of the data are required [33,34,35]. The normalized statistic Z is mainly used to test the trend and significance of time series. The Mann–Kendall test is used to determine the significance of the trend, and the related calculation is as follows:
Z = { S 1 v a r ( S ) ,               S > 0 0 ,                                 S = 0 S + 1 v a r ( S ) ,               S < 0
i = 1 n 1 j = i + 1 n s g n ( N D V I j N D V I i )
sgn ( NDVI j NDVI i ) { 1 ,             NDVI j NDVI i > 0 0 ,             NDVI j NDVI i = 0 1 ,       NDVI j NDVI i < 0
var ( S ) = n ( n 1 ) ( 2 n + 5 ) 18
where n is the number of sample points in the time series. Sen + MK was combined to determine the trend of increasing or decreasing vegetation coverage during the study period. Based on the vegetation trend characterized by the β value and the results of the significance test of the vegetation trend, the statistical Z value at the significance levels of α = 0.05 and α = 0.01 was used as the threshold value, and the NDVI trend was classified into seven classes: highly significant decrease (β < 0, |Z| > 2.58), significant decrease (β < 0, 1.96 < |Z| ≤ 2.58), lowly significant decrease (β < 0, 1.65 < |Z| ≤ 1.96), no significant change (|Z| ≤ 1.65), lowly significant increase (β > 0, 1.65 < |Z| ≤ 1.96), significant increase (β > 0, 1.96 < |Z| ≤ 2.58), and highly significant increase (β > 0, |Z| > 2.58).

2.3.2. Trend Analysis and Theil–Sen Trend Slope Estimation

In the case that the Mann–Kendall test is successful, the slope of that trend could be estimated using the Theil–Sen slope estimator. Theil–Sen median trend analysis is a nonparametric statistical method [36,37,38,39] with the advantages of not requiring the sample to follow a specific distribution, being computationally efficient and insensitive to outliers without a reduction in accuracy, and having the powerful ability to avoid measurement errors or errors associated with anomalous data. A comparison of different linear regression models shows that the method has significant advantages in the case of small samples. The corresponding equation is
β = Median { NDVI j NDVI i j i } ,   j > i
where β is the trend of vegetation change, and NDVIi and NDVIj are the NDVI values at times i and j, respectively. β > 0 indicates an increasing NDVI trend, while the opposite relation indicates a decreasing NDVI annual trend.

2.3.3. Pearson Correlation Analysis

To investigate the effects of climatic and anthropogenic factors on the NDVI, the correlation between the NDVI and trends in mean temperature and precipitation was calculated at the image scale [40] with the following equation:
A xy = i = 1 n ( x i x ¯ ) ( y i y ¯ ) i = 1 n ( x i x ¯ ) 2 i = 1 n ( y i y ¯ ) 2
where:
A xy —correlation of the trends of the two variables;
y i —the value of the NDVI in the i-th year;
x i —the values of average temperature and precipitation in the corresponding year;
y ¯ and x ¯ —the mean values of the NDVI and different variables in the study period.
At test was used to test significance, and the correlation between the NDVI and climatic and anthropogenic factors was classified as highly significant (p < 0.01), significant (p < 0.05), or not significant (p ≥ 0.05).

2.3.4. Geodetector Calculation

Changes in the NDVI are governed by multiple natural factors, in addition to climate change, and are also influenced by a combination of human activities, topography, and elevation [41]. To quantitatively evaluate and reveal the effects of natural and human factors on vegetation cover, a geoprobe approach is applied in this paper.
A geodetector is a statistical tool based on spatial statistics and spatial autocorrelation, and it can be used to explore spatial anisotropy, reveal the magnitude and significance of the effects of individual factors on a selected variable, detect risk zones and interaction strengths, and perform ecological detection [42]. In this study, we analyzed the drivers of different impact factors in the study area through Microsoft Word 2019MSO software.
(1) Factor detection: The effects of the spatial heterogeneity of the dependent variable Y (NDVI values) and the magnitude of the spatial heterogeneity of the independent variable X (natural and socioeconomic factors) on Y, expressed as q, were calculated with the following equations:
q = 1 1 N σ 2 h = 1 L N h σ h 2 = 1 S S W S S T
SSW = h = 1 L N h σ h 2
SSW = N σ 2
where h = 1, 2,... L , L is the classification of x or y; the value of q is in the range of [0, 1], and the larger the value of q is, the stronger the influence of x on the spatial variance of y. N h and N denote the number of cells encompassed by the variable divided into h classes and the number of cells in the entire spatial region, respectively. σ h 2 and σ 2 are the variances of h classes and Y in the region, respectively, and SSW and SST are the sum of the variances of L classes and the total variance of the region, respectively.
(2) Interaction detection: The interactions among different independent variables x are determined, and the result indicates whether the influence on y when the two factors act together is correlated or independent. The q-value [q(X1∩X2)] is then output.

3. Results

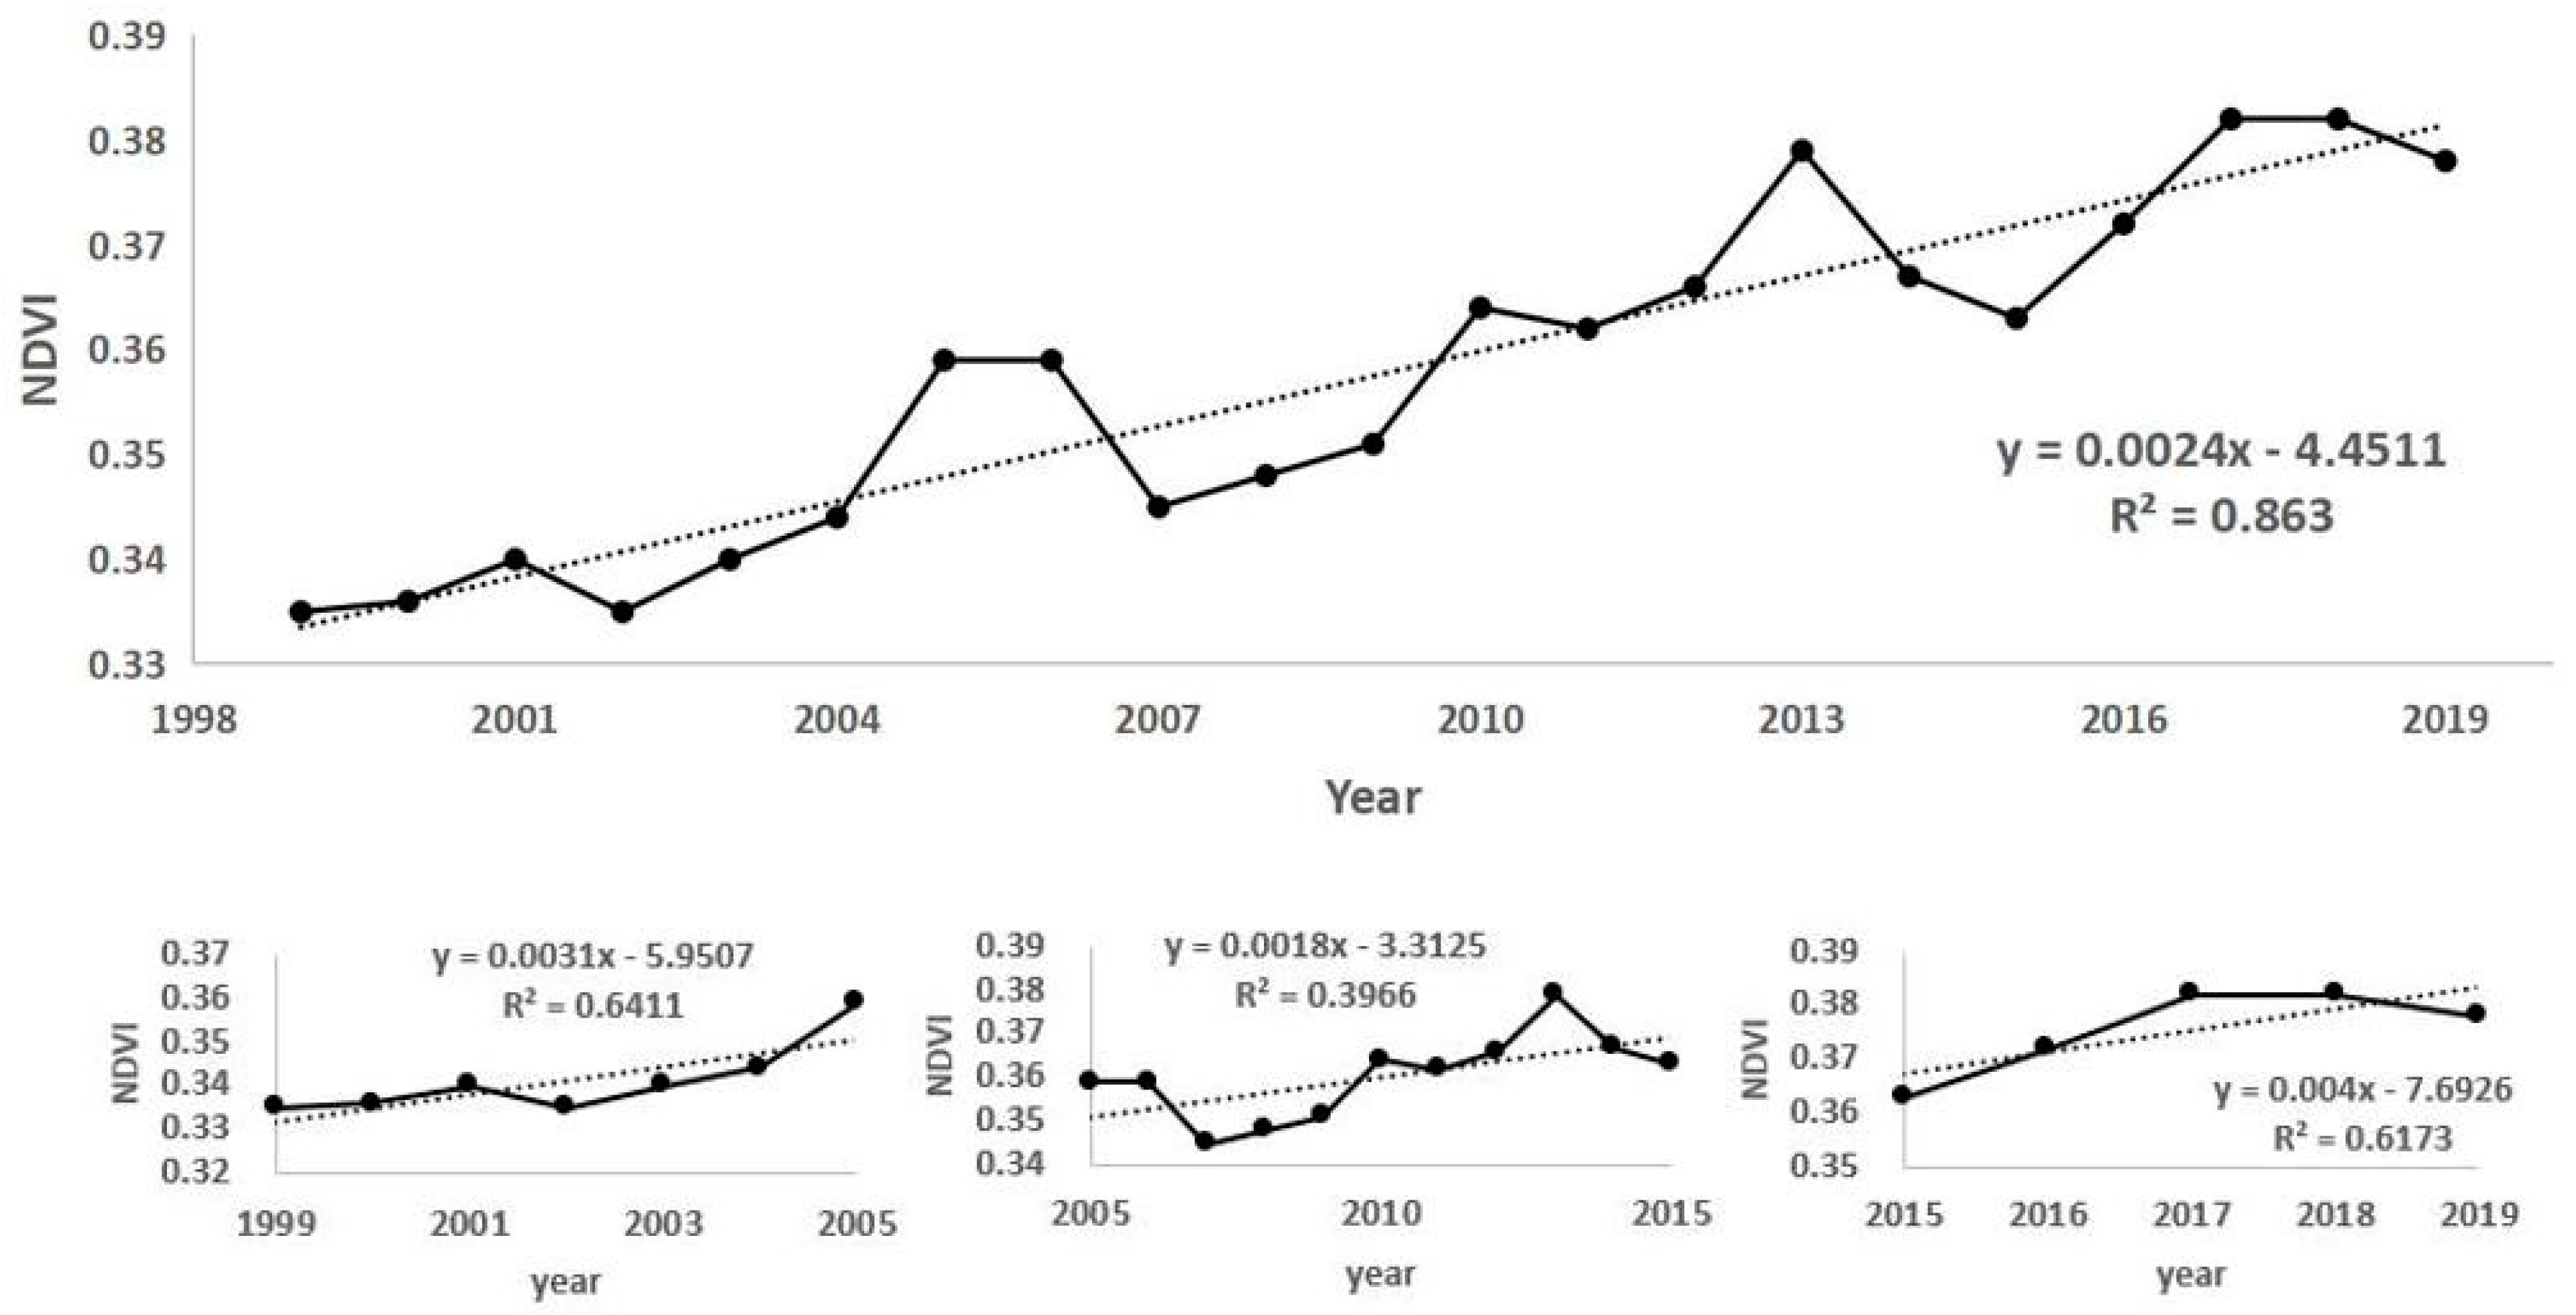
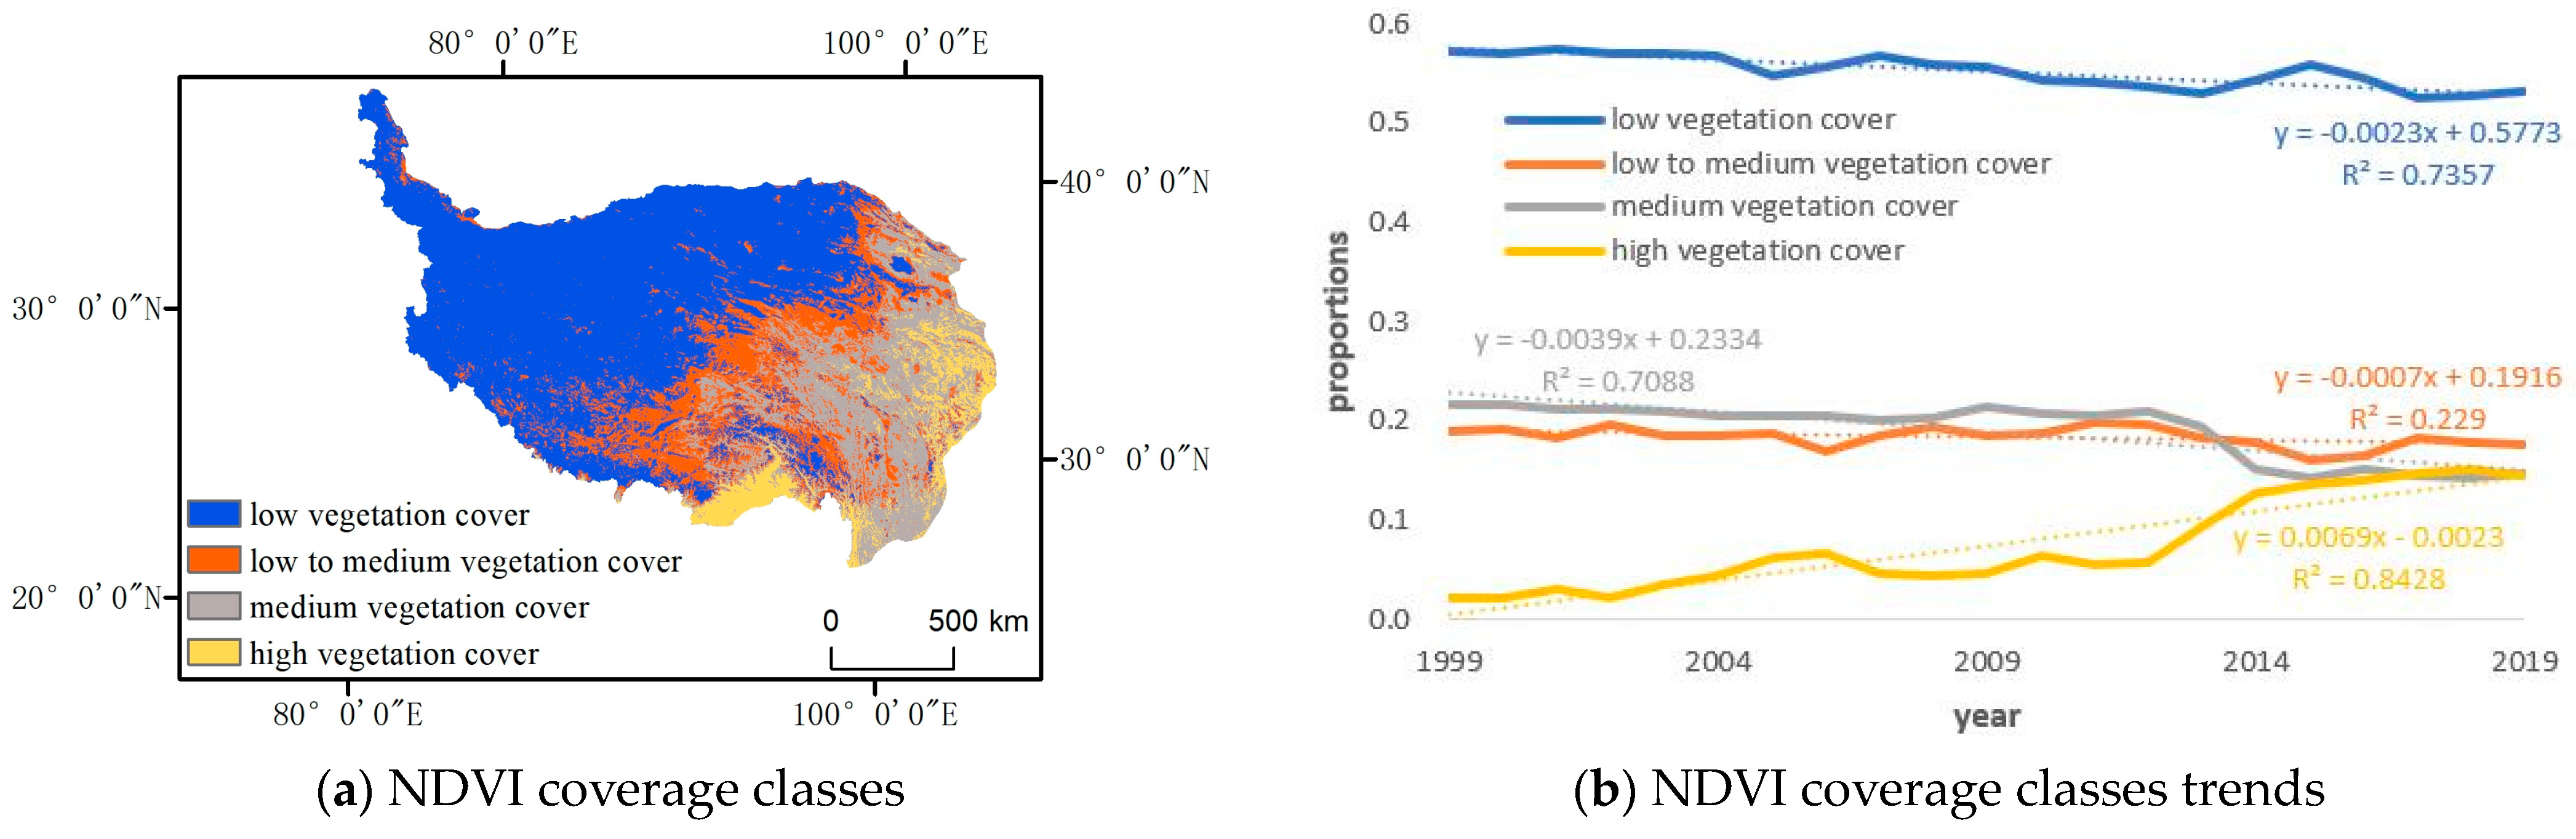
3.1. Characteristics of Temporal Changes in Vegetation Cover

Based on the continuous time series of SPOT/VEGETATION NDVI satellite remote sensing data, the maximum value synthesis method was used to generate the annual vegetation index data from 1999–2019, from which the fitted curve of the mean change in the annual NDVI was obtained. As shown in Figure 2, the annual average NDVI in the Tibetan Plateau region in the study period showed an overall fluctuating upward trend. Notably, the NDVI in the study area increased from 0.335 to 0.378 from 1999–2019, with a growth rate of 12.8%, or 0.0024-a−1. The percentage of vegetation cover improved significantly and showed an increasing trend. The change in vegetation cover in the study area can be roughly divided into three stages. In the first stage, the NDVI increased rapidly from 0.335 to 0.345, with a growth rate of 3%, or 0.0036-a−1, from 1999–2005. In the second stage, the NDVI increased slowly from 0.359 to 0.363, with a growth rate of 1.1%, or 0.0018-a−1. In the third stage, from 2015–2019, the NDVI increased rapidly again from 0.363 to 0.378, with a growth rate of 4.1%, or 0.004-a−1.
The trends from 1999 to 2019 observed in this study are consistent with the results of Mu Li et al. [43]. The changes in vegetation cover from 1999–2019 were closely related to the implementation of environmental protection policies and a general increase in people’s awareness regarding environmental protection in the region. From 2015–2019, the provinces on the Qinghai–Tibet Plateau implemented a series of measures to protect the ecological environment in response to the requirements of the national ecological civilization construction policy, which led to significant changes in vegetation coverage in the region. Additionally, the temperature in the region warmed and rainfall increased during this period, conjectures which might have contributed to the NDVI increase, providing an idea for subsequent correlation studies.

3.2. Spatial Variation Characteristics of Vegetation Cover

To comprehensively evaluate the changes in spatial vegetation cover in the region, the NDVI was divided into low vegetation cover areas (0~0.3), low to medium vegetation cover areas (0.3~0.6), medium vegetation cover areas (0.6~0.8), and high vegetation cover areas (0.8~1). As shown in Figure 3a, spatially, the vegetation cover in the region showed obvious regional differences, and the NDVI displayed a gradual decrease from southeast to northwest, which was consistent with the spatial distribution patterns of temperature, rainfall, and elevation [44]. The predicted changes in NDVI were most closely related to topographic and climate factors.
As shown in Figure 3b and Table 1, the spatial distribution of vegetation cover in the region was determined every five years from 1999–2019, and the spatial and temporal changes in the spatial proportion of each vegetation coverage area in the region were analyzed. The proportion of low-density vegetation cover areas was the highest, and the change was significant, reaching 57.3% to 53.3%; moreover, the proportion area of this cover class decreased at a rate of 0.206-a−1. The proportions of medium–low-density vegetation cover and medium-density vegetation cover were similar and decreased year by year. The change in medium–low-density vegetation cover areas was the least significant, varying from 19% to 17.6%, with a rate of decrease of 0.068-a−1. The change in the medium-density vegetation cover area was comparatively more significant, varying from 21.5% to 14.6%, with a rate of decrease of 0.384-a−1. The high-density vegetation cover area increased from 2.1% to 14.6%, with the most significant increasing trend, reaching 0.668-a−1.
Overall, although the proportion of the area characterized by low vegetation density decreased year by year, this classification is dominant in half of the study area. In contrast, the proportion of high-density vegetation cover area to the total study area is the lowest, but the growth trend is the most significant, indicating that although the vegetation cover in the area is not very high, the ecological conditions have had positive effects on vegetation.

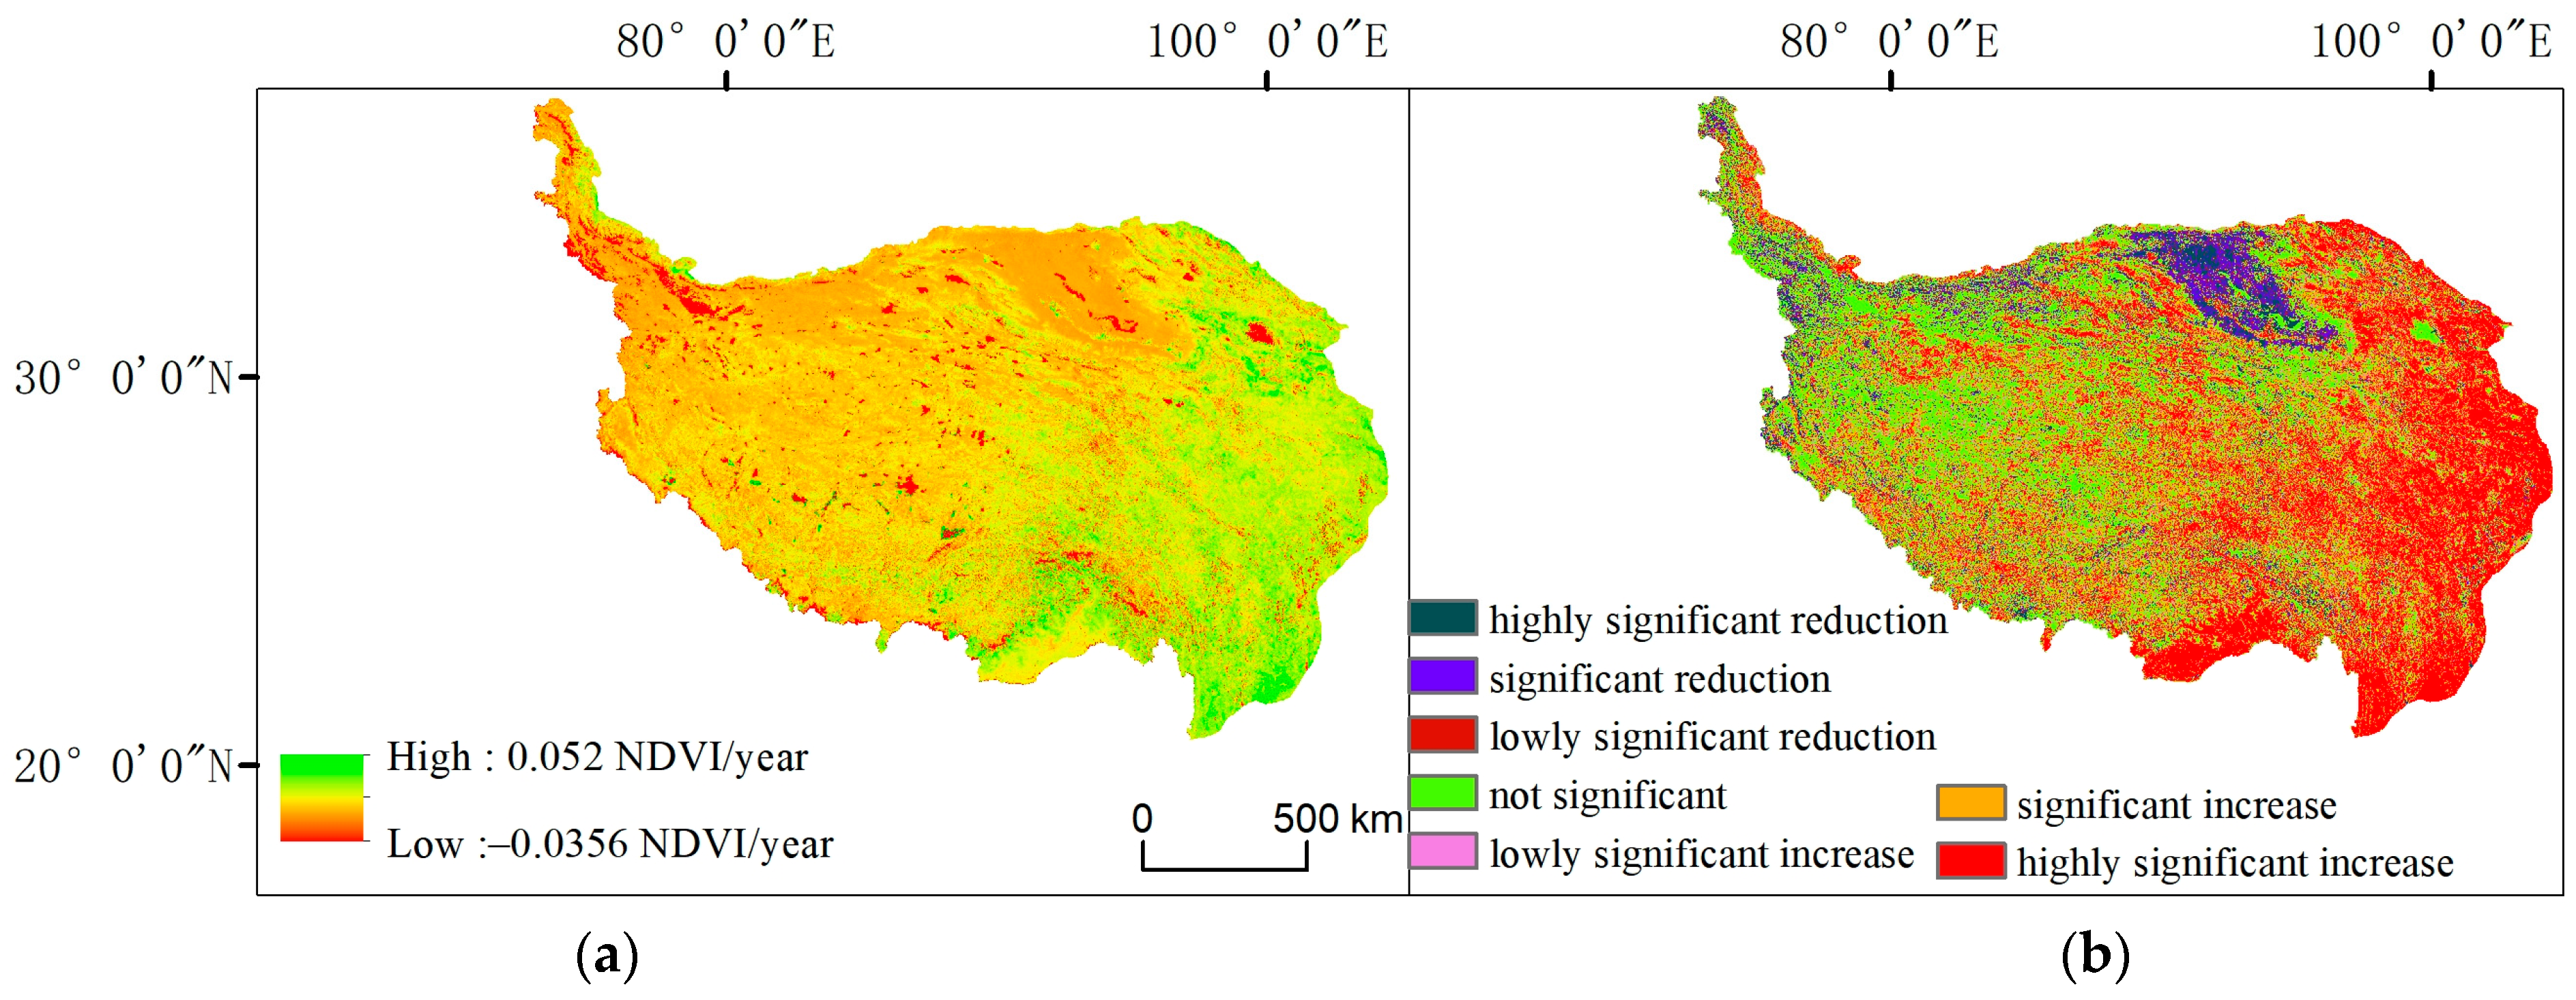
3.3. Trend Analysis of Vegetation Cover Change

Based on the MK test, the significance of the vegetation cover trend in the study area was assessed. As shown in Figure 4b, NDVI changes in the study area were dominated by nonsignificant changes, significant increases, and highly significant increases. Most of the areas with slight significant increases and no significant changes were distributed in the central and western parts of the study area, and the areas with significant increases and highly significant increases were mainly distributed in the eastern part of the study area. Moreover, the areas with slight significant decreases, significant decreases, and highly significant decreases were distributed along the northern part of the study area. The Z values of the statistics at the significance levels of α = 0.05 and α = 0.01 were used as the critical values, and the image element values were reclassified (Table 2). The results showed that the areas of very significant decreases, significant decreases, marginally significant decreases, no significant change, marginally significant increases, significant increases, and marginally significant increases accounted for 3.1%, 5.4%, 3.2%, 39.9%, 4.7%, 10.8%, and 33.0% of the total area of the region, respectively.
Theil–Sen median trend analysis was used to study the trend of vegetation cover changes in the region from 1999–2019. The effect of vegetation restoration in the region is remarkable, as shown in Figure 4a. The NDVI increase in the southeast and northeast areas of the region is most obvious, and the NDVI in the central and southwest areas is basically unchanged. Additionally, the NDVI in the northwest is decreasing. Using β = 0 as the critical value of the vegetation trend, we reclassified the image element values to obtain Table 2, which shows that the NDVI in the whole region displays a clear increasing trend, and the areas with increasing trends and decreasing trends account for 67% and 33% of the total area, respectively.
In general, there is obvious spatial variability in vegetation cover trends in the region, and these trends are mainly increasing. The areas that displayed a significant increase accounted for nearly 50% of the total area, which far exceeds the area of those with a significant decrease. This result indicates that the overall effect of the Qinghai–Tibet Plateau ecosystem management is good.

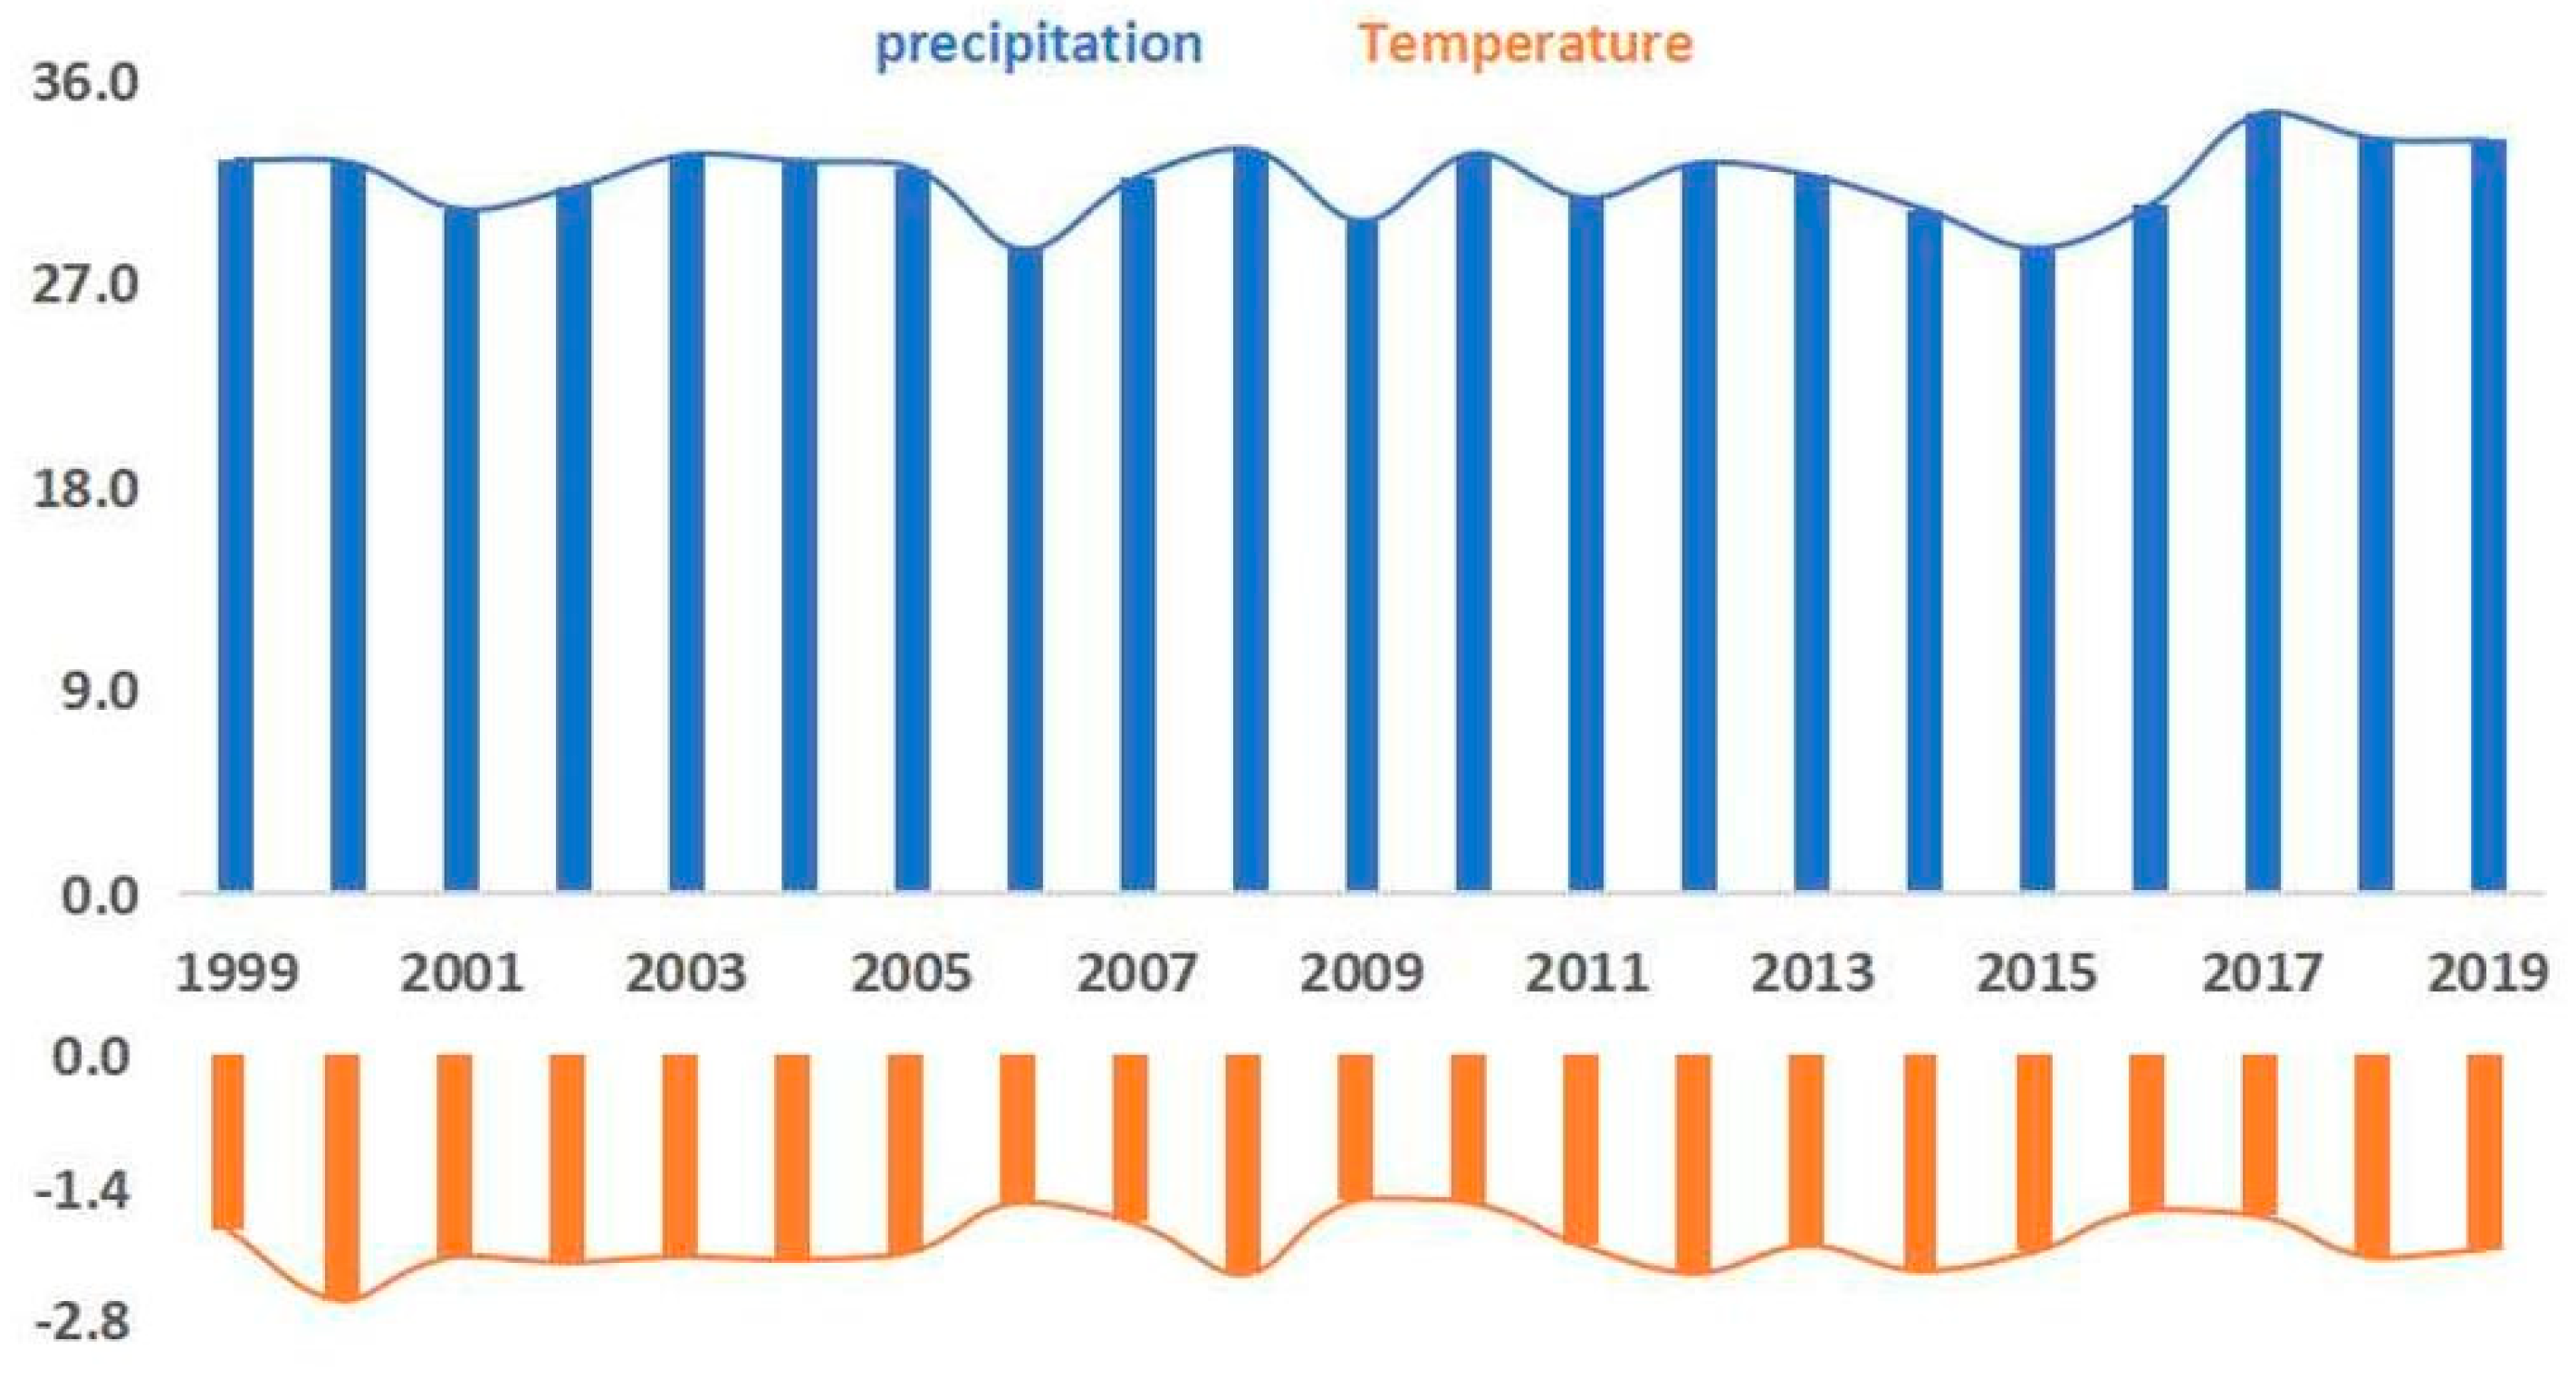
3.4. Effect of Climate Factors on Vegetation Cover

According to Chen et al. [45], climate change is an important reason for the increase in the NDVI on the Tibetan Plateau, and temperature and precipitation are important indicators of climate change. Correlation analysis based on the image metric scale was used to explore the correlations between the NDVI and temperature and precipitation in space over time. As shown in Figure 5, the temperature showed a decreasing trend from 1999–2019, with the annual average temperature decreasing from −1.86 °C to −2.06 °C, a decrease of 10.8% or 0.0095-a−1. Precipitation showed an increasing trend during the period, increasing from 32.46 mm to 33.33 mm, an increase of 2.7% or 0.041-a−1.
The results of the correlation analysis and significance test between the temperature and precipitation distributions and the NDVI are shown in Figure 6 and Figure 7. Then, the image values of the results were reclassified to obtain Table 3. An analysis of the results in Figure 6 and Table 3 showed that the percentage of the area with a positive correlation between the NDVI and mean temperature was 66.82%, mainly in the central–eastern part of the study area, which is consistent with the results of Zhao Qianqian [46]. The areas in the region in which the NDVI values showed highly significant and significant positive correlations with mean temperature, accounting for 2.73% and 7.97% of the total area of the region, respectively, were mainly concentrated in the eastern and central parts of the region, and insignificant correlations were observed in most other areas. This result indicated that there is high spatial heterogeneity in terms of the promotion of vegetation due to increasing average temperatures, and the correlation was not significant or of low significance. The effect of increased temperatures on the NDVI was most obvious in the eastern region, where the average temperature is relatively high. In Figure 7 and Table 3, the percentage of areas that displayed a positive correlation between the NDVI and mean annual precipitation was 66.29%, mainly in the northeastern and southwestern parts of the study area, which is basically consistent with the results of Wang Zhipeng [47]. The proportions of areas with highly significant and significant positive correlations were 4.87% and 9.55%, respectively, indicating that the NDVI and mean annual precipitation showed a simultaneous increase in most areas of the Tibetan Plateau during the study period. The spatial distributions of the NDVI and mean annual precipitation were highly and significantly correlated in the northeastern region, and the significance of trends in other regions was relatively weak. In general, the overall NDVI and precipitation correlation reached 14.4%, which was significantly higher than that of the NDVI and temperature correlation at 10.7%, indicating that precipitation has a greater influence on vegetation cover change on the Tibetan Plateau.

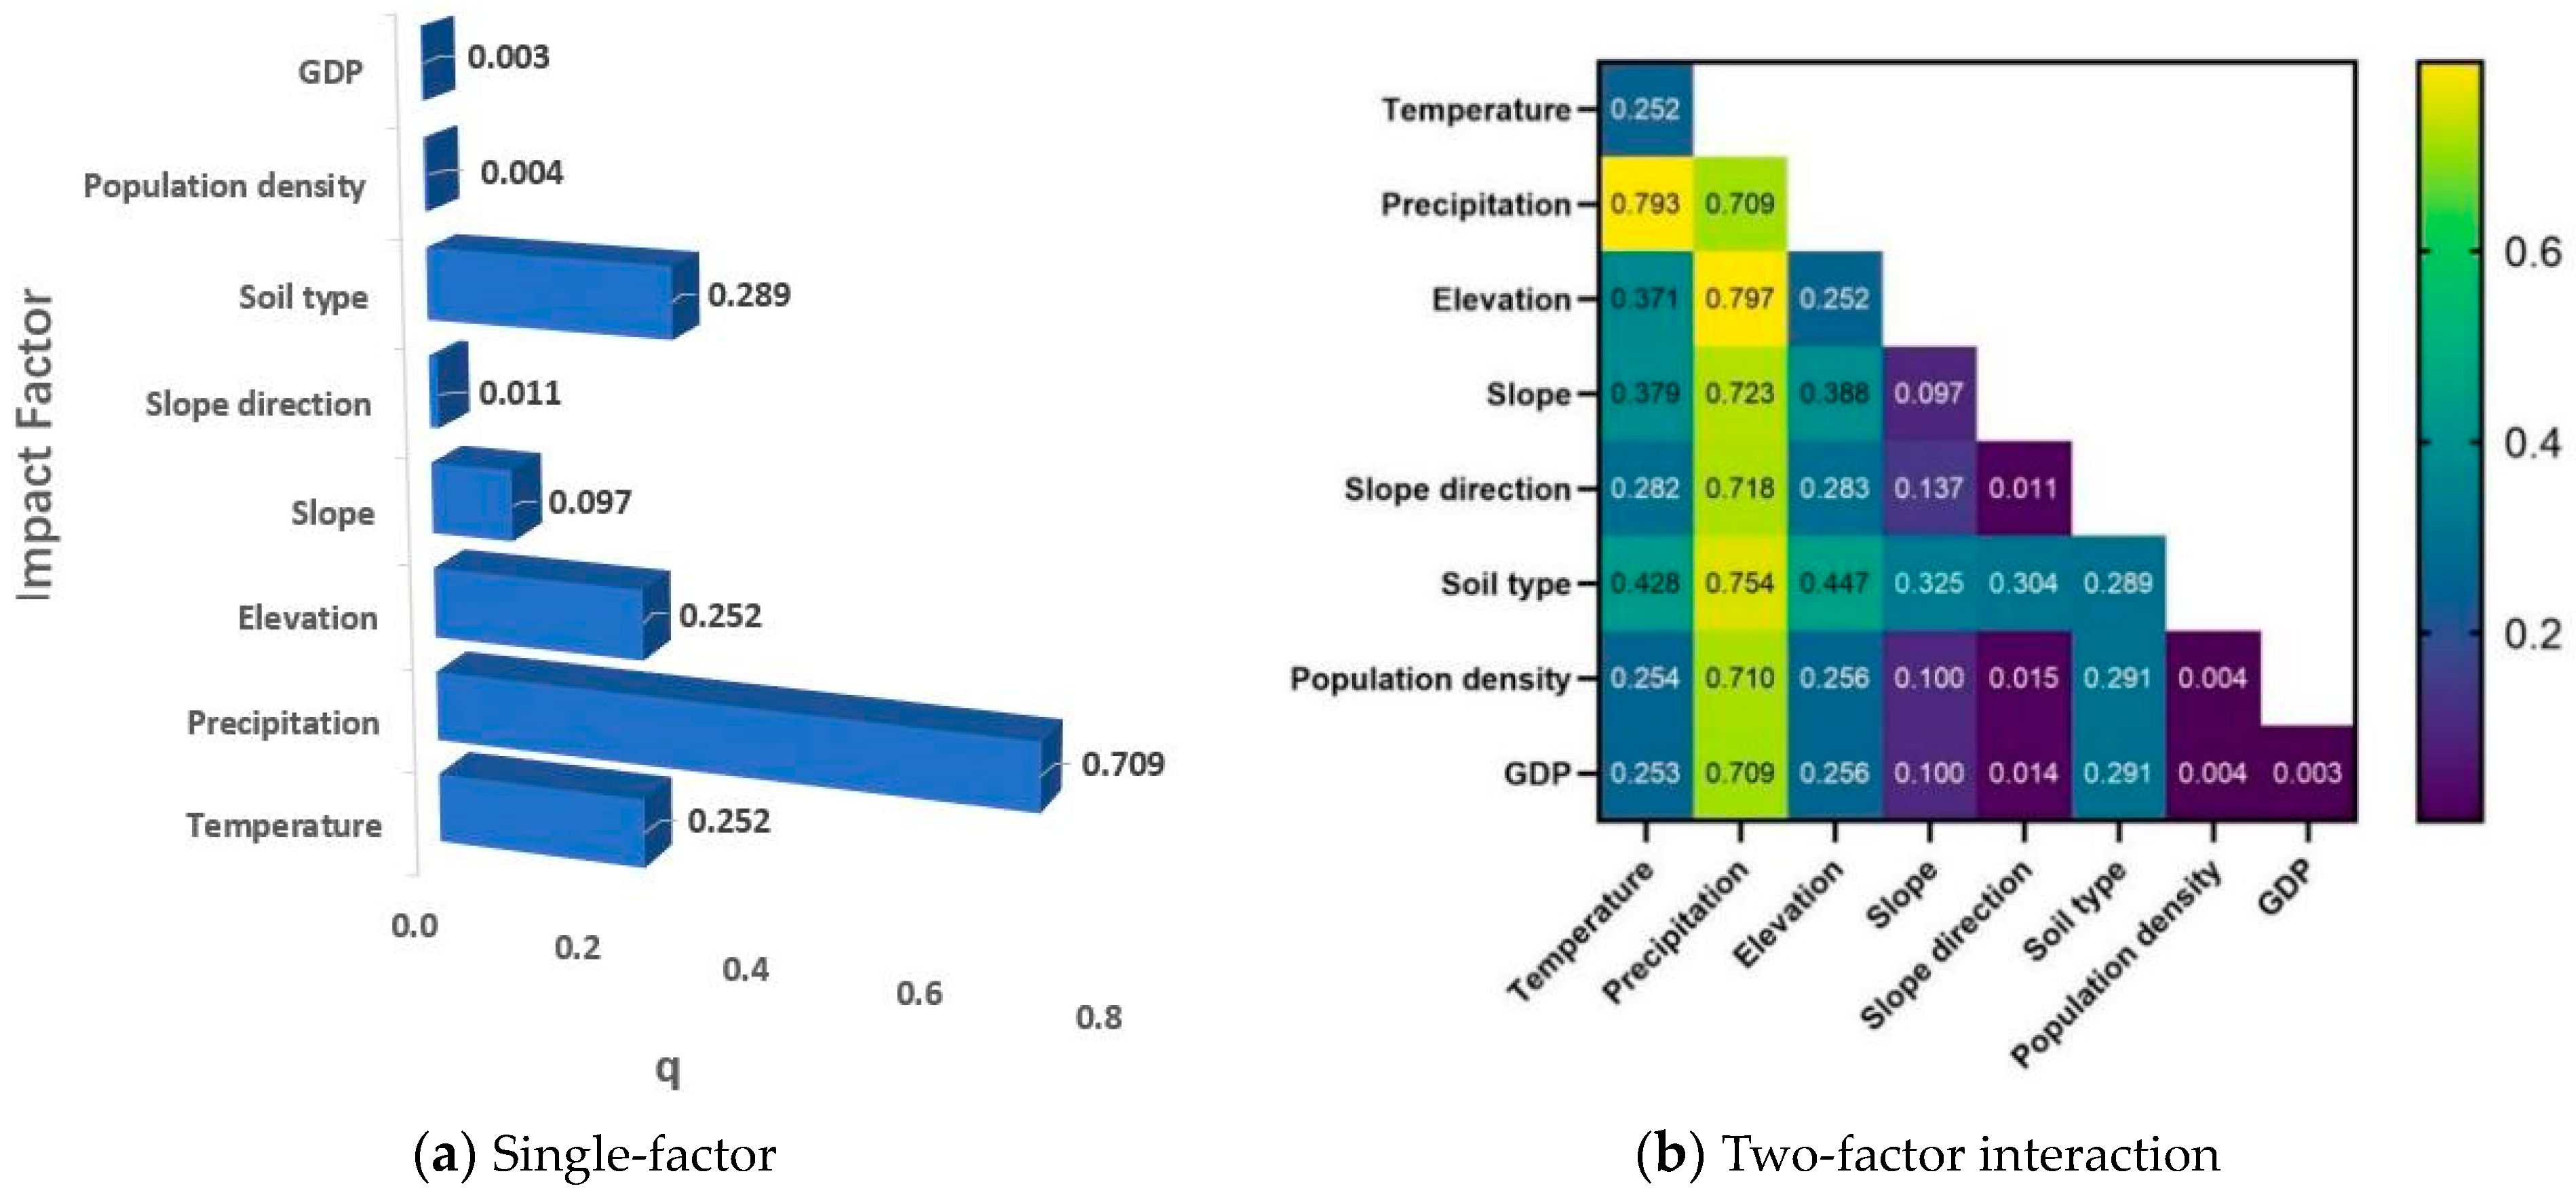
3.5. Analysis of the Influence of Each Driver on Vegetation Cover Change

The geodetector is an algorithm used for discrete data, so continuous variables (among the eight independent variables in this paper, all are continuous variables except elevation, soil type, slope, and slope direction) are discretized. In this paper, the natural breakpoint method [48] was adopted, and all the driving factors used were divided into 9 categories, except for soil type, which was divided into 22 categories, as shown in Figure 8.
First, the magnitude of the single-factor q-value was analyzed, and then the dominant driving factors were discerned. The driving factors in the analysis were series of data, such as temperature, precipitation, elevation, slope, slope angle, soil type, population density, and GDP, among which temperature and precipitation were climate factors; elevation, slope, slope angle, and soil type were topographic factors; and population density and GDP were anthropogenic factors. The results of the analysis based on the q-values of each driver in the region calculated with the geographic probe method are shown in Figure 9a, which indicates that the influence of each driver on the NDVI in the region ranked as follows: precipitation (0.709) > soil type (0.289) > elevation (0.252) > temperature (0.252) > slope (0.097) > slope direction (0.011) > population density (0.004) > GDP (0.003). The spatial variation in the NDVI in the region is the result of the combined effects of natural and human factors, among which precipitation, soil type, elevation, and temperature make strong contributions, with q-values greater than 0.25. Slope, slope direction, population density, and GDP make relatively small contributions. Among the factors that lead to spatial variations in the NDVI in the region, climate factors such as precipitation and temperature dominate, topographic factors such as soil type and elevation are the next most important, and anthropogenic factors contribute the least to the NDVI.
To focus on the changes in vegetation cover considering the interactions between natural and anthropogenic factors, the relationships between different driving factors and the spatial variations in the NDVI were analyzed by using the geographic probe method, and the results are shown in Figure 9b. Based on the comparison of the data in Figure 9, it can be seen that (1) the combined effect of any two driving factors has a greater effect on the NDVI than the independent effect of a single factor, mainly showing two-factor enhancement and nonlinear enhancement trends. (2) The interaction between precipitation and other factors is significant, with q-values greater than 0.7, among which the interaction between precipitation and elevation is the largest, with a q-value of 0.797, followed by the interaction between temperature and precipitation, with a q-value of 0.793. Overall, the magnitude of the NDVI in the region is most obviously influenced by climate factors such as rainfall. (3) The interactions between anthropogenic factors and other factors have the smallest influence on the NDVI values in the region, except for the interaction with precipitation, which has a q-value of 0.7. The significance of the interaction with other factors is very low, and the q-values are all below 0.3. The results indicate that natural factors play a dominant role in influencing NDVI changes on the Tibetan Plateau, and anthropogenic factors have little effect, likely because of the high altitude and harsh climate in most areas of the Tibetan Plateau, the poor suitability of the living environment, the low and concentrated population density in the region, and the fact that most areas are uninhabited, resulting in the very limited influence of anthropogenic factors on the NDVI.

4. Discussion and Conclusions

4.1. Discussion

In this paper, the spatial and temporal characteristics of vegetation cover changes are studied, and a quantitative analysis of the driving factors of vegetation on the Tibetan Plateau over the past 21 years is performed. The correlations between precipitation and temperature and the NDVI were analyzed, as were the levels of significance of these correlations, and the driving forces associated with relevant natural and anthropogenic factors were calculated using a geographic probe method. The main factors driving NDVI changes in the region were identified. Compared with existing studies of the Tibetan Plateau, this paper quantifies the driving forces of a series of factors influencing NDVI changes on the Tibetan Plateau with the help of a geoprobe method, and the driving force values are calculated for individual and multiple factors. Compared with the existing studies [49,50,51,52] of the spatial and temporal evolution trends of vegetation on the Tibetan Plateau and the corresponding influential factors, this paper quantifies the effects of topographic factors and human activities to determine specific drivers. In combination with the existing findings of Tibetan Plateau studies, a correlation analysis between the anthropogenic and natural factors that affect the NDVI on the Tibetan Plateau was performed, and it was found that precipitation displayed the strongest positive correlation with the NDVI and was the primary factor affecting vegetation growth and interannual variations in the region, which is consistent with the results of previous studies [53]. However, the research in this paper still has some limitations, such as that the influence of anthropogenic factors focuses more on population density and economy, and does not make a specific analysis for anthropogenic factors such as forest fires, land use and land cover change, forest resource development, and forest degradation, which is also the focus of the subsequent research.
Generally, the correlation between the NDVI and drivers is studied using correlation, partial correlation, and complex correlation coefficients. However, most studies that focused on the correlation between the NDVI and drivers only considered the correlation between the NDVI and climate factors (temperature, precipitation, etc.), and did not consider the spatial and temporal correlations between the NDVI and topographic factors (e.g., elevation and slope) or anthropogenic factors (e.g., population and GDP). In addition, the gray correlation [54], which is similar to the correlation coefficient approach, is used to measure the relationship between the NDVI and other factors; only the measurement algorithms are different, and, thus, the major limitations of these methods is the lack of quantifying the relationships between the NDVI and anthropogenic and topographic factors, whereas the Granger causality test [55] is mainly used to test for causal relationships between variables and cannot make inferences about complex relationships between multiple variables. The existing quantitative assessment methods also have various shortcomings; for example, the regression modeling method cannot yield the spatial distribution of, or spatial differences in, the contribution of each factor, and modeling methods based on biophysical processes can easily introduce large uncertainties due to the complex model structures and numerous model parameters; moreover, residual analysis cannot account for the differences in the climatic factors that affect vegetation growth in different ecosystems [56]. The geographic probe method can be used to separate the effects of natural and anthropogenic factors on vegetation change and calculate the corresponding effects on NDVI separately [57]; therefore, the magnitude of different driving forces of vegetation change can be assessed through a novel approach. However, it also has certain limitations, such as the difficulty of determining the causal relationship between specific influencing factors, the lack of in-depth explanations of the mechanisms and processes behind them, and the difficulty of adequately capturing and explaining these complexities in the face of the complex interactions between environmental factors and human activities such as nonlinearities and delayed effects.
In general, the evaluation system of the relative roles of natural factors and human activities in the analysis of vegetation change drivers has been formed, but it still needs to be improved for special regions and special influencing factors, and there is still a lack of quantitative research on the impacts of anthropogenic and natural factors on the NDVI in a continuous and long time series, so as to further improve its accuracy and applicability.

4.2. Conclusions

The NDVI on the Qinghai–Tibet Plateau rapidly increased from 1999 to 2019. Notably, 1999–2005, 2005–2015, and 2015–2019 were the three periods with the most obvious NDVI growth rates. The corresponding growth rates were 0.0036-a−1, 0.0018-a−1, and 0.004-a−1, respectively; spatially, the NDVI pattern over the whole Tibetan Plateau was dominated by increases from northwest to southeast, and areas of growth accounted for 67% of the total area of the region.
During the study period, the spatial variation in vegetation cover in the study area was large. Notably, the area share of low-vegetation-density cover decreased from 57.3% to 53.3%, and the rate of decrease was second only to that of medium-density-vegetation cover. However, low-vegetation-density cover remained the main type of vegetation cover in the region. In contrast, the proportion of high-density-vegetation cover in the total study area was the lowest, but it displayed the most significant growth during the study period, increasing from 2.1% to 14.6% of the area, a growth rate of 0.668-a−1.
The correlations between the NDVI and mean temperature and precipitation were mainly positive, indicating that the effects of temperature and rainfall on NDVI in the Qinghai–Tibet Plateau region are mainly positive. From the correlation test results, a correlation between the NDVI and temperature is only observed in 10.6% of the whole region, while the correlation between the NDVI and precipitation is more extensive, reaching 14.4%.
The driving factors of NDVI changes in the past 21 years are precipitation > soil type > elevation > temperature > slope > slope direction > population density > GDP, and the main driving factors are precipitation, soil type, elevation, and temperature, with q-values of 0.709, 0.289, 0.252, and 0.252, respectively. This finding suggests that natural factors such as precipitation, soil type, elevation, and temperature dominate the spatial variation in the NDVI in the region, and anthropogenic factors such as population density and GDP have little influence on NDVI changes and environmental evolution.
The analysis of the interactions among different drivers and their effects on the spatial variations in NDVI using the geodetector indicated that the combined effects of multiple drivers are greater than the effects of individual drivers, with two-factor and nonlinear enhancement trends. Specifically, the influence of meteorological factors on the NDVI values in the region is high, and the interactions between meteorological factors such as precipitation and topographic factors such as elevation have the most significant influence on the changes in NDVI values in the region, with a q-value of 0.797. This value is significantly higher than that of the interactions between anthropogenic factors and other factors.

Author Contributions

Conceptualization, T.X. and H.W.; methodology, T.X.; software, T.X.; validation, T.X. and H.W.; formal analysis, T.X.; data curation, T.X.; writing—original draft preparation, T.X.; writing—review and editing, T.X.; project administration, H.W. All authors have read and agreed to the published version of the manuscript.

Funding

Project support: Construction of Talent Innovation Team and Laboratory Platform of Tibet University—Construction of Plateau Geothermal New Energy Innovation Team and Laboratory Platform, Project No. 2022ZDTD10; Tibetan Finance Pre-indication [2022] No. 1 Central Support for Local Ministry and Regional Joint Construction/First-class Everest Construction Project—Construction of Geological Resources and Geological Engineering Characteristics.

Institutional Review Board Statement

Not applicable.

Informed Consent Statement

Not applicable.

Data Availability Statement

The information used in the analysis is accessible from the public data sources.

Conflicts of Interest

The authors declare no conflict of interest.

References

  1. Cao, M.; Woodward, F.I. Dynamic responses of terrestrial ecosystem carbon cycling to global climate change. Nature 1998, 393, 249–252. [Google Scholar] [CrossRef]
  2. Zhang, G.L.; Xu, X.L.; Zhou, C.P.; Zhang, H.B.; Ouyang, H. Responses of vegetation changes to climatic variations in Hulun Buir grassland in past 30 years. Acta Geogr. Sin. 2011, 66, 47–58. [Google Scholar]
  3. Piao, S.; Mohammat, A.; Fang, J.; Cai, Q.; Feng, J. NDVI-based increase in growth of temperate grasslands and its responses to climate changes in China. Glob. Environ. Chang. 2006, 16, 330–348. [Google Scholar] [CrossRef]
  4. Yao, T.; Chen, F.; Cui, P.; Ma, Y.; Xu, B.; Zhu, L.; Zhang, F.; Wang, W.; Ai, L.; Yang, X. From Tibetan Plateau to Third Pole and Pan-third Pole. Bull. Chin. Acad. Sci. 2017, 32, 924–931. [Google Scholar]
  5. Zhang, R.; Su, F.; Jiang, Z.; Gao, X.J.; Guo, D.L.; Ni, J.; You, Q.L.; Lan, C.; Zhou, B.T. An overview of projected climate and environmental changes across the Tibetan Plateau in the 21st century. Chin. Sci. Bull. 2015, 60, 3036–3047. [Google Scholar]
  6. Alley, R.B.; Meese, D.A.; Shuman, C.A.; Gow, A.J.; Taylor, K.C.; Grootes, P.M.; White, J.W.C.; Ram, M.; Waddington, E.D.; Mayewski, P.A.; et al. Abrupt increase in Greenland snow accumulation at the end of the Younger Dryas event. Nature 1993, 362, 527–529. [Google Scholar] [CrossRef]
  7. Li, S.C.; Wu, J.S.; Gong, J.; Li, S. Human footprint in Tibet: Assessing the spatial layout and effectiveness of nature reserves. Sci. Total Environ. 2018, 621, 18–29. [Google Scholar] [CrossRef] [PubMed]
  8. Wang, X.H.; Zheng, D.; Shen, Y.C. Land use change and its driving forces on the Tibetan Plateau during 1990–2000. Catena 2008, 72, 56–66. [Google Scholar] [CrossRef]
  9. Ichii, K.; Kawabata, A.; Yamaguchi, Y. Global correlation analysis for NDVI and climatic variables and NDVI trends: 1982–1990. Int. J. Remote Sens. 2002, 23, 3873–3878. [Google Scholar] [CrossRef]
  10. Mao, D.; Wang, Z.; Luo, L.; Ren, C. Integrating AVHRR and MODIS data to monitor NDVI changes and their relationships with climatic parameters in Northeast China. Int. J. Appl. Earth Obs. Geoinf. 2012, 18, 528–536. [Google Scholar] [CrossRef]
  11. Lu, Q.Q.; Jiang, T.; Liu, D.L.; Liu, Z.Y. The response characteristics of NDVI with different vegetation cover types to temperature and precipitation in China. Ecol. Environ. Sci. 2020, 29, 23–34. [Google Scholar]
  12. Yonaba, R.; Koïta, M.; Mounirou, L.; Tazen, F.; Queloz, P.; Biaou, A.; Niang, D.; Zouré, C.; Karambiri, H.; Yacouba, H. Spatial and transient modelling of land use/land cover (LULC) dynamics in a Sahelian landscape under semi-arid climate in northern Burkina Faso. Land Use Policy 2021, 103, 105305. [Google Scholar] [CrossRef]
  13. Wang, X.Y.; Lian, J.; Yang, X.P.; Zhao, X.Y.; Wang, X.J.; Ma, Z.W.; Gong, C.K.; Qu, H.; Wang, B. Variation in vegetation and its response to environmental factors in Maqu County. Acta Ecol. Sin. 2019, 39, 923–935. [Google Scholar]
  14. Xu, M.H.; Xue, X. Correlation among vegetation characteristics, temperature and moisture of alpine meadow in the Qinghai-Tibetan Plateau. Acta Ecol. Sin. 2013, 33, 3158–3168. [Google Scholar]
  15. Liang, H.; Huang, S.; Meng, E.; Huang, Q. Runoff prediction based on multiple hybrid models. J. Hydraul. Eng. 2020, 51, 112–125. [Google Scholar]
  16. Mao, H.; Yan, Y.; Zhang, J. The present situation and prospect of the hydrographic forecasting methods. J. Libr. Inf. Sci. 2005, 15, 172–173. [Google Scholar]
  17. Chen, M.; Lu, W.; Hou, Z.; Huang, H.; Li, P. The assesement of groundewater quality based on support vector machine in Western Jilin. Water Sav. Irrig. 2013, 38, 29–33. [Google Scholar]
  18. Ma, Y.; Huang, Z.X. Study on spatial-temporal evolution and measurement of green development index of urban agglomerations in the middle reaches of Yangtze River: GWR model based. Ecol. Environ. Sci. 2017, 26, 794–807. [Google Scholar]
  19. Evans, J.; Geerken, R. Discrimination between climate and human-induced dryland degradation. J. Arid Environ. 2004, 57, 535–554. [Google Scholar] [CrossRef]
  20. Wessels, K.J.; Prince, S.D.; Malherbe, J.; Small, J.; Frost, P.; VanZyl, D. Can human-induced land degradation be distinguished from the effects of rainfall variability? A case study in South Africa. J. Arid Environ. 2007, 68, 271–297. [Google Scholar] [CrossRef]
  21. Zhao, S.; Wu, X.Q.; Zhou, J.X.; Pereira, P. Spatiotemporal tradeoffs and synergies in vegetation vitality and poverty transition in rocky desertification area. Sci. Total Environ. 2021, 752, 13. [Google Scholar] [CrossRef] [PubMed]
  22. Zhu, L.; Meng, J.; Zhu, L. Applying Geodetector to disentangle the contributions of natural and anthropogenic factors to NDVI variations in the middle reaches of the Heihe River Basin. Ecol. Indic. 2020, 117, 106545. [Google Scholar] [CrossRef]
  23. Gbohoui, Y.P.; Paturel, J.-E.; Tazen, F.; Mounirou, L.A.; Yonaba, R.; Karambiri, H.; Yacouba, H. Impacts of climate and environmental changes on water resources: A multi-scale study based on Nakanbé nested watersheds in West African Sahel. J. Hydrol. Reg. Stud. 2021, 35, 100828. [Google Scholar] [CrossRef]
  24. Zhang, Y.L.; Liu, L.S.; Wang, Z.F.; Bai, W.; Ding, M.; Wang, X.; Yan, J.; Xu, E.; Wu, X.; Zhang, B.; et al. Spatial and temporal characteristics of land use and cover changes in the Tibetan Plateau. Chin. Sci. Bull. 2019, 64, 2865–2875. [Google Scholar]
  25. Xu, X. Annual Vegetation Index (NDVI) Spatial Distribution Dataset in China. Data Registration and Publication System of the Data Center for Resource and Environmental Sciences, Chinese Academy of Sciences. 2018. Available online: https://www.resdc.cn/DOI/doi.aspx?DOIid=49 (accessed on 1 July 2023). [CrossRef]
  26. Peng, S.; Ding, Y.; Liu, W.; Li, Z. 1 km monthly temperature and precipitation dataset for China from 1901 to 2017. Earth Syst. Sci. Data 2019, 11, 1931–1946. [Google Scholar] [CrossRef]
  27. Xu, X.; Liu, J.; Zhang, S.; Li, R.; Yan, C.; Wu, S. Multi-Period Land Use Remote Sensing Monitoring Dataset in China (CNLUCC). Data Registration and Publication System of the Data Center for Resource and Environmental Sciences, Chinese Academy of Sciences. 2018. Available online: https://www.resdc.cn/DOI/doi.aspx?DOIid=54 (accessed on 1 July 2023). [CrossRef]
  28. Tang, G. Digital Elevation Model of China (1 KM). A Big Earth Data Platform for Three Poles. 2019. Available online: https://data.tpdc.ac.cn/zh-hans/data/12e91073-0181-44bf-8308-c50e5bd9a734 (accessed on 1 July 2023).
  29. Ling, Y.I.; Xiong, L.Y.; Yang, X.H. Method of Pixelizing GDP Data Based on the GIS. J. Gansu Sci. 2006, 18, 54–58. [Google Scholar]
  30. Liu, H.; Jiang, D.; Yang, X.; Luo, C. Spatialization Approach to 1 km Grid GDP Supported by Remote Sensing. Geo-Inf. Sci. 2005, 7, 120–123. [Google Scholar]
  31. Huang, Y.; Bao, A.-M.; Chen, X.; Liu, H.L.; Yang, G.H. A study of regional GDP kilometer grid based on oasis land use. J. Glaciol. Geocryol. 2009, 31, 162–169. [Google Scholar]
  32. Xu, X. A Kilometer Grid Dataset of Spatial Distribution of Chinese Population. Data Registration and Publication System of the Data Center for Resource and Environmental Sciences, Chinese Academy of Sciences. 2017. Available online: https://www.resdc.cn/DOI/doi.aspx?DOIid=32 (accessed on 1 July 2023). [CrossRef]
  33. Chen, T.; Xia, J.; Zou, L.; Hong, S. Quantifying the influences of natural factors and human activities on NDVI changes in the Hanjiang River basin, China. Remote Sens. 2020, 12, 3780. [Google Scholar] [CrossRef]
  34. Li, P.; Wang, J.; Liu, M.; Xue, Z.; Bagherzadeh, A.; Liu, M. Spatio-temporal variation characteristics of NDVI and its response to climate on the Loess Plateau from 1985 to 2015. CATENA 2021, 203, 105331. [Google Scholar] [CrossRef]
  35. Jiang, W.; Yuan, L.; Wang, W.; Cao, R.; Zhang, Y.; Shen, W. Spatio-temporal analysis of vegetation variation in the Yellow River Basin. Ecol. Indic. 2015, 51, 117–126. [Google Scholar] [CrossRef]
  36. Zhao, W.; Gao, B.; Lu, Q.; Zhong, Z.-Q.; Liang, X.-M.; Liu, M.; Ma, S.-X.; Sun, J.-R.; Chen, L.-G.; Fan, S.-J. Ozone pollution trend in the Pearl River Delta region during 2006–2019. Environ. Sci. 2021, 42, 97–105. [Google Scholar]
  37. Mann, H.B. Nonparametric tests against trend. Econometrica 1945, 13, 245–259. [Google Scholar] [CrossRef]
  38. Kendall, M.G.; Stuart, A. The Advanced Theory of Statistics: Design and Analysis, and Time-Series; Charles Griffin & Company Limited: London, UK, 1968; Volume 3. [Google Scholar]
  39. Sen, P.K. Estimates of the regression coefficient based on Kendall’s tau. J. Am. Stat. Assoc. 1968, 63, 1379–1389. [Google Scholar] [CrossRef]
  40. Xing, Y.; He, Z.H. An NDVI-based analysis of the temporal and spatial characteristics of vegetation coverage in Guizhou province. J. S. China Norm. Univ. (Nat. Sci. Ed.) 2021, 53, 84–95. [Google Scholar]
  41. Wang, J.; Zhang, S.; Gao, Y. Current status and perspectives of research on the interrelationship between vegetation dynamics and environmental factors on the Qinghai-Tibet Plateau. Earth Sci. Front. 2021, 28, 70–82. [Google Scholar]
  42. Wang, J.F.; Xu, C.D. Geodetector: Principle and prospective. Acta Geogr. Sin. 2017, 72, 116–134. [Google Scholar]
  43. Miao, L.; Lu, Q.; Liu, G.L.; Wei, X.J. Spatial and temporal evolution characteristics of NDVI and its response to climate factors for different vegetation types on the Tibetan Plateau from 1999–2019. Res. Soil Water Conserv. 2023, 30, 97–105. [Google Scholar]
  44. Chen, H.; Ju, P.; Zhang, J.; Wang, Y.; Zhu, Q.; Yan, L.; Kang, X.; He, Y.; Zeng, Y.; Hao, Y.; et al. Attribution analyses of changes in alpine grasslands on the Qinghai-Tibetan Plateau. Chin. Sci. Bull. 2020, 65, 2406–2418. [Google Scholar] [CrossRef]
  45. Chen, J.H.; Wu, K.; Hu, C.M.; Yang, H. Spatial and temporal variability of vegetation sensitivity in the Tibetan Plateau during the growing season 2000–2021. Acta Ecol. Sin. 2023, 43, 4054–4065. [Google Scholar]
  46. Zhao, Q.Q.; Zhang, J.P.; Zhao, T.B.; Li, J.H. Vegetation changes and its response to climate change in China since 2000. Plateau Meteorol. 2021, 40, 292–301. [Google Scholar]
  47. Wang, Z.P.; Zhang, X.Z.; He, Y.T.; Li, M.; Shi, P.L.; Zu, J.X.; Niu, B. Responses of normalized difference vegetation index (NDVI) to precipitation changes on the grassland of Tibetan Plateau from 2000 to 2015. Chin. J. Appl. Ecol. 2018, 29, 75–83. [Google Scholar]
  48. Liu, Y.; Li, J. Geographical Detection and Optimal Decision Making of the Divergent Mechanism of Rural Poverty in Chinese Counties. Acta Geogr. Sin. 2017, 72, 161–173. [Google Scholar]
  49. Ji, Z.; Pei, T.; Chen, Y.; Hou, Q.Q.; Xie, B.P.; Wu, H.W. Spatial and temporal variation of NDVI in grasslands on the Qinghai-Tibet Plateau from 2001 to 2020 and analysis of the driving factors. Acta Agrestia Sin. 2022, 30, 1873–1881. [Google Scholar]
  50. Yuan, Q.; Yang, J. Phenological changes of grassland vegetation on the Qinghai-Tibet Plateau and its response to climate change. Chin. J. Grassl. 2021, 43, 32–43. [Google Scholar]
  51. Zhong, L.; Ma, Y.; Xue, Y.; Piao, S. Climate Change Trends and Impacts on Vegetation Greening Over the Tibetan Plateau. J. Geophys. Res. Atmos. 2019, 124, 7540–7552. [Google Scholar] [CrossRef]
  52. Wang, C.; Wang, J.; Naudiyal, N.; Wu, N.; Cui, X.; Wei, Y.; Chen, Q. Multiple Effects of Topographic Factors on Spatio-Temporal Variations of Vegetation Patterns in the Three Parallel Rivers Region, Southeast Qinghai-Tibet Plateau. Remote Sens. 2022, 14, 151. [Google Scholar] [CrossRef]
  53. Liu, N.; Peng, S.; Chen, Y. Temporal effects of climate factors on vegetation growth on the Tibetan Plateau. J. Plant Ecol. 2022, 46, 18–26. [Google Scholar]
  54. Li, P.; He, Z.; He, D.; Xue, D.; Wang, Y.; Cao, S. Fractional vegetation coverage response to climatic factors based on grey relational analysis during the 2000-2017 growing season in Sichuan Province, China. Int. J. Remote Sens. 2020, 41, 1170–1190. [Google Scholar] [CrossRef]
  55. Zhou, Y.K. Granger effect analysis of NDVI response of vegetation to climate factors on the Qinghai-Tibet Plateau. Progress. Geogr. 2019, 38, 718–730. [Google Scholar]
  56. Ma, Q.M.; Jia, X.P.; Wang, H.B.; Li, X.S.; Li, S.N. A review of methods for evaluating the effects of climate and anthropogenic factors on vegetation change. J. Desert Res. 2019, 39, 48–54. [Google Scholar]
  57. Zheng, K.; Tan, L.; Sun, Y.; Wu, Y.; Duan, Z.; Xu, Y.; Gao, C. Impacts of climate change and anthropogenic activities on vegetation change: Evidence from typical areas in China. Ecol. Indic. 2021, 126, 107648. [Google Scholar] [CrossRef]
Figure 1. Geographical overview of the Tibetan Plateau.
Forests 14 01835 g001
Figure 2. NDVI trends from 1999–2019 on the Tibetan Plateau.
Forests 14 01835 g002
Figure 3. NDVI coverage classes and trends from 1999–2019 on the Tibetan Plateau.
Forests 14 01835 g003
Figure 4. NDVI trends and significance test results from 1999–2019 on the Qinghai–Tibet Plateau. (a) NDVI trends. (b) MK significance test (highly significant decrease (β < 0, |Z| > 2.58), significant decrease (β < 0, 1.96 < |Z| ≤ 2.58), lowly significant decrease (β < 0, 1.65 < |Z| ≤ 1.96), no significant change (|Z| ≤ 1.65), lowly significant increase (β > 0, 1.65 < |Z| ≤ 1.96), significant increase (β > 0, 1.96 < |Z| ≤ 2.58), and highly significant increase (β > 0, |Z|> 2.58).
Forests 14 01835 g004
Figure 5. Temporal patterns of rainfall and temperature on the Tibetan Plateau.
Forests 14 01835 g005
Figure 6. Spatial distribution of the NDVI and temperature correlations on the Qinghai–Tibet Plateau. (a) Relevance. (b) t-Test significance (highly significant (p < 0.01), significant (p < 0.05), not significant (p ≥ 0.05)).
Forests 14 01835 g006
Figure 7. Spatial distribution of the NDVI and precipitation correlations on the Qinghai–Tibet Plateau. (a) Relevance. (b) t-Test significance (highly significant (p < 0.01), significant (p < 0.05), not significant (p ≥ 0.05)).
Forests 14 01835 g007
Figure 8. Drivers of vegetation changes on the Tibetan Plateau from 1999–2019.
Forests 14 01835 g008aForests 14 01835 g008b
Figure 9. Interpretation of the driving forces of the drivers of NDVI change on the Tibetan Plateau.
Forests 14 01835 g009
Table 1. Temporal variations in the area share of NDVI coverage zones.
YearLow Vegetation Cover (0–0.3)Low to Medium Vegetation Cover (0.3–0.6)Medium Vegetation Cover (0.6–0.8)High Vegetation Cover (>0.8)
Area (km²)Proportion (%)Growth Rate (%)Area (km²)Proportion (%)Growth Rate (%)Area (km²)Proportion (%)Growth Rate (%)Area (km²)Proportion (%)Growth Rate (%)
1999147.357.3 48.819 55.321.5 5.42.1
2004145.756.7−1.0947.518.5−2.6652.720.5−4.7011.14.3105.56
2009142.955.6−1.9247.318.4−0.425521.44.3611.64.54.50
2014139.854.4−2.174617.9−2.7538.815.1−29.4532.612.7181.03
2019137.053.3−2.0045.217.6−1.7437.514.6−3.3537.514.615.03
Table 2. NDVI trends and significant trend proportions on the Tibetan Plateau from 1999–2019.
Area (km2)Proportion (%)
trend analysisDecreasing trend83.800 32.64
Increasing trend173.200 67.36
Significance Testhighly significant reduction8.000 3.14
Significant reduction13.900 5.41
lowly significant reduction8.200 3.15
not significant change102.500 39.86
lowly significant increase12.100 4.67
Significant increase27.800 10.79
highly significant increase84.800 32.99
Table 3. Spatial distribution of NDVI correlation with temperature and precipitation in the Tibetan Plateau as a percentage of area.
TemperaturePrecipitation
Area (km2)Proportion (%)Area (km2)Proportion (%)
Relevancenegative correlation85.30 33.18 86.60 33.71
positive correlation171.70 66.82 170.40 66.29
t-Test significancehighly significant reduction7.00 2.73 12.50 4.87
significant reduction20.50 7.97 24.50 9.55
not significant change229.50 89.30 220.00 85.58
Disclaimer/Publisher’s Note: The statements, opinions and data contained in all publications are solely those of the individual author(s) and contributor(s) and not of MDPI and/or the editor(s). MDPI and/or the editor(s) disclaim responsibility for any injury to people or property resulting from any ideas, methods, instructions or products referred to in the content.

