Article

Effects of Water Control and Nitrogen Addition on Functional Traits and Rhizosphere Microbial Community Diversity of Haloxylon ammodendron Seedlings

1
College of Ecology and Environment, Xinjiang University, Urumqi 830046, China
2
Key Laboratory of Oasis Ecology of Education Ministry, Xinjiang University, Urumqi 830046, China
*
Author to whom correspondence should be addressed.
Forests 2023, 14(9), 1879; https://doi.org/10.3390/f14091879
Submission received: 8 June 2023 / Revised: 16 July 2023 / Accepted: 18 July 2023 / Published: 15 September 2023
(This article belongs to the Special Issue Plant Adaptation to Extreme Environments in Drylands—Series II)

Abstract

:
Water and nitrogen sources have always been the primary limiting factors for vegetation growth in arid and semi-arid regions and play an important role in the physiological ecology of vegetation. In this work, we studied the effects of water deficit and nitrogen addition on the physiological traits and rhizosphere bacterial microbial community of Haloxylon ammodendron seedlings in sterilized and non-sterilized soil habitats. A pot experiment was conducted to control the water and nitrogen sources of H. ammodendron seedlings. The water deficit treatment was divided into two groups based on gradient: a normal water group (CK, 70% field water holding capacity) and water deficit group (D, 30% field water holding capacity). The nitrogen addition treatment was divided into a no addition group (CK, 2.8 mg·kg−1) and addition group (N, 22.4 mg·kg−1). At the end of the growing season, the biochemical indexes of H. ammodendron seedlings were measured, and the rhizosphere soil was subjected to 16S rDNA-high-throughput sequencing to determine the rhizosphere bacterial community composition of H. ammodendron seedlings under different treatments. The results showed that the root-to-crown ratio of H. ammodendron seedlings increased significantly (p < 0.05) under the water deficit treatment compared to the control and nitrogen addition treatments, indicating that H. ammodendron seedlings preferred to allocate biological carbon to the lower part of the ground. In contrast, plant height and root length were significantly lower (p < 0.05) under water deficit treatment compared to the control, and no significant change was observed under water deficit and nitrogen addition compared to the control, indicating that water deficit inhibited the growth of H. ammodendron seedlings and nitrogen addition mitigated the effect of water deficit on the growth of H. ammodendron seedlings. Under sterilized soil conditions, both water deficit and nitrogen addition significantly increased the abundance and diversity of bacterial communities in H. ammodendron seedlings (p < 0.05). Conversely, under non-sterilized conditions, both inhibited the diversity of microbial bacterial communities, and the microbial characteristic species under different controls were different. Therefore, in the short-term experiment, H. ammodendron seedlings were affected by water deficit and allocated greater quantities of biomass to the underground part, especially in the non-sterile microbial environment; different initial soil conditions resulted in divergent responses of rhizosphere bacterial communities to water deficit and nitrogen addition. Under different initial soil conditions, the same water deficit and nitrogen addition treatment will lead to the development of distinct differences in rhizosphere bacterial community composition.

1. Introduction

The physiological and ecological processes of plants are susceptible to external habitats, inducing a variety of different changes. Soil physicochemical properties are the most important external factors affecting plant physiology and ecology [1,2]. Plant functional traits such as plant height, root length, aboveground and underground biomass can measure plant productivity. As such, they are often used to reflect the growth status of plants and the structural and functional statuses of plant ecosystems [3]. Water deficit is one of the main limiting factors in plant growth and has an important impact on plant growth, especially in arid and semi-arid areas [4]. Researchers have found that water deficit not only changes the physiological status of plants, but also indirectly affects the rhizosphere microbial community of vegetation through water control. At the same time, plants and their rhizosphere microorganisms also interact with each other. They can use the changes in rhizosphere microbial communities to change the rhizosphere soil environment of plants and improve the adaptability of plants to extreme environments, such as drought, salt, and heavy metal deficit [5,6,7,8]. Nutrient limitation is another major limiting factor in arid and semi-arid areas, including nitrogen, phosphorus, iron, and other elements. Nitrogen source is one of the primary nutrient elements and plays an indispensable role in the growth of desert vegetation. For example, plants have higher competitiveness in high-nutrient environments [9].
H. ammodendron is the constructive species or dominant species of desert plant communities. It plays a significant role in afforestation and water conservation in desert areas. It has the characteristics of plants from extreme habitats such as drought tolerance, salinity, and high light intensity [10,11]. In the growth process of H. ammodendron, it is easily affected by the external environment, such as water, soil, climate and other abiotic environments, as well animal, insect, microbial, and other biological factors. Changes in the physiological and ecological status of H. ammodendron will also affect the status of its rhizosphere microbial community, resulting in changes in its composition.
Soil bacteria are the most abundant soil microorganisms, and they are indispensable biological groups in important processes such as soil organic matter decomposition, humus formation, and nutrient transformation [12]. Developing an in-depth understanding of the deficit adaptation mechanism of H. ammodendron rhizosphere soil bacterial community diversity in desert area is of great significance for afforestation and vegetation restoration in desert areas [13]. Plants can change the nutrient status of rhizosphere soil and other soil physical and chemical properties through root activity, and then change the rhizosphere microbial community structure [14]. Studies have found that rhizosphere microorganisms can improve the adaptability of sorghum to water deficit [15]. Nitrogen addition may lead to changes in rhizosphere microbial community composition and affect plant growth and health [16]. Nitrogen addition also reduces soil fungal community abundance and arbuscular fungal biomass, but significantly increases bacterial biomass or has no significant effect on it [17]. Most studies only consider the effect of single factor on the rhizosphere bacterial community, while the effects of multi-factor interaction on the functional traits of H. ammodendron seedlings and the diversity of rhizosphere microbial communities, areas in urgent need of study, are typically ignored. Through the utilization of water deficit and nitrogen addition control experiments, 16S rDNA was deployed to determine the rhizosphere bacterial community of plant seedlings, and we analyzed the differences in physiological traits and rhizosphere microbial community composition and diversity caused by operating in different treatment conditions in a variety of habitats.

2. Materials and Methods

2.1. Materials

In situ soil was collected from the field scientific observation station of the temperate desert ecosystem in Jinghe, Xinjiang, the Ebinur Lake Wetland National Nature Reserve. The Ebinur Lake Wetland National Nature Reserve is located in Jinghe County, Bortala Mongol Autonomous Prefecture, Xinjiang (44°30′–45°09′ N, 82°36′–83°50′ E), and has a total area of about 2670.8 km2. It is a typical temperate continental climate. The annual sunshine duration is approximately 2800 h, and the average annual temperature is about 6–8 °C. Historically, the highest temperature under extreme conditions can reach 44 °C, while the lowest temperature is −33 °C. The main dominant plant species in this reserve are Populus euphratica, H. ammodendron, Nitraria tangutorum, Phragmites australis, and Apocynum venetum.
The seeds of H. ammodendron were obtained from Luze Ecological Seeds Co., Ltd. (Guyuan, China), and are soaked in 1% sodium hypochlorite solution (diluted with water) for 20~30 min, then washed with water and used. Soil was collected from 0 to 60 cm between the roots of pike in the study area, mixed well, and used as in situ soil. The ratio of the soil matrix was peat soil: in situ soil: perlite = 3:1:1. The treatment method of soil sterilization involved high-pressure steam sterilization, which was then repeated three times. The duration of each sterilization time was 1.5 h. The pot experiment was conducted with a pot height of 30 cm and a diameter of 10 cm. The weight of each basin was 1.9 kg. We used ordinary urea (containing N 46%) as the source for nitrogen addition and dissolved it in deionized water in the form of a solution with a concentration of 22.4 mg·kg−1.

2.2. Methods

2.2.1. Experimental Design

Under the precondition of sterilized (M) and non-sterilized (S) soil, four treatments were set up with four replicates in each group: control group (CK), nitrogen addition group (N), water deficit group (D), and water deficit nitrogen addition group (ND), for a total of 32 samples.
The water treatment was divided into normal water group (70% of field capacity) and water deficit group (30% of field capacity). During the experimental water control process, with sterile water used for irrigation, daily weighing was carried out from 18:00 to 20:00 Beijing time, combined with the use of EM50 soil moisture data collector measurement to observe the dynamics of the relative water content of the soil; the water consumed on that day was replenished, so that the soil field water holding capacity was controlled within the set gradient. The nitrogen addition group was divided into a no addition group and a nitrogen addition group, and was added once a month for a total of three additions from July to September. (Nitrogen addition level was based on the nitrogen content per kg of soil in H. ammodendron habitat [18]).
The experimental environment for potted H. ammodendron seedlings was conducted outdoors under the same temperature and light conditions as in the study area for a total of 5 months from planting to sampling.

2.2.2. Sample Collection and Processing

The control pot plants were excavated from the pot, the surrounding soil was carefully stripped, and the rhizosphere soil was collected via the PBS root washing method [19]. The rhizosphere soil of each plant was put into sterile tubes and marked and stored at −80 °C for the determination of soil microbial community composition and diversity.
Plant samples were collected and plant height, root length, above-ground biomass, and below-ground biomass were measured, where plant fresh weight was used to calculate the root-to-crown ratio of H. ammodendron seedlings with the following equation:
R S R = B B A B
RSR: Root-shoot ratio; BB: Below-ground biomass; AB: Above-ground biomass.
Plant organic carbon was measured using the potassium dichromate dilution heat method, and then the organic matter content was obtained by converting the formula as follows:
S O M = S O C 1.724
SOM: Soil organic matter; SOC: Soil organic carbon.

2.2.3. 16s rDNA Sequencing

Microbial Diversity is based on the Illumina NovaSeq sequencing platform and uses a two-end sequencing (Paired-End) approach to build small fragment libraries for sequencing. Reads are filtered by splicing, clustering, or denoising, and species annotation and abundance analysis are performed. Primers using 16s rDNA universal primers.

2.2.4. Calculation of Rhizosphere Soil Microbial Community Diversity

The raw data obtained by sequencing were spliced after the removal of the primer adapter sequence and the low-quality bases (Phred quality score = 20). The sequences with a length of less than 200 bp were discarded, and the non-specific amplification sequences and chimeras were removed to obtain the effective sequence data of each sample. The 16 S sequence was divided into operational taxonomic units (OTUs), with 97% set as the threshold. RDP classifier 2.12 was used to analyze the representative sequences of OTUs at 97% similarity level, and the species classification information corresponding to each OTU was obtained. The bacterial community composition and relative abundance of each sample were counted, and the α diversity index (Chao1, Shannon index, Simpson index and coverage) was calculated.

2.3. Data Analysis

The differences of functional traits and rhizosphere microbial diversity of H. ammodendron seedlings under water control and nitrogen addition were analyzed using one-way ANOVA and an independent sample t test. Multivariate permutation analysis of variance (PERMANOVA) and principal components were used. Analysis (PCA) was used to analyze and compare the effects of water deficit and nitrogen addition on microbial community composition. Linear discriminant analysis (LEfSe) was used to detect components with significant differences in microbial community composition under conditions of water deficit and nitrogen addition. One-way ANOVA was completed in SPSS26.0. Multivariate permutation analysis of variance and PCA were completed in R, and data visualization was performed in Excel 2019 and Origin 2023b.

3. Results

3.1. Differences of Aboveground and Underground Functional Traits of H. ammodendron Seedlings

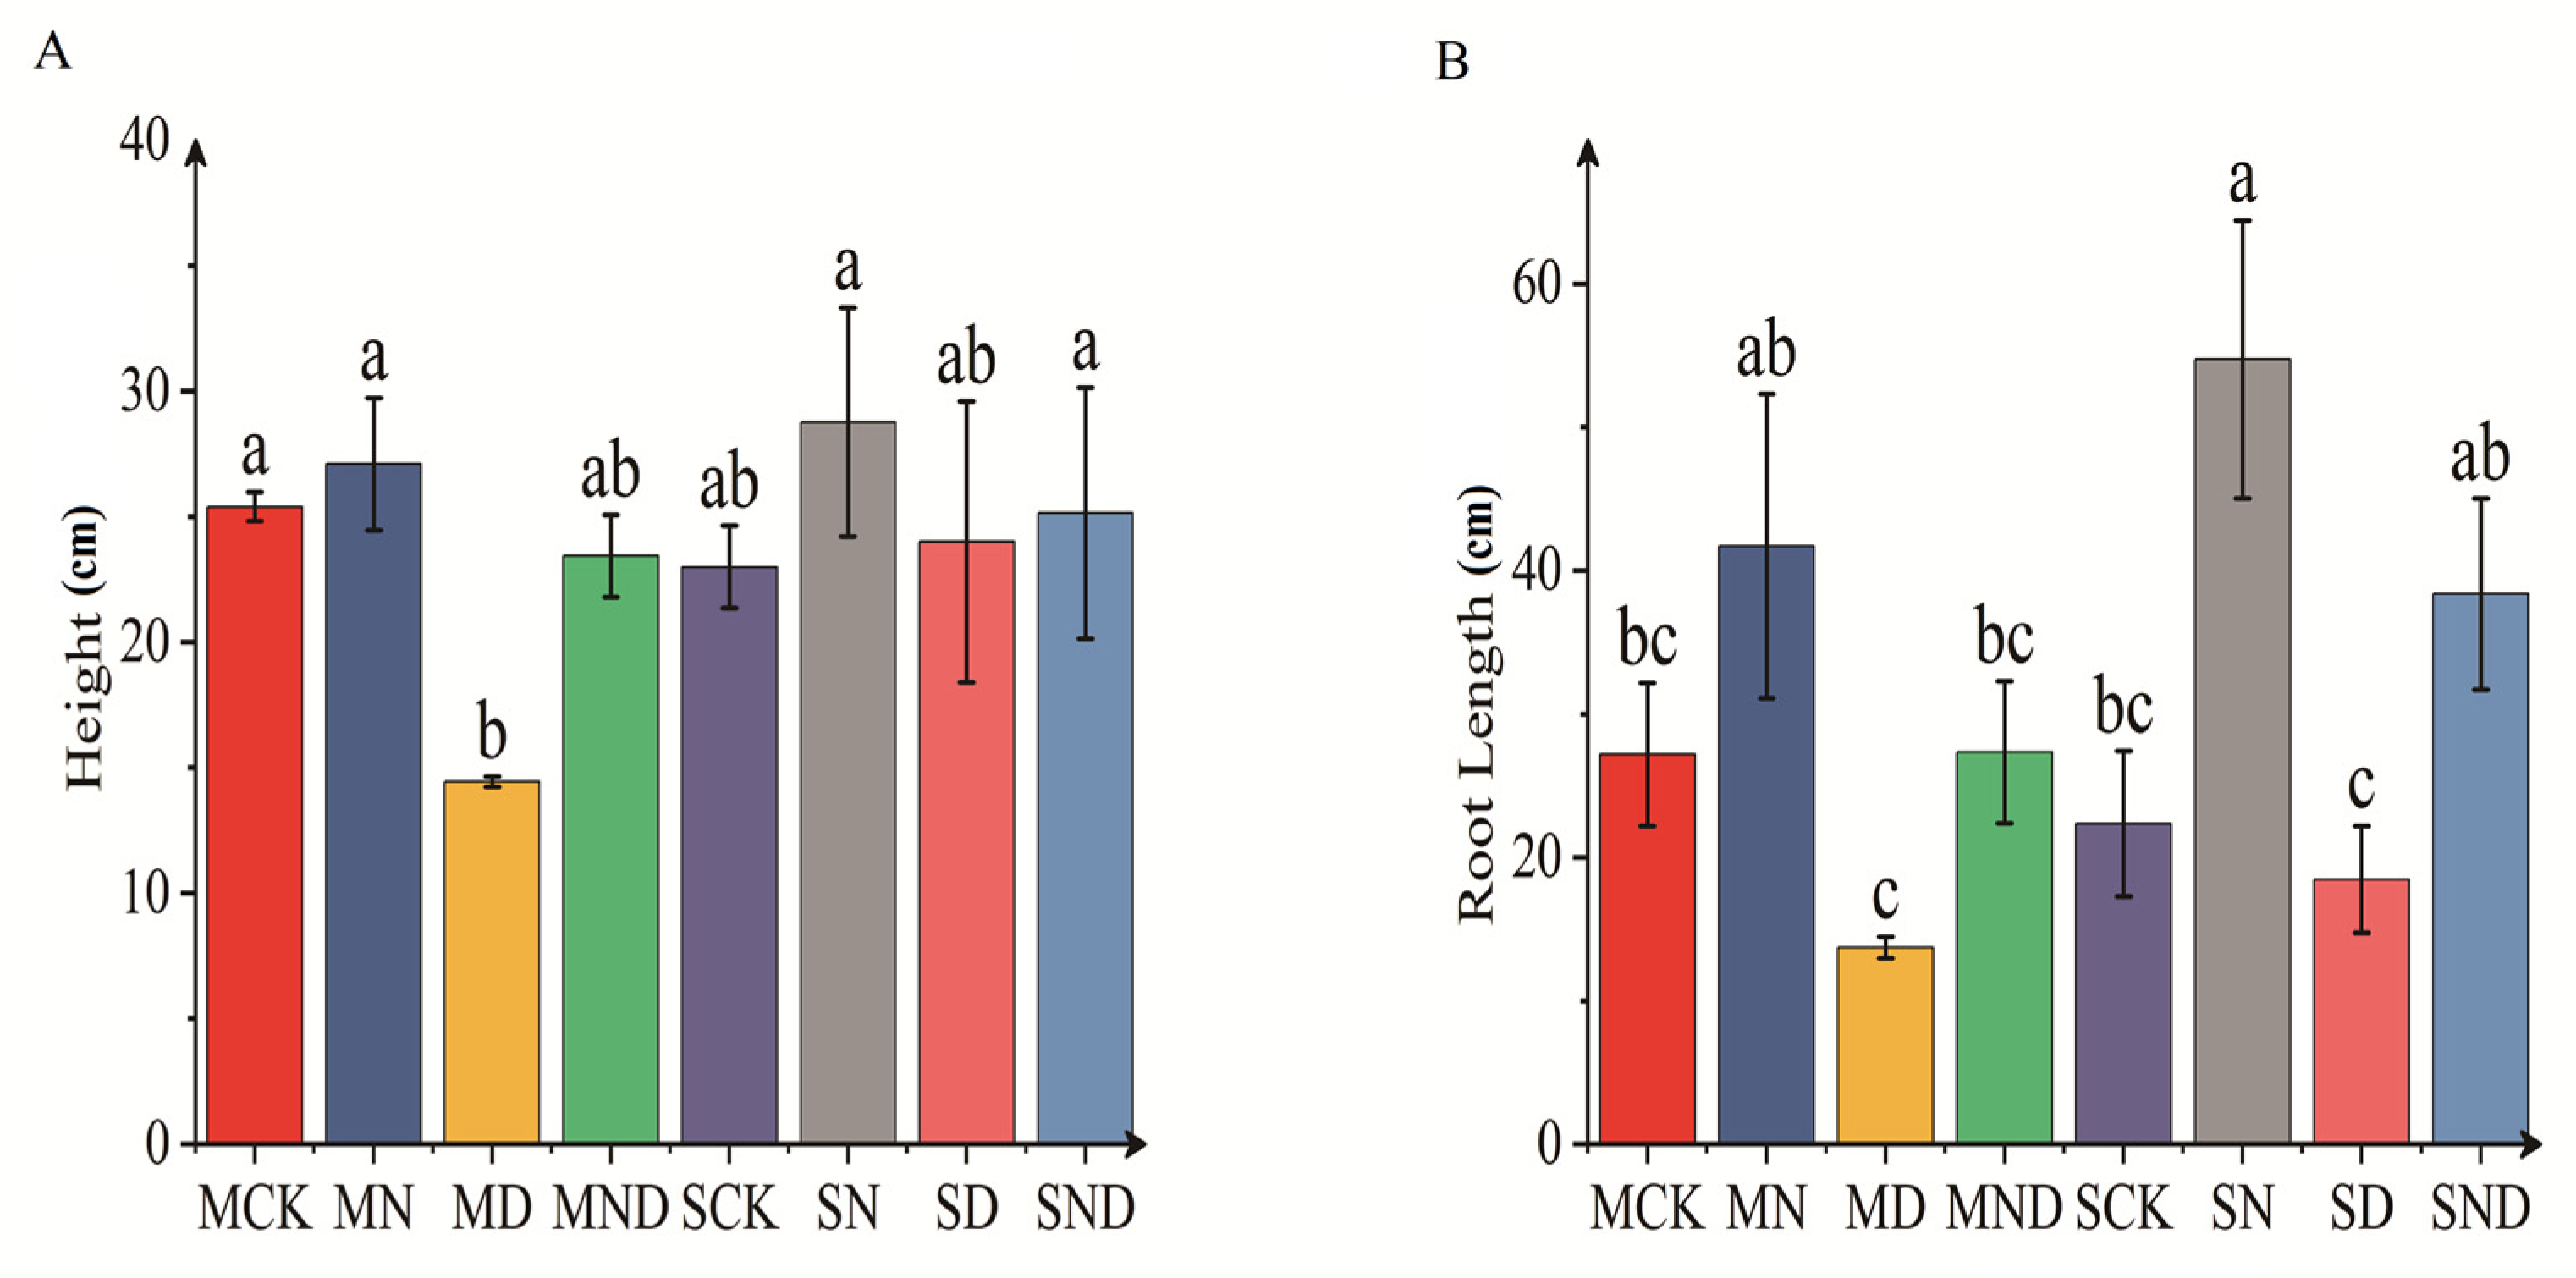
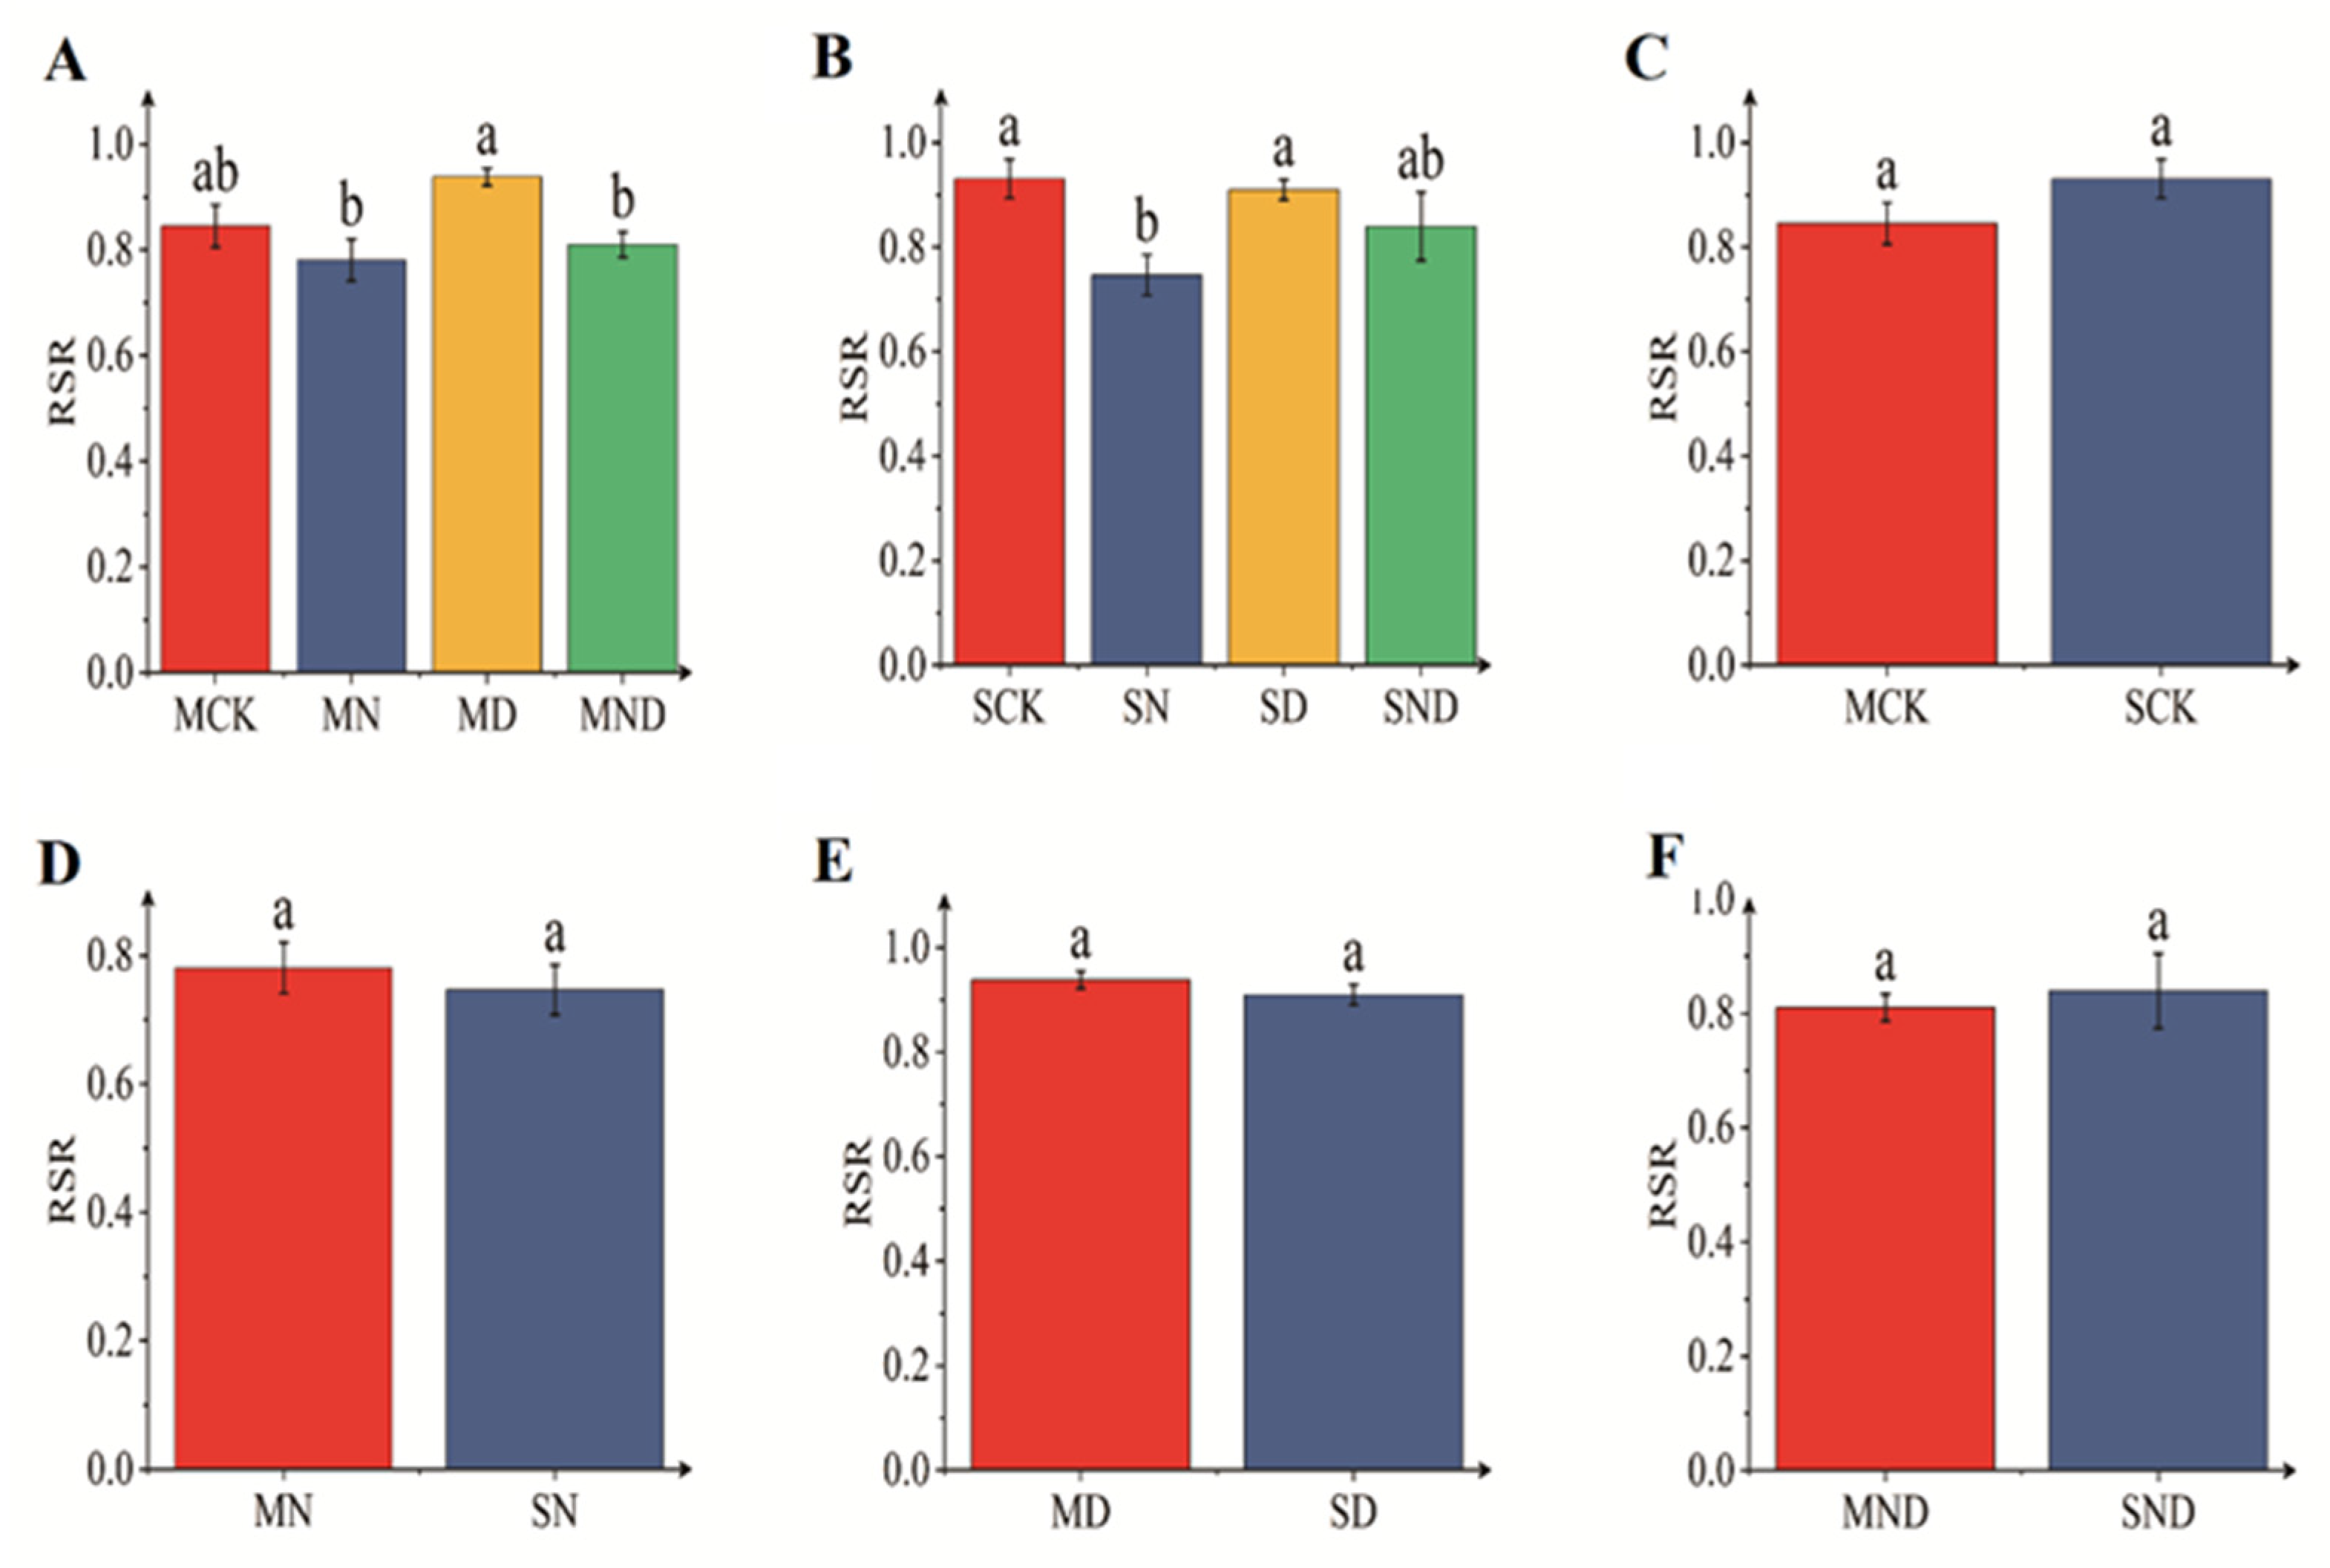
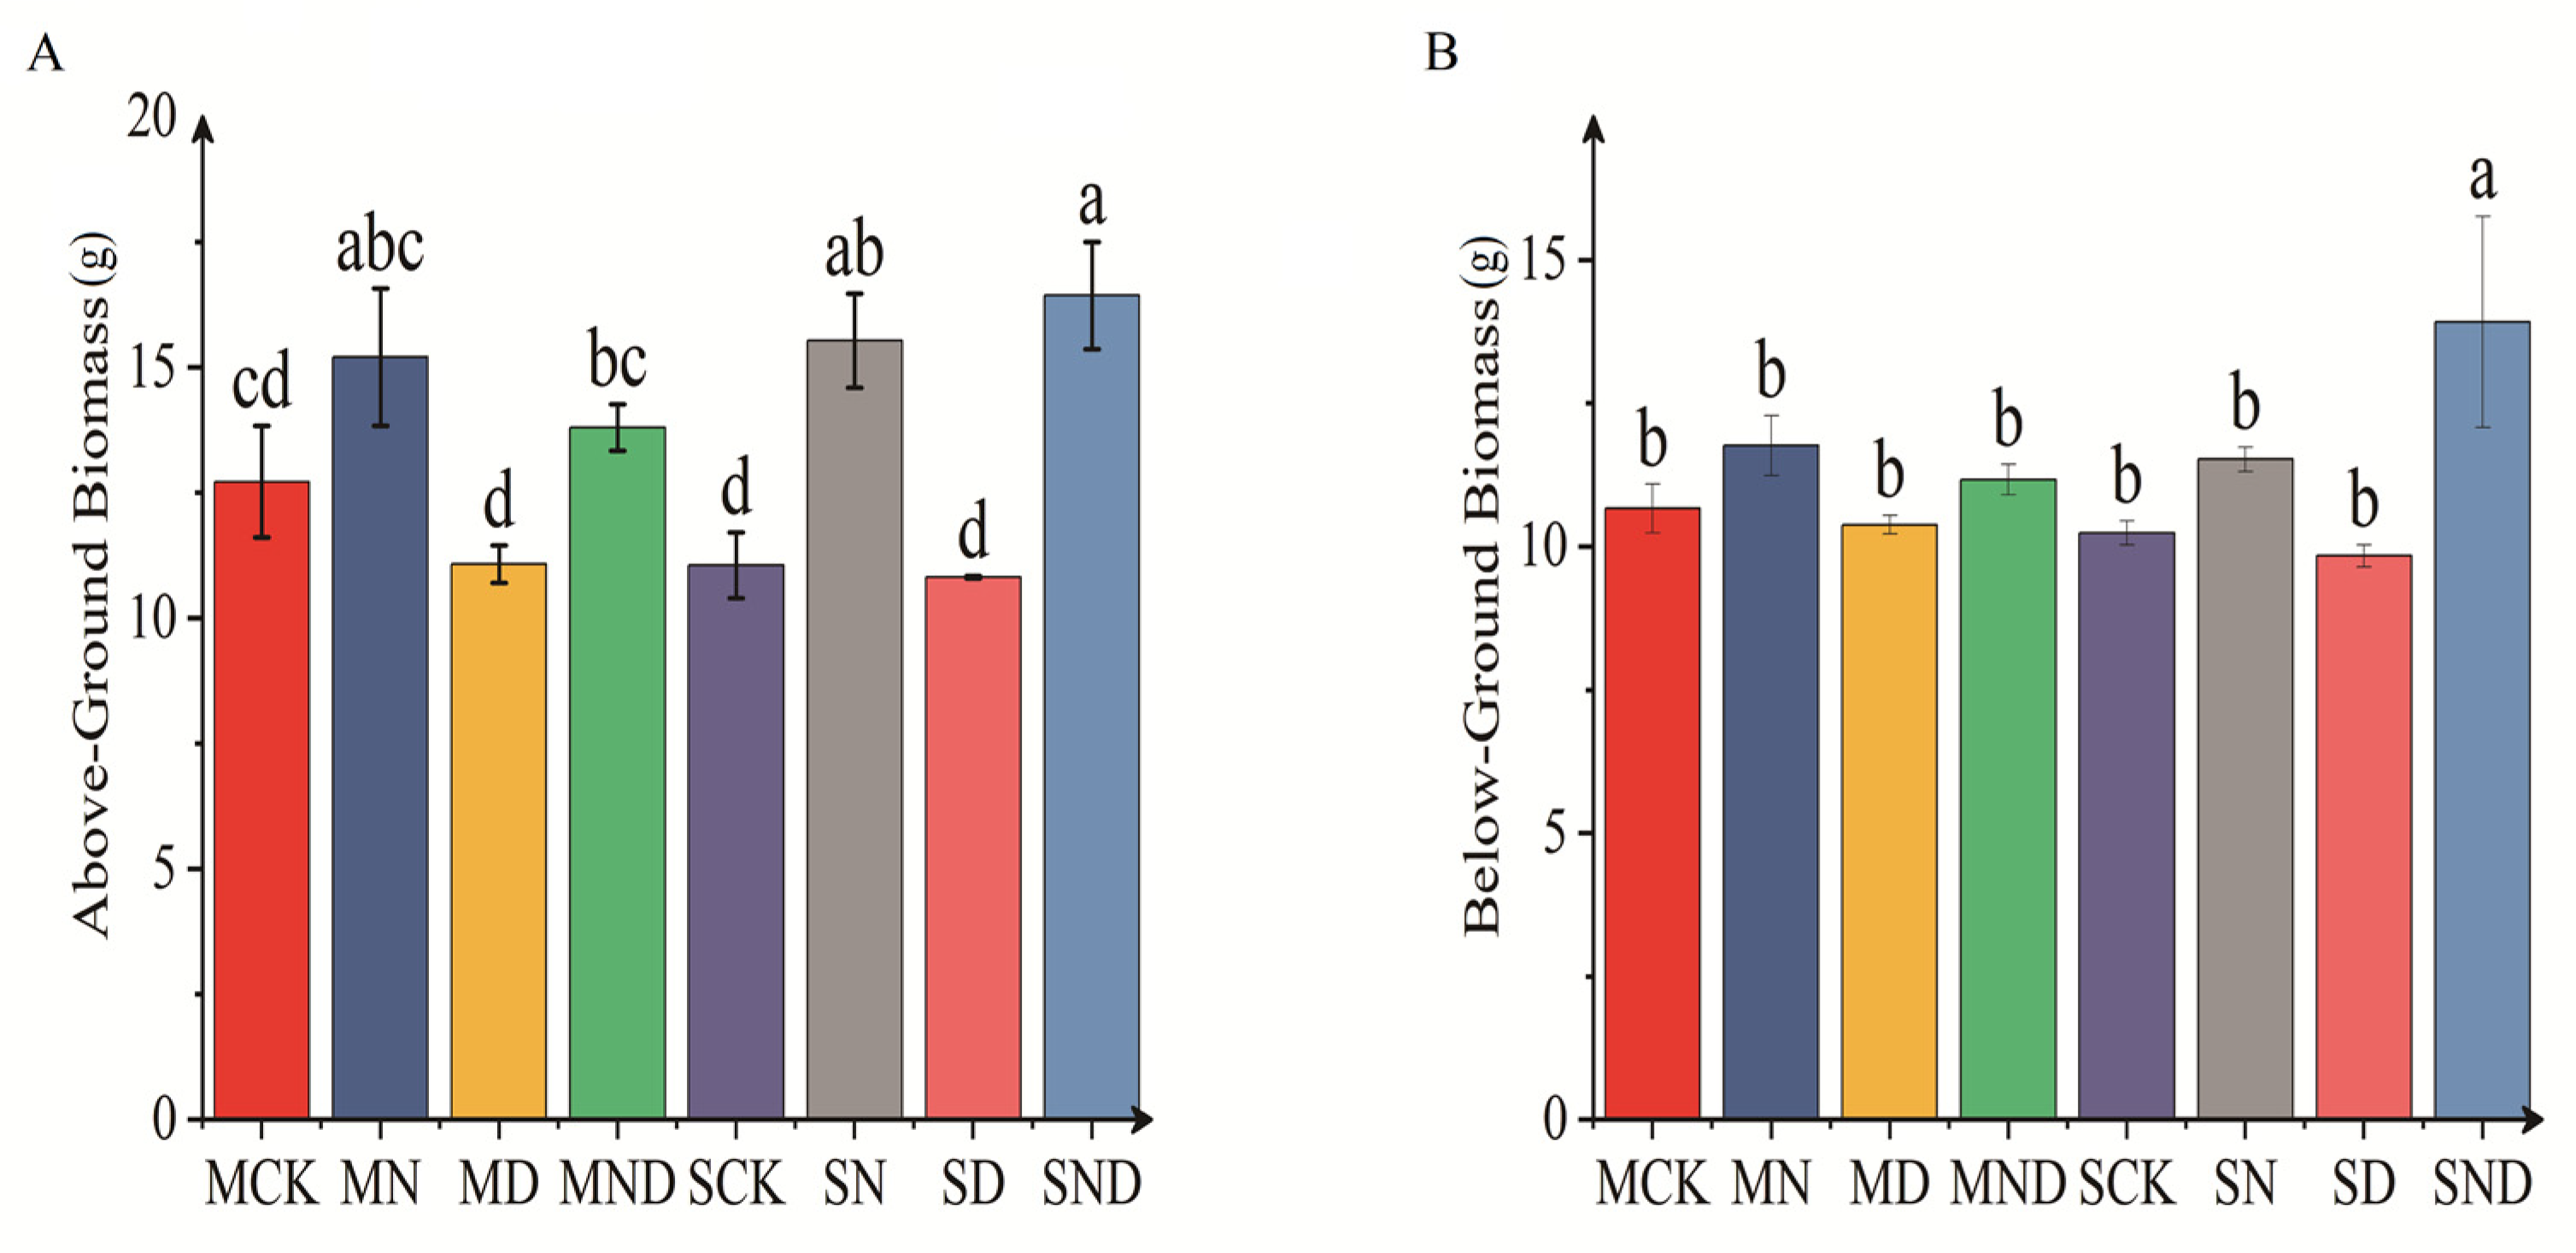
3.1.1. Differences in Aboveground and Underground Morphological Indexes of H. ammodendron Seedlings

Under different soil habitat conditions, the morphological structure of H. ammodendron seedlings changed significantly (Figure 1). Under sterilized and non-sterilized conditions, the root length of H. ammodendron seedlings was affected by water deficit (MD), which was significantly lower than that of the nitrogen addition treatment (MN) (p < 0.05). Similarly, the plant height of H. ammodendron seedlings was also significantly affected (p < 0.05). Under the conditions of sterilization, the plant height of H. ammodendron seedlings under water deficit (MD) treatment was significantly lower than those of the control group (MCK), nitrogen addition group (MN), and water deficit nitrogen addition group (MND) (p < 0.05). Under non-sterile conditions, the plant height of H. ammodendron seedlings was also affected by water deficit (SD), the plant height was significantly lower than that of nitrogen addition (SN), and water deficit nitrogen addition (SND) (p < 0.05). When compared with identical treatments in the sterilization and non-sterilization groups, we found that although the plant height and root length of H. ammodendron seedlings were larger under non-sterilized conditions, this difference was non-significant (p > 0.05).
Under sterilized conditions, the root–shoot ratio of water deficit group was significantly different from that of the nitrogen addition group and water deficit nitrogen addition group (p < 0.05). Under non-sterile conditions, the root–shoot ratio of water deficit group differed significantly from that of the nitrogen addition group (p < 0.05). There was no significant difference in terms of root–shoot ratio between sterilized and non-sterilized conditions (p > 0.05) (Figure 2).
There were significant differences in aboveground and underground biomass of H. ammodendron seedlings under different treatment regimens (p < 0.05). Specifically, under sterile and non-sterile conditions, the aboveground biomass of H. ammodendron seedlings under nitrogen addition treatment (MN) was significantly higher than that under water deficit treatment (MD) (p < 0.05). We observed no significant difference between the nitrogen addition group and the water deficit and nitrogen addition group (p > 0.05). Under the sterilization conditions, the underground biomass of water deficit group was significantly lower than that of nitrogen addition group (p < 0.05). Under non-sterile conditions, with the underground biomass of H. ammodendron seedlings in water deficit, nitrogen addition treatment groups were significantly higher than that in the control group (SCK) and water deficit group (SD) (p < 0.05). The comparison of aboveground and underground biomass between sterilized and non-sterilized groups showed that the aboveground and underground biomasses were higher under sterilized conditions, but that there was no significant difference (p > 0.05) (Figure 3).

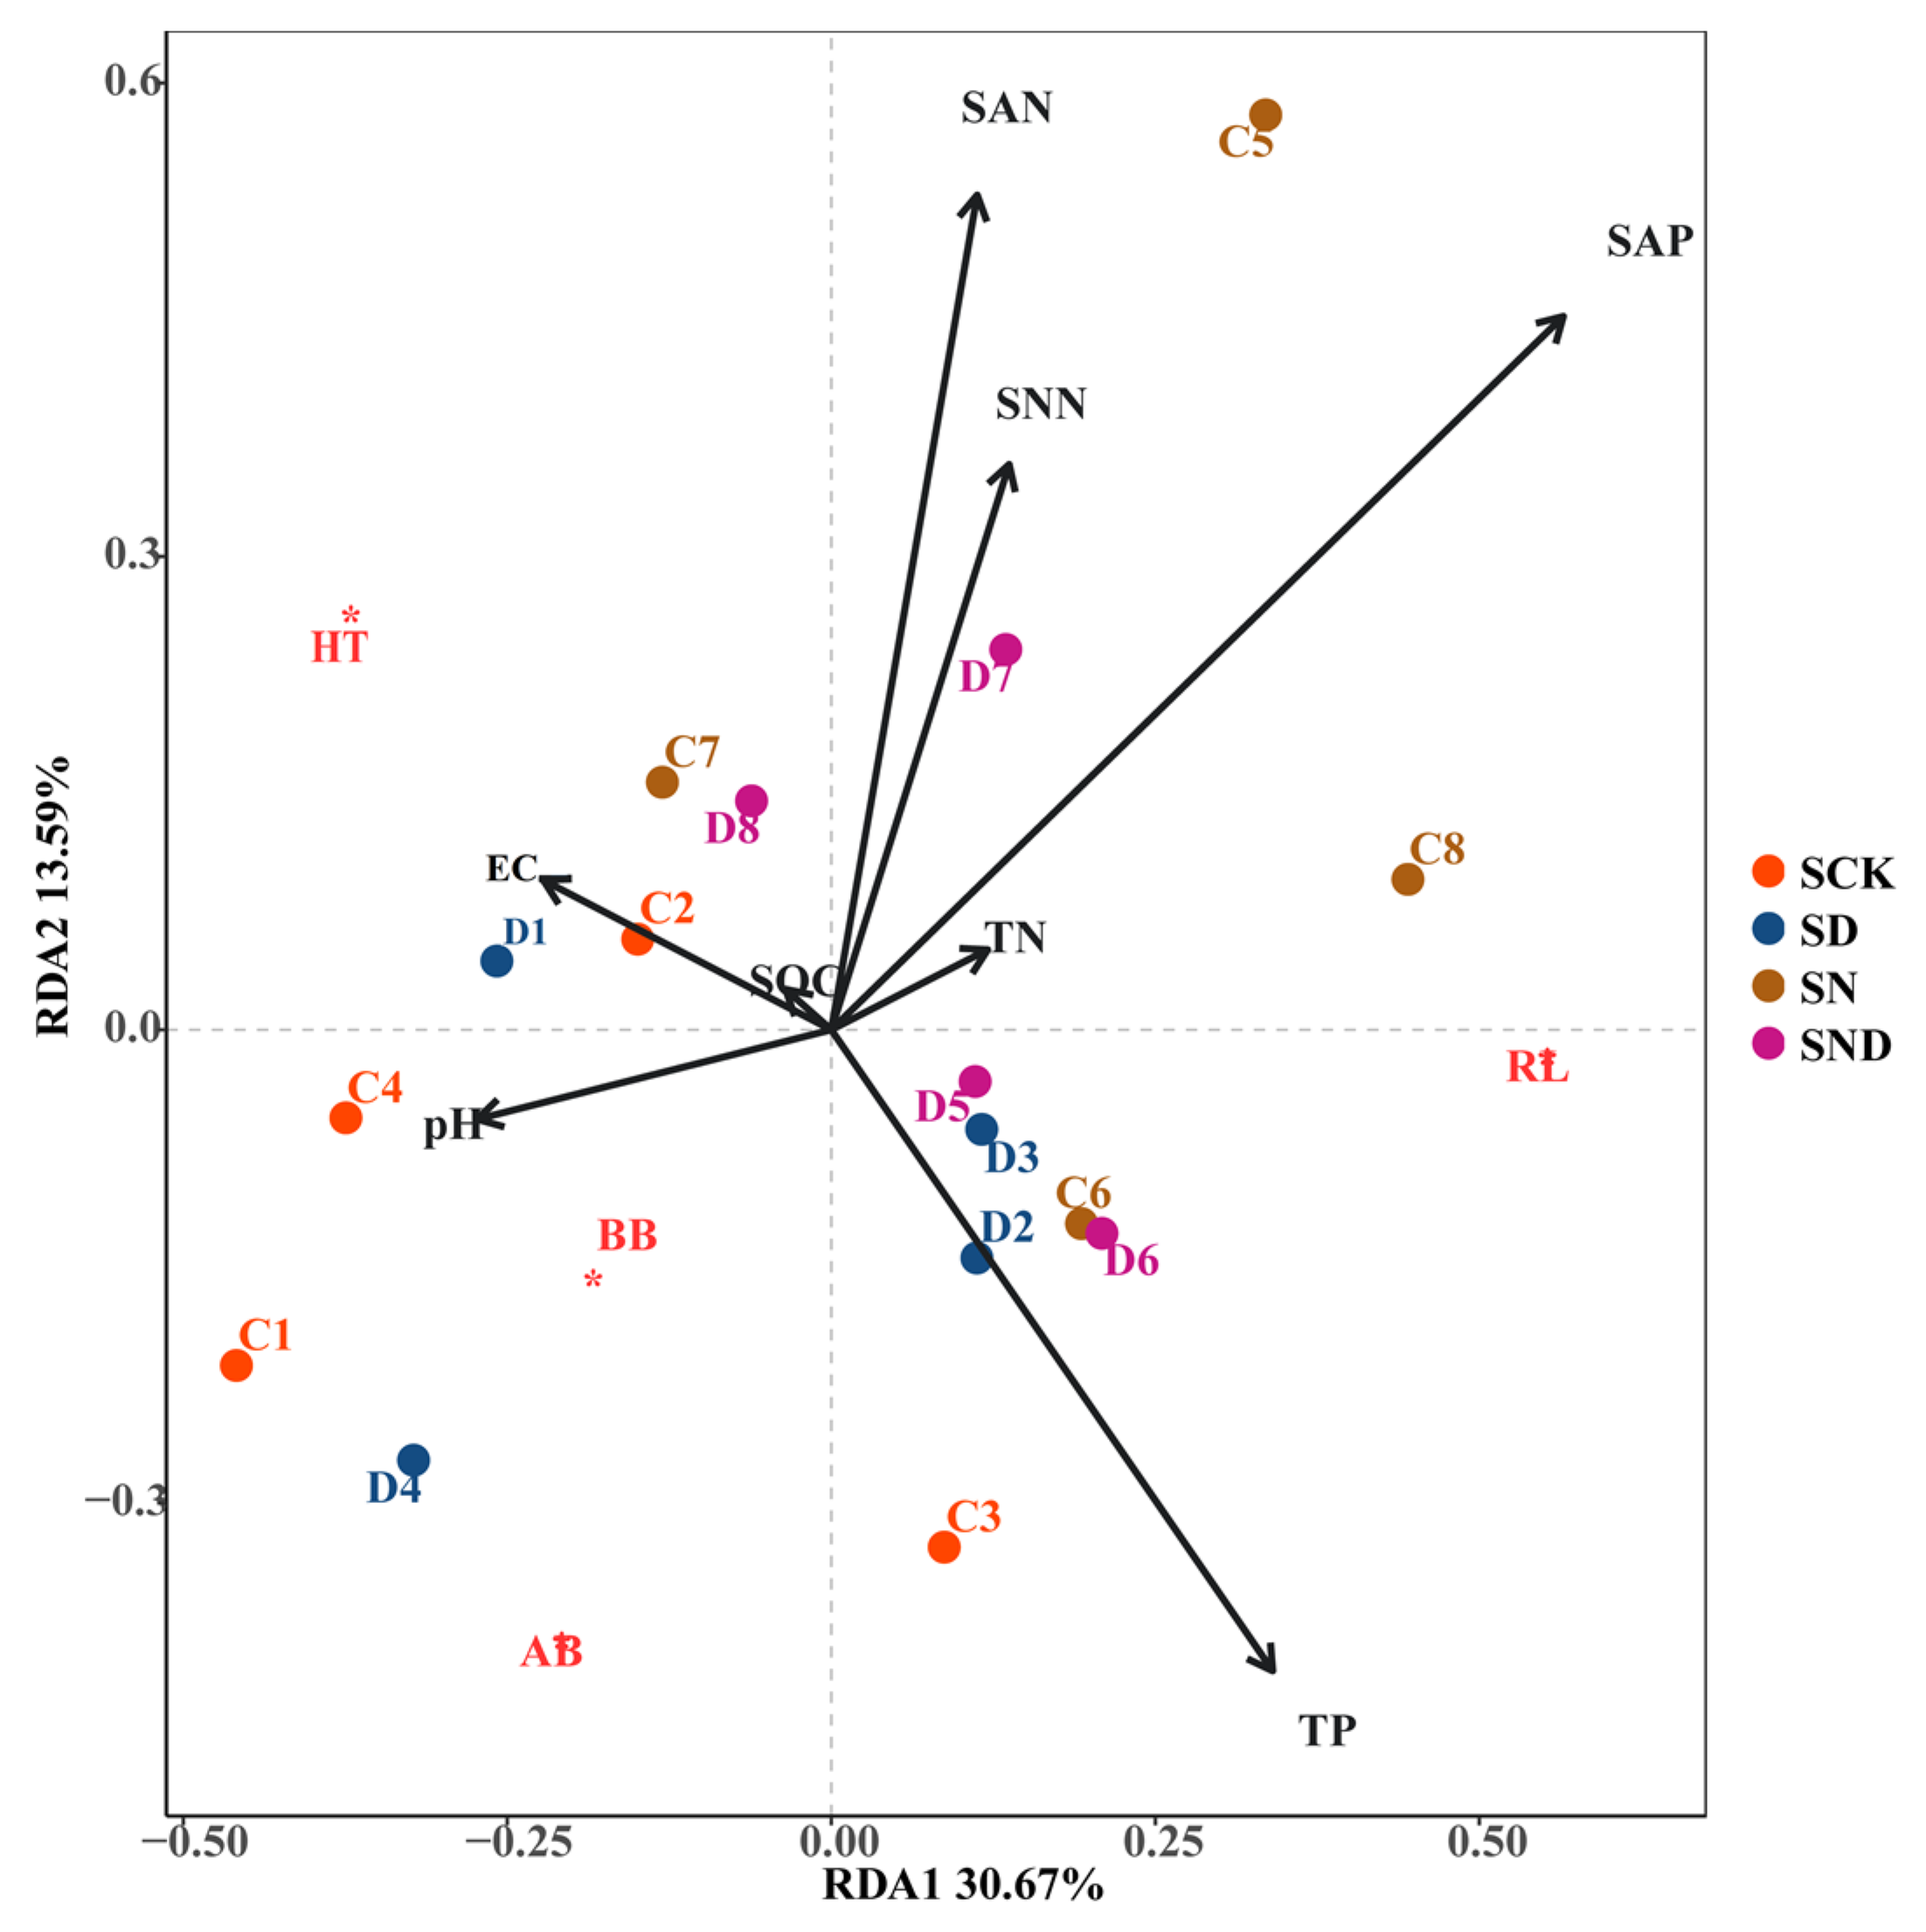
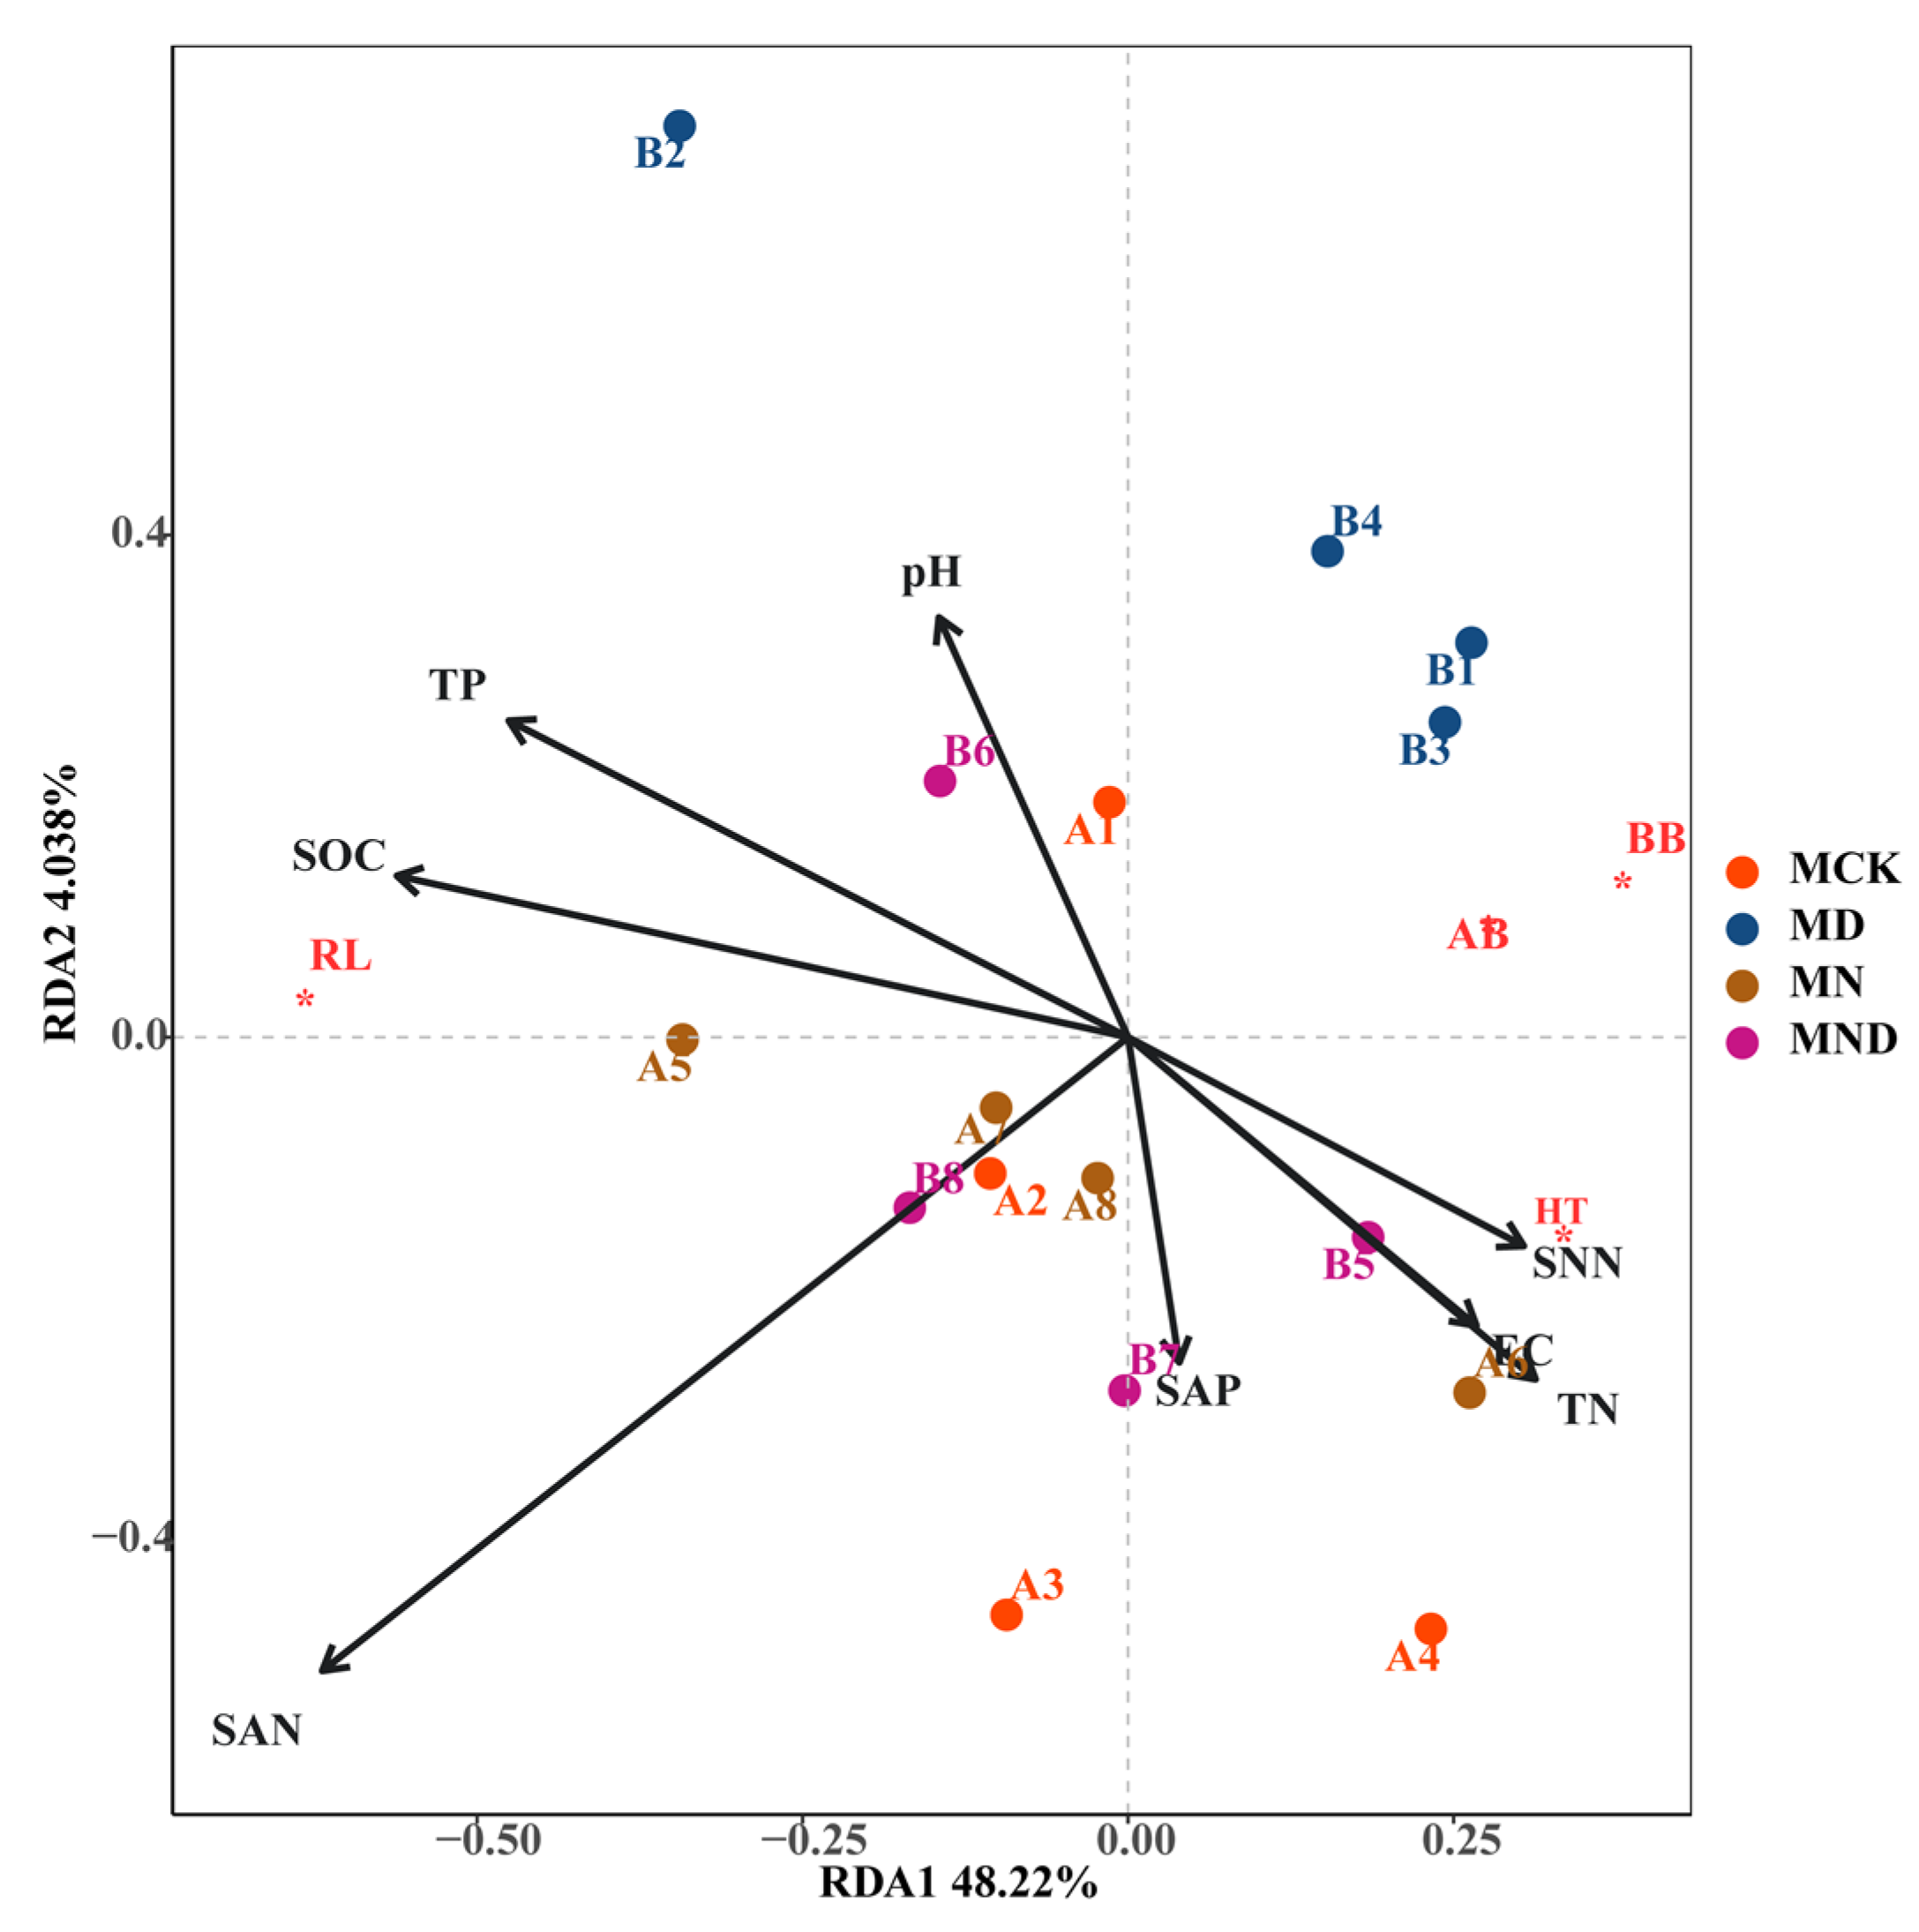
3.1.2. Correlation Analysis between Plant Aboveground and Underground Traits and Environmental Factors

Under sterilization conditions, plant root length (RL) was strongly correlated with soil organic carbon (SOC) and total phosphorus (TP) and displayed a positive correlation with RDA1. Aboveground biomass (AB) and belowground biomass (BB) were negatively correlated with ammonium nitrogen (SAN) in RDA1 and RDA2. On the RDA1 axis, plant height (HT) was positively correlated with available phosphorus (SAP), electrical conductivity (EC), total nitrogen (TN), and nitrate nitrogen (SNN). Conversely, it displayed a negative correlation with ammonium nitrogen (Figure 4).
Under non-sterile conditions, root length (RL) was positively correlated with total phosphorus (P) in terms of RDA1, negatively correlated with pH, and positively correlated with ammonium nitrogen, nitrate nitrogen, total nitrogen, and available phosphorus on the RDA2 axis. The aboveground biomass and belowground biomass were positively correlated with pH and EC, and negatively correlated with ammonium nitrogen, nitrate nitrogen, total nitrogen, and available phosphorus. Plant height was positively correlated with conductivity, ammonium nitrogen, nitrate nitrogen, available phosphorus, and total nitrogen on the RDA2 axis (Figure 5).

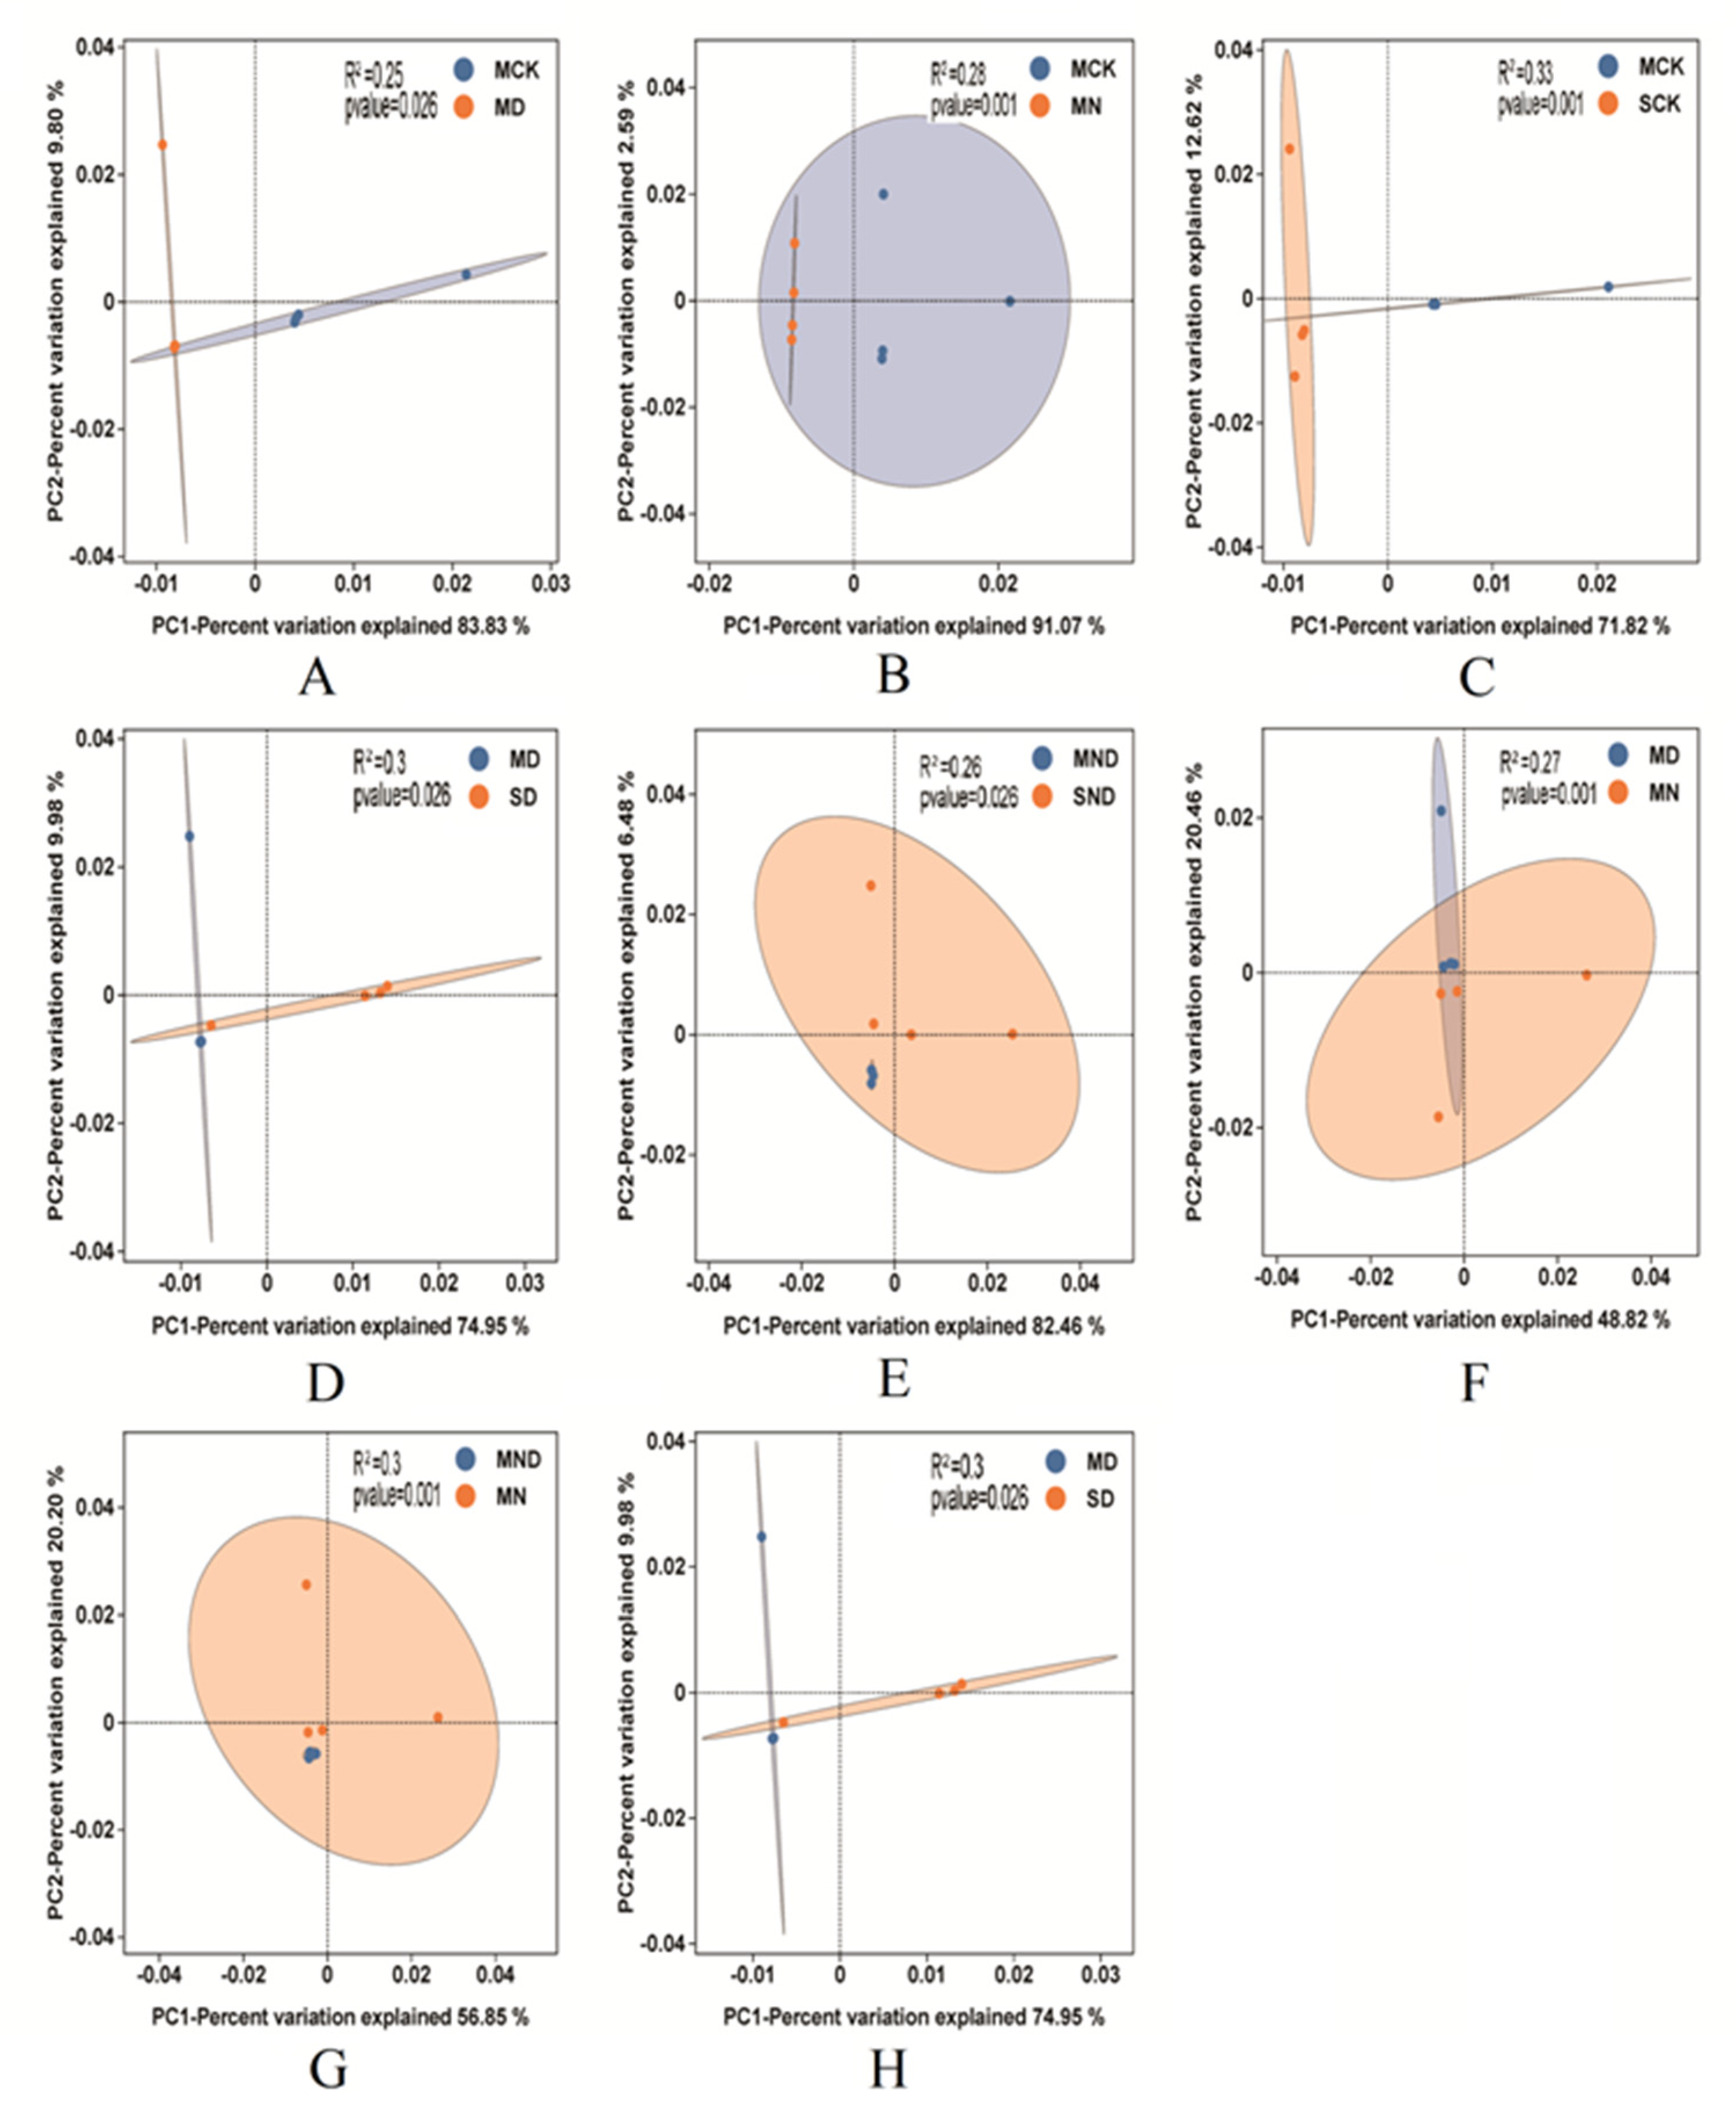
3.2. Diversity of Rhizosphere Bacterial Community in H. ammodendron Seedlings

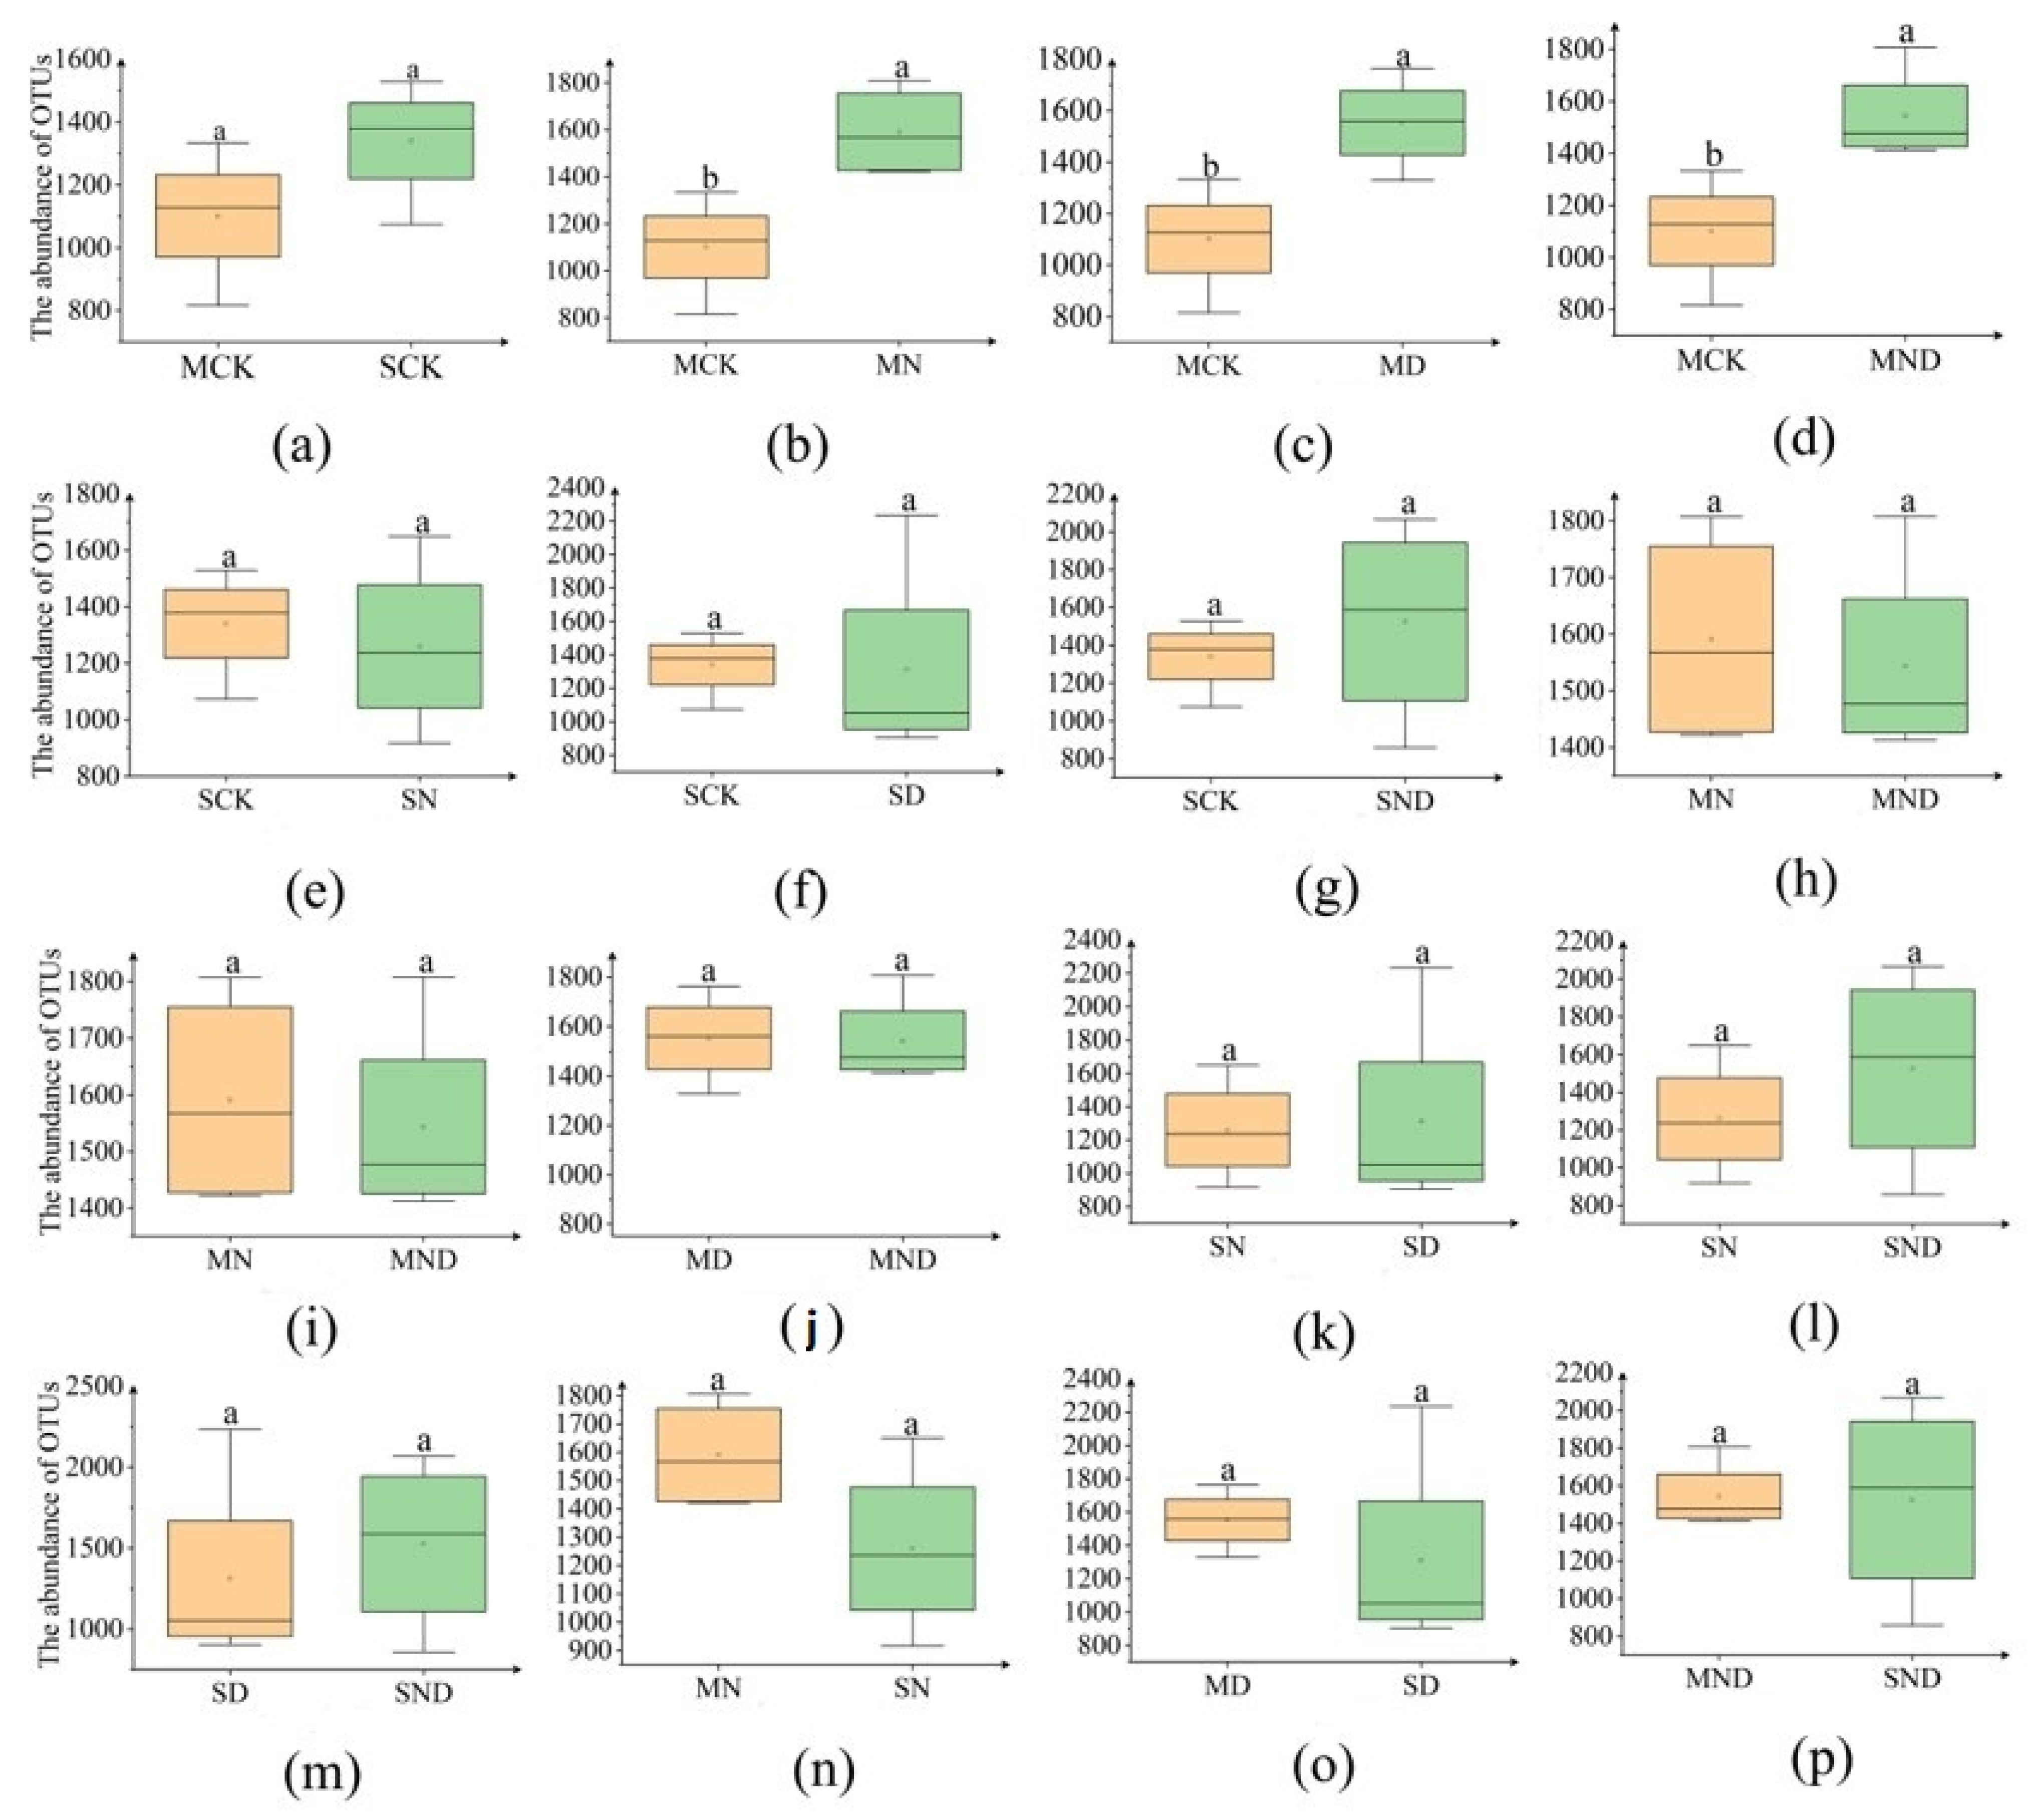
3.2.1. Differences in Rhizosphere Bacterial Community Abundance of H. ammodendron Seedlings

The number of OTUs can directly reflect the difference in bacterial community abundance between groups of samples (Figure 6). Under sterilization treatment, the bacterial abundance of the control group (MCK) was lower than that of the nitrogen addition group (MN), water deficit group (MD) and water deficit nitrogen addition group (MND), and there was a significant difference (p < 0.05) (Figure 7).

3.2.2. Alpha Diversity of Bacterial Community in H. ammodendron Seedlings

Under sterilization conditions, the control group (MCK) and water deficit (MD), nitrogen addition group (MND) had significant differences in terms of Simpson index value (p < 0.05); there were significant differences between water deficit group (MD), nitrogen addition group (MN), and the water deficit nitrogen addition group (ND) (p < 0.05). The nitrogen addition group (N) and water deficit nitrogen addition group (MND) displayed significant differences (p < 0.05). Under non-sterile conditions, there was no significant difference in Simpson index between the control group (MCK), the water deficit group (MD), nitrogen addition group (MN), and water deficit nitrogen addition group (MND) (p > 0.05). The ACE, Chao1, and Shannon index values of soil bacteria under non-sterile nitrogen addition treatment conditions were the largest, and the soil bacterial diversity index value of non-sterile control group was the smallest. There was a significant difference between the non-sterile nitrogen addition treatment and the non-sterile water deficit nitrogen addition treatment and the control group (p < 0.05) (Table 1).

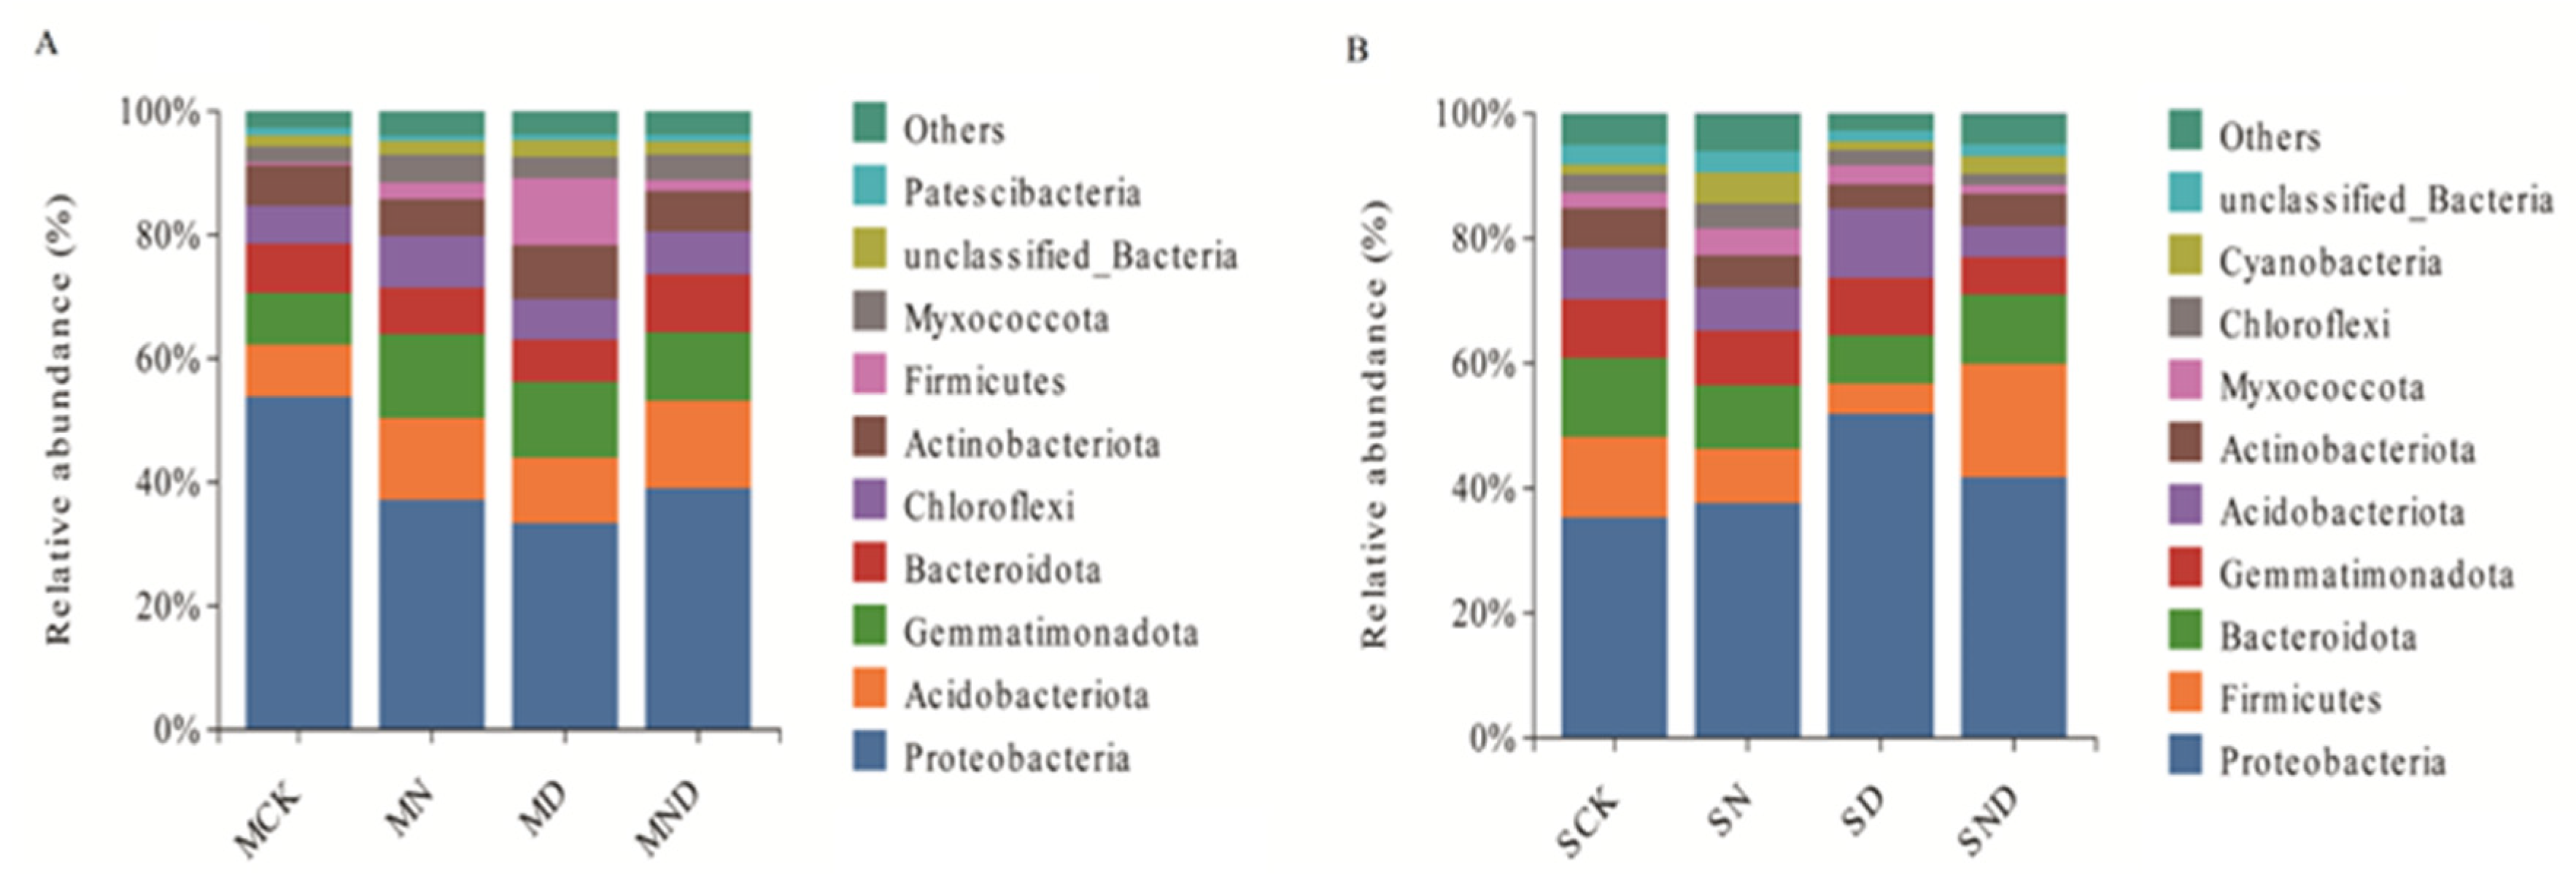
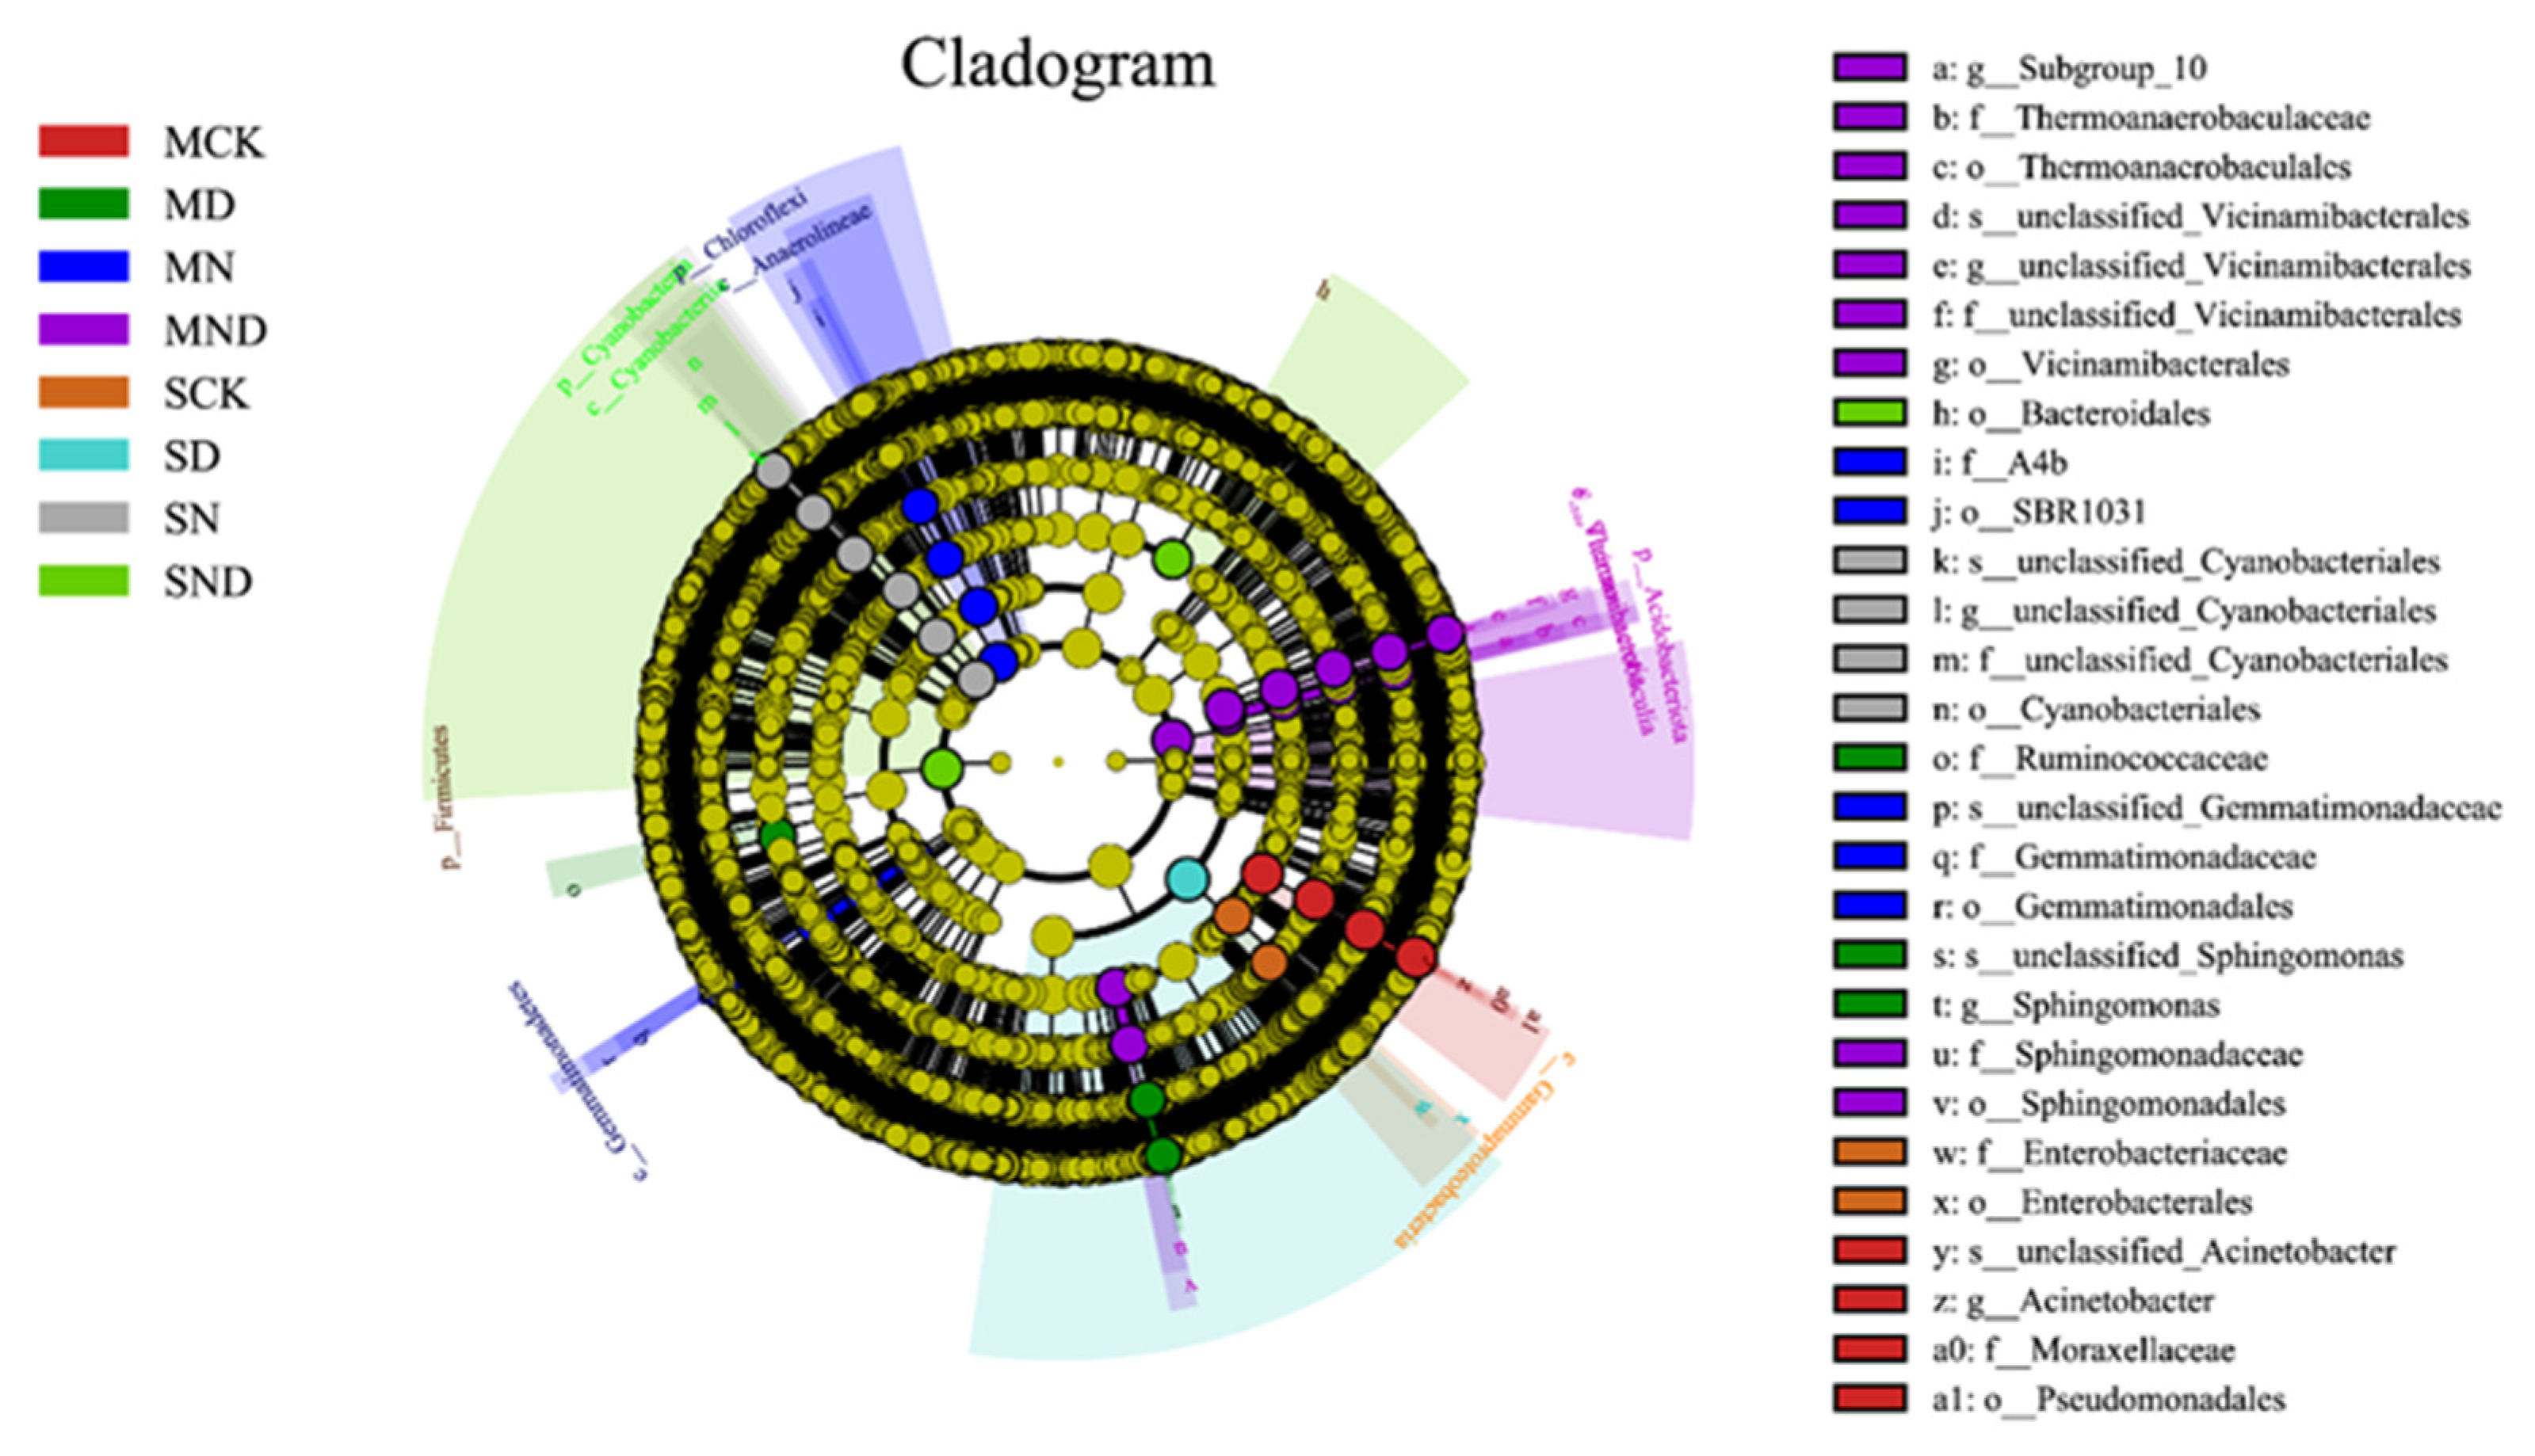
3.2.3. Changes in Soil Bacterial Community Composition under Different Treatments

Through PCA analysis, we uncovered that, under sterilization conditions, nitrogen addition and water deficit groups were significantly different from the control group (p < 0.05). Indeed, nitrogen addition, water deficit, and water deficit nitrogen addition treatment also had significant differences (p < 0.05). There were further significant differences between the results of the control group, nitrogen addition, water deficit, and water deficit nitrogen addition (p < 0.05).
The results showed that, at the gate level, the 8 measured treatment groups belonged to 45 gates. Among them, under sterilization treatment conditions, the top 10 groups included Proteobacteria, Acidobacteria, Gemmatimonadetes, Bacteroides, Chloroflexi, Actinobacteria, Firmicutes, Myxococcota, unclassified_Bacteria, Patescibacteria, and a number of others. In non-sterilized treatment conditions, the top 10 groups included Proteobacteria, Firmicutes, Bacteroides, Gemmatimonadetes, Acidobacteria, Actinobacteria, Myxococcota, Chloroflexi, Cyanobacteria, unclassified_Bacteria. The rhizosphere bacterial community composition of each treatment was the same, and the dominant species were similar, but the abundance was slightly different (Figure 8).
To analyze the specific taxonomic groups of bacteria in different treatment groups, linear discriminant analysis (LDA) effect size (LEfSe) difference analysis was performed to select biomarkers from the phylum to the genus level. The analysis showed that in the sterilization and non-sterilization treatment, each treatment group had characteristic biological species. These tended to be concentrated in Proteobacteria, Acidobacteria and Bacteroidetes. Under sterilized conditions, Gemmatimonadales and SBR1031 were significantly enriched in the nitrogen addition group (MN). In the nitrogen addition group (MND) under water deficit, sphingomonas, sulphurococcus, and thermoaerophilic bacteria were significantly enriched. Under non-sterile conditions, the enrichment of Pseudomonas in nitrogen addition group (N) was significant; in the water deficit nitrogen addition group (ND), cyanobacteria were significantly enriched (Figure 9).

4. Discussion

4.1. Physiological and Ecological Changes in H. ammodendron Seedlings under Nitrogen and Water Coupling

In the present study, the growth status of H. ammodendron seedlings was affected by water deficit and nitrogen addition. Under non-sterilized conditions, root length and plant height of H. ammodendron seedlings were significantly increased in the nitrogen-added group compared to the control group (p < 0.05). Similarly, plant height and root length in the water-deficient nitrogen addition group also increased significantly (p < 0.05) compared to the water deficit group and the control group, a result consistent with previous studies indicating that nitrogen addition promotes the growth of H. ammodendron seedlings and water deficit inhibits the growth of H. ammodendron seedlings [20,21]. However, in the sterilization treatment, there was no significant difference in root length and plant height between the nitrogen addition group and the control group. The root length and plant height of the water deficit group were significantly lower than those of the control group (p < 0.05), indicating that the growth of the plant was affected under conditions water deficit, and that nitrogen addition slowed down the effect of water deficit on the physiological state of the plant [22]. In addition, sterilization and non-sterilization treatments affect the root length of plants, and plants under sterilization treatment show a significant increase in root length and plant height compared to non-sterilization treatment (p < 0.05), with the maximum plant height in the non-sterilized group being significantly greater than that in the sterilized group [23,24]. Some microorganisms in the soil under non-sterilized conditions can effectively promote plant growth [25].
The experimental results show that water deficit and nitrogen addition can significantly affect the aboveground and underground biomass of plants, and previous studies have also demonstrated the validity of the relevant conclusions [26]. The aboveground and underground biomass of the nitrogen addition treatment group under sterilized and non-sterilized conditions was significantly higher than that of the water deficit group (p < 0.05), but the root length and plant height of the plants under sterilized treatment were significantly different from those under non-sterilized treatment (p < 0.05). In this study, we found that the root–shoot ratio of plants under water deficit treatment was higher compared to other treatments under both sterilized and non-sterilized conditions, especially significantly different from the nitrogen addition treatment group (p < 0.05) [27], which indicates that H. ammodendron seedlings under water deficit conditions allocated more biomass to the lower part of the ground to ensure the growth of the lower part of the ground, while the root–shoot ratio of H. ammodendron seedlings under the combined effect of water deficit and nitrogen addition was not significantly different relative to the control (p > 0.05), indicating that nitrogen addition would alleviate the water deficit to which the plants were subjected.

4.2. Changes in Rhizosphere Microbial Community in H. ammodendron Seedlings

Studies have shown that the composition and richness of plant rhizosphere microbial communities vary among different external habitats [28]. Water deficit will have a negative impact on the microbial community, resulting in a decrease in rhizosphere bacterial community diversity [29]. The same study found that excessive nitrogen addition can also lead to decreases in rhizosphere bacterial community diversity [30]. However, scholars have drawn multiple different conclusions. Some studies have found that drought disturbance can sometimes promote the diversity of rhizosphere bacterial communities. Similarly, nitrogen addition treatment has also been found to promote significant increases in rhizosphere bacterial community abundance [31].
This study found that under non-sterile conditions, water deficit reduced the abundance of rhizosphere bacterial communities and reduced microbial community diversity, which was consistent with previous studies [32]. At the same time, it was also found that the diversity of rhizosphere bacterial communities treated with nitrogen addition was also reduced, that is, both water deficit and nitrogen addition lead to decreases in the abundance of bacterial microbial communities. This result mirrored those of previous studies [33]. However, under the combined treatment of the two, the abundance of rhizosphere bacterial communities increased, and the diversity of the bacterial communities increased [34]. Additionally, because the initial soil is barren, nitrogen addition has a greater advantage in promoting the diversity of bacterial microbial communities, resulting in an increase in bacterial microbial diversity [35]. Under the condition of sterilization, water deficit and nitrogen addition alone can promote the abundance of the rhizosphere soil microbial community. Compared with the effects of the control treatment, the increase in bacterial community abundance is significant. This may be because the rhizosphere bacterial community is in the process of community restoration and reconstruction after sterilization treatment, which indicates that the diversity of rhizosphere microbial community is far lower than that of the normal community level, meaning that the application of external environmental factors cannot inhibit the growth of rhizosphere bacteria. When the two work together, water deficit and nitrogen addition will reduce the diversity of rhizosphere bacterial microbial communities. This may be due to the combination of the two, resulting in a great increase in the amount of bacterial microorganisms and resource competition, which in turn decreases the abundance of rhizosphere bacterial microbial communities. It is speculated that the initial soil habitat conditions of sterilized or non-sterilized soil will affect the diversity of rhizosphere bacterial communities [36].
The bacterial community in rhizosphere soil is affected by water deficit and nitrogen addition, leading to differences in community composition [30,33]. Under sterilized conditions, the composition of rhizosphere bacterial microbial communities at the phylum level was different under different treatments. Acidobacteria, Gemmatimonadetes, and Chloroflexi were more abundant in the nitrogen addition treatment group than in the control group. Acidobacteria lived in an oligotrophic manner in the ecosystem, and their high content indicated poor soil nutrition. Among them, Gemmatimonadetes lived more in nitrogen-rich soil, and Chloroflexi participated in nitrogen cycle. Their higher abundance indicated that nitrogen addition influenced soil bacterial community composition [37,38,39]. In water deficit treatment, the abundance of Actinobacteria and Firmicutes was higher than that of the control group, and the proportion of bacterial community increased. This showed that water deficit had a greater impact on Actinomycetes and Firmicutes. Under the combined action of water deficit and nitrogen addition, the abundance of Acidobacteria and Bacteroidetes was higher, and Bacteroidetes played a greater role in degrading polysaccharides [40,41,42]. Under non-sterile conditions, the abundance of Myxobacteria, Chloroflexi, and Cyanobacteria in the nitrogen addition group was higher than that in the control group. In the water deficit treatment group, the abundance of Proteobacteria and Myxococcus was higher than that of the control group and the water deficit nitrogen addition group, indicating that some genera of Proteobacteria participated in plant physiological processes and played a significant role in plant deficit resistance [43]. The above viewpoint was also confirmed by LEfSe analysis. Due to different treatment conditions, the specific flora of the rhizosphere bacterial community was enriched, giving nitrogen fixation in Cyanobacteria and strong drought tolerance in Gemmatimonadetes [44].
This study also has some limitations. In the future, root exudates and microorganisms should be combined to study the response of plants to soil environmental changes and determine how root exudates mediate rhizosphere microbial community changes by changing the soil habitats of plants.

5. Conclusions

In short-term control trials, water deficiency inhibited the growth of pokeweed seedlings and was more pronounced under non-sterilized conditions. Nitrogen addition was effective in alleviating water deficit in plants. Water deficiency changed the original carbon allocation ratio of the plants, transporting more carbon underground thus promoting the growth of the below-ground organs of the plants.
The effects of water deficit and nitrogen addition on the diversity of inter-rooted bacterial communities of P. sylvestris seedlings under different initial soil conditions were significantly different. Under soil sterilization conditions, both water deficit and N addition alone promoted an increase in bacterial community abundance and diversity and altered the composition of the inter-root microbial community. However, the diversity of the inter-rooted microbial community was suppressed by the combined effect of both. Under non-sterilized conditions, water deficiency and nitrogen addition alone suppressed the diversity of the inter-rooted bacterial community of P. spp. seedlings, while the combination of both promoted bacterial diversity.

Author Contributions

Conceptualization, M.Z.; methodology, M.Z.; software, M.Z.; validation, L.J., D.W., H.Y. and W.L.; formal analysis, M.Z.; investigation, M.Z.; resources, M.Z.; data curation, M.Z.; writing—original draft preparation, M.Z.; writing—review and editing, M.Z.; visualization, M.Z.; supervision, X.H.; project administration, X.H.; funding acquisition, X.H. All authors have read and agreed to the published version of the manuscript.

Funding

This research was financially supported by the National Natural Science Foundation of China (32260266): National Natural Science Foundation of China (32101360) and Xinjiang Uygur Autonomous Region innovation environment Construction special project & Science and technology innovation base construction project (PT2107).

Data Availability Statement

Data will be made available on request.

Conflicts of Interest

The authors declare no conflict of interest.

References

  1. Wang, J.; Duan, B.; Zhang, Y. Effects of Experimental Warming on Growth, Biomass Allocation, and Needle Chemistry of Abies Faxoniana in Even-Aged Monospecific Stands. Plant Ecol. 2012, 213, 47–55. [Google Scholar] [CrossRef]
  2. Yang, X.; Long, Y.; Sarkar, B.; Li, Y.; Lü, G.; Ali, A.; Yang, J.; Cao, Y.-E. Influence of Soil Microorganisms and Physicochemical Properties on Plant Diversity in an Arid Desert of Western China. J. For. Res. 2021, 32, 2645–2659. [Google Scholar] [CrossRef]
  3. Mokany, K.; Raison, R.J.; Prokushkin, A.S. Critical Analysis of Root: Shoot Ratios in Terrestrial Biomes. Glob. Chang. Biol. 2005, 12, 84–96. [Google Scholar] [CrossRef]
  4. Singla-Pareek, S.L. Transcription Factors and Plants Response to Drought Deficit: Current Understanding and Future Directions. Front. Plant Sci. 2016, 7, 1029. [Google Scholar] [CrossRef]
  5. Xu, L.; Naylor, D.; Dong, Z.; Simmons, T.; Pierroz, G.; Hixson, K.K.; Kim, Y.-M.; Zink, E.M.; Engbrecht, K.M.; Wang, Y.; et al. Drought Delays Development of the Sorghum Root Microbiome and Enriches for Monoderm Bacteria. Proc. Natl. Acad. Sci. USA 2018, 115, E4284–E4293. [Google Scholar] [CrossRef]
  6. Fang, S.; Liang, X. Response Mechanisms of Plants Under Saline-Alkali Deficit. Front. Plant Sci. 2021, 72, 673–689. [Google Scholar] [CrossRef]
  7. Fang, Y.; Xiong, L. General Mechanisms of Drought Response and Their Application in Drought Resistance Improvement in Plants. Front. Plant Sci. 2021, 12, 667458. [Google Scholar] [CrossRef]
  8. Etesami, H. Bacterial Mediated Alleviation of Heavy Metal Deficit and Decreased Accumulation of Metals in Plant Tissues_ Mechanisms and Future Prospects. Ecotoxicol. Environ. Saf. 2018, 147, 175–191. [Google Scholar] [CrossRef]
  9. Li, W.J.; Wang, J.L.; Jiang, L.M.; Lv, G.H.; Hu, D.; Wu, D.Y.; Yang, X.D. Rhizosphere effect and water constraint jointly determined the roles of microorganism in soil phosphorus cycling in arid desert regions. CATENA 2023, 222, 106809. [Google Scholar] [CrossRef]
  10. Huang, Z.; Zhang, X.; Zheng, G.; Gutterman, Y. Influence of Light, Temperature, Salinity and Storage on Seed Germination of Haloxylon ammodendron. J. Arid Environ. 2003, 55, 453–464. [Google Scholar] [CrossRef]
  11. Sheng, Y.A.N.; Zheng, W.H.; Pei, K.Q.; Ma, K.P. Genetic Variation within and Among Populations of a Dominant Desert Tree H. ammodendron (Amaranthaceae) in China. Ann. Bot. 2005, 96, 245–252. [Google Scholar] [CrossRef] [PubMed]
  12. Kour, D.; Yadav, A.N. Bacterial Mitigation of Drought Deficit in Plants: Current Perspectives and Future Challenges. Curr. Microbiol. 2022, 79, 248. [Google Scholar] [CrossRef] [PubMed]
  13. Hassan, F.A.S.; Ali, E.F.; Mahfouz, S.A. Comparison between different fertilization sources, irrigation frequency and their combinations on the growth and yield of coriander plant. Aust. J. Basic Appl. Sci. 2012, 6, 600–615. [Google Scholar]
  14. Boyle, S.A.; Yarwood, R.R.; Bottomley, P.J.; Myrold, D.D. Bacterial and Fungal Contributions to Soil Nitrogen Cycling under Douglas FIr and Red Alder at Two Sites in Oregon. Soil Biol. 2008, 40, 443–450. [Google Scholar] [CrossRef]
  15. He, K.N.; Wang, H.; Wang, W.L.; Zhang, T. Salinity Effects on Germination and Plant Growth of H. ammodendron at Qaidam Basin. J. Phys. Conf. Ser. 2020, 1578, 012234. [Google Scholar] [CrossRef]
  16. Vos, M.; Wolf, A.B.; Jennings, S.J.; Kowalchuk, G.A. Micro-Scale Determinants of Bacterial Diversity in Soil. FEMS Microbiol. Rev. 2013, 37, 936–954. [Google Scholar] [CrossRef]
  17. Treseder, K.K. Nitrogen Additions and Microbial Biomass: A Meta-analysis of Ecosystem Studies. Ecol. Lett. 2008, 11, 1111–1120. [Google Scholar] [CrossRef]
  18. Gutknecht, J.M.; Field, C.B.; Balser, T.C. Microbial Communities and Their Responses to Simulated Global Change Fluctuate Greatly Over Multiple Years. Glob. Chang. Biol. 2012, 18, 2256–2269. [Google Scholar] [CrossRef]
  19. Edwards, J.; Johnson, C.; Santos-Medellín, C.; Lurie, E.; Podishetty, N.K.; Bhatnagar, S.; Eisen, J.A.; Sundaresan, V. Structure, Variation, and Assembly of the Root-Associated Microbiomes of Rice. Proc. Natl. Acad. Sci. USA 2015, 112, E911–E920. [Google Scholar] [CrossRef]
  20. Turner, B.L.; Driessen, J.P.; Haygarth, P.M.; Mckelvie, I.D. Potential Contribution of Lysed Bacterial Cells to Phosphorus Solubilisation in Two Rewetted Australian Pasture Soils. Soil Biol. Biochem. 2003, 35, 187–189. [Google Scholar] [CrossRef]
  21. Etzold, S.; Ferretti, M.; Reinds, G.J.; Solberg, S.; Gessler, A.; Waldner, P.; Schaub, M.; Simpson, D.; Benham, S.; Hansen, K.; et al. Nitrogen Deposition Is the Most Important Environmental Driver of Growth of Pure, Even-Aged and Managed European Forests. For. Ecol. Manag. 2020, 458, 117762. [Google Scholar] [CrossRef]
  22. Valliere, J.M.; Allen, E.B. Interactive Effects of Nitrogen Deposition and Drought-Deficit on Plant-Soil Feedbacks of Artemisia Californica Seedlings. Plant Soil. 2016, 403, 277–290. [Google Scholar] [CrossRef]
  23. Li, Y.; Hu, W.; Zou, J.; He, J.; Wang, Y.; Chen, B.; Meng, Y.; Wang, S.; Zhou, Z. Effects of Soil Drought on Cottonseed Kernel Carbohydrate Metabolism and Kernel Biomass Accumulation. Plant Physiol. Biochem. 2023, 195, 170–181. [Google Scholar] [CrossRef]
  24. Li, W.; Jin, C.; Guan, D.; Wang, Q.; Wang, A.; Yuan, F.; Wu, J. The Effects of Simulated Nitrogen Deposition on Plant Root Traits: A Meta-Analysis. Soil Biol. Biochem. 2015, 82, 112–118. [Google Scholar] [CrossRef]
  25. Zhang, X.; Lei, L.; Lai, J.; Zhao, H.; Song, W. Effects of Drought Deficit and Water Recovery on Physiological Responses and Gene Expression in Maize Seedlings. BMC Plant Biol. 2018, 18, 68. [Google Scholar] [CrossRef]
  26. Ravelo-Ortega, G.; Raya-González, J.; López-Bucio, J. Compounds from Rhizosphere Microbes That Promote Plant Growth. Curr. Opin. Plant Biol. 2023, 73, 102336. [Google Scholar] [CrossRef]
  27. Li, W.; Lei, X.; Zhang, R.; Cao, Q.; Yang, H.; Zhang, N.; Liu, S.; Wang, Y. Shifts in Rhizosphere Microbial Communities in Oplopanax Elatus Nakai Are Related to Soil Chemical Properties under Different Growth Conditions. Sci. Rep. 2022, 12, 11485. [Google Scholar] [CrossRef]
  28. Bach, E.M.; Williams, R.J.; Hargreaves, S.K.; Yang, F.; Hofmockel, K.S. Greatest Soil Microbial Diversity Found in Micro-Habitats. Soil Biol. Biochem. 2018, 118, 217–226. [Google Scholar] [CrossRef]
  29. Fuchslueger, L.; Bahn, M.; Fritz, K.; Hasibeder, R.; Richter, A. Experimental Drought Reduces the Transfer of Recently Fixed Plant Carbon to Soil Microbes and Alters the Bacterial Community Composition in a Mountain Meadow. New Phytol. 2014, 201, 916–927. [Google Scholar] [CrossRef]
  30. Kaurin, A.; Mihelič, R.; Kastelec, D.; Grčman, H.; Bru, D.; Philippot, L.; Suhadolc, M. Resilience of Bacteria, Archaea, Fungi and N-Cycling Microbial Guilds under Plough and Conservation Tillage, to Agricultural Drought. Soil Biol. Biochem. 2018, 120, 233–245. [Google Scholar] [CrossRef]
  31. Van, D.L.T.A.; Lilleskov, E.A.; Pregitzer, K.S.; Miller, R.M. Simulated Nitrogen Deposition Causes a Decline of Intra- and Extraradical Abundance of Arbuscular Mycorrhizal Fungi and Changes in Microbial Community Structure in Northern Hardwood Forests. Ecosystems 2010, 13, 683–695. [Google Scholar] [CrossRef]
  32. Singh, P.; Singh, R.K.; Zhou, Y.; Wang, J.; Jiang, Y.; Shen, N.; Wang, Y.; Yang, L.; Jiang, M. Unlocking the Strength of Plant Growth Promoting Pseudomonas in Improving Crop Productivity in Normal and Challenging Environments: A Review. J. Plant Interact. 2022, 17, 220–238. [Google Scholar] [CrossRef]
  33. Fitzpatrick, C.R.; Copeland, J.; Wang, P.W.; Guttman, D.S.; Kotanen, P.M.; Johnson, M.T.J. Assembly and Ecological Function of the Root Microbiome across Angiosperm Plant Species. Proc. Natl. Acad. Sci. USA 2018, 115, E1157–E1165. [Google Scholar] [CrossRef] [PubMed]
  34. Hillebrand, H. Meta-analysis on Pulse Disturbances Reveals Differences in Functional and Compositional Recovery across Ecosystems. Ecol. Lett. 2020, 23, 575–585. [Google Scholar] [CrossRef]
  35. Zhou, Z.; Wang, C.; Zheng, M.; Jiang, L.; Luo, Y. Patterns and Mechanisms of Responses by Soil Microbial Communities to Nitrogen Addition. Soil Biol. Biochem. 2017, 115, 433–441. [Google Scholar] [CrossRef]
  36. Zhang, T.; Chen, H.Y.H.; Ruan, H. Global Negative Effects of Nitrogen Deposition on Soil Microbes. ISME J. 2018, 12, 1817–1825. [Google Scholar] [CrossRef]
  37. Arnett, A.E.; Louda, S.M. Re-Test of Rhinocyllus Conicus Host Specificity, and the Prediction of Ecological Risk in Biological Control. Biol. Conserv. 2002, 106, 251–257. [Google Scholar] [CrossRef]
  38. Moreira, X.; Abdala-Roberts, L. Specificity and Context-Dependency of Plant–Plant Communication in Response to Insect Herbivory. Curr. Opin. Insect Sci. 2019, 32, 15–21. [Google Scholar] [CrossRef]
  39. Dowie, N.J.; Grubisha, L.C.; Trowbridge, S.M.; Klooster, M.R.; Miller, S.L. Variability of Ecological and Autotrophic Host Specificity in a Mycoheterotrophic System: Pterospora andromedea and Associated Fungal and Conifer Hosts. Fungal Ecol. 2016, 20, 97–107. [Google Scholar] [CrossRef]
  40. Zhou, Z.; Zheng, M.; Xia, J.; Wang, C. Nitrogen Addition Promotes Soil Microbial Beta Diversity, and the Stochastic Assembly. Sci. Total Environ. 2022, 806, 150569. [Google Scholar] [CrossRef]
  41. Cheng, J. Bacteroides Utilization for Dietary Polysaccharides and Their Beneficial Effects on Gut Health. Food Sci. Hum. Wellness 2022, 11, 1101–1110. [Google Scholar] [CrossRef]
  42. Hu, Y.; Chen, M.; Yang, Z.; Cong, M.; Zhu, X.; Jia, H. Soil Microbial Community Response to Nitrogen Application on a Swamp Meadow in the Arid Region of Central Asia. Front. Microbiol. 2022, 12, 797306. [Google Scholar] [CrossRef] [PubMed]
  43. Genderjahn, S.; Mashal, A.; Kai, M.; Fabian, H.; Dirk, W. Desiccation- and Saline-Tolerant Bacteria and Archaea in Kalahari Pan Sediments. Front. Microbiol. 2018, 9, 2082. [Google Scholar] [CrossRef] [PubMed]
  44. Xie, J.B.; Peng, L.Z.; Li, Y.M.; Li, Y. Competitive interactions between two desert shrub seedings towards variation in soil nitrogen and phosphorus content. Arid. Land Geog. Raphy. 2018, 41, 83–91. [Google Scholar] [CrossRef]
Figure 1. Plant physiological and ecological indicators. The bar above the column is Standard Error. (A) Plant height; (B) root length. Note: Different letters indicate significant differences between different treatment groups (p < 0.05). M: sterilization treatment; S: non-sterile treatment; CK: control group; N: nitrogen addition group; D: water deficit group; ND: water deficit, nitrogen addition group.
Forests 14 01879 g001
Figure 2. Root–shoot ratio of H. ammodendron seedlings. The bar above the column is Standard Error. (A) Root–shoot ratio of sterilization group; (B) Root–shoot ratio of non-sterile group; (C) Root–shoot ratio of sterilized non-sterilized control group; (D) Root–shoot ratio of sterilized non-sterilized nitrogen addition group; (E) Root–shoot ratio of sterilized non-sterilized water deficit group; (F) Root–shoot ratio of sterilized non-sterilized water deficit nitrogen addition group. Note: Different letters indicate significant differences between different treatment groups (p < 0.05). M: sterilization treatment; S: non-sterile treatment; CK: control group; N: nitrogen addition group; D: water deficit group; ND: water deficit, nitrogen addition group.
Forests 14 01879 g002
Figure 3. Displays the aboveground and belowground biomass of H. ammodendron seedlings. The bar above the column is Standard Error. (A) Above-ground biomass; (B) Below-ground biomass. Note: Different letters indicate significant differences between different treatment groups (p < 0.05). M: sterilization treatment; S: non-sterile treatment; CK: control group; N: nitrogen addition group; D: water deficit group; ND: water deficit, nitrogen addition group.
Forests 14 01879 g003
Figure 4. RDA analysis of aboveground and underground morphological characteristics of plants and environmental factors under sterilization conditions. Note: M: sterilization treatment; CK: control group; N: nitrogen addition group; D: water deficit group; ND: water deficit, nitrogen addition group; AB*: Above-ground biomass; BB*: Below-ground biomass; RL*: Root Length; HT*: Height.
Forests 14 01879 g004
Figure 5. RDA Analysis of Aboveground and Belowground Morphological Characteristics of Plants and Environmental Factors under Non-Sterile Conditions. Note: S: non-sterile treatment; CK: control group; N: nitrogen addition group; D: water deficit group; ND: water deficit, nitrogen addition group. AB*: Above-ground biomass; BB*: aboveground Below-ground biomass; RL*: Root Length; HT*: Height.
Forests 14 01879 g005
Figure 6. Bar plot of bacterial OTU numbers for different treatment groups. The bar above the column is Standard Error. (a) Sterilization control group vs. non-sterilization control group; (b) sterilization control group vs. sterilization nitrogen addition group; (c) sterilization control group vs. sterilization water deficit group; (d) sterilization control group vs. sterilization water deficit nitrogen addition group; (e) non-sterile control group vs. non-sterile nitrogen addition group; (f) non-sterile control group vs. non-sterile water deficit group; (g) non-sterile control group vs. non-sterile water deficit nitrogen addition group; (h) sterilized nitrogen addition group vs. sterilized water deficit nitrogen addition group; (i) sterilized nitrogen addition group vs. sterilized water deficit nitrogen addition group; (j) sterilization water deficit group vs. sterilization water deficit nitrogen addition group; (k) non-sterile nitrogen addition group vs. non-sterile water deficit group; (l) non-sterile nitrogen addition group vs. non-sterile water deficit nitrogen addition group; (m) non-sterile water deficit group vs. non-sterile water deficit nitrogen addition group; (n) sterilized nitrogen addition group vs. non-sterilized nitrogen addition group; (o) sterilized water deficit group vs. non-sterilized water deficit group; (p) sterilized water deficit nitrogen addition group vs. non-sterilized water deficit nitrogen addition group. Note: M: sterilization treatment; S: non-sterile treatment; CK: control group; n: nitrogen addition group; d: water deficit group; ND: water deficit, nitrogen addition group; different lowercase letters indicate significant differences between groups (p < 0.05).
Forests 14 01879 g006
Figure 7. PCA analysis of different treatment groups vs. control groups. (A) Sterilization control group vs. sterilization water deficit group; (B) Sterilization control group vs. sterilization nitrogen addition group; (C) Sterilization control group vs. non-sterilization control group; (D) Sterilized water deficit group vs. non-sterilized water deficit group; (E) Sterilized water deficit nitrogen addition group vs. non-sterilized water deficit nitrogen addition group; (F) sterilized water deficit group vs. sterilized nitrogen addition group; (G) Sterilized water deficit nitrogen addition group vs. sterilized nitrogen addition group; (H) Sterilized water deficit group vs. non-sterilized water deficit group. Note: M: sterilization treatment; S: non-sterile treatment; CK: control group; N: nitrogen addition group; D: water deficit group; ND: water deficit, nitrogen addition group.
Forests 14 01879 g007
Figure 8. Classification of root-associated microbial communities in different treatment groups at the phylum level. (A) The sterilization treatment group ranks among the top 10 microbial taxa at the phylum level; (B) The non-sterile treatment group ranks among the top 10 microbial taxa at the phylum level. Note: MCK, MN, MD, MND, SCK, SN, SD, SND represent different treatment groups.
Forests 14 01879 g008
Figure 9. LEfSe analysis of rhizosphere bacterial communities under different treatments. Note: MCK, MN, MD, MND, SCK, SN, SD, SND represent different treatment groups.
Forests 14 01879 g009
Table 1. The diversity of bacteria in different soil samples.
Sample IDACE
Mean ± Se
Chao1
Mean ± Se
Simpson
Mean ± Se
Shannon
Mean ± Se
MCK1360.69 ± 97 a1361.36 ± 97 a0.992 ± 0.002 a8.893 ± 0.193 abc
MN1276.92 ± 152 a1280.19 ± 153 a0.989 ± 0.005 a8.649 ± 0.211 abc
MD1334.75 ± 317 a1338.82 ± 321 a0.975 ± 0.008 a8.264 ± 0.662 c
MND1571.13 ± 278 a1565.63 ± 276 a0.974 ± 0.02 a8.412 ± 0.708 bc
SCK1118.13 ± 111 a1119.48 ± 112 a0.971 ± 0.015 a8.234 ± 0.468 c
SN1636.32 ± 105 a1635.75 ± 106 a0.998 ± 0.001 a9.737 ± 0.07 a
SD1585.50 ± 91 a1593.35 ± 94 a0.996 ± 0.002 a9.542 ± 0.266 ab
SND1572.96 ± 94 a1576.39 ± 96 a0.998 ± 0.001 a9.688 ± 0.093 a
Note: M: sterilization treatment; S: non-sterile treatment; CK: control group; N: nitrogen addition group; D: water deficit group; ND: water deficit, nitrogen addition group; different lowercase letters indicated significant differences between groups (p < 0.05).
Disclaimer/Publisher’s Note: The statements, opinions and data contained in all publications are solely those of the individual author(s) and contributor(s) and not of MDPI and/or the editor(s). MDPI and/or the editor(s) disclaim responsibility for any injury to people or property resulting from any ideas, methods, instructions or products referred to in the content.

