Article

Maximum Gross Primary Productivity Dominates the Trend in Gross Primary Productivity in China’s Deciduous Forest Ecosystems

1
Key Laboratory of Ecosystem Network Observation and Modeling, Institute of Geographic Sciences and Natural Resources Research, Chinese Academy of Sciences, Beijing 100101, China
2
National Ecosystem Science Data Center, Institute of Geographic Sciences and Natural Resources Research, Chinese Academy of Sciences, Beijing 100101, China
3
University of Chinese Academy of Sciences, Beijing 100049, China
4
State Key Laboratory of Urban and Regional Ecology, Research Center for Eco-Environmental Sciences, Chinese Academy of Sciences, Beijing 100085, China
5
College of Resources and Environmental Economics, Inner Mongolia University of Finance and Economics, Hohhot 010070, China
6
Resource Utilization and Environmental Protection Coordinated Development Academician Expert Workstation in the North of China, Inner Mongolia University of Finance and Economics, Hohhot 010070, China
*
Author to whom correspondence should be addressed.
Forests 2023, 14(9), 1880; https://doi.org/10.3390/f14091880
Submission received: 31 July 2023 / Revised: 11 September 2023 / Accepted: 13 September 2023 / Published: 15 September 2023
(This article belongs to the Section Forest Inventory, Modeling and Remote Sensing)

Abstract

:
The terrestrial gross primary productivity (GPP) has increased over the past two decades. However, the climatic attribution and the physiological and phenological processes that control the trends in the GPP are still unclear. Here, we used remote-sensing-based vegetation GPP and phenology datasets, analyzed the spatial and temporal variation in the GPP, investigated the influence of the growing season length (GSL) and the maximum value of gross primary productivity (GPPmax) on the annual GPP, and quantified the effect of climate variables on the annual GPP. Our results identified a significant increase in the annual GPP (11.97 gC/m2/yr) during 2001–2020 in China’s deciduous forest. The GPPmax trend dominated the trends in the GPP, when compared with the GSL. Moreover, climate warming in summer contributes to the increase in the GPP and the GPPmax, while the extension of the GSL is primarily due to the temperature rise in spring. The annual GPP of the planted forest showed a higher increasing rate than the natural forest, due to the significant enhancement of the GPPmax and the high sensitivity of the GSL to climatic factors in the planted forest. Our findings provide a new perspective on the phenological and physiological causes of the trends in the GPP, and emphasize the importance of capturing the variability in the GPPmax when modeling the GPP.

1. Introduction

Terrestrial ecosystems have acted as a substantial sink for atmospheric carbon dioxide, and sequestered about 15%–30% of fossil fuel emissions every year [1]. The gross ecosystem productivity (GPP) is the net amount of carbon dioxide fixed by land plants’ photosynthesis [2]. Previous studies showed a significant increase in the magnitude of GPP over the past decades [3,4]. The CO2 fertilization effect [5,6], nitrogen deposition [7], climate warming [8], and land-use change (e.g., afforestation, grassland restoration) [9,10] have been proven to have positive effects on the GPP increase. Specifically, Piao et al. (2015) pointed out that the rising atmospheric CO2 concentration explains 85% of the average growing season vegetation growth trend in China from 1982 to 2009 [11]. Tian et al. (2011) showed that nitrogen deposition and fertilizer applications account for 61% of the net carbon storage in recent decades in China’s land ecosystems [12]. Moreover, Tong et al. (2018) found that the annual aboveground biomass carbon showed significantly positive trends post-2000 in Southwest China, due to the implementation of ecological engineering [13]. Chen et al. (2021) indicated that the appropriate climatic conditions, and the implementation of ecological engineering, caused an accelerated increase in vegetation carbon sequestration in China after 2010 [14]. It should be noted that climate change can affect the implementation benefits of ecological restoration projects [15]. Therefore, it is crucial to study the effect of climate factors on the GPP, which can better reveal the GPP’s spatial–temporal changes.
Forests, covering approximately one-third of the global land area, are the dominant terrestrial ecosystem type on the global scale, and play an essential role in the carbon and water cycles [16]. Deciduous forest ecosystems usually experience a pronounced seasonality compared to evergreen forest ecosystems. A recent study showed that the temporal variability of the global land carbon sink is mainly determined by non-evergreen ecosystems [17]. Global changes are composed of a series of regional changes, with different processes and phenomena [18]. Hence, understanding the long-term trends in the GPP in deciduous forest ecosystems at a regional scale was of great importance, to evaluate the contribution of vegetation to climate change mitigation. The mean GPP was 1453 gC/m2/yr in CBS during 2003–2005 in China’s deciduous forest ecosystems [19]. Harvard Forest’s mean GPP (1690 gC/m2/yr) was similar to the GPP value in China’s deciduous forest ecosystems [20]. Additionally, the annual GPP increased at a trend of 3.56 gC/m2/yr from 1997 to 2014 in 12 deciduous forest sites in Europe, Asia, and North America [21]. In addition, based on whether they are highly managed by humans, the forests could be further divided into natural and planted forests [22]. Planted forests differ from natural forests in many aspects, such as species richness, plant density, and stand age [23]. Planted forests respond quickly to climate change [24,25]. Thus, trends in the GPP in natural and planted forests might be different. A previous study pointed out that the mean GPP value in natural forests is slightly lower than that in planted forests, due to their high sensitivity to rising temperatures [26]. However, a comprehensive analysis of the natural and planted forests’ GPP trend is still lacking, especially in deciduous forest ecosystems.
Changes in the annual GPP can be associated with the growing season length (GSL) and the maximum value of gross primary productivity (GPPmax) (Figure 1) [27,28]. The GSL can be used as an indicator of vegetation phenology, and the GPPmax represents the characteristics of photosynthesis, which can be used as an indicator of physiology. The temporal variations in the GSL and GPPmax due to climate change could affect trends in the GPP [27,28]. In general, the climate-warming-induced GSL extension could stimulate a GPP increase [29,30], and observations based on the eddy covariance method have shown that the annual GPP is strongly correlated with the GSL [31]. However, the extension of the GSL might also lead to a decrease in the annual GPP, because an earlier leaf unfolding date would lead to a decrease in the available soil water for leaves in summer, and limit plant growth later in the growing season [32,33]. Meanwhile, ecosystems with a higher GPPmax tend to have a larger annual GPP with the same GSL [34]. A slight fluctuance in the GPPmax would lead to substantial changes in the annual GPP [35]. The deciduous forest ecosystem in China is considered a significant carbon sink in the Northern Hemisphere [36]. However, the knowledge regarding the climate control over the GSL and the GPPmax across the natural and planted forests among China’s deciduous forest ecosystems is still limited.
In this study, we aim to analyze the temporal variation in the GPP, demonstrate the influence of the GSL and the GPPmax on the annual GPP, and quantify the effect of climate variables on the annual GPP during 2001–2020 in China’s deciduous forest ecosystems. The specific questions addressed in this study include: (1) whether there were significant differences in the time series of the annual GPP in natural and planted deciduous forests during 2001–2020; (2) how the GSL and GPPmax are related to the annual GPP across natural and planted forests; and (3) which climatic factors determine the annual GPP by influencing the GSL and GPPmax.

2. Materials and Methods
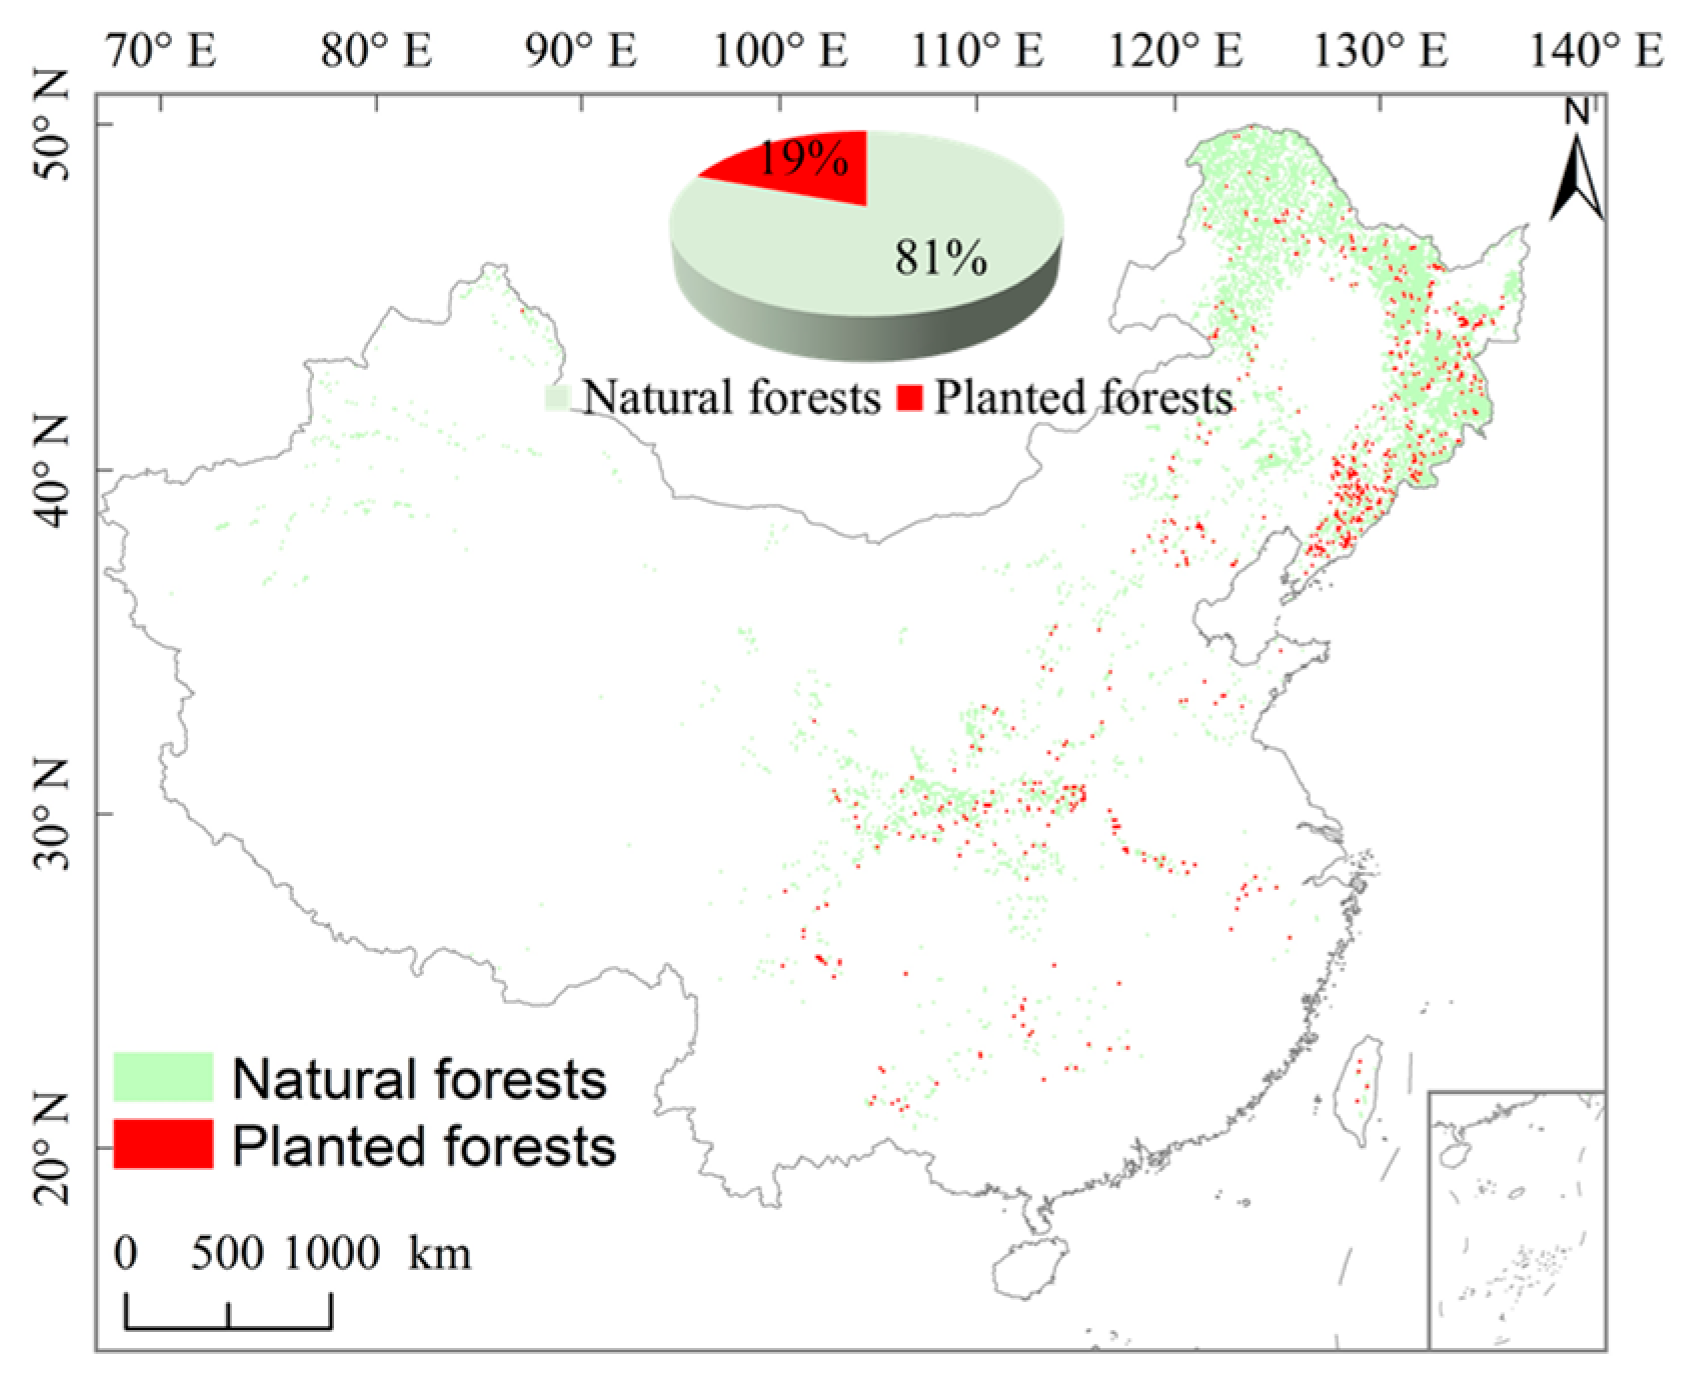
2.1. Study Region

Our study region covers all deciduous forest ecosystems in China, including natural forests and planted forests, which account for 81% and 19% of the deciduous forest ecosystems in China, respectively (Figure 2). We extracted the deciduous forest map from the China land cover dataset [37], based on Landsat TM/ETM and HJ-1 satellite data of 30 m resolution in 2010, and a large amount of field investigation data. Du et al. (2022) provided a planted forest map with 30 m spatial resolution, using the time-series Landsat archive from 1982–2020 and the LandTrendr algorithm to generate global maps of planting years [22]. Excluding the planted forests, we assumed that the remaining part comprised natural forests. Then, we resampled the deciduous forest map to 0.05 degree. Descriptions of the climatic information for China’s deciduous forest ecosystems are given in Table 1.

2.2. GOSIF-GPP

The GOSIF-GPP data at 0.05° spatial resolution and 8-day time step for the period from 2001 to 2020 came from Li and Xiao (2019) [38] (http://data.globalecology.unh.edu/data/GOSIF-GPP_v2/, accessed on 1 April 2023). The GOSIF-GPP dataset has been developed using the linear relationships between OCO-2-based SIF (solar-induced chlorophyll fluorescence) product (GOSIF) and eddy-covariance observation data at the global scale. The methodology and validation are described in detail in Li and Xiao (2019) [38].

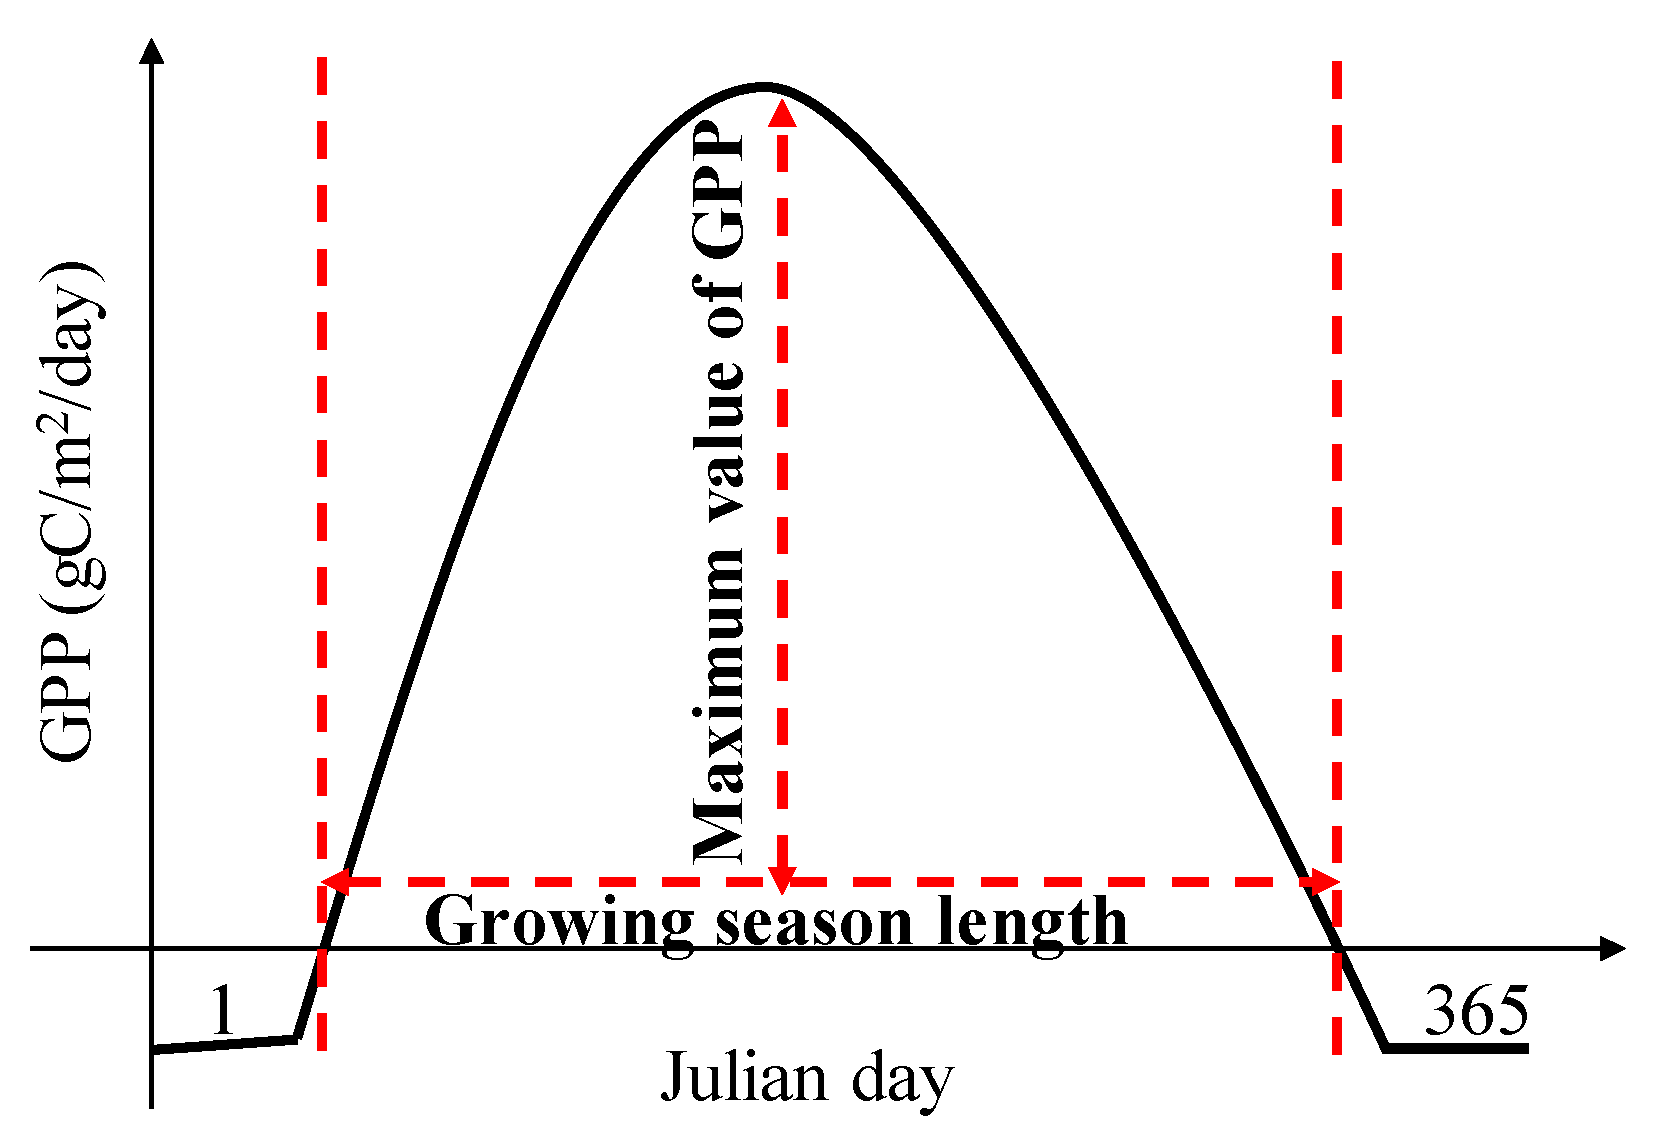
2.3. Gridded Phenology Dataset

To evaluate the phenology predictions in China’s deciduous forests, the leaf unfolding date and leaf falling date, estimated from the time series of GOSIF-GPP during 2001–2020 [38], were used (https://doi.org/10.6084/m9.figshare.17195009.v3, accessed on 1 April 2023). Fang et al. (2023) developed an annual 0.05 degree vegetation photosynthetic phenology (i.e., the leaf unfolding dates, leaf falling dates, and GSL) dataset for the Northern Hemisphere (latitudes > 30° N). We used a single-growing-season dataset because most regions in the Northern Biomes had a single growing season. The leaf unfolding dates, leaf falling dates, and GSL were defined as a 10% threshold with each file. The methodology and validation are described in Fang et al. (2023) [39].

2.4. Climate Data

We used the temperature, precipitation, and global radiation to analyze the impact factors of the annual GPP in China’s deciduous forest ecosystems from 2001 to 2020. The temperature and precipitation came from the Daily Global Historical Climatology Network dataset of the National Ecosystem Science Data Center (NESDC) (http://www.nesdc.org.cn/sdo/detail?id=6139dbe27e28173dfbf05947, accessed on 1 April 2023), with an 8-daily temporal resolution, and a spatial resolution of 1 km. The daily global radiation data, which were calculated via the Angstrom model, using the daily insolation hour data [40], were interpolated with digital elevation model (DEM) data to a fitted surface at a spatial resolution of 1 km, and an 8-daily temporal resolution, using ANUSPLIN 4.2. The meteorological stations of the National Meteorological Information Center (https://data.cma.cn/, accessed on 1 April 2023) provided daily insolation hour data. In addition, the annual mean temperature (TEM), annual sum precipitation (PRE), and annual sum global radiation (RAD) were calculated using 8-daily temperature, precipitation, and global radiation fitted maps. The mean seasonal temperature, seasonal sum precipitation, and seasonal global radiation were calculated for different seasons: spring was from March to May, summer was from June to August, autumn was from September to November, and winter was from December to February.

2.5. Statistics Analysis

2.5.1. Linear Trend Analysis

The linear regression method was used to analyze the temporal trends among the GPP, GSL, GPPmax, and different climatic factors. The slope for the LRM was obtained via least-squares fitting. Positive values represent an increasing trend; negative values represent a decreasing trend. The calculation of the LRM is shown in Equation (1) [41]:
θ s l o p e = n i = 1 n i x i i = 1 n i i = 1 n x i n i = 1 n i 2 ( i = 1 n i ) 2
where n is the number of research years, x is the ith year of the GPP, GSL, GPPmax, or different climatic factors, and θslope is the long-term trend in the GPP, GSL, GPPmax, or different climatic factors. A t-test was conducted to test the significance of the slope, where p < 0.05 represents statistical significance.

2.5.2. Correlation Analysis

Correlation analysis was applied to explore the relative relationships between the GPP, GSL, GPPmax, and different climatic factors (i.e., the precipitation, temperature, and global radiation). The formula was as follows [42]:
R x , y = i = 1 n x i x y i y ( x i x ) 2 ( y i y ) 2
where Rx,y represents the correlation coefficients between the variables x (i.e., the GPP, GSL, and GPPmax) and y (i.e., the precipitation, temperature, and global radiation). The t-test was applied to test the significance of the correlation coefficients, where p < 0.05 represents statistical significance.

3. Results

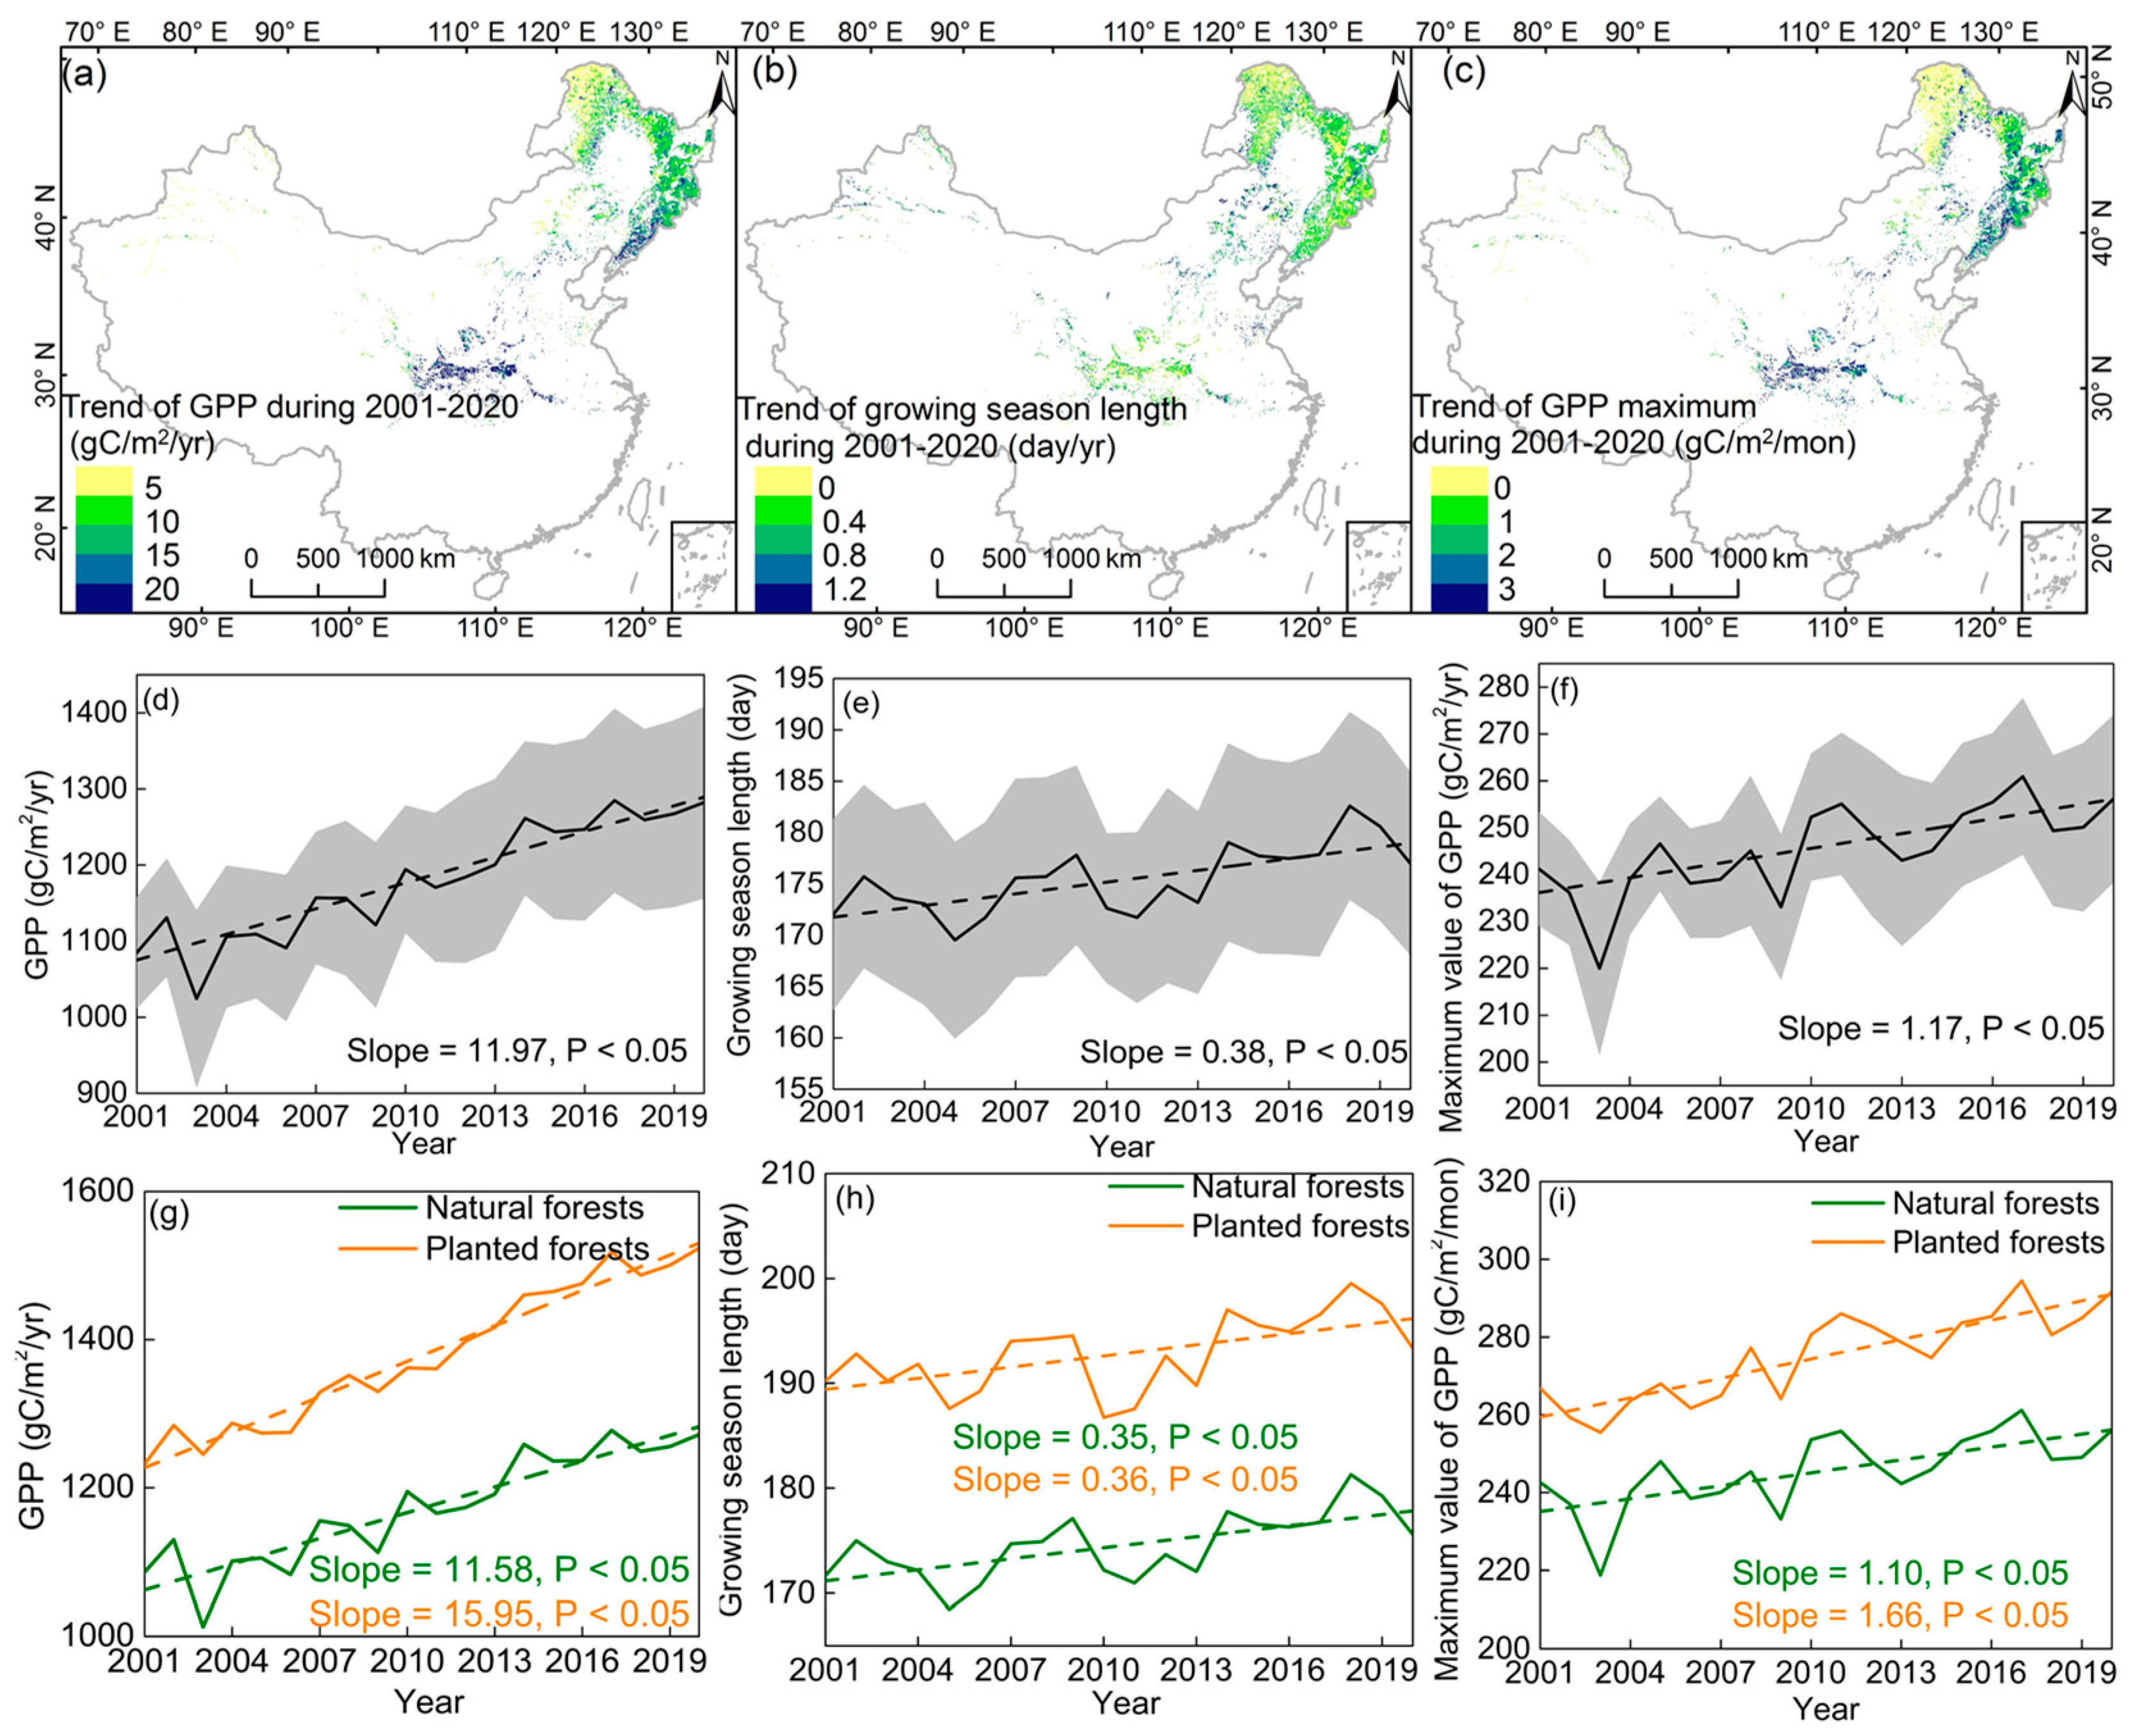
3.1. Temporal Variation in the GSL, GPPmax, and GPP

In general, the annual gross primary productivity in China’s deciduous forest ecosystems increased significantly by 11.97 gC/m2/yr (p < 0.05) during 2001–2020 (Figure 3a,d). Spatially, forests in warm regions show a higher increasing rate than the average for China’s deciduous forests. For example, the forests in the Qin Mountains and Changbai Mountains increased by more than 20 gC /m2/yr (Figure 3a). In addition, the growth rate of the annual GPP in planted forests from 2001 to 2020 was significantly higher than that in natural forests (15.95 vs. 11.58 gC/m2/yr; Figure 3g).
China’s deciduous forest ecosystems’ GSL increased at a rate of 0.38 day/yr (p < 0.05) during 2001–2020 (Figure 3b,e). When comparing the differences in GSL between forest types (i.e., natural and planted forests), we did not find an obvious difference in the GSL trend (0.35 vs. 0.36 day/yr; Figure 3h). Moreover, the GPPmax showed a significantly increased trend (1.17 gC/m2/mon; p < 0.05) during 2001–2020 in China’s deciduous forest ecosystems (Figure 3c,f). Regarding forest types, the difference in the changing rate of the GPPmax between natural and planted forests was large (1.10 vs. 1.66 gC/m2/mon; Figure 3i). Compared to the GSL trend, the difference in the GPPmax trend between natural and planted forests was more evident.

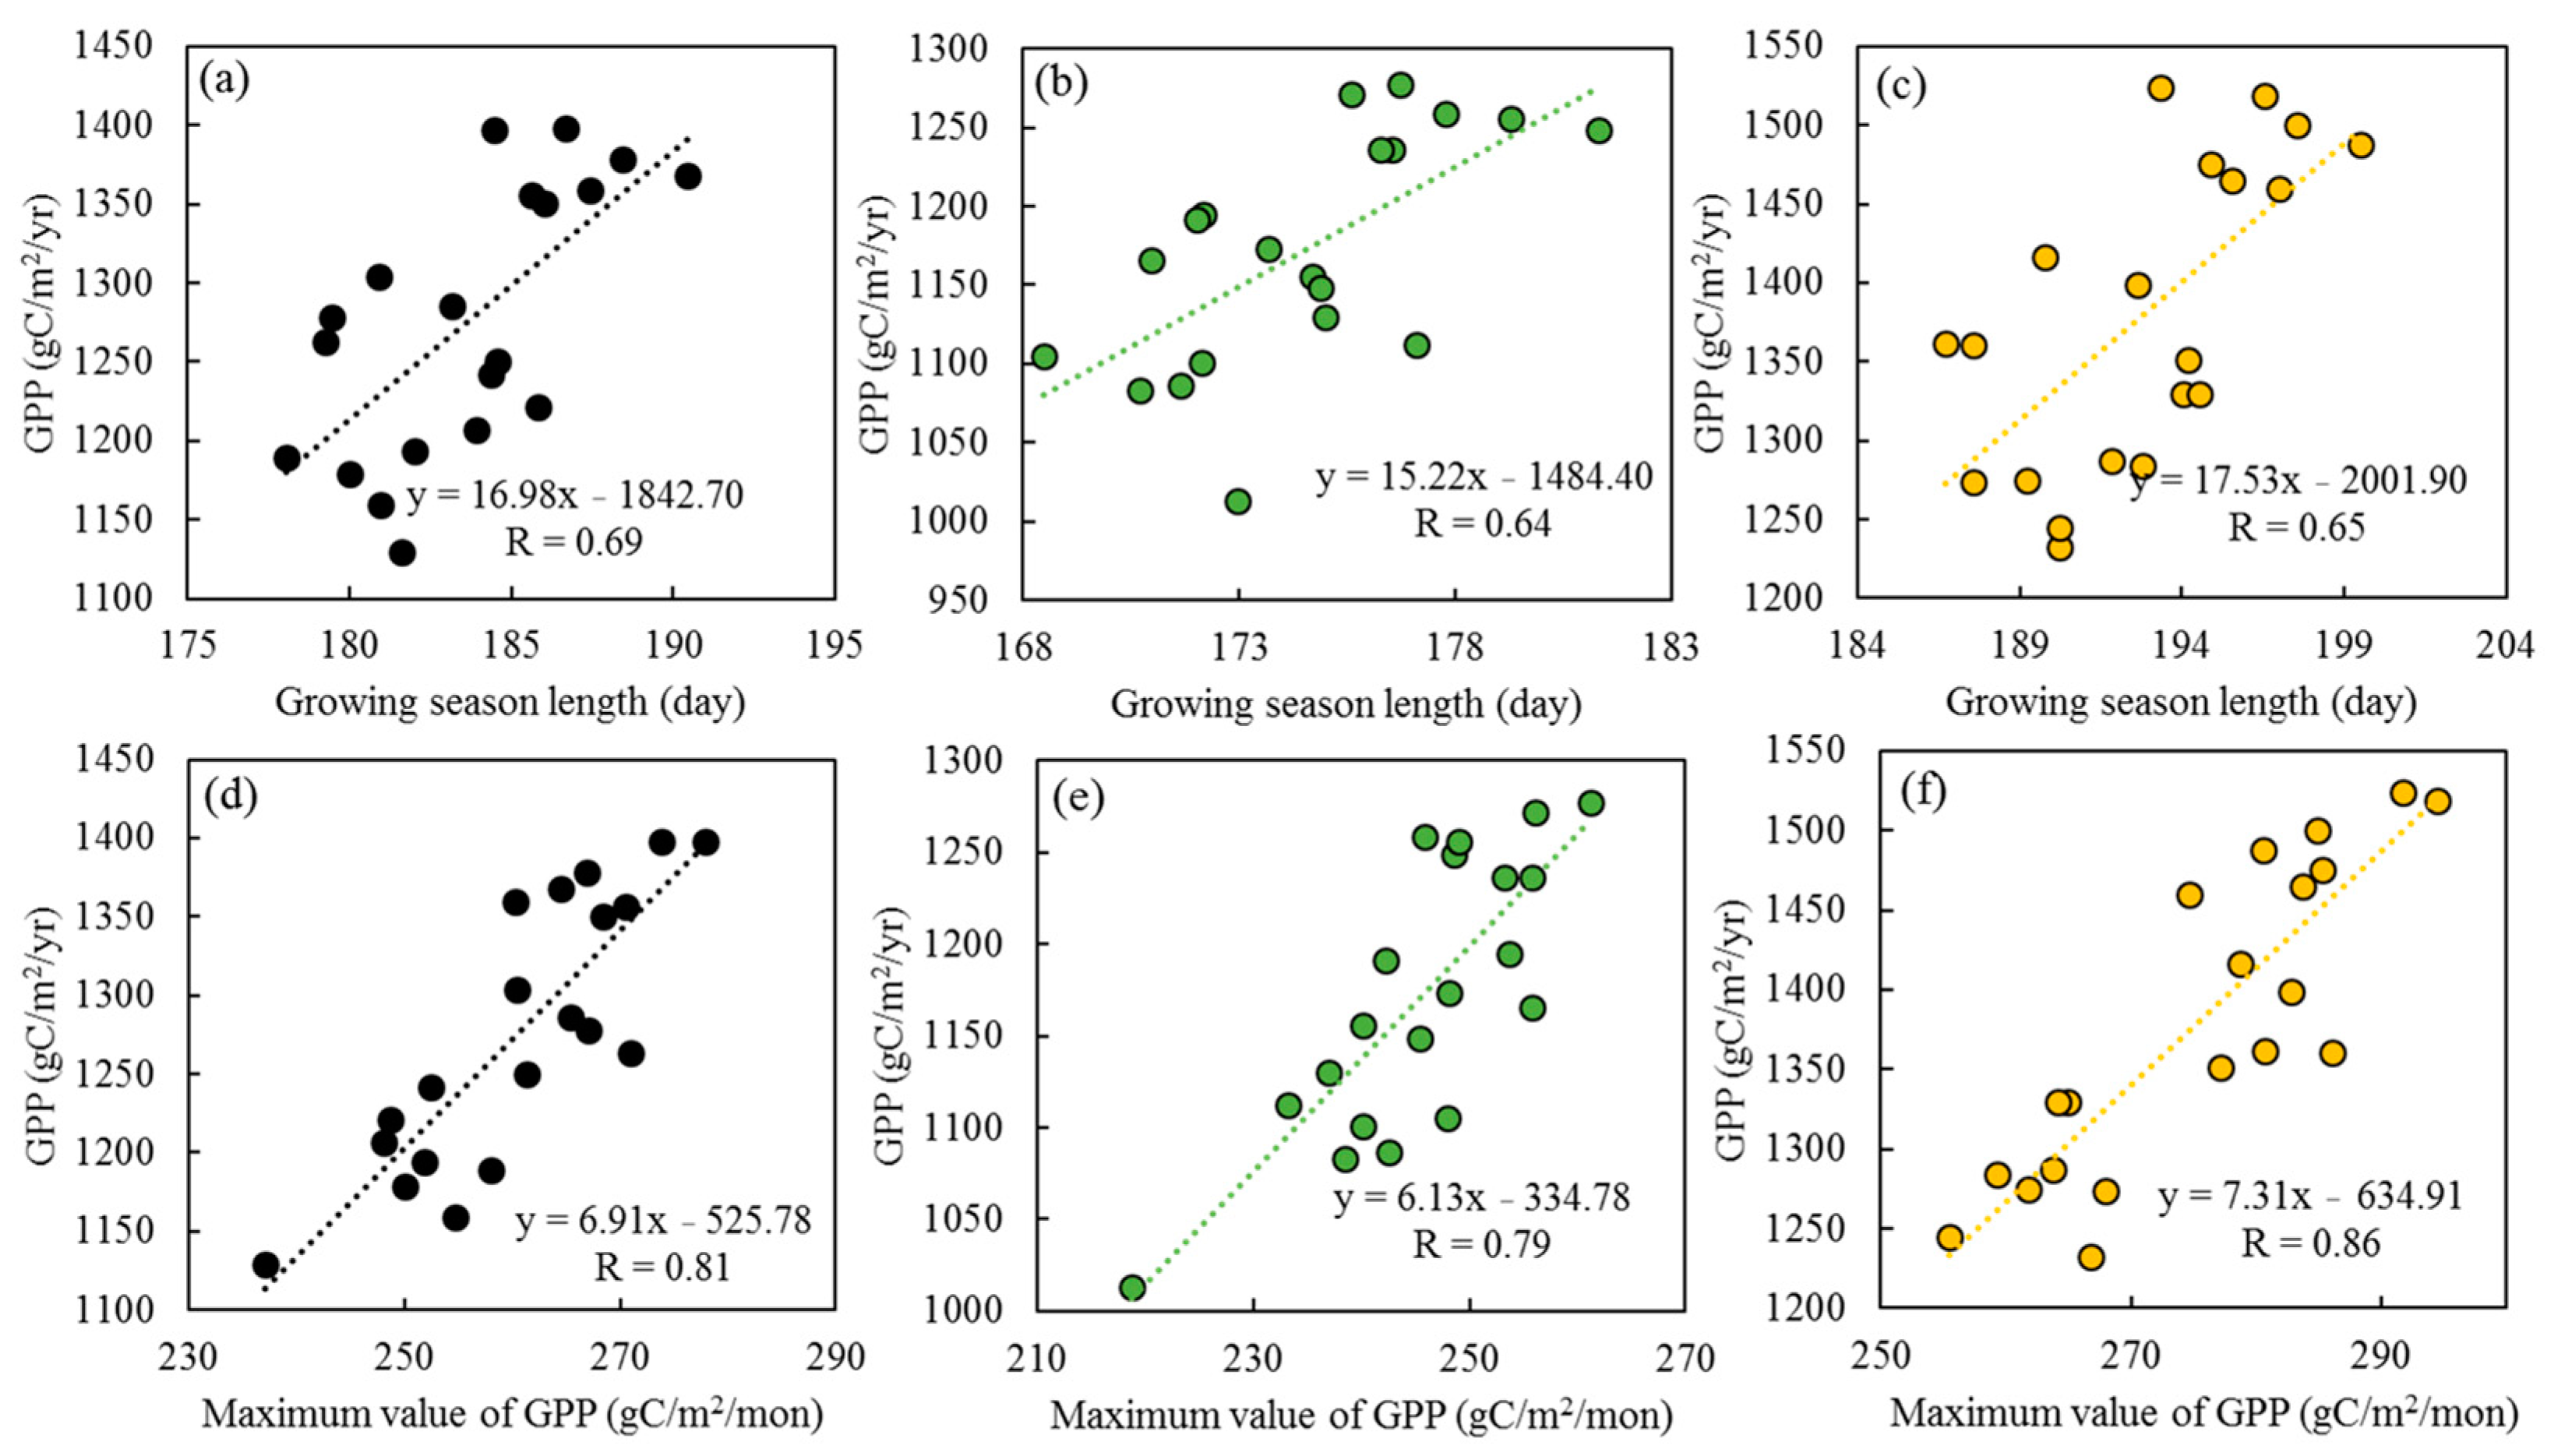
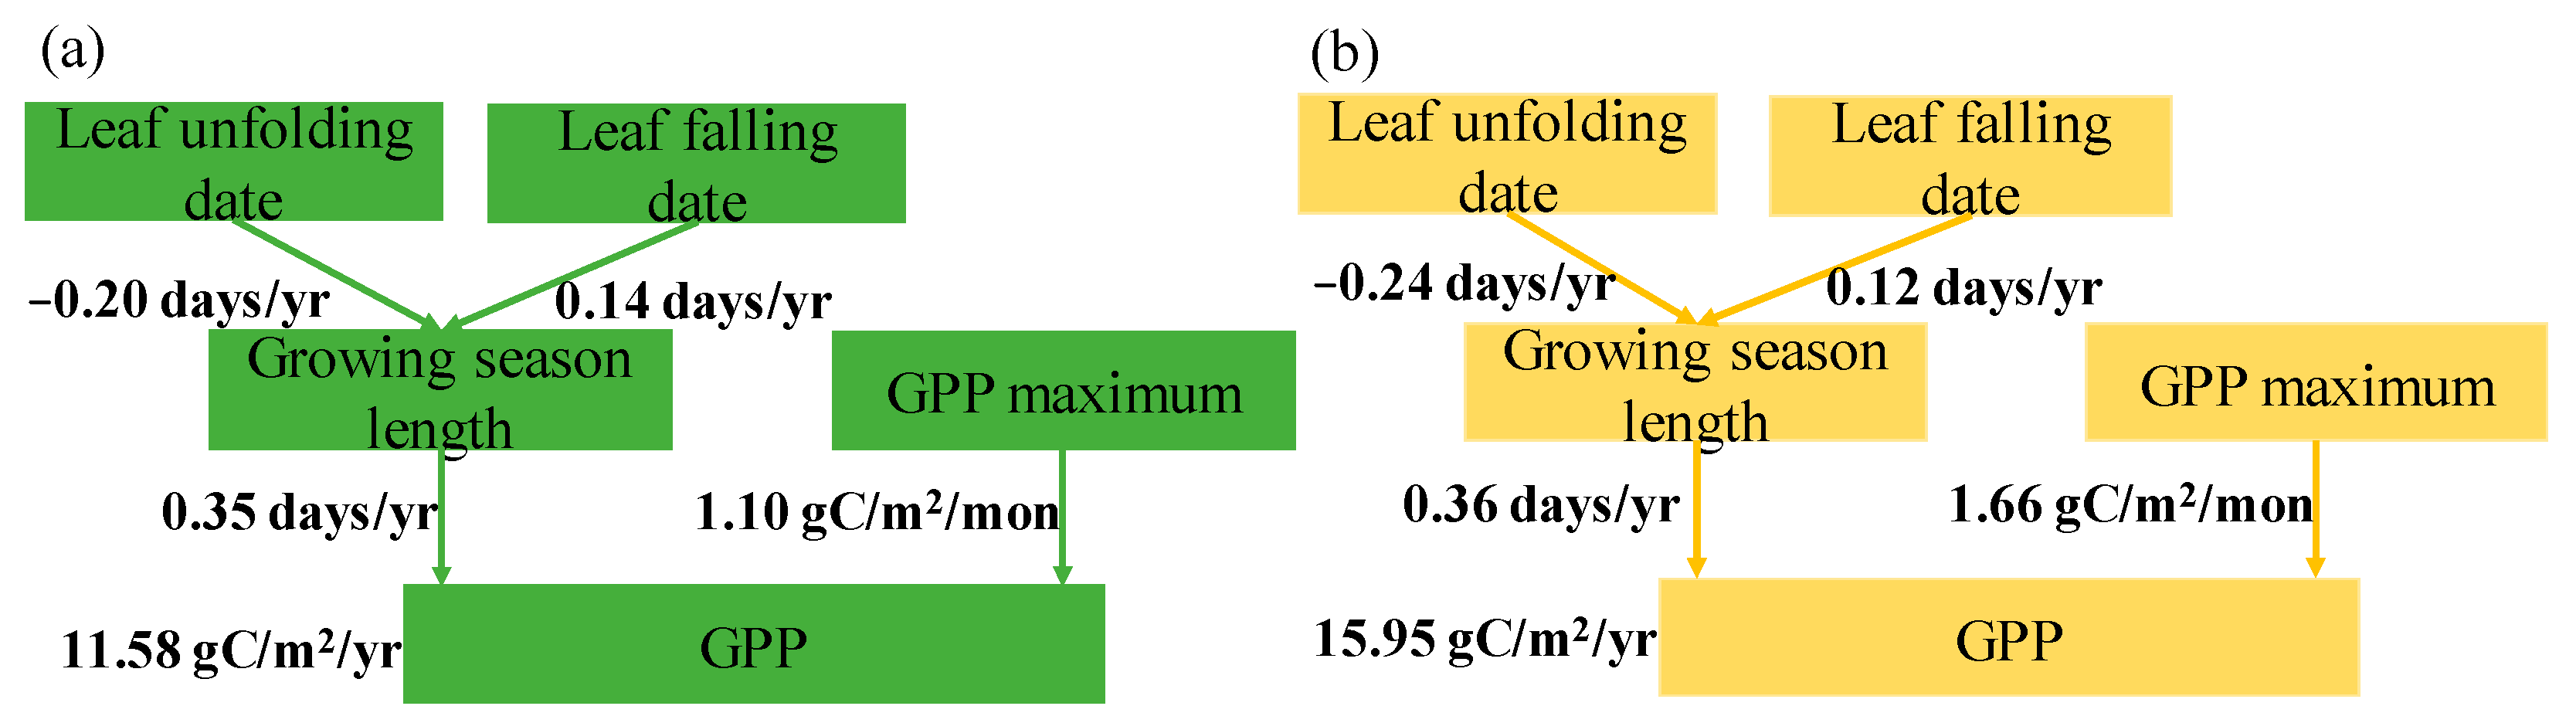
3.2. The Effects of GSL and GPPmax on GPP

The annual GPP is significantly correlated with the GSL (R = 0.69; p < 0.05) and the GPPmax (R = 0.81; p < 0.05) in China’s deciduous forest ecosystems (Figure 4a,d). The annual GPPmax is more strongly correlated with the GPP than the GSL, indicating that the GPPmax might play a more important role in GPP change. For different forest types, the correlation between the GPP and GPPmax in planted forests (R = 0.86; p < 0.05; Figure 4e) was higher than that in natural forests during 2001–2020 (R = 0.79; p < 0.05; Figure 4f). However, the correlation between the GPP and GSL was similar between natural forests (R = 0.64; p < 0.05; Figure 4b) and planted forests (R = 0.65; p < 0.05; Figure 4c).
The contributions of the GSL and GPPmax to the trend in GPP in natural and planted forests are shown in Figure 5. The change in the GSL was determined via the leaf unfolding and leaf falling date. In natural forests, the leaf unfolding date advanced considerably by −0.20 days/yr, and the leaf falling date was significantly delayed by 0.14 days/yr, extending the GSL during 2001–2020 (Figure 5a). Over the same time period, the leaf unfolding date of planted forests advanced significantly by −0.24 days/yr, and the leaf falling date was delayed significantly by 0.12 days/yr, resulting in an extension of the GSL in the period 2001–2020 (Figure 5b). The differences in the GPPmax were larger than in the GSL between natural and planted forests (Figure 5a,b). Thus, the trend in the GPP was associated with the long-term trend in the GPPmax during 2001–2020.

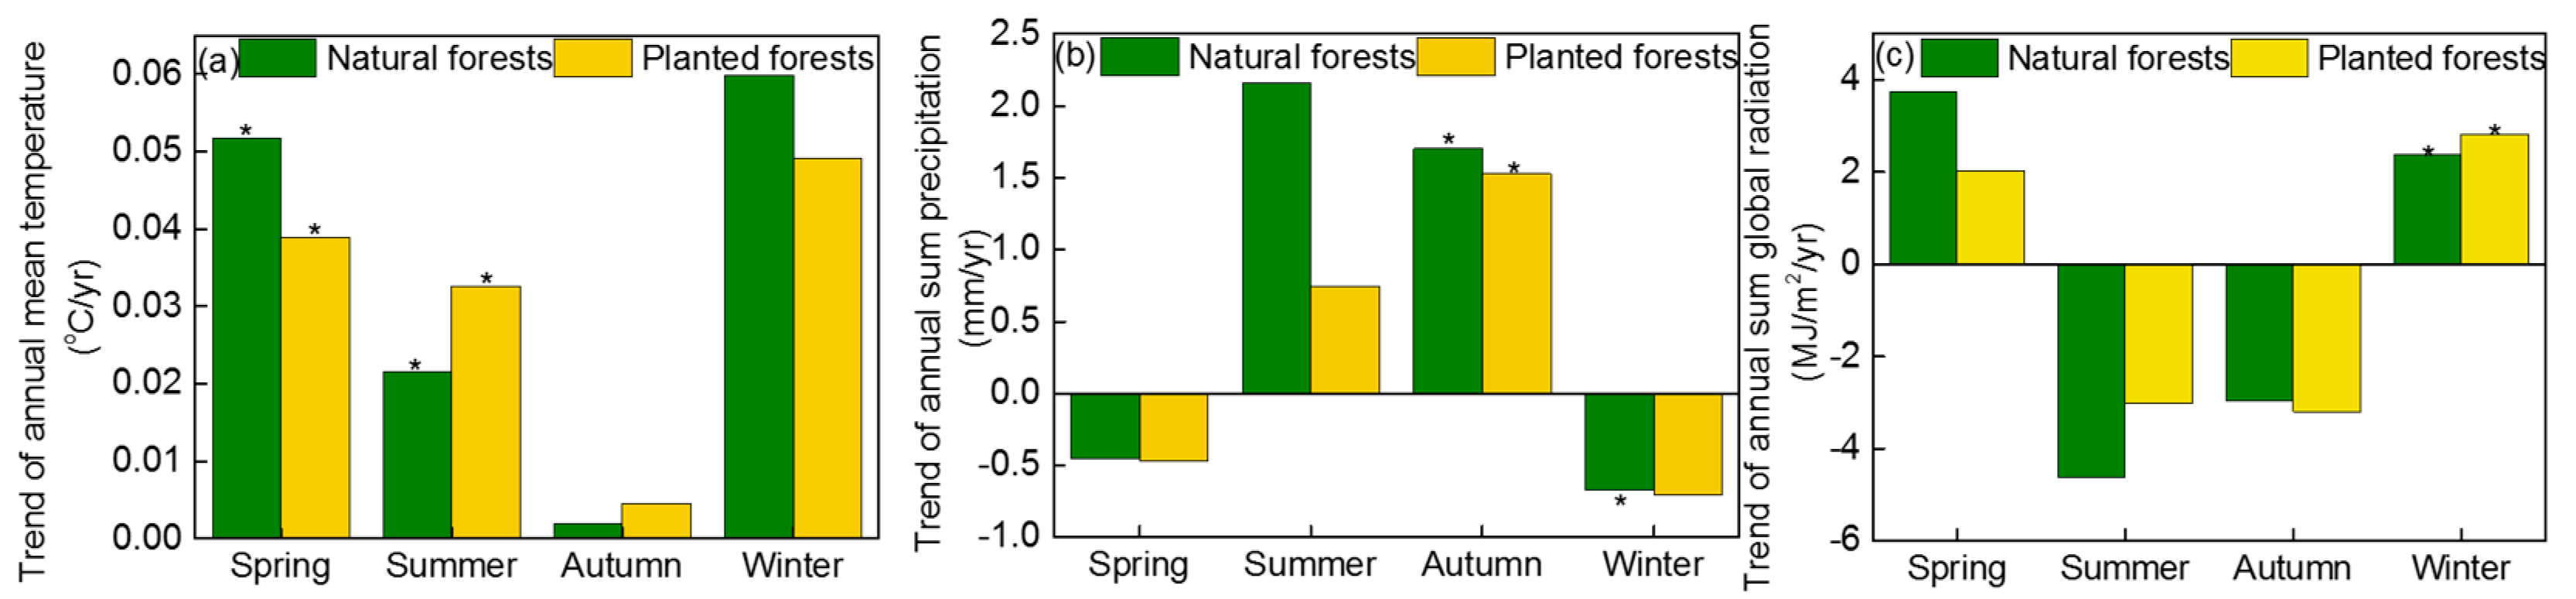
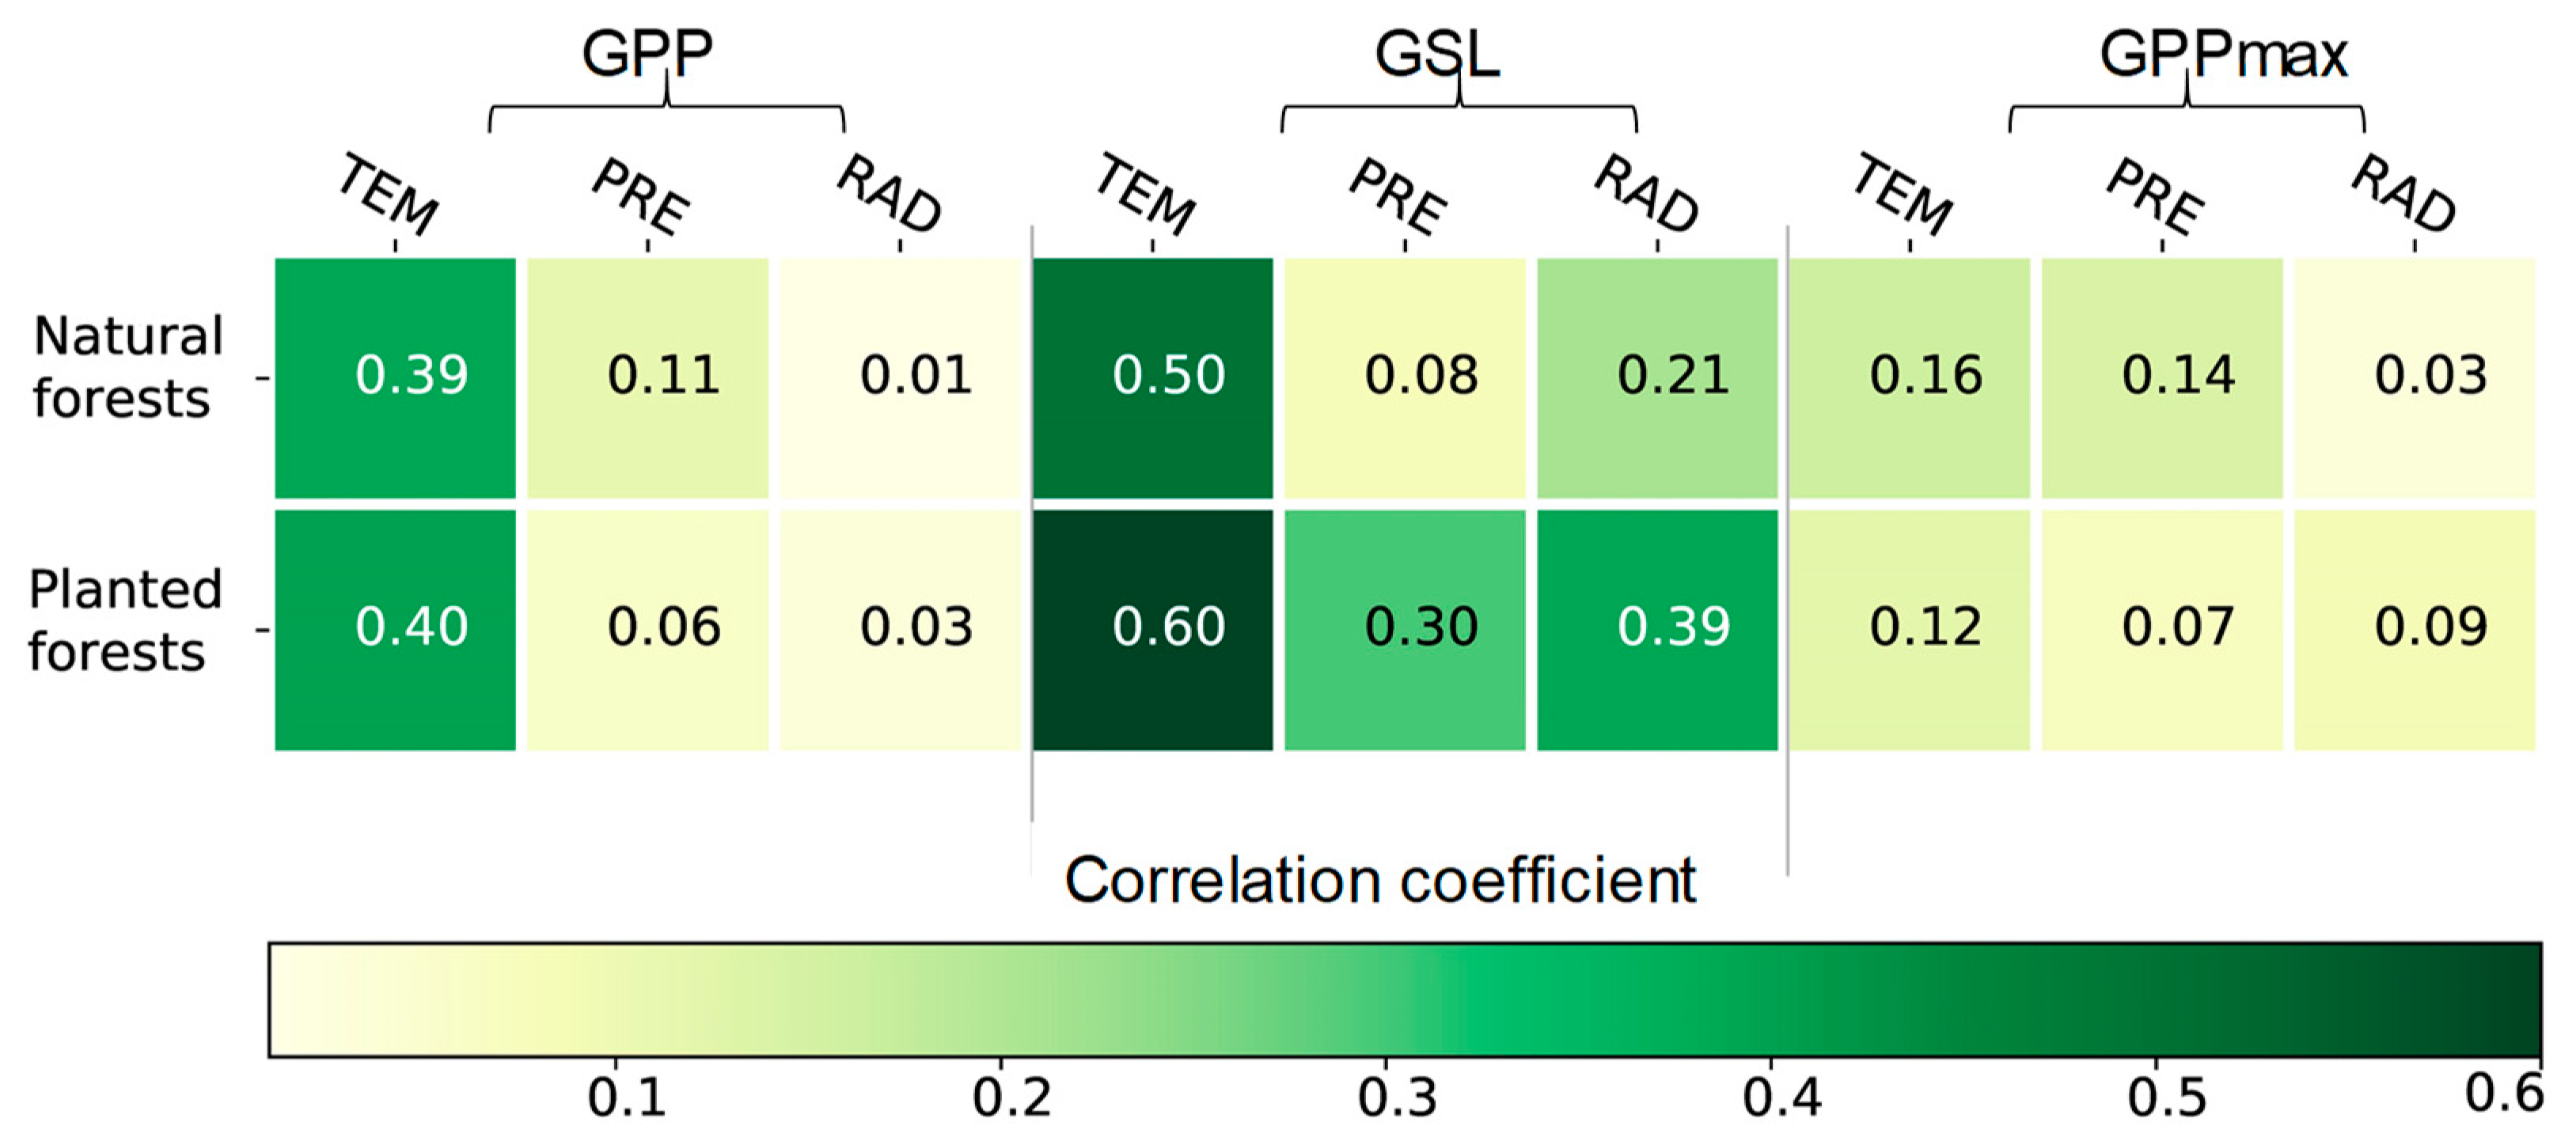
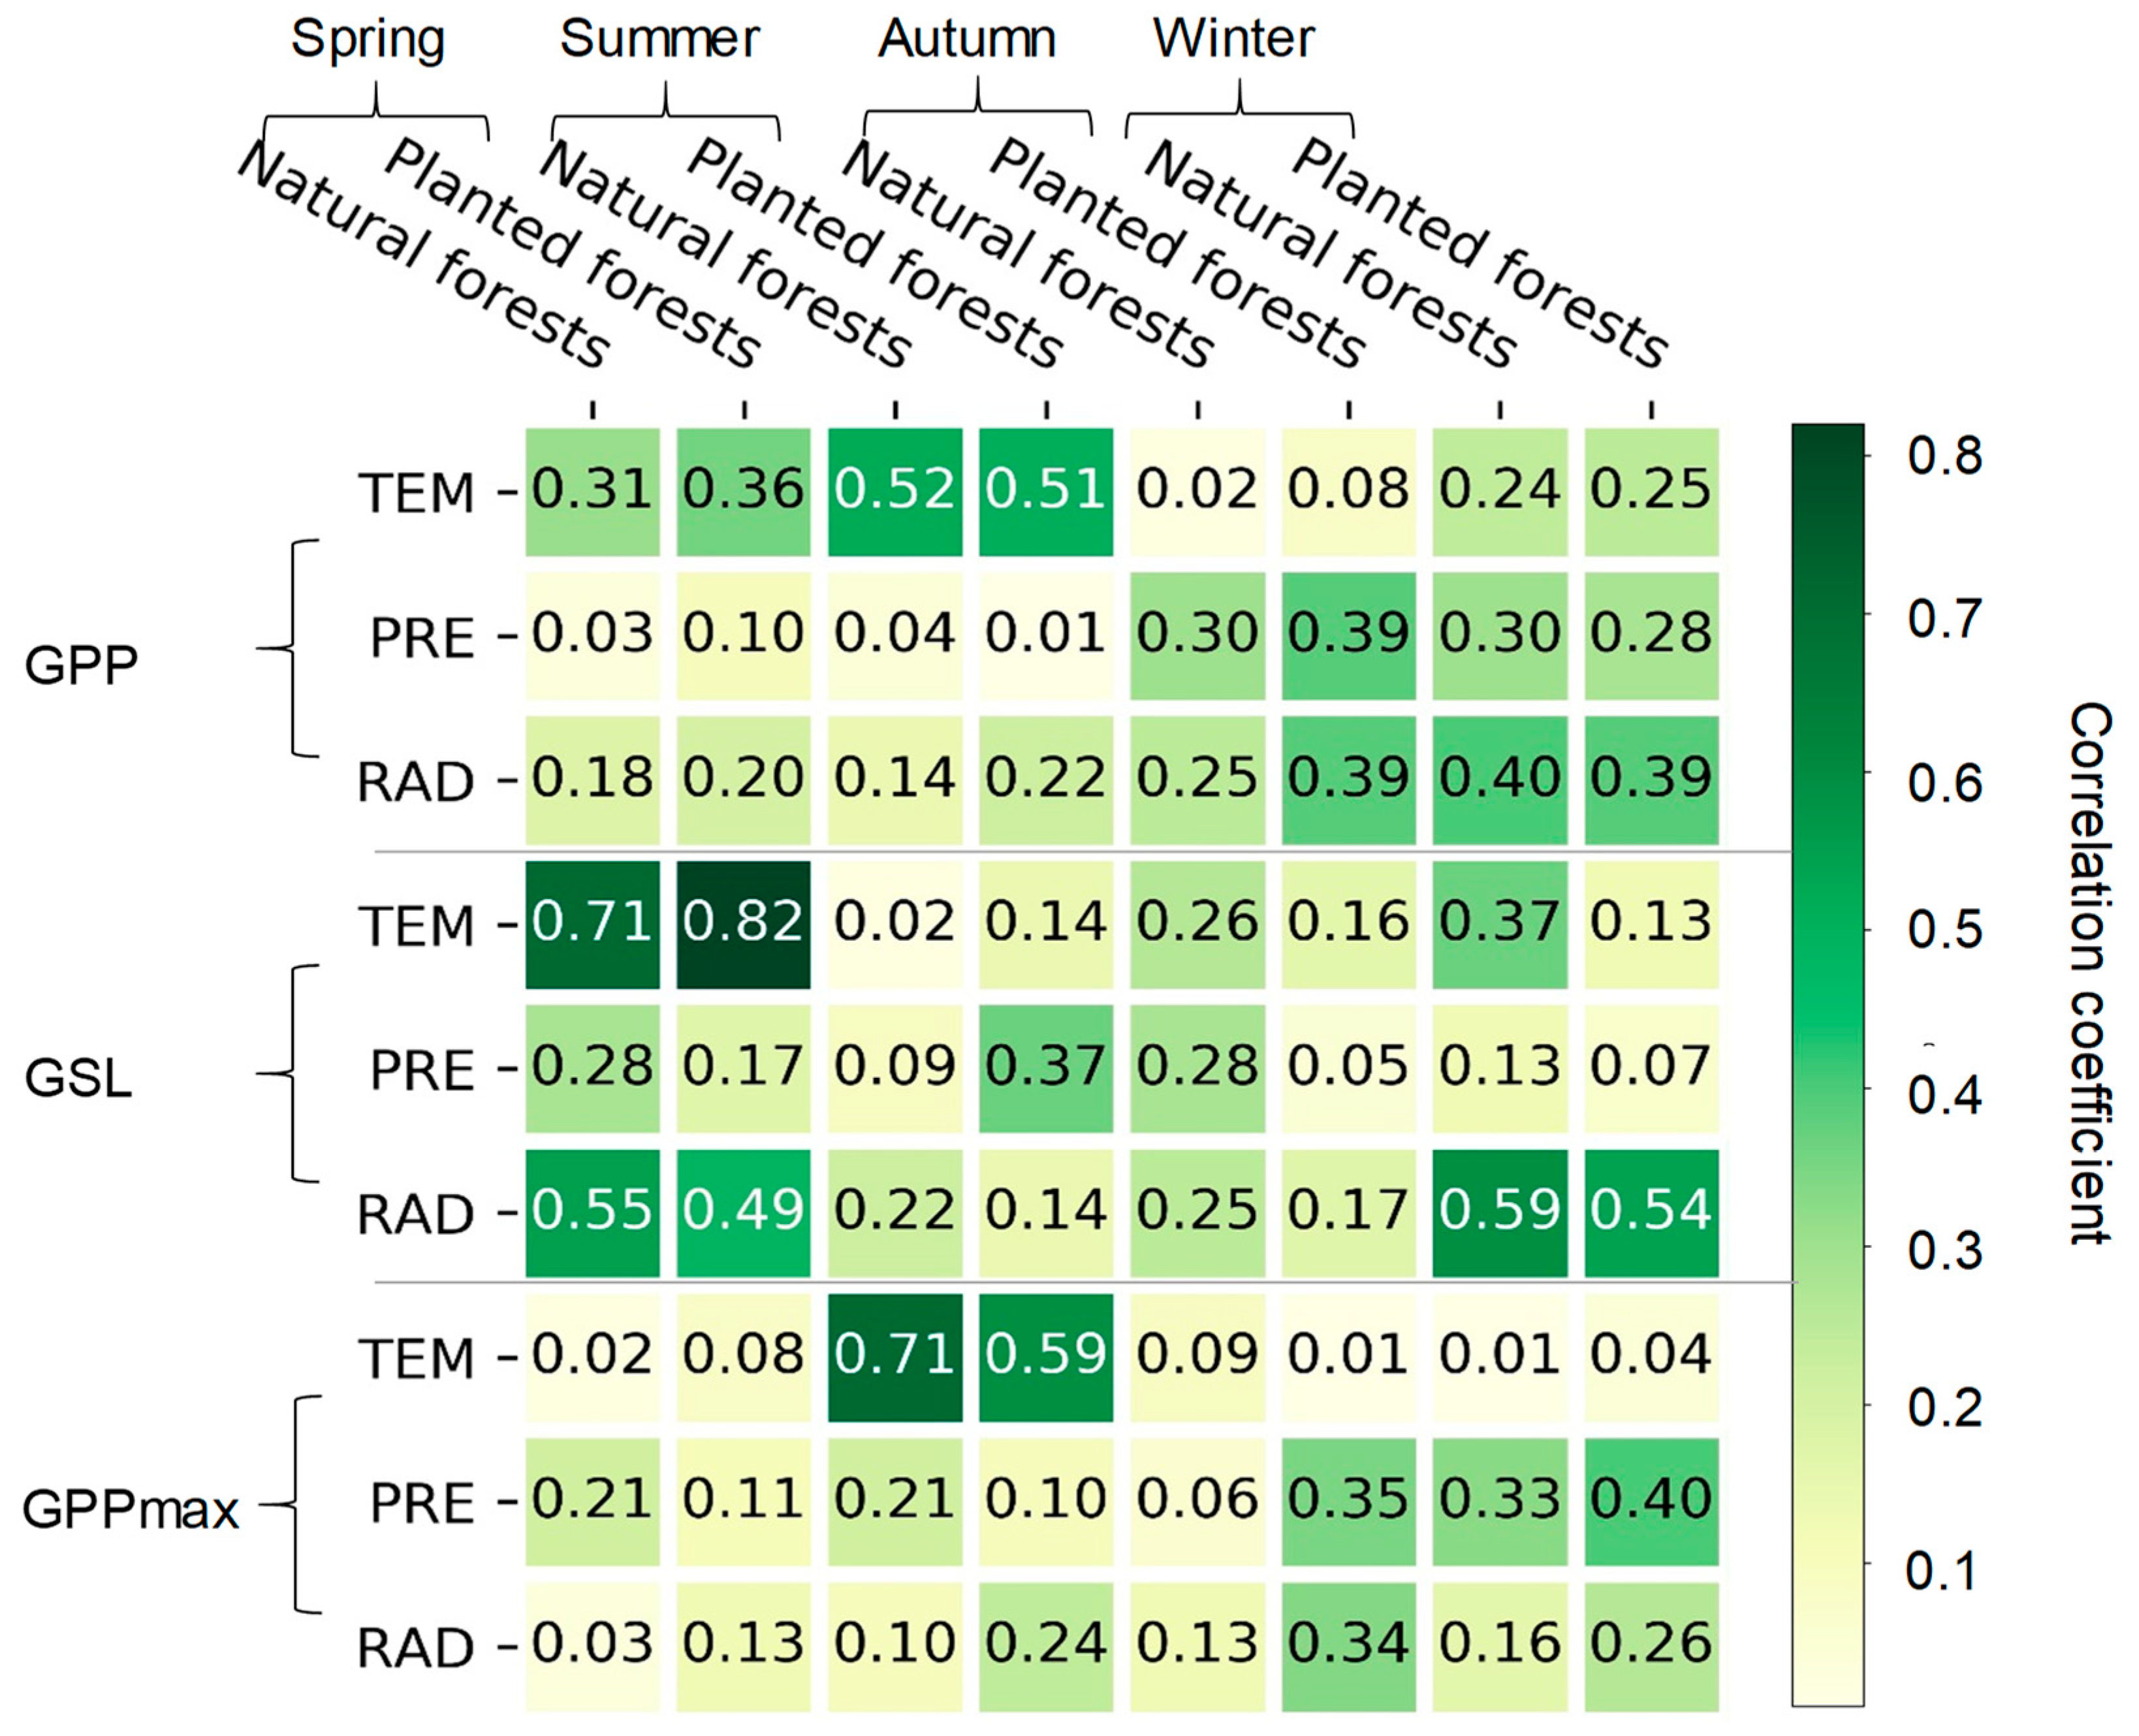
3.3. The Effects of Climatic Factors on the GSL, GPPmax, and GPP

Climate change affects processes, such as the GSL and GPPmax, ultimately leading to an increased annual GPP. During 2001–2020, the annual GPP was significantly correlated with TEM in natural and planted forests (R = 0.39, R = 0.40; p < 0.05, respectively), but not with PRE and RAD (Figure 6). The relationships between the GPP and climatic factors were similar in natural and planted forests.
The extension of the GSL is largely determined by the temperature rise. The GSLs of natural and planted forests were highly correlated with temperature during 2001–2020 (natural forests: R = 0.50 (p < 0.05); planted forests: R = 0.60 (p < 0.05); Figure 6). For example, the GSL extended by 2.56 and 4.17 days per degree with the increase in TEM for natural and planted forests during 2001–2020, respectively. The correlation between the GSL and climatic factors of planted forests was larger than with natural forests, indicating that planted forests were more sensitive to temperature rises. However, the GPPmax for both natural and planted forests was not correlated with three climate variables (Figure 6), because the GPPmax was also influenced by other environmental factors (e.g., rising CO2 and nitrogen deposition).
From 2001 to 2020, the GPP was significantly correlated with TEM in summer (R = 0.52 and 0.51; p < 0.05, respectively, in natural and planted forests; Figure 7). The GPP increased by 91.33 and 131.34 (gC/m2/yr)/°C with the increase in TEM in summer for natural and planted forests during 2001–2020, respectively (Table S1). The relationships between the GPP and climatic factors (i.e., TEM, PRE, and RAD) in different seasons were similar in natural and planted forests from 2001 to 2020 (Figure 7).
The correlation between the GPPmax and TEM in summer were also significant (R = 0.71 and 0.59; p < 0.05, respectively, in natural and planted forests; Figure 7). The GPPmax increased by 16.34 and 18 (gC/m2/mon)/°C with the increase in TEM in summer for natural and planted forests, respectively (Table S2). In addition, the increase in TEM in spring led to the extension of the GSL over 2001–2020 (R = 0.71 and 0.82; p < 0.05, respectively, in natural and planted forests; Figure 7). The GSL extended by 2.39 days °C and 3.59 days/°C with the increase in TEM in spring for natural and planted forests (Table S2). The increase in RAD in spring and winter also led to an extension in the GSL (Figure 7). Therefore, compared with natural forests, the sensitivity of the GPPmax and GSL to climatic factors (i.e., TEM, PRE, and RAD) in different seasons was larger in planted forests from 2001 to 2020 (Figure 7).
The TEM in natural and planted forests varied significantly during the spring and summer of 2001–2020 (Figure 8a). During 2001–2020, the spring TEM in natural forests experienced a more severe variation than that in planted forests, with a changing rate of 0.51 °C/yr and 0.38 °C/yr, respectively (Figure 8a). Nonetheless, the TEM in summer experienced a more obvious increase in planted forests than in natural forests (0.02 and 0.03 °C/sea, respectively; p < 0.05; Figure 8a). The PRE experienced an apparent increase in the autumn during 2001–2020, while the PRE in other seasons did not increase significantly (Figure 8b). The RAD also experienced a significant increase in winter from 2001 to 2020, but the RAD in other seasons did not increase significantly (Figure 8c).
Climate warming occurred in planted forests from 2001 to 2020. The increase in TEM in summer enhanced the GPPmax, stimulating the annual GPP, especially in planted forests. Climate warming in spring caused an extension in the GSL, affecting the annual GPP, particularly in planted forests.

4. Discussion

4.1. GPPmax Dominates Annual GPP Trend

The annual GPP of China’s deciduous forest ecosystems increased significantly during 2001–2020 (11.97 gC/m2/yr), which can be attributed to climate change and human activities in China [13]. Previous studies also showed a rapid increase in the annual GPP in the areas covered by deciduous forests. For example, the annual GPP of deciduous forests in the Qin Mountains all showed the largest increasing rates (>10 gC/m2/yr) [14,43,44]. The increasing rate of the forest GPP in the Greater Khingan Mountains was usually below 5 gC/m2/yr, which was consistent with the estimation from the Global Land Surface Satellite (GLASS) GPP product [45]. Moreover, the annual GPP of China derived from Penman–Monteith–Leuning Version 2 (PML-V2) and vegetation photosynthesis model (VPM) datasets increased by 8.99 g C/m2/yr and 9.68 g C/m2/yr, a little lower than the increasing rate of deciduous forest in this study [43,46]. Though the GOSIF-GPP may have provided a biased estimate for China’s deciduous forest, the standard deviation values in North China are relatively low [38].
The changes in the annual GPP can be associated with the GSL and GPPmax, which could allow us to better understand the changes in GPP from vegetation phenology and physiology [47]. Our results show that the GPPmax trend correlated more with the variation in the GPP than the GSL trend in China’s deciduous forest ecosystems. Zscheischler et al. (2016) pointed out that the number of high values in ecosystem fluxes (e.g., the GPP, NEP) were strongly correlated with their annual, and the effect of phenological dates showed less importance [48]. Fu et al. (2019) also found that the GPPmax dominated the interannual variability in the global carbon sink, rather than the GSL [49]. Therefore, a slight fluctuance in the GPPmax would lead to substantial changes in the annual GPP [35]. Moreover, the extension in the GSL likely, but not necessarily, would lead to a larger annual GPP, especially in temperature-limited ecosystems with a single period of carbon uptake per growing season (e.g., deciduous forest ecosystems) [30]. However, in water-limited ecosystems, changes in the GSL may appreciably change the annual GPP, due to precipitation events [50]. This indicates that the limiting factors of vegetation photosynthesis should be considered when evaluating the effects of vegetation phenology and physiology on the GPP.

4.2. High Sensitivity of GPP to Climate Change in Planted Forests

Exploring the differences between planted and natural forests’ responses to climate change has been an important research topic in recent years [51]. Our result found that the relationships between the GPP and climatic factors in planted forests were larger than in natural forests. This was similar to the study by Yu et al. (2019) who also pointed out that planted forests are more sensitive to climate change than natural forests [52]. The possible reasons were as follows. Firstly, planted forests were susceptible to water deficits, due to poor stomatal control [53]. Planted forests’ roots were more vulnerable to cavitation than those of natural forests [54]. They need more water to maintain high growth rates [55]. Secondly, the plant density of planted forests was significantly higher than that of natural forests, increasing the competition for resources [56]. Additionally, fewer tree species existed in planted forests than in natural forests [23]. Planted forests’ high sensitivity to climate change means they should be more appropriately managed (e.g., changing the planting density and regulating the species richness) to reduce damage. In contrast, other researchers suggested that, because of intensive management (e.g., human selection and the use of fertilizers), planted forests were more resistant to climate change than natural forests [57]. The differences between natural and planted forests’ responses to climate change in the future require further study, with the increase in in situ observations.

4.3. The Effect of Climate Change on the GSL, GPPmax, and GPP

Climate change influenced both the GPPmax and the GSL, essential determinants of the annual GPP [58,59]. Our results showed that the annual GPP increased significantly due to the large increase in the GPPmax. Specifically, the GPPmax was significantly correlated with the TEM in the summer. This is because the high values in ecosystem fluxes appear in summer in the Northern Hemisphere [49]. Our results were consistent with previous studies, which indicated that the rising annual mean temperature would increase GPP. For example, a one degree increase in the annual mean temperature would lead to an increase in GPP of 43.76 gC/m2/yr in natural forests, while planted forests will increase by 69.18 gC/m2/yr [26]. A 1.3 °C increase in temperature stimulated the positive changing trend in the net primary productivity in China during 1961–2010 [60]. However, Richardson et al. (2010) reported that climate warming stimulates photosynthesis more than respiration in the spring [31], which means that ecosystems with a higher GPPmax tend to have a larger annual GPP at the same GSL [30]. A vapor pressure deficit was also found to be a dominant control for stomatal conductance and, thus, for limiting photosynthesis [61]. The differences indicated that climate change in different seasons enormously impacted the carbon cycle of deciduous forest ecosystems.
Climate warming caused the advance of the leaf unfolding date, affecting the annual GPP, by influencing the GSL. Climate warming usually leads to a longer GSL, stimulating the GPP [62]. The response of the vegetation phenology to temperature was well divided between the advance in the leaf unfolding date and the delay in the leaf falling date. We found a significant relationship between the leaf unfolding dates and TEM in spring in China’s deciduous forest ecosystems (2.7 days/°C). Jeong et al. (2011) found that the Northern Hemisphere’s leaf unfolding dates advanced 5.2 days during 1982–1999 due to climate warming [63]. Gu et al. (2022) indicated that warmer temperatures during the previous growing season led to an earlier leaf unfolding date in the current year in temperate and boreal forests [64]. However, an earlier leaf unfolding date may result in less available water in the soil, and limited plant growth later [32]. We did not find a significant correlation between the leaf falling date and climatic factors in China’s deciduous forest ecosystems. Keenan et al. (2014) reported that a warmer temperature led to a later leaf falling date, with a 1 °C temperature change leading to a 1.8-day change in the leaf falling date [65]. A possible reason was the large uncertainty in estimating the key climate factors for vegetation phenology changes in the autumn [66]. The precipitation and global radiation also play essential roles in temperate and boreal ecosystems, in addition to the temperature. In a forested savannah, the net ecosystem exchange reached up to 2.5 tons C/ha when the precipitation rose to 585 mm/yr [67]. More precipitation could improve the soil water supply, enabling a longer carbon gain in autumn, while higher radiation might enable a greater net carbon gain as the day length becomes shorter [68].
Besides climatic factors, the land carbon cycle might be influenced by the rising CO2 concentration [5,6], increasing atmosphere nitrogen deposition [7], changing vegetation cover [4], vegetation recovery [69], and the agricultural Green Revolution [70]. However, it was noteworthy that the primary productivity might be weakened by deforestation [7] and the increasing risks of drought and heat [71]. Most studies have focused on the effect of CO2 on the GPP. In particular, the elevated atmospheric CO2 concentration substantially contributes to vegetation productivity. Zheng et al. (2020) found an increase of 11.6% in the global GPP with a rise of 100 ppm in the atmospheric CO2 [72]. In addition, the sensitivity of the GPP to climate variation would also be moderated by other factors, such as the CO2 fertilization effect [73]. It was far from clear how environmental changes (e.g., climate change and human activities) impact primary productivity by changing the phenology and physiology of vegetation [74]. Thus, more in situ observations need to be undertaken, to further understand the interaction between environmental changes (e.g., climate change and human activities) and primary productivity, and to predict possible changes in the future.

5. Conclusions

In this study, we analyzed the spatio-temporal variation in the annual GPP, and quantified the effects of the GSL, GPPmax, and climate variables on China’s deciduous forest ecosystems. We found that the annual GPP of China’s deciduous forest ecosystems increased significantly during 2001–2020. Planted forests showed a higher increase rate than natural forests. Though there were no significant differences in the trend in the GSL between natural and planted forests, planted forests showed a larger enhancement in the GPPmax than natural forests. Both the GPPmax and GSL correlated with the annual GPP significantly. The GPPmax trend dominated the trend in the GPP, compared with the GSL. Moreover, the GSL and GPPmax are also highly correlated with the annual mean temperature. The increase in the summer temperature increased the GPP and GPPmax, while the increase in the spring temperature extended the GSL. Our study indicated that it is critical to accurately simulate the roles of phenological and physiological indicators in controlling the trends in the GPP, and to better predict the temporal variation in the terrestrial GPP in the future.

Supplementary Materials

The following supporting information can be downloaded at: https://www.mdpi.com/article/10.3390/f14091880/s1, Figure S1: Spatial patterns of the leaf unfolding and leaf falling date trends during 2001–2020 in China’s deciduous forest ecosystems; Figure S2: The relationships between the trend in the annual gross primary productivity (GPP) and the leaf un-folding and leaf falling dates across natural forests (a,b), and planted forests (c,d), during 2001–2020. Table S1: The sensitivity of the annual gross primary productivity (GPP), growing season length (GSL), and maximum gross primary productivity (GPPmax) to the annual mean temperature (TEM), annual sum precipitation (PRE), and annual sum global radiation (RAD) across natural and planted forests during 2001–2020; Table S2: The sensitivity of the annual gross primary productivity (GPP), growing season length (GSL), and maximum gross primary productivity (GPPmax) to the annual mean temperature (TEM), annual sum precipitation (PRE), and annual sum global radiation (RAD) in different seasons across natural and planted forests during 2001–2020.

Author Contributions

Conceptualization, Y.L. and W.C.; methodology, Y.L. and X.L.; validation, Y.L. and X.L.; data curation, Y.L. and X.L.; writing—original draft preparation, Y.L. and X.L.; writing—review and editing, X.L. and W.C.; supervision, W.C. All authors have read and agreed to the published version of the manuscript.

Funding

This research was funded by the National Natural Science Foundation of China Research on the Greening Process and its Mechanism of Regional Ecosystem Services in Kubuqi Desert (42061069); The Science and Technology Innovation Project of Inner Mongolia Autonomous Region Department of Natural Resources “Application Research on Land Spatial Resilience Pattern and Implementation Path in the Yellow River Basin of Inner Mongolia”; Key Technology and Application of Ecological Quality Diagnosis and Integrated Management of “Beautiful Inner Mongolia” (2019GG010); Autonomous Region Talent Development Fund Project in 2021; and 2022 Inner Mongolia Autonomous Region “Grassland Talents” Project Young Innovation and Entrepreneurship Talents (First Level).

Data Availability Statement

Data will be made available on request.

Acknowledgments

The authors would like to thank the anonymous reviewers for their crucial comments, which improved the quality of this paper.

Conflicts of Interest

The authors declare no conflict of interest. The funders had no role in the design of the study; in the collection, analyses, or interpretation of data; in the writing of the manuscript; or in the decision to publish the results.

References

  1. Ballantyne, A.P.; Alden, C.B.; Miller, J.B.; Tans, P.P.; White, J.W.C. Increase in observed net carbon dioxide uptake by land and oceans during the past 50 years. Nature 2012, 488, 70–72. [Google Scholar] [CrossRef] [PubMed]
  2. Krause, A.; Papastefanou, P.; Gregor, K.; Layritz, L.S.; Zang, C.S.; Buras, A.; Li, X.; Xiao, J.; Rammig, A. Quantifying the impacts of land cover change on gross primary productivity globally. Sci. Rep. 2022, 12, 18398. [Google Scholar] [CrossRef] [PubMed]
  3. Madani, N.; Parazoo, N.C.; Kimball, J.S.; Ballantyne, A.P.; Reichle, R.H.; Maneta, M.; Saatchi, S.; Palmer, P.I.; Liu, Z.; Tagesson, T. Recent amplified global gross primary productivity due to temperature increase is offset by reduced productivity due to water constraints. AGU Adv. 2020, 1, e2020AV000180. [Google Scholar] [CrossRef]
  4. Stocker, B.D.; Zscheischler, J.; Keenan, T.F.; Prentice, I.C.; Seneviratne, S.I.; Peñuelas, J. Drought impacts on terrestrial primary production underestimated by satellite monitoring. Nat. Geosci. 2019, 12, 264–270. [Google Scholar] [CrossRef]
  5. Myneni, R.B.; Keeling, C.; Tucker, C.J.; Asrar, G.; Nemani, R.R. Increased plant growth in the northern high latitudes from 1981 to 1991. Nature 1997, 386, 698–702. [Google Scholar] [CrossRef]
  6. Keeling, C.D.; Chin, J.; Whorf, T. Increased activity of northern vegetation inferred from atmospheric CO2 measurements. Nature 1996, 382, 146–149. [Google Scholar] [CrossRef]
  7. Pan, Y.; Birdsey, R.; Hom, J.; McCullough, K. Separating effects of changes in atmospheric composition, climate and land-use on carbon sequestration of US Mid-Atlantic temperate forests. For. Ecol. Manag. 2009, 259, 151–164. [Google Scholar] [CrossRef]
  8. Piao, S.; Fang, J.; Zhou, L.; Ciais, P.; Zhu, B. Variations in satellite-derived phenology in China’s temperate vegetation. Glob. Chang. Biol. 2006, 12, 672–685. [Google Scholar] [CrossRef]
  9. Fang, J.; Chen, A.; Peng, C.; Zhao, S.; Ci, L. Changes in forest biomass carbon storage in China between 1949 and 1998. Science 2001, 292, 2320–2322. [Google Scholar] [CrossRef]
  10. Pan, Y.; Chen, J.; Birdsey, R.; McCullough, K.; He, L.; Deng, F. Age structure and disturbance legacy of North American forests. Biogeosciences 2011, 8, 715–732. [Google Scholar] [CrossRef]
  11. Piao, S.; Yin, G.; Tan, J.; Cheng, L.; Huang, M.; Li, Y.; Liu, R.; Mao, J.; Myneni, R.B.; Peng, S.; et al. Detection and attribution of vegetation greening trend in China over the last 30 years. Glob. Chang. Biol. 2015, 21, 1601–1609. [Google Scholar] [CrossRef] [PubMed]
  12. Tian, H.; Melillo, J.; Lu, C.; Kicklighter, D.; Liu, M.; Ren, W.; Xu, X.; Chen, G.; Zhang, C.; Pan, S.; et al. China’s terrestrial carbon balance: Contributions from multiple global change factors. Glob. Biogeochem. Cycles 2011, 25, 209. [Google Scholar] [CrossRef]
  13. Tong, X.; Brandt, M.; Yue, Y.; Horion, S.; Wang, K.; Keersmaecker, W.D.; Tian, F.; Schurgers, G.; Xiao, X.; Luo, Y.; et al. Increased vegetation growth and carbon stock in China karst via ecological engineering. Nat. Sustain. 2018, 1, 44–50. [Google Scholar] [CrossRef]
  14. Chen, Y.; Feng, X.; Tian, H.; Wu, X.; Gao, Z.; Feng, Y.; Piao, S.; Lv, N.; Pan, N.; Fu, B. Accelerated increase in vegetation carbon sequestration in China after 2010: A turning point resulting from climate and human interaction. Glob. Chang. Biol. 2021, 27, 5848–5864. [Google Scholar] [CrossRef] [PubMed]
  15. Brandt, M.; Yue, Y.; Wigneron, J.P.; Tong, X.; Tian, F.; Jepsen, M.R.; Xiao, X.; Verger, A.; Mailon, A.; Al-Yaari, A.; et al. Satellite-observed major greening and biomass increase in south China karst during recent decade. Earth’s Future 2018, 6, 1017–1028. [Google Scholar] [CrossRef]
  16. Brinck, K.; Fischer, R.; Groeneveld, J.; Lehmann, S.; Dantas De Paula, M.; Pütz, S.; Sexton, J.O.; Song, D.; Huth, A. High resolution analysis of tropical forest fragmentation and its impact on the global carbon cycle. Nat. Commun. 2017, 8, 14855. [Google Scholar] [CrossRef] [PubMed]
  17. Mitchard, E.T. The tropical forest carbon cycle and climate change. Nature 2018, 559, 527–534. [Google Scholar] [CrossRef]
  18. Engelbrecht, F.; Monteiro, P. Climate Change: The IPCC’s latest assessment report. Quest 2021, 17, 34–35. [Google Scholar]
  19. Yu, G.; Zhang, L.; Sun, X.; Fu, Y.; Wen, X.; Wang, Q.; Li, S.; Ren, C.; Song, X.; Liu, Y.; et al. Environmental controls over carbon exchange of three forest ecosystems in eastern China. Glob. Chang. Biol. 2008, 14, 2555–2571. [Google Scholar] [CrossRef]
  20. Chen, Y.; Shen, W.; Gao, S.; Zhang, K.; Wang, J.; Huang, N. Estimating deciduous broadleaf forest gross primary productivity by remote sensing data using a random forest regression model. J. Appl. Remote Sens. 2019, 13, 038502. [Google Scholar] [CrossRef]
  21. Xu, X.; Du, H.; Fan, W.; Hu, J.; Mao, F.; Dong, H. Long-term trend in vegetation gross primary production, phenology and their relationships inferred from the FLUXNET data. J. Environ. Manag. 2019, 246, 605–616. [Google Scholar] [CrossRef] [PubMed]
  22. Du, Z.; Yu, L.; Yang, J.; Xu, Y.; Chen, B.; Peng, S.; Zhang, T.; Fu, H.; Harris, N.; Gong, P. A global map of planting years of plantations. Sci. Data 2022, 9, 141. [Google Scholar] [CrossRef] [PubMed]
  23. Zhong, Z.; He, B.; Chen, Y.; Yuan, W.; Huang, L.; Guo, L.; Zhang, Y.; Xie, X. Higher Sensitivity of Planted Forests’ Productivity Than Natural Forests to Droughts in China. J. Geophys. Res. Biogeosci. 2021, 126, 3. [Google Scholar] [CrossRef]
  24. Ma, X.; Huete, A.; Cleverly, J.; Eamus, D.; Chevallier, F.; Joiner, J.; Poulter, B.; Zhang, Y.; Guanter, L.; Meyer, W. Drought rapidly diminishes the large net CO2 uptake in 2011 over semi-arid Australia. Sci. Rep. 2016, 6, 37747. [Google Scholar] [CrossRef] [PubMed]
  25. Frank, D.; Reichstein, M.; Bahn, M.; Thonicke, K.; Frank, D.; Mahecha, M.D.; Smith, P.; van der Velde, M.; Vicca, S.; Babst, F.; et al. Effects of climate extremes on the terrestrial carbon cycle: Concepts, processes and potential future impacts. Glob. Chang. Biol. 2015, 21, 2861–2880. [Google Scholar] [CrossRef] [PubMed]
  26. Zhu, X.J.; Fan, R.X.; Chen, Z.; Wang, Q.; Yu, G. Eddy covariance-based differences in net ecosystem productivity values and spatial patterns between naturally regenerating forests and planted forests in China. Sci. Rep. 2022, 12, 20556. [Google Scholar] [CrossRef]
  27. Gu, L.; Post, W.M.; Baldocchi, D.D.; Black, T.A.; Suyker, A.E.; Verma, S.B.; Vesala, T.; Wofsy, S.C. Characterizing the seasonal dynamics of plant community photosynthesis across a range of vegetation types. In Phenology of Ecosystem Processes; Springer: New York, NY, USA, 2009; pp. 35–58. [Google Scholar]
  28. Xia, J.; Niu, S.; Ciais, P.; Janssens, I.A.; Chen, J.; Ammann, C.; Arain, A.; Blanken, P.D.; Cescatti, A.; Bonal, D. Joint control of terrestrial gross primary productivity by plant phenology and physiology. Proc. Natl. Acad. Sci. USA 2015, 112, 2788–2793. [Google Scholar] [CrossRef]
  29. Delpierre, N.; Vitasse, Y.; Chuine, I.; Guillemot, J.; Bazot, S.; Rathgeber, C.B. Temperate and boreal forest tree phenology: From organ-scale processes to terrestrial ecosystem models. Ann. For. Sci. 2016, 73, 5–25. [Google Scholar] [CrossRef]
  30. Richardson, A.D.; Keenan, T.F.; Migliavacca, M.; Ryu, Y.; Sonnentag, O.; Toomey, M. Climate change, phenology, and phenological control of vegetation feedbacks to the climate system. Agric. For. Meteorol. 2013, 169, 156–173. [Google Scholar] [CrossRef]
  31. Richardson, A.D.; Andy Black, T.; Ciais, P.; Delbart, N.; Friedl, M.A.; Gobron, N.; Hollinger, D.Y.; Kutsch, W.L.; Longdoz, B.; Luyssaert, S. Influence of spring and autumn phenological transitions on forest ecosystem productivity. Philos. Trans. R. Soc. B 2010, 365, 3227–3246. [Google Scholar] [CrossRef]
  32. Kljun, N.; Black, T.A.; Griffis, T.; Barr, A.; Gaumont-Guay, D.; Morgenstern, K.; McCaughey, J.; Nesic, Z. Response of net ecosystem productivity of three boreal forest stands to drought. Ecosystems 2006, 9, 1128–1144. [Google Scholar] [CrossRef]
  33. Sacks, W.J.; Schimel, D.S.; Monson, R.K. Coupling between carbon cycling and climate in a high-elevation, subalpine forest: A model-data fusion analysis. Oecologia 2007, 151, 54–68. [Google Scholar] [CrossRef] [PubMed]
  34. Churkina, G.; Schimel, D.; Braswell, B.H.; Xiao, X. Spatial analysis of growing season length control over net ecosystem exchange. Glob. Chang. Biol. 2005, 11, 1777–1787. [Google Scholar] [CrossRef]
  35. Fu, Z.; Dong, J.; Zhou, Y.; Stoy, P.C.; Niu, S. Long term trend and interannual variability of land carbon uptake—The attribution and processes. Environ. Res. Lett. 2017, 12, 014018. [Google Scholar] [CrossRef]
  36. Yu, G.; Chen, Z.; Piao, S.; Peng, C.; Ciais, P.; Wang, Q.; Li, X.; Zhu, X. High carbon dioxide uptake by subtropical forest ecosystems in the East Asian monsoon region. Proc. Natl. Acad. Sci. USA 2014, 111, 4910–4915. [Google Scholar] [CrossRef] [PubMed]
  37. Wu, B.; Yuan, Q.; Yan, C.; Wang, Z.; Yu, X.; Li, A.; Ma, R.; Huang, J.; Chen, J.; Chang, C.; et al. Land cover changes of China from 2000 to 2010. Quat. Sci. 2014, 34, 723–731. [Google Scholar]
  38. Li, X.; Xiao, J. Mapping photosynthesis solely from solar-induced chlorophyll fluorescence: A global, fine-resolution dataset of gross primary production derived from OCO-2. Remote Sens. 2019, 11, 2563. [Google Scholar] [CrossRef]
  39. Fang, J.; Li, X.; Xiao, J.; Yan, X.; Li, B.; Liu, F. Vegetation photosynthetic phenology dataset in northern terrestrial ecosystems. Sci. Data 2023, 10, 300. [Google Scholar] [CrossRef]
  40. Chen, R.; Ersi, K.; Yang, J.; Lu, S.; Zhao, W. Validation of five global radiation models with measured daily data in China. Energy Convers. Manag. 2004, 45, 1759–1769. [Google Scholar] [CrossRef]
  41. Potter, C.S.; Klooster, S.; Brooks, V. Interannual variability in terrestrial net primary production: Exploration of trends and controls on regional to global scales. Ecosystems 1999, 2, 36–48. [Google Scholar] [CrossRef]
  42. Gu, Z.; Duan, X.; Shi, Y.; Li, Y.; Pan, X. Spatiotemporal variation in vegetation coverage and its response to climatic factors in the Red River Basin, China. Ecol. Indic. 2018, 93, 54–64. [Google Scholar] [CrossRef]
  43. Ma, J.; Xiao, X.; Miao, R.; Li, Y.; Chen, B.; Zhang, Y.; Zhao, B. Trends and controls of terrestrial gross primary productivity of China during 2000–2016. Environ. Res. Lett. 2019, 14, 084032. [Google Scholar] [CrossRef]
  44. Bo, Y.; Li, X.; Liu, K.; Wang, S.; Zhang, H.; Gao, X.; Zhang, X. Three Decades of Gross Primary Production (GPP) in China: Variations, Trends, Attributions, and Prediction Inferred from Multiple Datasets and Time Series Modeling. Remote Sens. 2022, 14, 2564. [Google Scholar] [CrossRef]
  45. Hu, L.; Fan, W.; Ren, H.; Liu, S.; Cui, Y.; Zhao, P. Spatiotemporal dynamics in vegetation GPP over the great khingan mountains using GLASS products from 1982 to 2015. Remote Sens. 2018, 10, 488. [Google Scholar] [CrossRef]
  46. He, S.; Zhang, Y.; Ma, N.; Tian, J.; Kong, D.; Liu, C. A daily and 500 m coupled evapotranspiration and gross primary production product across China during 2000–2020. Earth Syst. Sci. Data 2022, 14, 5463–5488. [Google Scholar] [CrossRef]
  47. Zhou, S.; Zhang, Y.; Caylor, K.K.; Luo, Y.; Xiao, X.; Ciais, P.; Huang, Y.; Wang, G. Explaining inter-annual variability of gross primary productivity from plant phenology and physiology. Agric. For. Meteorol. 2016, 226, 246–256. [Google Scholar] [CrossRef]
  48. Zscheischler, J.; Fatichi, S.; Wolf, S.; Blanken, P.D.; Bohrer, G.; Clark, K.; Desai, A.R.; Hollinger, D.; Keenan, T.; Novick, K.A. Short-term favorable weather conditions are an important control of interannual variability in carbon and water fluxes. J. Geophys. Res. Biogeosci. 2016, 121, 2186–2198. [Google Scholar] [CrossRef]
  49. Fu, Z.; Stoy, P.C.; Poulter, B.; Gerken, T.; Zhang, Z.; Wakbulcho, G.; Niu, S. Maximum carbon uptake rate dominates the interannual variability of global net ecosystem exchange. Glob. Chang. Biol. 2019, 25, 3381–3394. [Google Scholar] [CrossRef]
  50. Ahlstrom, A.; Raupach, M.R.; Schurgers, G.; Smith, B.; Arneth, A.; Jung, M.; Reichstein, M.; Canadell, J.G.; Friedlingstein, P.; Jain, A.K.; et al. The dominant role of semi-arid ecosystems in the trend and variability of the land CO2 sink. Science 2015, 348, 895–899. [Google Scholar] [CrossRef]
  51. Guo, Q.; Ren, H. Productivity as related to diversity and age in planted versus natural forests. Glob. Ecol. Biogeogr. 2014, 23, 1461–1471. [Google Scholar] [CrossRef]
  52. Yu, Z.; Liu, S.; Wang, J.; Wei, X.; Schuler, J.; Sun, P.; Harper, R.; Zegre, N. Natural forests exhibit higher carbon sequestration and lower water consumption than planted forests in China. Glob. Chang. Biol. 2019, 25, 68–77. [Google Scholar] [CrossRef]
  53. Fernández, M.E.; Gyenge, J.; Schlichter, T. Water flux and canopy conductance of natural versus planted forests in Patagonia, South America. Trees 2009, 23, 415–427. [Google Scholar] [CrossRef]
  54. Domec, J.-C.; King, J.S.; Ward, E.; Oishi, A.C.; Palmroth, S.; Radecki, A.; Bell, D.M.; Miao, G.; Gavazzi, M.; Johnson, D.M. Conversion of natural forests to managed forest plantations decreases tree resistance to prolonged droughts. For. Ecol. Manag. 2015, 355, 58–71. [Google Scholar] [CrossRef]
  55. Licata, J.A.; Gyenge, J.E.; Fernández, M.E.; Schlichter, T.M.; Bond, B.J. Increased water use by ponderosa pine plantations in northwestern Patagonia, Argentina compared with native forest vegetation. For. Ecol. Manag. 2008, 255, 753–764. [Google Scholar] [CrossRef]
  56. Martín-Benito, D.; Del Río, M.; Heinrich, I.; Helle, G.; Cañellas, I. Response of climate-growth relationships and water use efficiency to thinning in a Pinus nigra afforestation. For. Ecol. Manag. 2010, 259, 967–975. [Google Scholar] [CrossRef]
  57. Luo, H.; Zhou, T.; Wu, H.; Zhao, X.; Wang, Q.; Gao, S.; Li, Z. Contrasting Responses of Planted and Natural Forests to Drought Intensity in Yunnan, China. Remote Sens. 2016, 8, 635. [Google Scholar] [CrossRef]
  58. Fu, Z.; Stoy, P.C.; Luo, Y.; Chen, J.; Sun, J.; Montagnani, L.; Wohlfahrt, G.; Rahman, A.F.; Rambal, S.; Bernhofer, C.; et al. Climate controls over the net carbon uptake period and amplitude of net ecosystem production in temperate and boreal ecosystems. Agric. For. Meteorol. 2017, 243, 9–18. [Google Scholar] [CrossRef]
  59. Falge, E.; Baldocchi, D.; Tenhunen, J.; Aubinet, M.; Bakwin, P.; Berbigier, P.; Bernhofer, C.; Burba, G.; Clement, R.; Davis, K.J.; et al. Seasonality of ecosystem respiration and gross primary production as derived from FLUXNET measurements. Agric. For. Meteorol. 2002, 113, 53–74. [Google Scholar] [CrossRef]
  60. Gu, F.; Zhang, Y.; Huang, M.; Tao, B.; Guo, R.; Yan, C. Effects of climate warming on net primary productivity in China during 1961–2010. Ecol. Evol. 2017, 7, 6736–6746. [Google Scholar] [CrossRef]
  61. Reitz, O.; Bogena, H.; Neuwirth, B.; Sanchez-Azofeifa, A.; Graf, A.; Bates, J.; Leuchner, M. Environmental Drivers of Gross Primary Productivity and Light Use Efficiency of a Temperate Spruce Forest. J. Geophys. Res.-Biogeosci. 2023, 128, e2022JG007197. [Google Scholar] [CrossRef]
  62. Dragoni, D.; Schmid, H.P.; Wayson, C.A.; Potter, H.; Grimmond, C.S.B.; Randolph, J.C. Evidence of increased net ecosystem productivity associated with a longer vegetated season in a deciduous forest in south-central Indiana, USA. Glob. Chang. Biol. 2011, 17, 886–897. [Google Scholar] [CrossRef]
  63. Jeong, S.-J.; Ho, C.-H.; Gim, H.-J.; Brown, M.E. Phenology shifts at start vs. end of growing season in temperate vegetation over the Northern Hemisphere for the period 1982–2008. Glob. Chang. Biol. 2011, 17, 2385–2399. [Google Scholar] [CrossRef]
  64. Gu, H.; Qiao, Y.; Xi, Z.; Rossi, S.; Smith, N.G.; Liu, J.; Chen, L. Warming-induced increase in carbon uptake is linked to earlier spring phenology in temperate and boreal forests. Nat. Commun. 2022, 13, 3698. [Google Scholar] [CrossRef] [PubMed]
  65. Keenan, T.F.; Gray, J.; Friedl, M.A.; Toomey, M.; Bohrer, G.; Hollinger, D.Y.; Munger, J.W.; O’Keefe, J.; Schmid, H.P.; Wing, I.S.; et al. Net carbon uptake has increased through warming-induced changes in temperate forest phenology. Nat. Clim. Chang. 2014, 4, 598–604. [Google Scholar] [CrossRef]
  66. Menzel, A.; Sparks, T.H.; Estrella, N.; Roy, D. Altered geographic and temporal variability in phenology in response to climate change. Global Ecol. Biogeogr. 2006, 15, 498–504. [Google Scholar] [CrossRef]
  67. Cleverly, J.; Boulain, N.; Villalobos-Vega, R.; Grant, N.; Faux, R.; Wood, C.; Cook, P.G.; Yu, Q.; Leigh, A.; Eamus, D. Dynamics of component carbon fluxes in a semi-arid Acacia woodland, central Australia. J. Geophys. Res. Biogeosci. 2013, 118, 1168–1185. [Google Scholar] [CrossRef]
  68. Niu, S.; Luo, Y.; Fei, S.; Montagnani, L.; Bohrer, G.; Janssens, I.A.; Gielen, B.; Rambal, S.; Moors, E.; Matteucci, G. Seasonal hysteresis of net ecosystem exchange in response to temperature change: Patterns and causes. Glob. Chang. Biol. 2011, 17, 3102–3114. [Google Scholar] [CrossRef]
  69. Kasischke, E.S.; Verbyla, D.L.; Rupp, T.S.; McGuire, A.D.; Murphy, K.A.; Jandt, R.; Barnes, J.L.; Hoy, E.E.; Duffy, P.A.; Calef, M. Alaska’s changing fire regime—Implications for the vulnerability of its boreal forests. Can. J. For. Res. 2010, 40, 1313–1324. [Google Scholar] [CrossRef]
  70. Gray, J.M.; Frolking, S.; Kort, E.A.; Ray, D.K.; Kucharik, C.J.; Ramankutty, N.; Friedl, M.A. Direct human influence on atmospheric CO2 seasonality from increased cropland productivity. Nature 2014, 515, 398–401. [Google Scholar] [CrossRef]
  71. Phillips, O.L.; Aragao, L.E.O.C.; Lewis, S.L.; Fisher, J.B.; Lloyd, J.; Lopez-Gonzalez, G.; Malhi, Y.; Monteagudo, A.; Peacock, J.; Quesada, C.A.; et al. Drought Sensitivity of the Amazon Rainforest. Science 2009, 323, 1344–1347. [Google Scholar] [CrossRef]
  72. Zheng, Y.; Shen, R.; Wang, Y.; Li, X.; Liu, S.; Liang, S.; Chen, J.; Ju, W.; Zhang, L.; Yuan, W. Improved estimate of global gross primary production for reproducing its long-term variation, 1982–2017. Earth Syst. Sci. Data 2020, 12, 2725–2746. [Google Scholar] [CrossRef]
  73. Bi, W.; He, W.; Zhou, Y.; Ju, W.; Liu, Y.B.; Liu, Y.; Zhang, X.; Wei, X.; Cheng, N. A global 0.05 dataset for gross primary production of sunlit and shaded vegetation canopies from 1992 to 2020. Sci. Data 2022, 9, 213. [Google Scholar] [CrossRef] [PubMed]
  74. Huang, K.; Xia, J.; Wang, Y.; Ahlström, A.; Chen, J.; Cook, R.B.; Cui, E.; Fang, Y.; Fisher, J.B.; Huntzinger, D.N.; et al. Enhanced peak growth of global vegetation and its key mechanisms. Nat. Ecol. Evol. 2018, 2, 1897–1905. [Google Scholar] [CrossRef] [PubMed]
Figure 1. Conceptual figure of the maximum value of gross primary productivity (GPP) and the growing season length (GSL) in determining changes in the annual GPP.
Forests 14 01880 g001
Figure 2. The spatial pattern of natural and planted forests in China’s deciduous forest ecosystems. The inset shows the percentage of natural and planted forests in China’s deciduous forest ecosystems.
Forests 14 01880 g002
Figure 3. The spatial patterns in the annual gross primary productivity (GPP), growing season length (GSL), and maximum gross primary productivity (GPPmax) trends during 2001–2020 in China’s deciduous forest ecosystems. The spatial patterns in the annual GPP, GSL, and GPPmax trends during 2001–2020 (ac). The temporal variations in the annual GPP, GSL, and GPPmax trends during 2001–2020 in China’s deciduous forest ecosystems (df). The temporal variations in the annual GPP, GSL, and GPPmax trends during 2001–2020 in natural forests and planted forests (gi). The shaded envelope in panels (df) indicates the 95% confidence interval across different forest types.
Forests 14 01880 g003
Figure 4. The relationships between the annual gross primary productivity (Black dots: GPP) and the growing season length (Green dots: GSL) and maximum gross primary productivity (Orange dots: GPPmax) in China’s deciduous forest ecosystems (a,d), and across natural forests (b,e), and planted forests (c,f), during 2001–2020.
Forests 14 01880 g004
Figure 5. A conceptual framework for the regulation of the growing season length (GSL) and maximum gross primary productivity (GPPmax) in the long-term trend in the annual gross primary productivity (GPP) in natural forests (a), and planted forests (b), for the period 2001–2020. The variation in the GSL was affected by the variation in the leaf unfolding date and leaf falling date. Solid lines indicate significant changes, while dotted lines indicate non-significant changes.
Forests 14 01880 g005
Figure 6. The relationships between the annual gross primary productivity (GPP), growing season length (GSL), and maximum gross primary productivity (GPPmax) and the annual mean temperature (TEM), annual sum precipitation (PRE), and annual sum global radiation (RAD) across natural and planted forests during 2001–2020. Note: the white font indicates p < 0.05.
Forests 14 01880 g006
Figure 7. The relationships between the annual gross primary productivity (GPP), growing season length (GSL), and maximum gross primary productivity (GPPmax) and the annual mean temperature (TEM), annual sum precipitation (PRE), and annual sum global radiation (RAD) in different seasons across natural and planted forests during 2001–2020. Note: the white font means p < 0.05.
Forests 14 01880 g007
Figure 8. The temporal trends in the annual mean temperature (TEM) (a), annual sum precipitation (PRE) (b), and annual global radiation (RAD) (c) in natural forests and planted forests and different seasons during 2001–2020. Note: * refers p < 0.05.
Forests 14 01880 g008
Table 1. A description of the climatic information.
TypeAnnual Mean Temperature (°C)Annual Sum Precipitation (mm)Annual Sum Global Radiation (MJ/m2/yr)
Natural forests3.16747.465960.07
Planted forests6.34924.586135.60
China’s deciduous forest ecosystems4.75836.026047.83
Disclaimer/Publisher’s Note: The statements, opinions and data contained in all publications are solely those of the individual author(s) and contributor(s) and not of MDPI and/or the editor(s). MDPI and/or the editor(s) disclaim responsibility for any injury to people or property resulting from any ideas, methods, instructions or products referred to in the content.

