Article

Modeling Above-Ground Carbon Dynamics under Different Silvicultural Treatments on the McDonald–Dunn Research Forest

by
Catherine Carlisle
,
Stephen Fitzgerald
and
Hailemariam Temesgen
*
College of Forestry, Oregon State University, Corvallis, OR 97333, USA
*
Author to whom correspondence should be addressed.
Forests 2023, 14(10), 2090; https://doi.org/10.3390/f14102090
Submission received: 28 August 2023 / Revised: 18 September 2023 / Accepted: 10 October 2023 / Published: 18 October 2023
(This article belongs to the Section Forest Inventory, Modeling and Remote Sensing)

Abstract

:
Forest management decisions affect carbon stock and rates of sequestration. One subject of debate is the rotation age that will optimize sequestration over extended periods. Some argue that shorter rotations facilitate greater sequestration rates due to the accelerated growth rates of younger trees compared to mature or old-growth trees. Others maintain that frequent harvesting will not allow forest carbon to rebound after each subsequent rotation, and thus more extended periods between clearcutting is the superior choice. These contrasting viewpoints are mirrored regarding the impact of thinning treatments, in that either thinning will enhance forest carbon uptake by facilitating improved and sustained r growth of residual trees or removing any above-ground biomass will outweigh the yields. This study aims to compare the different suites of management decisions and identify practical combinations of rotation ages and thinning applications that will optimize carbon sequestration while meeting other objectives over a 240-year projection timeframe. Stand development under different harvest rotations and thinning specifications was modeled using a Forest Vegetation Simulator (FVS). We found that site productivity was the primary determinant in stand-above-ground carbon dynamics under various management scenarios. Thus, the optimal rotation age/thinning treatment combinations differed between site classes. High productivity stands were estimated to sequester the most above-ground live carbon with 60-year rotations with a low-intensity thin at age 40. Moderately productive stands performed the best with 80-year rotations when two low-intensity thinning treatments were applied between harvests. For high and moderate productivity stands, estimates of gross carbon increased when two low or moderate-intensity thinning treatments were applied within 80- or 120-year rotations. High-intensity thinning treatments reduced total carbon sequestered over the 240-year projection timeframe for all productivity levels and rotation ages, except for low productivity stands under 120-year rotations.

1. Introduction

Due to increasing awareness and concern about the impacts of climate change, there has been a growing emphasis on forest carbon as a potential solution for mitigating greenhouse gas emissions. Forest land offsets 11% of nationwide greenhouse gas emissions in the United States through net carbon sequestration within woody biomass [1]. Forests in the Pacific Northwest cover approximately 24.7 million acres of land and are among the most productive forests in the world [2]. Within the Pacific Northwest, forests in the Oregon Coast Range have especially high biomass and carbon densities compared to other forest types due to the favorable growing conditions that facilitate annual tree growth [3,4].
The productivity of these forests has supported a long history of timber harvesting, which has played a critical role in the growth and development of the region [5]. However, there is now a need to balance the economic benefits of timber harvesting with the need to maintain and enhance forest carbon sequestration in the region. Forest management decisions in the future aim to meet harvest requirements without sacrificing the sequestration potential of this region’s forests. Forest management techniques such as determining the optimal rotation length and implementing silvicultural treatments, such as thinning, may be powerful tools that can allow managers to meet both objectives [6,7].
Whether short or long rotations are better for maximizing carbon sequestration has been the subject of debate. Classical stand development theory states that after the stand reaches maturity, its growth rates plateau at its maximum value of stand volume/biomass [8,9]. An asymptotic curve is often used to model stand growth trajectories since it is representative of the early rapid growth and then leveling off when the stand reaches a certain age. From that point onward, it is thought that total stand volume or biomass oscillates around that maximum until harvest or another form of disturbance [8,9]. The other side of the argument states that longer rotations (typically 60+ years) allow trees to grow larger and accumulate more biomass, which results in greater carbon storage over time [10]. Even though short rotations maintain fast growth rates, the overall reduction in total stand carbon storage and emissions from the harvest will outweigh the benefits of rapid sequestration [11,12].
The application of thinning treatments to forest stands also plays a significant role in carbon sequestration [13]. Commercial or pre-commercial thinning are silvicultural techniques applied in managed stands to facilitate faster growth rates and higher volume yields. Thinning operations entail removing selected trees to improve the vigor and wood quality of the residual trees [14]. Other benefits include improving stand health by reducing the risk of disease or insect infestation, mitigating fire risk, and enhancing wildlife habitat [15].
Two of the most common approaches to thinning are known as “thinning from above” and “thinning from below”. Thinning from above, also known as high thinning, involves removing larger, dominant trees from the upper canopy, while retaining lower canopy trees that experienced suppressed growth [15]. Thinning from below targets the removal of smaller, suppressed trees in the lower canopy. This can increase growth rates and crown expansion of dominant or co-dominant trees by alleviating the competition for resources and space [7]. In terms of effects on stand carbon, thinning from below is thought to increase above-ground carbon stocks because it retains the larger, more vigorous trees and allows them to accumulate biomass faster in the future [16].
Managers also have different options for defining the number of trees left within the stand post thinning. Residual tree quantities can be specified in trees per hectare, tree spacing, basal area per hectare, or residual stand density index (SDI). SDI is a representative metric of stand competition [17]. Relative SDI (RDI) is calculated by dividing by the theoretical maximum stand density for that forest type and region [18]. Specifying thinning intensities based on RDI can be preferable to managers who want to thin to stand density thresholds conceptualized by Drew & Flewelling [19], which represent the stages of development for even-aged, single-species stands: canopy closure, lower limit of full site occupancy, and the onset of self-thinning.
Strategies for stand-level carbon sequestration can be tailored to management objectives and individual stand and landscape characteristics. Current stand density, age, species composition, and site productivity determine how a stand responds to harvest operations and silvicultural treatments over time. Site productivity has a pivotal role in driving stand response to management activities. More productive stands may respond favorably to thinning operations regarding residual tree growth increment. The increased growth rates can offset the carbon loss by increasing sequestration rates up until harvest. On the other hand, thinning less productive stands may not increase growth rates to that same degree. In that case, the cost of removing carbon stored within above-ground live biomass may outweigh any potential benefits incurred from thinning treatments.
Forest growth and yield modeling can help inform multi-objective management, including the enhancement of carbon sequestration as a mitigation strategy for climate change. Growth and yield models can inform how forest stands grow and develop under different management scenarios. These can be used to evaluate trade-offs between other management objectives, such as timber production and carbon sequestration [8,9]. By simulating the effects of different management strategies on forest growth and carbon sequestration, forest growth and yield models can help identify the most effective management practices for achieving multiple objectives [20].
Forest Vegetation Simulator (FVS) is widely used in forest management and planning in the United States and Canada. It is considered a powerful tool for evaluating the impacts of different management options on forest growth and yield. FVS is classified as an empirical model. It uses statistical relationships between forest stand variables, such as age, site quality, and stand density, to predict future forest growth and yield [8,9]. The model structure of FVS is characterized as a distance-independent, individual tree model [21]. A distance-independent model does not consider the relative spacing between trees. Instead, FVS uses measures of overall stand density, such as trees per hectare and basal area per hectare, to simulate competitive pressures within the stand [22]. As an individual tree growth and yield model, FVS first predicts the growth of individual trees and then aggregates the tree-level predictions to generate estimates of stand-level attributes [8,9].
FVS uses site index as a proxy for climate and soil variables [23]. Site index measures stand productivity based on the height of dominant or co-dominant trees at a given reference age, usually 50 years, and is often expressed in feet or meters [24,25]. Dominant or co-dominant trees are used to assess site productivity because it is assumed that their height growth has not been impacted by stand density [26]. Site index is theorized to be a function of topographic variables, such as aspect and elevation, together with soil characteristics, such as soil type and fertility, and climatic variables, such as annual precipitation and maximum summer temperatures [27].

Purpose of Study

The primary goal of this project is to compare the efficacy of different forest management techniques in relation to maximizing forest carbon. Assessments were conducted using modeling software to project long-term changes in forest carbon storage under different management trajectories. Our objective was to find a suite of treatment options that maximized carbon storage for multiple rotation ages: 40-year, 60-year, 80-year, and 120-year. The relative performance of treatments was assessed within individual site classes: I, II, III, and IV.

2. Methods

2.1. Study Area

The McDonald–Dunn Forest encompasses approximately 11,250 acres of forested lands within the eastern foothills of the Oregon Coast Range. This area is called the “Valley Margin Zone” due to its adjacency to the Willamette Valley [28]. The mean annual rainfall is 1408 mm, which is lower than the average rainfall for the rest of the Coast Range due to the rain shadow effect of mountains to the west. The mean annual temperature is 11.2 °C. Yearly temperatures range from an average minimum of 1.3 °C in December to an average maximum of 27.4 °C in August [29]. The predominant coniferous species in the overstory is the Douglas fir (Pseudotsuga menziesii) [28].

2.2. Data

The College of Forestry McDonald–Dunn Research Forest provided data. The inventory data was FVS-formatted with separate tables for stand, plot, and individual tree metrics.
Inventory data was collected in 2019 and 2020. A total of 311 stands were inventoried over these two years: 89 in 2019 and 223 in 2020 (Figure 1). A nested plot sample design was applied, using a fixed radius plot to record seedlings and juvenile trees less than 5 in. in diameter and a variable radius plot to record larger trees. The diameter at breast height (DBH) and species of each tree was recorded. Tree heights were measured and recorded for a subset of trees within selected plots in each stand. Additional individual tree metrics such as management history, damage codes, and crown ratio were also recorded in the inventory data but not utilized for this project. Stand-level metrics, including site species, stand ID, inventory year, and site index were included within the inventory data as well. Spatial data was acquired from the McDonald–Dunn Research Forest geodatabase.

2.3. Stand Selection

In this study, management scenarios were projected and assessed on an individual site class basis. This approach ensured that the effects of treatments were evaluated within the context of stand productivity, allowing for a more precise assessment of the impact of management on forest carbon sequestration [30]. For model inputs, we selected a representative stand for each site class on the McDonald–Dunn research forest: I, II, III, and IV. The selected stands were recorded as having site index values that were equally spaced from one another on the King’s site index scale [31]. Since the large tree diameter growth equations rely on site characteristics, including elevation, aspect, and slope [32], we determined that it would be necessary to hold these attributes constant for each stand. This helped to reduce the potential impacts of variables not of interest to this study. The median values for elevation, slope, and aspect across all McDonald–Dunn stands were calculated and assigned to the four stands:
  • Elevation: 262 m. above sea-level
  • Slope: 40%
  • Aspect: 135°
Standardizing topographic variables across different site classes raised concerns since these features impact stand productivity [33]. We calculated the correlation coefficient for slope, elevation, and aspect against site index to address this issue. This helped determine whether maintaining consistent conditions across the four stands would skew our findings. We converted the circular aspect values to solar radiation aspect indices (TrASP)—a continuous variable ranging from 0 to 1 [34]. We found that the correlation coefficients between each topographic attribute and site index were less than 0.35, so we determined that setting each variable equivalent across the four stands would be appropriate.
To maintain consistency across all four stands, we used the same tree list as input, obtained from a randomly selected stand in the inventory data with an age of 75 years. The age of each stand was then adjusted to 75 years to align with the starting conditions and to prevent differences in stand age from influencing projected response to treatments [35]. We assumed that site productivity does not influence the natural regeneration within a stand at a specific age, as the ingrowth observed during inventory significantly impacts the predicted above-ground live carbon trajectory using the ORGANON variant of FVS. ORGANON is a distance-independent individual tree model developed by David Hann at Oregon State University and utilized across the Pacific Northwest [36].

2.4. Forest Vegetation Simulator Treatments

We examined the effects of thinning intensity, frequency, and timing of thinning treatments on above-ground live carbon sequestration. All thinning treatments were specified as “thinning from below”. Thinning intensity was defined as the residual stand density index of the stand post thinning [37]. The timing was defined as the age of the stand at the time of the thinning treatment. Frequency refers to the number of thinning iterations performed within a rotation [38]. We varied these three variables using a factorial experimental design (Figure 2), which involves combining the different levels of each variable to create a set of treatments [39].
In addition to exploring various thinning intensities, frequencies, and timings, we incorporated different rotation ages into our experiment. Specifically, we examined four rotation ages: 40, 60, 80, and 120 years. These rotation ages were selected based on specific management objectives for the McDonald–Dunn Research Forest, including timber production (40-year rotation), ecological forestry (60- and 80-year rotations), and reserve-based management (120-year rotation) [40]. The number of combinations tested had to be adjusted depending on the length of the rotation age. Shorter rotations allowed fewer combinations of thinning intensity, timing, and frequency, while longer rotations included more combinations. By incorporating multiple rotation ages into our study, we were able to assess the impacts of thinning on different time scales and identify optimal thinning regimes for varying rotation ages.
Thinning intensity was defined in terms of the relative stand density index (RDI) of residual trees left after the thinning operation. The RDI values employed to define the intensity of thinning treatments were chosen based on the stand density thresholds established by Drew & Flewelling [19]. Our high-intensity thinning treatment left a residual RDI of 25%, which corresponds to the minimum upper limit of the understocked zone characterized by low inter-tree competition. This intensity is commonly implemented for managing drought conditions. Moderate-intensity treatment aimed for a residual RDI of 35%, representing the lower threshold for full site occupancy. As for the low-intensity treatment, we targeted a residual RDI of 45%. At this level, the RDI signifies the upper threshold for full site occupancy before the stand approaches the “self-thinning” threshold at an RDI of 55% [19].
A maximum of three thinning treatments could be applied within a given rotation age. The frequency of thinning treatments within rotations was limited by various factors related to the timing of thinning. These constraints included the requirement for the stand to reach a quadratic mean diameter (QMD) of 24.1 cm before thinning could be implemented, a minimum interval of 10 years between consecutive treatments, and ensuring that the last thinning operation took place more than 10 years before the scheduled harvest [41]. For site classes I and II, the first treatment could only be applied after reaching the age of 40, whereas for site class III, the minimum age was 50. In the case of site class IV, the first treatment was not possible before the stand reached the age of 70.
Consequently, as rotation ages decreased, the options for thinning frequency became more limited, particularly for site classes III and IV, as they achieved the minimum QMD requirement after site classes I or II. Applying thinning treatments within 40-year rotations for all four site classes was impossible. One thinning could be applied during a 60-year rotation for site classes I and II, but not for the other two site classes. Site classes I, II, and III could have a maximum of two thinning treatments applied under an 80-year rotation. Using any thinning treatments during the 80-year rotation intervals of the site class IV stand was impossible. Up to three thinning treatments could be applied for all four site classes during their 120-year rotations.
All projections began with an initial clearcut in 2023. The initial and all subsequent harvests were all specified as clearcuts with a minimum cut diameter of 5.1 cm Legacy trees were not retained within stands. Planting would commence one year after each harvest. A total of 988 Douglas fir seedlings were planted per hectare for site classes I and II. For site classes III and IV, 889 Douglas-fir seedlings were planted per hectare [41]. Three separate herbicide applications were specified at the start of each rotation—the first within the same year as the harvest, followed by the second during the same year as planting, and lastly the third within the year after planting [42].
Quantity and species composition of natural regeneration were determined from the McDonald–Dunn inventory data. Ingrowth data were collected using 0.004 ha fixed radius plots by tallying the count and species of trees with diameter at breast height measurements of under 2.54 cm, thereby including trees under 1.37 m. tall. All inventoried stands were grouped together to calculate the average quantity of natural regeneration by species. Species such as Port Orford cedar and ponderosa pine, which were infrequently encountered within fixed radius plot data, were excluded from the analysis. Additionally, species like western hemlock and red alder were not considered, primarily in riparian areas. To evaluate natural regeneration, we used age classes since the quantity and species composition of ingrowth varies with stand age and developmental stage, reflecting changes in available resources and canopy structure over time [43]. Age classes were defined in 20-year intervals up to the age of 120.
Each simulation was set to span from the initial clearcut in 2023 to the year 2263, covering 240 years. This enabled comparisons between various rotation ages, ranging from two 120-year rotations to six 40-year rotations, four 60-year rotations to three 80-year rotations, and so on. The total gross sequestration in each scenario was determined by aggregating the harvested above-ground live carbon per hectare and the carbon lost from tree mortality over the 240-year projection period at ten-year growth cycles. Total harvested carbon within each interval was included within the FVSCarbon output tables. The calculation for the carbon lost to mortality involved multiplying the FVS-predicted stand-level cubic volume mortality by the wood density of Douglas fir to convert to biomass (kg/ha). Biomass was then converted to carbon (kg/ha) by multiplying by 0.5. Carbon values were converted to metric tons per hectare.

2.5. Assumptions

Interpreting FVS results requires certain assumptions inherent to utilizing empirical-based models. For example, FVS does not consider how changing environmental conditions impact stand development [32]. Increasing seasonal temperatures and increasing frequency and intensity of drought events will undoubtedly alter the stand trajectory over the projection timeframe used in our study [44]. The model assumes that the growth increment values recorded on inventory datasheets accurately represent the stand being modeled. Growth increment metrics are used to parametrize the height and diameter growth equations, so any measurement errors may bias results [21].
Assumptions were also made regarding the specifications applied to each projection. We assumed that natural regeneration will come in consistently through each 20-year interval and that the quantity and species composition of ingrowth for each age interval will be identical across the four site classes (Table 1).
Additionally, we assumed that using the same input tree list data for all stands would be realistic if we standardized their ages at the time of inventory to 75 [35]. In essence, we assumed that the tree list from the randomly selected stand accurately represents all stands of the same age within the McDonald–Dunn Research Forest.

3. Results

3.1. Site Class I

Site class I performed best under a 60-year rotation schedule, with one low-intensity thin applied at stand age 40, with an estimated 240-year sequestration of 2024.00 MT C/ha over the four rotations (Table 2). This exceeded the carbon sequestered under the optimal thinning regime for 80-year rotations by 65.01 MT C/ha and by 76.22 MT C/ha compared to the optimal thinning scenario associated with 120-year rotations. The 40-year rotation scenario produced dramatically lower estimates than the three other rotation ages. Predicted sequestration under a 40-year rotation schedule was estimated to be 1195.50 MT C/ha less than the 120-year, 1202.45 MT C/ha less than the 80-year, and 1272.16 MT C/ha less than the 60-year rotation scenario.
Low-intensity thinning treatments applied either once during 60-year rotations or twice during 80- and 120-year rotations outperformed moderate- or high-intensity for all examined scenarios, excluding the projection of 40-year rotations where no thinning treatment could be applied (Table 3). Decreasing the stand’s RDI to 45% was effective in maintaining high rates of total growth without negatively impacting the overall sequestration potential of the stand by removing excessive biomass.
While it was only possible to apply one thinning treatment within 60-year rotations, a maximum of two treatments could be applied within 80-year and a maximum of three could be applied during 120-year rotations. Applying two low intensity thinning treatments at stand ages 50 or 60 during 80-year rotation scenarios resulted in higher sequestration estimates when compared to scenarios where only one low intensity treatment was applied at stand age 50 (Table 4).
Applying two low-intensity treatments at stand ages 60 and 80 produced the highest estimates out of projections of 120-year rotation scenarios (Table 4). Total sequestration was estimated to increase by 657.94 MT C/ha compared to the no-thin control projection and by 236.05 MT C/ha compared to the scenario where only one low-intensity treatment was applied at stand age 60. Adding an extra low-intensity thinning treatment at stand age of 90 resulted in a 39.90 reduction in total sequestration.

3.2. Site Class II

Like site class I, site class II showed the highest performance under a 60-year rotation schedule with one low intensity applied at age 40, with an estimated sequestration of 2039.05 MT C/ha over 240 years (Table 5). The projection of 40-year rotations produced the lowest sequestration estimates, as within-rotation carbon accumulation underwent a sharp decline following the second harvest interval.
The highest estimated sequestration under 80-year rotations was observed when two low-intensity treatments were applied at ages 50 and 60 (Table 6 and Table 7). Projections of 120-year rotations also favored two iterations of thinning, with treatments applied at ages 60 and 80. A single thinning operation between harvests did not sufficiently control the density of ingrowth within 80- or 120-year rotations, which suppressed individual tree growth and significantly reduced above-ground carbon accumulation within the final rotation. However, including a third low-intensity treatment within 120-year harvest cycles decreased estimates by 134.05 MT C/ha compared to the two-treatment scenario (Table 7).

3.3. Site Class III

Site class III was estimated to sequester the most carbon under an 80-year rotation schedule with two low-intensity treatments applied at ages 50 and 60 (Table 8). Estimates from the 80-year rotation scenario were 112.31 MT C/ha higher than those from the optimal treatment regime associated with 120-year rotations. The 40- and 60-year rotation scenarios with no thinning were projected to perform significantly worse than the two longer rotations, with estimates being 946.45 and 874.04 MT C/ha lower than the 80-year rotation scenario, respectively.
Projections of 80-year rotations favored low-intensity thinning treatments (Table 9 and Table 10). Increasing the intensity of both treatments to moderate reduced estimates by 136.30 MT C/ha, while increasing the intensity to high reduced estimates by 269.00 MT C/ha over the 240-year projection period. A combination of one moderate- and two low-intensity treatments produced the highest estimates for the 120-year rotation scenarios when applied at ages 50, 60, and 80, respectively. Decreasing the intensity of the first thin to low-intensity reduced projected sequestration by 53.35 MT C/ha, while increasing the intensity of the latter two treatments to moderate intensity reduced it by 168.80 MT C/ha. A high-intensity only scenario decreased estimates by 341.19 MT C/ha (Table 9).
Under 80-year rotations, the two-thinning-treatment scenarios were estimated to sequester 514.92 MT C/ha more than the one-treatment (Table 10). Three iterations of thinning produced the highest estimates out of the 120-year rotation projections. Removing the last low-intensity treatment reduced estimates by 81.60 MT C/ha, while removing both latter two low-intensity treatments led to a 174.85 MT C/ha decrease in projected sequestration.

3.4. Site Class IV

Site class IV was estimated to sequester the most carbon under a 120-year rotation schedule with three moderate-intensity thinning treatments at ages 70, 80, and 90 (Table 11). This was projected to sequester 522.32 MT C/ha more than the 80-year rotation scenario, 827.19 MT C/ha more than the 60-year rotation scenario, and 754.11 MT C/ha more than the 40-year rotation scenario. Notably, the 40-year rotation projection produced higher estimates than the 60-year by 72.86 MT C/ha, which was not observed within the projections of the other three site classes.
Applying exclusively moderate-intensity thinning within 120-year rotations produced higher estimates compared to low- or high-intensity treatment scenarios (Table 12). High-intensity treatments reduced estimates by 147.06 MT C/ha, while low-intensity treatments reduced estimates by 361.59 MT C/ha.
We found that reducing thinning iterations to either one or two treatments within 120-year rotations decreased estimates by 128.00 and 21.74 MT C/ha, respectively, compared to the three-treatment scenario (Table 13).

4. Discussion

4.1. Rotation Age

The timing, intensity, and frequency of thinning treatments applied heavily influenced the optimal scenario for total above-ground live carbon sequestration. However, we found that as productivity increased, the rotation length associated with the highest carbon sequestration estimate decreased. This can be attributed to patterns in tree growth rates, as annual increments follow a peaking model over tree size or age, which is skewed towards larger sizes or older ages. ORGANON predicts 5-year diameter growth as a function of tree size, basal area per hectare in larger trees (BAL), crown ratio, and basal area per hectare (BA/ha) of the stand [45]. Estimated mean tree size within a given projection year will be larger for highly productive stands compared to less productive sites. Thus, ORGANON will estimate an earlier decline in growth rates.
For site classes I and II, the optimal carbon sequestration scenario was determined to be a 60-year rotation with a low-intensity thinning treatment applied at age 40. In this scenario, site class I was estimated to achieve 2024.03 MT C/ha of gross sequestration with a mean annual increment (MAI) of 35.3 m3/ha/year. For site class II, the projected carbon sequestration was estimated to be 2039.05 MT C/ha, with an MAI of 36.0 m3/ha/year. Comparatively, the 80-year rotation scenarios with two low intensity thins at ages 50 and 60 were estimated to sequester 1954.09 MT C/ha for site class I and 1773.18 MT C/ha for site class II, with corresponding estimated MAI values of 1109.87 MT C/ha and 1003.61 MT C/ha, respectively. The 120-year rotation scenario was estimated to sequester 76.67 MT C/ha less than the 60-year rotation scenario for site class I and 348.14 MT C/ha less for site class II.
For site classes III and IV, longer rotations were favored because MAI values were estimated to continue increasing after stand age 60. Growth rates began to decrease at age 70 for site class III and age 110 for site class IV.

4.2. Thinning Intensity

Our analysis revealed several trends regarding the optimal thinning intensity for each rotation age and site class:
  • With decreasing site productivity, the advantages of incorporating one or more moderate-intensity treatments became more pronounced.
  • Moderate-intensity treatments were particularly advantageous in longer rotations compared to shorter rotations, especially for stands with lower productivity.
  • High-intensity thinning was found to negatively impact total sequestration over the projection period when compared to scenarios that included low-, moderate-, or a combination of low- and moderate-intensity treatments within the rotations.
Site class I preferred to incorporate low-intensity treatments exclusively within 60-, 80-, and 120-year rotations (Table 14). We hypothesize that the preference for low-intensity treatments in site class I stems from the minimal requirement to remove understory and smaller conifer biomass to promote the growth of larger Douglas fir trees. The high productivity of the stand enables increased growth rates with lesser removal of competing vegetation compared to lower productivity sites. Consequently, the cost of further biomass removal in terms of lost carbon storage outweighs the benefits of enhanced growth rates.
Site classes II and III also favored low-intensity thinning within 60- and 80-year rotations (Table 14). However, in 120-year rotations, the highest estimated sequestration estimate was achieved with a combination of low- and moderate-intensity treatments, which facilitated increased growth rates compared to the low-intensity only scenarios. In site class III projections, for example, the three-treatment scenario with moderate- and low-intensity treatments within 120-year rotations increased the estimated MAI by 2.1 m3/ha/year. Applying exclusively moderate- or low-intensity thinning within 120-year rotations negatively affected total sequestration because of reduced large diameter Douglas fir volume within the stand at harvest.
Site class IV stands showed a unique response, benefiting exclusively from moderate-intensity thinning within 120-year rotations (Table 14), which resulted in a 361.59 MT C/ha increase in estimated sequestration and a 13.3 m3/ha/year increase in MAI compared to a low-intensity only scenario by the end of the projection period. With three low-intensity treatments, the stand showed a decline in growth rates of 15.1 m3/ha/year between 2213 and 2223, while the moderate-intensity scenario only saw a 2.1 m3/ha/year reduction over the same timeframe. This suggests that relying solely on low-intensity treatments is inadequate for maintaining consistent sequestration capabilities over time, as they may not fully eliminate sufficient biomass to promote accelerated growth rates on less productive sites.

4.3. Thinning Frequency

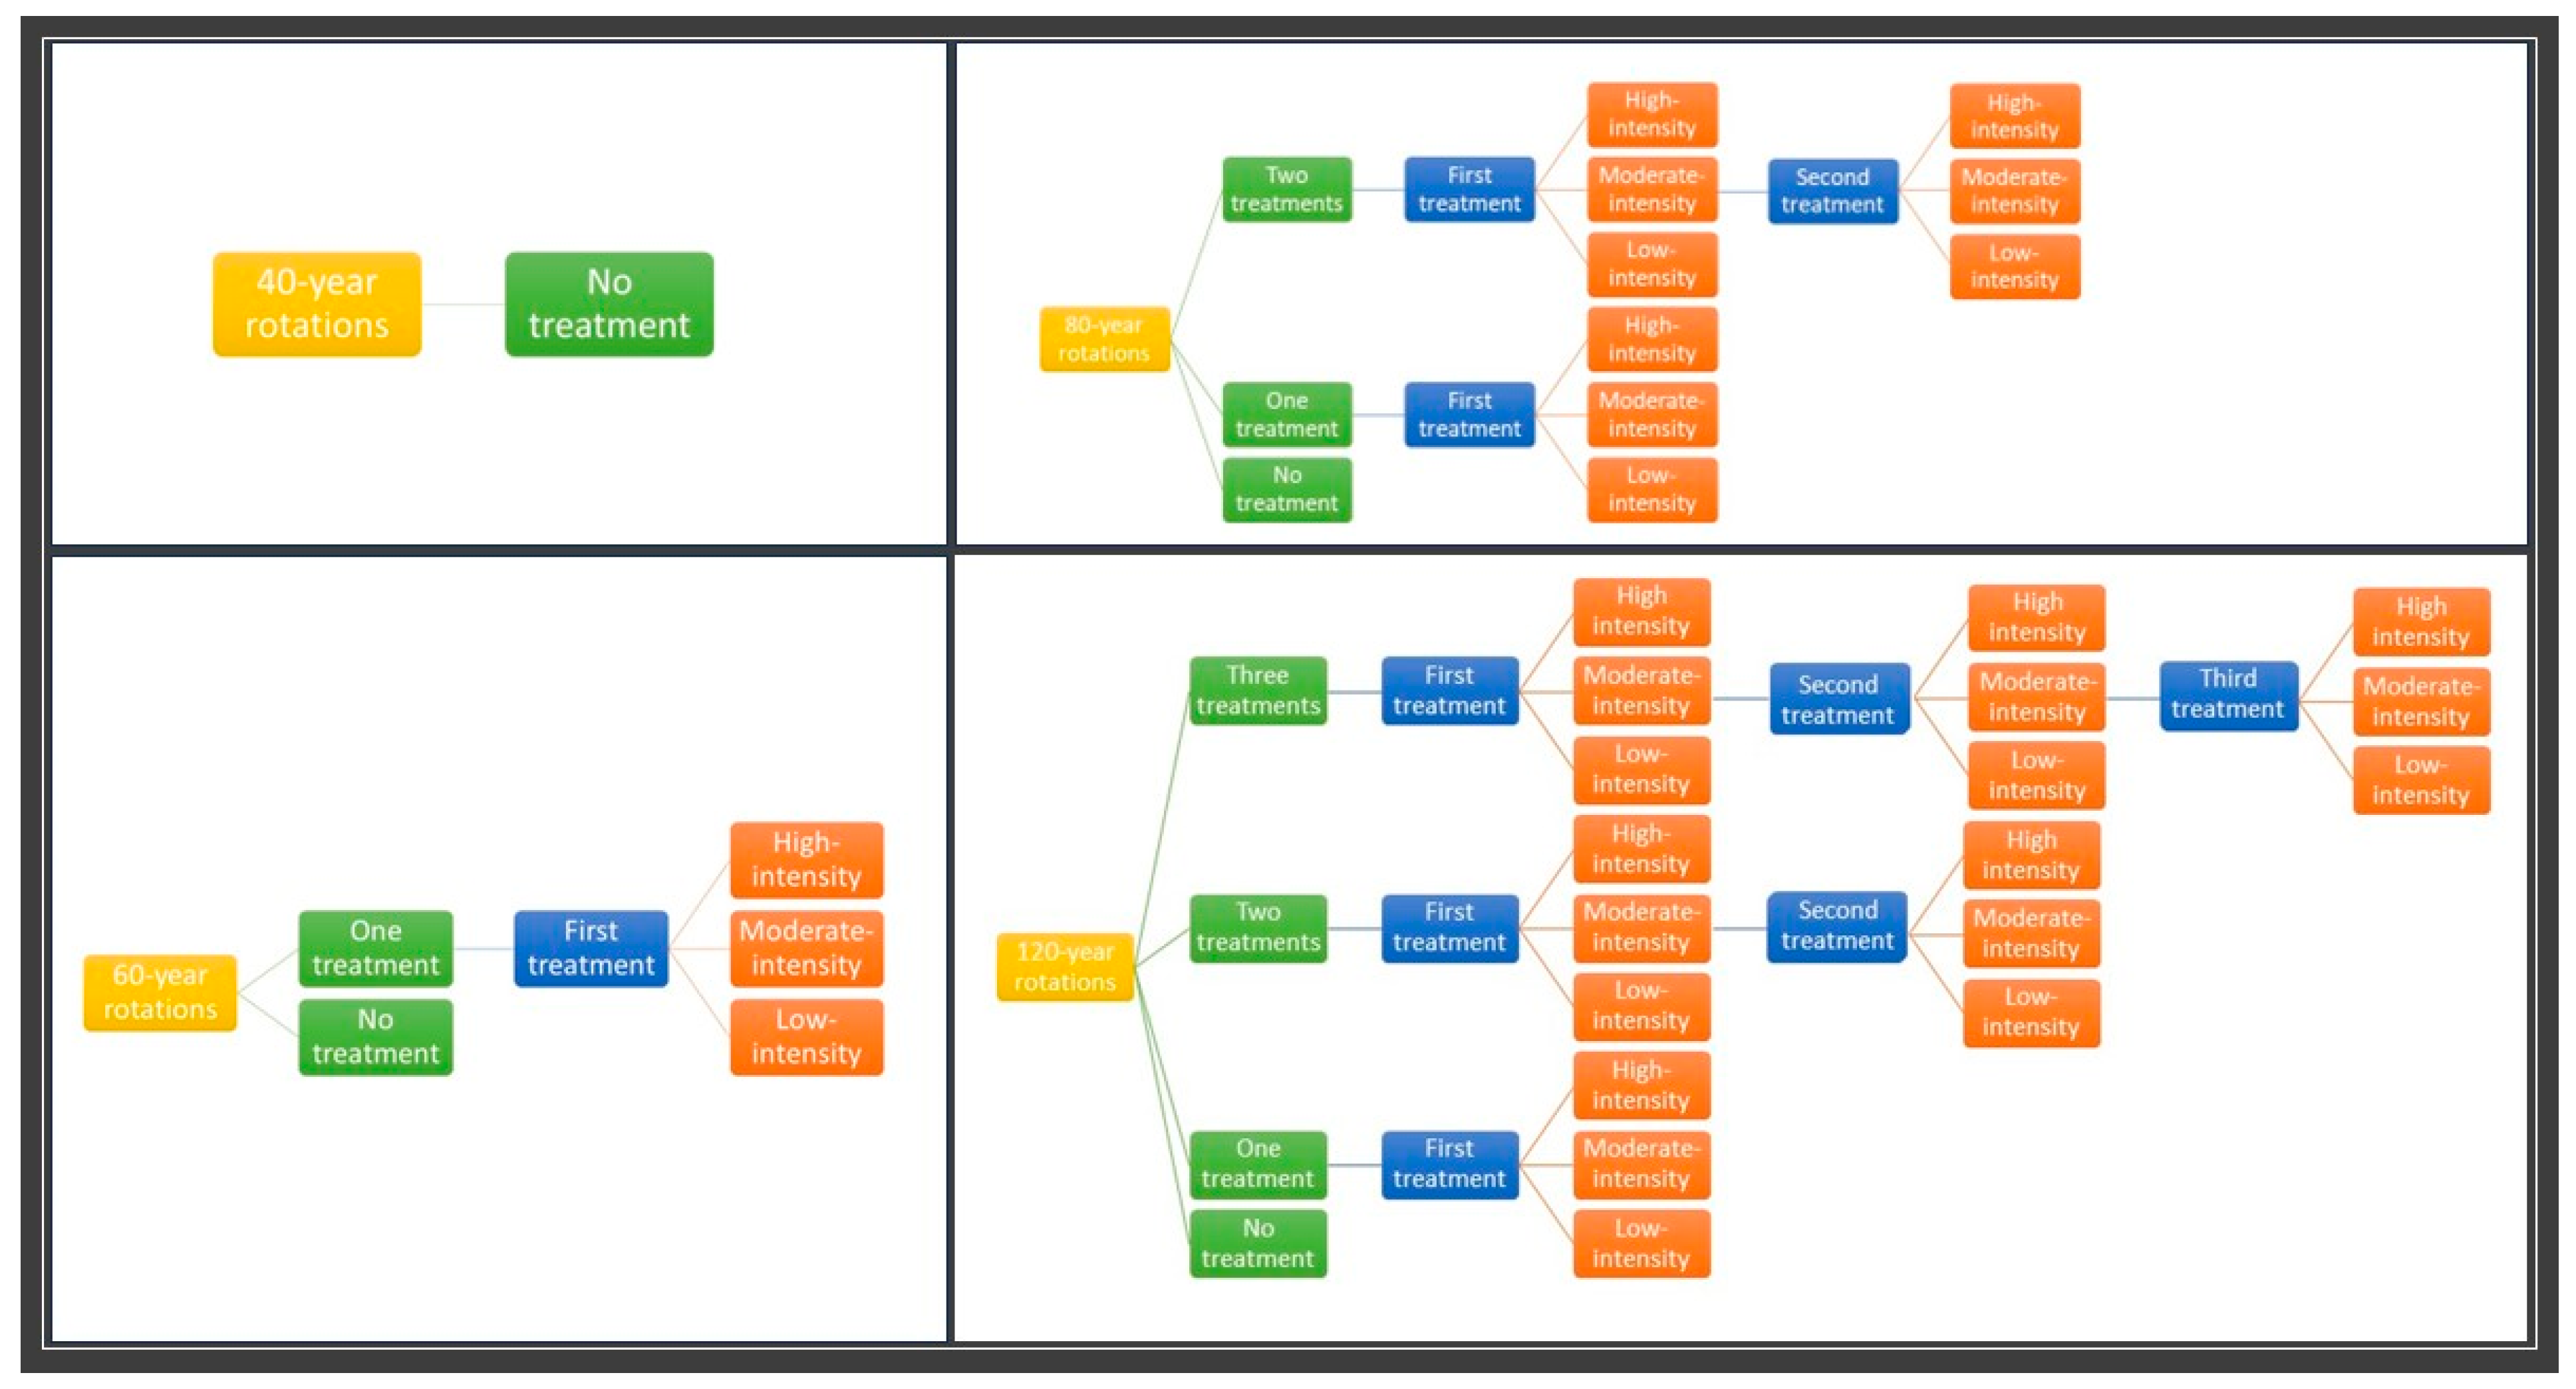
Due to timing limitations, thinning frequency’s impact on 40-year rotations for all site classes could not be assessed. The 5.08 cm minimum cut diameter for clearcuts allowed understory hardwoods and vegetation to accumulate in the absence of thinning treatments within the 40-year rotations. This hindered the growth of newly planted Douglas fir seedlings in subsequent rotations, resulting in decreased carbon sequestration compared to the first 40-year rotations. For example, site class III’s 40-year rotation scenario experienced an increase in bigleaf maple density from 133 to 348 trees per hectare (TPH) between the second and sixth rotations, leading to lower volume growth and carbon sequestration.
Without thinning treatments, the total carbon sequestration following the second rotation experienced a significant decline for all site classes under 60- and 80-year harvest cycles due to the steady increase in understory bigleaf maple density (Table 15 and Table 16). This adversely affected the growth of planted conifers throughout the remaining projection period. For example, without thinning treatments within 60-year rotations on-site class II, total sequestration over the last two harvest cycles was 144.37 MT C/ha less than the former two. This corresponded to an increase of 386 in bigleaf maple TPH from the start of the first rotation to the third. This corresponded to an increase in the density of bigleaf maple within the understory, which was estimated to increase by 386 TPH from the start of the first rotation to the third. Conversely, in the 60-year rotation scenario with one low-intensity treatment, the density of bigleaf maple remained constant at 188 trees per hectare during the initial decade of the third rotation, and within-rotation carbon sequestration was maintained over the four cycles.
We propose that the absence of thinning treatments in the projections of 60-year rotations for site classes III and IV is responsible for their underperformance compared to the longer rotation scenarios where thinning treatments are implemented. Lower site classes are already more susceptible to growth suppression caused by competing vegetation, making the negative effects of allowing understory hardwood accumulation more pronounced in these stands with lower productivity.
The projections of 80-year rotations for site classes I–III yielded the highest estimated total sequestration when two thinning treatments were applied (Table 16). Estimates of total sequestration were the lowest in the absence of thinning treatments for all three site classes, which resulted in the accumulation of understory vegetation and, inevitably, growth suppression in later rotations. For example, the site class I 80-year rotation projection with no thinning treatments saw an increase of 188 in bigleaf maple TPH from the first rotation to the third rotation. On the other hand, applying two treatments reduced bigleaf maple TPH by 62 over the same timeframe. The difference in density of understory hardwoods had a profound impact on above-ground carbon accumulation throughout the third rotation, with the two-treatment scenario sequestering a total of 1150.44 MT C/ha, while the control was projected to only sequester 429.96 MT C/ha from 2183 to 2263.
Applying a single low-intensity treatment at stand age 50 was also insufficient in controlling understory vegetation for the three site classes (Table 16). In site class I projections, for instance, the two-treatment scenario sequestered 1150.44 MT C/ha over the final rotation, while the one-treatment scenario only achieved 545.41 MT C/ha. We observed that the total cubic volume of bigleaf maple within the 0–5.1 cm DBH class was 1.9 m3/ha higher in the one-treatment scenario than in the two-treatment scenario. This increased competition had a significant impact on end-of-projection MAI, as the one-treatment scenario was estimated to have an MAI of 1.7 m3/ha/year while the two treatments were estimated to have an MAI of 41.4 m3/ha/year in 2263.
Our results suggest that 80-year rotations warrant two iterations of thinning because the extended rotation length allows for increased accumulation of understory hardwood vegetation. Therefore, more removals are necessary to optimize conifer growth, allowing maximum sequestration potential.
In 120-year rotations, the ideal frequency of thinning treatments varied among different productivity levels (Table 17). Site class I and II projections produced the highest sequestration estimates with two thinning treatments, whereas site classes III and IV favored three. We found that the differences in total sequestration can be attributed to the volume of large-diameter Douglas fir trees remaining after each 120-year rotation.
In the 120-year projections for site class I, we compared the stand and stock tables generated from two scenarios: one with three low-intensity thinning treatments applied at ages 60, 80, and 90, and the other with only two treatments applied at ages 60 and 80. At the end of the first rotation, the two-treatment scenarios had 237.1 m3/ha more volume than the three-treatment scenarios. This discrepancy in large diameter Douglas fir volume became even more pronounced at the end of the second rotation, with a total difference of approximately 400.9 m3/ha in favor of the two-treatment scenario. These findings suggest that an additional thinning treatment unnecessarily removed trees that could have continued to contribute to volume accumulation and above-ground live carbon sequestration if they had been retained within the stand.
Site class II displayed similar growth patterns in large-tree diameters across two and three-treatment scenarios. At the end of the first rotation, the total cubic volume of 71.1–91.4 cm DBH Douglas fir was 210.2 m3/ha greater in the two-treatment scenario compared to the three-treatment scenario. In both projections, Douglas fir trees transition into this larger diameter class during the growth cycle after the year 2123. However, the two-treatment scenario predicts that a total of 141 Douglas fir trees per hectare will surpass a 71.12 cm diameter at the end of the rotation, which is 22 more trees than what is predicted in the three-treatment scenario. Like site class I, the third thinning iteration in site class II hinders the growth of large trees and above-ground carbon accumulation.
Projections of site class III revealed that the growth of Douglas fir within the 24–28″ diameter class is greater when three treatments instead of two are applied. In the two-treatment scenario, the total cubic volume of 61.0–71.1 cm DBH Douglasfir trees decreases by 22.7 m3/ha from 2123 to 2133, but increases by 167.8 m3/ha/year when three treatments are applied instead. This corresponds to a higher estimated density of 0–5.1 cm DBH bigleaf maple trees in the stand under the two-treatment scenario compared to the three-treatment (126 vs. 26 TPH). Similarly, the applications of three thinning treatments in projections of site class IV also maintained a low density of 0–5.1 cm DBH bigleaf maple trees, which allowed for consistently higher MAI values and estimated sequestration compared to when only two were applied.
These findings from projections of two- and three-treatment scenarios for site classes III and IV suggest that to avoid the eventual stagnation or reduction in volume and above-ground live carbon of large-diameter Douglas fir trees during the later stages of 120-year rotations, it is essential to incorporate three thinning operations.
Conversely, stands characterized by higher productivity can achieve robust growth rates even under competitive pressures from understory vegetation, unlike stands with lower productivity. Consequently, fewer rounds of thinning are required to allow large-diameter trees to attain maximum within-rotation growth. For site classes I and II, implementing more treatments was shown to hinder long-term carbon accumulation by diminishing the overall sequestration capacity of the stand. However, it should be noted that a solitary thinning treatment was found to be insufficient to reduce stand density to a level that would enable maximum growth rates.
For all four site classes, projections with no thinning treatments produced the lowest estimates for all 120-year rotation scenarios. One thinning treatment was estimated to sequester less than the two- or three-treatment scenarios, except for site class II, where one thinning treatment performed better than the three-treatment projection.

4.4. Limitations of This Study

This study only utilized the ORGANON-pn variant of FVS to generate all predictions. Since FVS is an empirical model, it does not consider tree physiological processes and how the impact of changing site conditions will affect growth [21]. Using a process-based model to adjust growth and yield predictions based on environmental conditions would have allowed for investigating carbon sequestration under the different representative concentration pathways outlined in the Paris Agreement.
Another drawback of FVS includes the model’s assumptions about natural regeneration, which have been shown to impact empirical predictions significantly [46]. This was illustrated when we briefly examined the effect of turning off hardwood sprouting and excluding ingrowth for all stand ages besides the first and second decade after harvest. We observed that values of above-ground carbon became consistent across all rotations within the projection, but stand growth was severely impacted to a point where even the high-intensity thinning treatments could not be applied, as stands did not cross the SDI thresholds. Leaving hardwood sprouting on and having regeneration coming in throughout each 20-year interval between rotations did cause inconsistent growth but also yielded more realistic predictions for volume and carbon accumulation over the projection period. Note that ORGANON cannot predict individual tree growth of trees less than 1.37 m. in height [47]. FVS-pn uses its own set of equations to simulate small tree growth. Tree-list predictions generated by FVS are then fed into ORGANON after trees reach the size threshold [32].

4.5. Future Work

It would be beneficial to adjust this study’s predictions through a process-based model to adjust growth and yield equations to see how climate change will impact carbon sequestration. This will become increasingly relevant if projections are required to draft management actions over a long timeframe since the uncertainty in environmental conditions yields inherent uncertainty in forest growth simulation predictions.
This study only examined carbon within above-ground tree biomass. A more comprehensive picture of the total carbon within a stand or entire forest would be necessary to assess projections for each of the carbon pools present: below-ground, standing dead, dead and down wood, understory, leaf litter, and soil. While above-ground live tree biomass is the largest non-soil carbon pool, the soil pool is the largest by a significant margin. Predictions for these six pools would allow for an assessment of total stand carbon, instead of a snapshot of just carbon stored within standing tree biomass.
The gross sequestration of carbon was calculated through this study instead of the net, since the net sequestration would not reflect ecosystem carbon exchange since harvested wood stores a significant quantity of carbon over its lifetime. Estimating a more realistic value for carbon balance under harvesting and thinning operations would be beneficial to perform a life cycle analysis (LCA) of the amount of carbon stored within wood products, emissions from harvest and transportation, and how those quantities line up with the carbon sequestered throughout each rotation.

5. Conclusions

We found that site productivity was a major determinant of stand response to silvicultural treatments and harvest schedules in terms of static above-ground carbon values and rates of sequestration (Table 18). Growth increments of highly productive stands will begin to level off and decline at an earlier age than in stands with lower productivity. Since harvesting a stand right at maturity will sustain sequestration rates over an extended timeframe, high-productivity stands will benefit from shorter rotations. Extending the time between harvests would be advantageous for stands of lower productivity. Results from FVS projections of 240 years aligned with these principles: 60-year rotations were found to optimize total sequestration for site classes I and II, while sequestration of site classes III and IV performed best under 80- and 120-year rotations, respectively. For site classes I, II, and III under 80-year rotations, the highest estimates of total above-ground carbon sequestration over the 240-year projection period were produced when two low-intensity thinning treatments were applied. For 120-year rotations, site classes I and II exhibited the best performance when only two low intensity thinning treatments were applied.
On the other hand, site classes III and IV favored including one or more moderate-intensity treatments over three iterations of thinning within 120-year rotations. Overall, the performance of each management scenario was heavily influenced by the density of bigleaf maple. Without adequate control of understory hardwood vegetation, total sequestration within latter 40-, 60-, and 80-year rotations was projected to drop significantly. This information will be beneficial moving forward as forest managers assess trade-offs and attempt to identify treatment scenarios.

Author Contributions

Conceptualization and methodology, C.C. and S.F.; data curation and formal analysis, C.C.; investigation, C.C.; validation, H.T.; data curation, C.C., S.F. and H.T.; writing—original draft preparation, C.C.; writing—review and editing, S.F. and H.T.; supervision and project administration, S.F. and H.T. All authors have read and agreed to the published version of the manuscript.

Funding

Funding was provided by the College of Forestry.

Data Availability Statement

Data sets are not available online.

Conflicts of Interest

The authors declare no conflict of interest.

References

  1. Smith, J.E.; Domke, G.M.; Nichols, M.C.; Walters, B.F. Carbon stocks and stock change on federal forest lands of the United States. Ecosphere 2019, 10, e02637. [Google Scholar] [CrossRef]
  2. Law, B.E.; Waring, R.H. Carbon implications of current and future effects of drought, fire and management on Pacific Northwest forests. For. Ecol. Manag. 2015, 355, 4–14. [Google Scholar] [CrossRef]
  3. Christensen, G.A.; Gray, A.N.; Kuegler, O.; Yost, A.C. Oregon Forest Ecosystem Carbon Inventory: 2001–2016; PNW Agreement No. 18-C-CO-11261979-019; U.S. Department of Agriculture, Forest Service, Pacific Northwest Research Station: Portland, OR, USA, 2019.
  4. Hudak, A.T.; Fekety, P.A.; Bright, B.C.; Filippelli, S.K. A carbon monitoring system for mapping regional annual above-ground biomass across the northwestern, U.S.A. Environ. Res. Lett. 2020, accepted. [Google Scholar]
  5. Conway, F.D.L.; Wells, G.E. Timber in Oregon: History & Projected Trend; Oregon State University Extension Service, EM 8544; Oregon State University: Corvallis, OR, USA, 1993. [Google Scholar]
  6. Ali, S.; Khan, S.M.; Ahmad, Z.; Siddiq, Z.; Ullah, A.; Yoo, S.; Han, H.; Raposo, A. Carbon sequestration potential of different forest types in Pakistan and its role in regulating services for public health. Front. Public Health 2023, 10, 1064586. [Google Scholar] [CrossRef] [PubMed]
  7. Luocks, B. Forest Management for Small Landowners—Thinning; Chapter 11; Washington Farm Forestry Association: Chehalis, WA, USA, 2020; pp. 1–13. [Google Scholar]
  8. Weiskettel, A.R.; Hann, D.W.; Kershaw, J.A.; Vancley, J.K. Chapter 1 Introduction. In Forest Growth and Yield Modeling; Wiley-Blackwell: Hoboken, NJ, USA, 2011; pp. 1–13. [Google Scholar] [CrossRef]
  9. Weiskettel, A.R.; Hann, D.W.; Kershaw, J.A.; Vancley, J.K. Chapter 6 Components of Tree-List Models. In Forest Growth and Yield Modeling; Wiley-Blackwell: Hoboken, NJ, USA, 2011; pp. 85–114. [Google Scholar] [CrossRef]
  10. McArdle, R.E. The Yield of Douglas Fir in the Pacific Northwest; Technical Bulletin No. 201; United States Department of Agriculture, Forest Service, Pacific Northwest Forest and Range Experiment Station: Portland, OR, USA, 1949.
  11. Curtis, R.O. Extended Rotations and Culmination Age of Coast Douglas-Fir: Old Studies Speak to Current Issues; PNW-RP-485; Forest Service, Pacific Northwest Research Station: Portland, OR, USA, 1995.
  12. Lundmark, T.; Poudel, B.C.; Stål, G.; Nordin, A.; Sonesson, J. Carbon balance in production forestry in relation to rotation length. Can. J. For. Res. 2018, 48, 672–678. [Google Scholar] [CrossRef]
  13. Ruiz-Peinado, R.; Oviedo, J.A.B.; Senespleda, E.L.; Oviedo, F.B.; Río Gaztelurrutia, M. Forest management and carbon sequestration in the Mediterranean region: A review. For. Syst. 2017, 26, 10. [Google Scholar] [CrossRef]
  14. Lin, J.-C.; Chiu, C.-M.; Lin, Y.-J.; Liu, W.-Y. Thinning Effects on Biomass and Carbon Stock for Young Taiwania Plantations. Sci. Rep. 2018, 8, 3070. [Google Scholar] [CrossRef]
  15. Manetti, M.; Becagli, C.; Bertini, G.; Cantiani, P.; Marchi, M.; Pelleri, F.; Sansone, D.; Fabbio, G. The conversion into high forest of Turkey oak coppice stands: Methods, silviculture and perspectives. Biogeosciences For. 2020, 13, 309–317. [Google Scholar] [CrossRef]
  16. Sorensen, C.; Finkral, A.; Kolb, T.; Huang, C. Short- and long-term effects of thinning and prescribed fire on carbon stocks in ponderosa pine stands in northern Arizona. For. Ecol. Manag. 2010, 261, 460–472. [Google Scholar] [CrossRef]
  17. Reineke, L.H. Perfecting a stand-density index for even-aged forests. J. Agric. Res. 1993, 46, 627–638. [Google Scholar]
  18. Curtis, R.O. A Simple Index of Stand Density for Douglas-Fir. For. Sci. 1982, 28, 92–94. [Google Scholar]
  19. Drew, T.J.; Flewelling, J.W. Stand density management: An alternative approach and its application to Douglas-fir plantations. For. Sci. 1979, 25, 518–532. [Google Scholar]
  20. Hoover, C.M.; Rebain, S.A. Forest Carbon Estimation Using the Forest Vegetation Simulator: Seven Things You Need to Know; General Technical Report NRS-77; U.S. Department of Agriculture, Forest Service, Pacific Northwest Research Station: Portland, OR, USA, 2011.
  21. Crookston, N.L.; Dixon, G.E. The forest vegetation simulator: A review of its structure, content, and applications. Comput. Electron. Agric. 2005, 49, 60–80. [Google Scholar] [CrossRef]
  22. Kiernan, K. Chapter 9: Modeling Growth, Yield, and Site Index. In Natural Resources Biometrics; SUNY ESF, Open SUNY: Syracuse, NY, USA, 2014; ISBN 13-9781942341178. [Google Scholar]
  23. Forrester, D.I.; Hobi, M.L.; Mathys, A.S.; Stadelman, G.; Trotsiuk, V. Calibration of the process-based model 3-PG for major central European tree species. Eur. J. For. Res. 2021, 140, 847–868. [Google Scholar] [CrossRef]
  24. DeYoung, J. Overview of site index. In Forest Measurements: An Applied Approach; Open Oregon: Pendleton, OR, USA, 2016. [Google Scholar]
  25. Mitchell, S.R.; Harmon, M.E.; O’Connell, K.E.B. Carbon debt and carbon sequestration parity in forest bioenergy production. GCB Bioenergy 2012, 4, 818–827. [Google Scholar] [CrossRef]
  26. Molina-Valero, J.A.; Diéguez-Aranda, U.; Álvarez-González, J.G.; Castedo-Dorado, F.; Pérez-Cruzado, C. Assessing site form as an indicator of site quality in even-aged Pinus radiata D. Don stands in North-Western Spain. Ann. For. Sci. 2019, 76, 113. [Google Scholar] [CrossRef]
  27. Bjelanovic, I.; Comeau, P.G.; White, B. High Resolution Site Index Prediction in Boreal Forests Using Topographic and Wet Areas Mapping Attributes. Forests 2018, 9, 113. [Google Scholar] [CrossRef]
  28. Lam, T.Y.; Maguire, D.A. Thirteen-Year Height and Diameter Growth of Douglas-Fir Seedlings under Alternative Regeneration Cuts in Pacific Northwest. West. J. Appl. For. 2011, 26, 57–63. [Google Scholar] [CrossRef]
  29. Northwest Alliance for Computational Science & Engineering, Based at Oregon State University. PRISM 30-Year Normals [Data file]. 2023. Available online: https://prism.oregonstate.edu/normals/ (accessed on 1 May 2023).
  30. Bontemps, J.-D.; Bouriaud, O. Predictive approaches to forest site productivity: Recent trends, challenges and future perspectives. Forestry 2014, 87, 109–128. [Google Scholar] [CrossRef]
  31. King, J.E. Site Index Curves for Douglas-Fir in the Pacific Northwest; Weyerhauser For. Pap. No. 8; Weyerhauser Forestry Research Center: Centralia, WA, USA, 1966; 49p. [Google Scholar]
  32. Mateja, E.S. ORGANON Pacific Northwest (OP) Variant: Overview of the Forest Vegetation Simulator; Internal Rep; U.S. Department of Agriculture, Forest Service, Forest Management Service Center: Fort Collins, CO, USA, 2015; 84p.
  33. King, G.M.; Gugerli, F.; Fonti, P.; Frank, D.C. Tree growth response along an elevational gradient: Climate or genetics? Oecologia 2013, 173, 1587–1600. [Google Scholar] [CrossRef]
  34. Roberts, D.W.; Cooper, S.V. Concepts and techniques of vegetation mapping. In Land Classifications Based on Vegetation: Applications for Resource Management; USDA Forest Service GTR INT-257; USDA Forest Service: Ogden, UT, USA, 1989; pp. 90–96. [Google Scholar]
  35. Primicia, I.; Camarero, J.J.; Janda, P.; Čada, V.; Morrissey, R.C.; Trotsiuk, V.; Bače, R.; Teodosiu, M.; Svoboda, M. Age, competition, disturbance and elevation effects on tree and stand growth response of primary Picea abies forest to climate. For. Ecol. Manag. 2015, 354, 77–86. [Google Scholar] [CrossRef]
  36. Hann, D.W.; Bluhm, A.; Hibbs, D. Development Evaluation of the Tree-Level Equations Their Combined Stand-Level Behavior in the Red Alder Plantation Version of O.R.G.A.N.O.N; Forest Biometrics Research Note 1. Forest Biometrics Research Paper 1; Oregon State University, Department of Forest Engineering, Resources, and Management: Corvallis, OR, USA, 2011. [Google Scholar]
  37. Pretzsch, H. Density and growth of forest stands revisited. Effect of the temporal scale of observation, site quality, and thinning. For. Ecol. Manag. 2020, 460, 117879. [Google Scholar] [CrossRef]
  38. Lowell, E.C.; Maguire, D.A.; Briggs, D.G.; Turnblom, E.C.; Jayawickrama, K.J.S.; Bryce, J. Effects of Silviculture and Genetics on Branch/Knot Attributes of Coastal Pacific Northwest Douglas-Fir and Implications for Wood Quality—A Synthesis. Forests 2014, 5, 1717–1736. [Google Scholar] [CrossRef]
  39. Montgomery, D.C. Design and Analysis of Experiments; John Wiley & Sons: Hoboken, NJ, USA, 2017; Chapter 1; pp. 4–5. [Google Scholar]
  40. Fletcher, R.; Johnson, B.; Blanchard, G.; Emmingham, B.; Hayes, J.; Johnson, D.; Johnson, N.; Lysne, D.; Murphy, G.; Newton, M.; et al. McDonald-Dunn Forest Plan; Oregon State Universit: Corvallis, OR, USA, 2005; pp. 5–67. [Google Scholar]
  41. Fitzgerald, S.; College of Forestry, Oregon State University, Corvallis, OR, USA. Personal communication, 15 January 2022.
  42. Morgan, C.; College of Forestry, Oregon State University, Corvallis, OR, USA. Personal communication, 23 July 2022.
  43. Zell, J.; Rohner, B.; Thürig, E.; Stadelmann, G. Modeling ingrowth for empirical forest prediction systems. For. Ecol. Manag. 2018, 433, 771–779. [Google Scholar] [CrossRef]
  44. Bansal, S.; Harrington, C.; St Clair, B. Predicting Douglas-Fir’s Response to a Warming Climate; U.S. Department of Agriculture, Forest Service: Portland, OR, USA, 2015.
  45. Hann, D.W.; Marshall, D.D.; Hanus, M.L. Equations for Predicting Height to Crown Base, Five-Year Diameter Growth Rate, Five Year Height Growth Rate, Five Year Mortality Rate and Maximum Size Density Trajectory for Douglas Fir and Western Hemlock in the Coastal Region of the Pacific Northwest; Research Contribution 40; Forest Research Lab., Oregon State University: Corvallis, OR, USA, 2003; 83p. [Google Scholar]
  46. Robinson, D.C.E.; Beukema, S.J. Through a glass darkly- comparing VDDT and FVS. In Proceedings of the First Landscape State-and-Transition Modeling Conference, Ortland, OR, USA, 14–16 June 2011; Kerns, B.K., Shlisky, A.J., Daniel, C.J., Eds.; PNW-GTR-869. U.S. Department of Agriculture, Forest Service: Portland, OR, USA, 2011. [Google Scholar]
  47. Robinson, A.P.; Monserud, R.A. Criteria for comparing adaptability of forest growth models. For. Ecol. Manag. 2003, 172, 53–67. [Google Scholar] [CrossRef]
Figure 1. Aerial imagery of the McDonald–Dunn Research Forest displaying the forest boundary (indicated with red boundary line) and location of plots measured across 2019 and 2020.
Forests 14 02090 g001
Figure 2. Suites of thinning treatments available for each of the four rotation ages. Longer rotations allowed for a greater number of thinning treatments between harvests, thus exponentially increasing the number of possible thinning regimes since each could be designated as either high-, moderate-, or low-intensity, which were defined by the residual density of trees within the stand post-harvest.
Forests 14 02090 g002
Table 1. Quantity and species composition of natural regeneration within 20-year age classes in the McDonald–Dunn Research Forest. Values reflect the number of trees per hectare by species. Age class averages across stands of all site classes calculated for ingrowth.
Stand AgeNatural Regeneration
Douglas FirGrand FirBigleaf Maple
0–1902525
20–3902549
40–5904974
60–79257425
80–9902525
100–11902549
120–1390250
Table 2. Thinning regimes associated with the highest estimated sequestration (MT C/ha) for each of the four rotation ages over the 240-year projection period for site class I. Harvesting the stand at age 60 after applying a low-intensity thin (residual RDI of 45%) at age 40 produced the highest estimates of total carbon sequestration. This projection outperformed the six 40-year rotation, the three 80-year rotation, and the two 120-year rotation scenarios.
Rotation AgeTreatmentGross MT C/ha
40No thin751.64
60Low-intensity thin at age 402024.03
80Low-intensity thin at age 50 + low-intensity thin at age 601954.09
120Low intensity-thin at age 60 + low-intensity thin at age 801947.14
Table 3. Total above-ground live carbon (MT C/ha) sequestered over the 240-year projection period using different thinning intensities within 60-, 80-, and 120-year rotations for site class I. Results presented below were obtained from projections in which treatments were applied at the frequency and ages, producing the most favorable results out of all possible scenarios for that rotation age and intensity regime. For 60-year rotations, one thin was applied at stand age 40. For 80-year rotations, two thins were applied at stand ages 50 and 60. For 120-year rotations, two thins were applied at stand ages 60 and 80.
Rotation AgeLow IntensityModerate IntensityHigh Intensity
602024.031871.151578.61
801954.091753.461596.76
1201947.361484.681357.13
Table 4. Total above-ground live carbon (MT C/ha) sequestered over the 240-year projection period under different thinning frequencies within 60-, 80-, and 120-year rotations for site class I. All thinning treatments were specified as low-intensity.
Rotation AgeNo ThinOne ThinTwo ThinsThree Thins
60769.352024.03
80867.991344.801954.09-
1201289.431711.091947.141907.24
Table 5. Thinning regimes associated with the highest estimated sequestration (MT C/ha) for each of the four rotation ages over the 240-year projection period for site class II. Harvesting the stand at age 60 after applying a low-intensity thin (residual RDI of 45%) at age 40 produced the highest estimate of total sequestration.
Rotation AgeTreatmentGross MT C/ha
40No thin622.97
60Low-intensity thin at age 402039.05
80Low-intensity thin at age 50 + low-intensity thin at age 601773.18
120Moderate-intensity thin at age 60 + low-intensity thin at age 801690.91
Table 6. Total above-ground live carbon (MT C/ha) sequestered over the 240-year projection period using different thinning intensities within 60-, 80-, and 120-year rotations for site class II. One thinning treatment was applied at stand age of 40 within 60-year rotations. The 80-year rotation scenarios included two treatments applied at stand ages 50 and 60. The 120-year rotation scenarios included two treatments applied at ages 60 and 80.
Rotation AgeLow IntensityModerate + Low IntensityModerate IntensityHigh Intensity
602039.05-1714.451400.84
801773.181705.711560.001438.50
1201273.291690.911511.351337.85
Table 7. Above-ground carbon sequestration (MT C/ha) over 240-year projections with different thinning frequencies for site class II in 60-, 80-, and 120-year rotations. One-treatment scenarios included low-intensity thinning. Two- and three-treatment scenarios involved a combination of low- and moderate-intensity thinning.
Rotation AgeNo ThinOne ThinTwo ThinsThree Thins
60515.372039.05--
80789.751087.221773.18-
120804.101590.261690.911556.86
Table 8. Thinning regimes associated with the highest estimated sequestration (MT C/ha) over 240 years for each of the four rotation ages over the 240-year projection period for site class III.
Rotation AgeTreatmentGross MT C/ha
40No thin429.29
60No thin481.52
80Low-intensity thin at age 50 + low-intensity thin at age 601375.73
120Moderate-intensity thin at 50 + low-intensity thins at ages 60 & 801263.42
Table 9. Total above-ground live carbon (MT C/ha) sequestered over the 240-year projection period using different thinning intensities within 80- and 120-year rotations for site class III. The 80-year rotation scenarios included two treatments at ages 50 and 60, while the 120-year rotation scenarios included three treatments at ages 50, 60, and 80.
Rotation AgeLow IntensityModerate + Low IntensityModerate IntensityHigh Intensity
801375.731300.861239.661105.83
1201209.851263.421094.40917.75
Table 10. Total above-ground live carbon (MT C/ha) sequestered over the 240-year projection period under different thinning frequencies within 80- and 120-year rotations for site class III. All treatments applied within 80-year rotations were specified as low-intensity. For the projections of 120-year rotations, the one-treatment scenario was specified as moderate-intensity, while the two- and three-treatment scenarios included a combination of low- and moderate-intensity treatments.
Rotation AgeNo ThinOne ThinTwo ThinsThree Thins
80607.05860.811375.73-
120814.861084.091181.641263.42
Table 11. Thinning regimes associated with the highest estimated sequestration (MT C/ha) over 240 years for each of the four rotation ages over the 240-year projection period for site class IV. Applying thinning treatments within 120-year rotations was only possible since site class IV did not achieve a 9.5″ QMD until after stand age 60.
Rotation AgeTreatmentGross MT C/ha
40No thin278.19
60No thin205.34
80No thin510.21
120Moderate-intensity thins at ages 70, 80, and 901032.53
Table 12. Total above-ground live carbon (MT C/ha) sequestered over the 240-year projection period using different thinning intensities within 120-year rotations for site class IV. Each projection included a total of three thinning treatments applied at stand ages 70, 80, and 90.
Low IntensityLow + Moderate IntensityModerate IntensityHigh Intensity
670.941004.511032.53818.00
Table 13. Total above-ground live carbon (MT C/ha) sequestered over the 240-year projection period under different thinning frequencies within 120-year rotations for site class IV. All treatments were specified as moderate-intensity.
No ThinOne ThinTwo ThinsThree Thins
618.93904.531010.561032.53
Table 14. Summary table of optimal thinning intensities for each site class and rotation age. A column is not included for 40-year rotations since applying any thinning treatments within that timeframe was impossible given constraints.
Site Class 60-Year Rotations80-Year Rotations120-Year Rotations
ILow intensityLow intensity + low intensityLow intensity + low intensity
IILow intensityLow intensity + low intensityModerate intensity + low intensity
III-Low intensity + low intensityModerate intensity + low intensity + low intensity
IV--Moderate intensity + moderate intensity + moderate intensity
Table 15. Impact of thinning frequency within 60-year rotations on sequestration (MT C/ha). For site classes I and II, projections with one iteration of thinning had the treatment specified as low-intensity and initiated at stand age 40.
Site ClassNo ThinningOne Treatment
I769.352024.03
II515.592039.05
III481.52
IV205.34
Table 16. Impact of thinning frequency within 80-year rotations on sequestration (MT C/ha). Projections with one iteration of thinning were specified as low-intensity and initiated at stand age 50. Projections with two thinning iterations were specified as low-intensity and initiated at stand ages 50 and 60.
Site ClassNo ThinningOne TreatmentTwo Treatments
I867.991344.801954.09
II789.751087.221773.18
III607.05860.811375.73
IV510.21
Table 17. Impact of thinning frequency within 120-year rotations on sequestration (MT C/ha). Results presented below were obtained from projections in which treatments were applied at the intensities and stand ages, producing the most favorable results.
Site Class No ThinningOne TreatmentTwo TreatmentsThree Treatments
I1289.431711.091947.361907.24
II804.101590.261690.911556.86
III814.861084.091181.821263.42
IV618.93904.531010.561032.53
Table 18. Summary table of optimal thinning frequencies by rotation age and site class. All treatments applied within 60- or 80-year rotations were specified as low-intensity. Treatments applied within 120-year rotations were specified as either low or moderate. Site class I favored low intensity exclusively, site class IV favored moderate intensity exclusively, and site classes II and III favored a combination of intensities.
Site Class40-Year Rotations60-Year Rotations80-Year Rotations120-Year Rotations
I One thinTwo thinsTwo thins
II One thinTwo thinsTwo thins
III Two thinsThree thins
IV Three thins
Disclaimer/Publisher’s Note: The statements, opinions and data contained in all publications are solely those of the individual author(s) and contributor(s) and not of MDPI and/or the editor(s). MDPI and/or the editor(s) disclaim responsibility for any injury to people or property resulting from any ideas, methods, instructions or products referred to in the content.

