Article

Thinning Promotes Soil Phosphorus Bioavailability in Short-Rotation and High-Density Eucalyptus grandis × E. urophylla Coppice Plantation in Guangxi, Southern China

1
Guangxi Colleges and Universities Key Laboratory for Cultivation and Utilization of Subtropical Forest Plantation, College of Forestry, Guangxi University, Nanning 530004, China
2
Key Laboratory of National Forestry and Grassland Administration on Cultivation of Fast-Growing Timber in Central South China, College of Forestry, Guangxi University, Nanning 530004, China
*
Author to whom correspondence should be addressed.
Forests 2023, 14(10), 2067; https://doi.org/10.3390/f14102067
Submission received: 22 September 2023 / Revised: 10 October 2023 / Accepted: 11 October 2023 / Published: 16 October 2023
(This article belongs to the Special Issue Forest Plant, Soil, Microorganisms and Their Interactions)

Abstract

:
Thinning can improve soil nutrient supply, but the effects of thinning on soil phosphorus (P) contents and bioavailable mechanisms in high-density and short-rotation Eucalyptus coppice forests are not well reported. Therefore, we conducted five intensities of thinning treatments, which were 83% (283 tree ha−1, T1), 66% (566 tree ha−1, T2), 50% (833 tree ha−1, T3), 33% (1116 tree ha−1, T4), and 0% (1665 tree ha−1) in a 2nd 6-year-old E. grandis × E. urophylla coppice plantation with 8 years as a rotation, investigated soil nutrient contents, microbial biomass, and extracellular enzyme activities of 0–20 and 20–40 cm soil layers after two years of thinning, and analyzed the relationship between available phosphorus (AP) and other indicators. The results showed that soil total phosphorus (TP) contents in 2nd Eucalyptus coppice plantations were lower than in native forest ecosystems, but T1 significantly increased (p < 0.05) TP by 81.42% compared to CK of 0–20 cm, whereas T2 and T3 improved available phosphorus (AP) by 86.87%–212.86% compared to CK. However, soil organic carbon (SOC), dissolved organic carbon (DOC), total nitrogen (TN), and alkaline hydrolysable nitrogen (AN) were not significantly different (p < 0.05) among all treatments. According to the analysis, soil TP contents were significantly positively related (p < 0.001) to SOC; soil total nutrients and DOC contents had the highest standardized total effect on AP; meanwhile, the quotient of microbial biomass directly conducted soil AP contents. These results highlighted that thinning can be used to alleviate soil P shortages by promoting multinutrient and biological cycles in Eucalyptus coppice forests.

1. Introduction

In China, the Guangxi area is a major Eucalyptus plantation area, with approximately 4.5 million hectares accounting for 45% of the total Eucalyptus plantation area in this country [1]. To obtain the maximum profit, the high-density (over 1110 tree ha−1) and short-rotation (5–10 years) management modes have become increasingly common in Eucalyptus plantation management in Guangxi. This plantation ecosystem suffers severe impacts from human activities and then leads to weaker ecological and social functions than native forest ecosystems [2], such as a decrease in the diversity of understory plant communities, degradation of aggregates, nutrient losses, etc. [3,4,5,6]. Meanwhile, some improved Eucalyptus species, which are usually used in plantations, require 2–4 times more nutrients than what is returned by litter in this mode [7,8,9]. Therefore, the contradiction between declining soil fertility and the rapid growth of Eucalyptus is fiercer after the intraspecific competition starts in this silvicultural system, suggesting some stand density control technologies are necessary in high-density Eucalyptus plantations.
Thinning decreases stand and canopy densities and can (1) relieve nutrients and space competition in high-density plantations, (2) promote plant regeneration, resumption, and litter input [10,11], and (3) ultimately benefit soil nutrient accumulation, cycling, and bioavailability [12,13,14,15]. In a previous study, the functions of thinning in sustainable management of Eucalyptus plantations were discussed, which included improved fertilizer utilization efficiency, increased stand size classes, and enhanced productivity after thinning to mitigate land degradation [16]. However, most thinning research has focused on coniferous timber plantations, such as Chinese fir (Cunninghamia lanceolata) and Masson pine (Pinus massoniana) in southern China [17,18]. As a result, it remains unclear how thinning affects the soil nutrient characteristics and biochemical cycles in high-density and short-rotation Eucalyptus plantations.
In low-latitude regions, soil bioavailable P is relatively scarce due to leach and inorganic P adsorbed by Fe and Al ions, which makes P often the limiting element for the structure and function of forest ecosystems in tropical and subtropical areas [19,20,21]. Although P fertilizer input is a common method for supplying soil P in short-rotation plantations, the bioavailable P fraction fixed in acid soil is the main reason for low plant availability after fertilizing [22,23]. This implies that soil TP may be sufficient, but very low bioavailability limits P utilization in plantations (including Eucalyptus plantations) in the acid soil area of southern China. Plants mainly utilize some low molecular organic P and inorganic P fractions, which are connected with microbial biomass turnover and originate from phosphatase hydrolysis, respectively [23,24,25]. A former report found microorganisms that live in low-TP conditions had a stronger ability to capture P from stable minerals [26]. These P fractions are immobilized in microbial biomass and absorbed by mycorrhizal-root associations during the growth-death cycle of microbes [27,28,29]. Meanwhile, microorganisms and plant fine root exude phosphatase enzymes for hydrolysis of stable organic P fractions; however, their bioactivity and efficiency cannot be maintained for a long time [23,24]. The synthesis and exudation of phosphate enzymes must be continued for microbes and plants to absorb inorganic P. These processes consume a lot of carbon (C), nitrogen (N), and other mineral nutrients [30] and are impacted by forest environmental changes, soil physico-chemical properties, and human activities [24,31], which suggests that some silviculture actions can influence soil P plant availability and available mechanisms [15,32,33]. Therefore, it is meaningful to study the effects of thinning on soil P bioavailability and cycling in high-density and short-rotation Eucalyptus plantations. Such research could potentially inhibit soil P deposition, increase the utilization efficiency of P fertilizers, and reduce pollution during production, shipping, and use of P fertilizers.
Eucalyptus grandis × E. urophylla is one of the most common species in short-rotation and high-density Eucalyptus plantations in the Guangxi Zhuang Autonomous Region of China. It is usually regenerated by the coppice method, which can lead to land degradation [34]. In this study, an E. grandis × E. urophylla plantation with an initial density of 1665 tree ha−1 and 8 years of rotation was used as an experimental stand. We applied different thinning intensity treatments to a 6-year-old of the 2nd generation that was regenerated by coppice after clear cutting conducted on the 1st generation. Two years late (the age of the stands was 8 years old; it is the end of the second rotation), we collected soil samples from the 0–20 and 20–40 cm layers and measured soil nutrient content, microbial biomass, and enzyme activity. Specifically, two research questions were addressed: (1) Does thinning increase soil nutrient content and bioavailability, particularly P? (2) Which indicators play a significant role in soil P plant availability turnover in E. grandis × E. urophylla coppice forests? To answer these questions, three hypotheses were developed: Hypothesis 1: Thinning improves soil AP content in E. grandis × E. urophylla coppice forests. Hypothesis 2: Microbial biomass phosphorus (MBP) is the most important factor affecting AP content in E. grandis × E. urophylla coppice forests. Hypothesis 3: Microbial biomass turnover is more important than enzyme hydrolysis for soil P bioavailability in E. grandis × E. urophylla coppice forests. This study aimed to provide insights into the effects of thinning on soil nutrient dynamics and to identify key indicators of soil P bioavailable turnover in E. grandis × E. urophylla coppice forests.

2. Materials and Methods
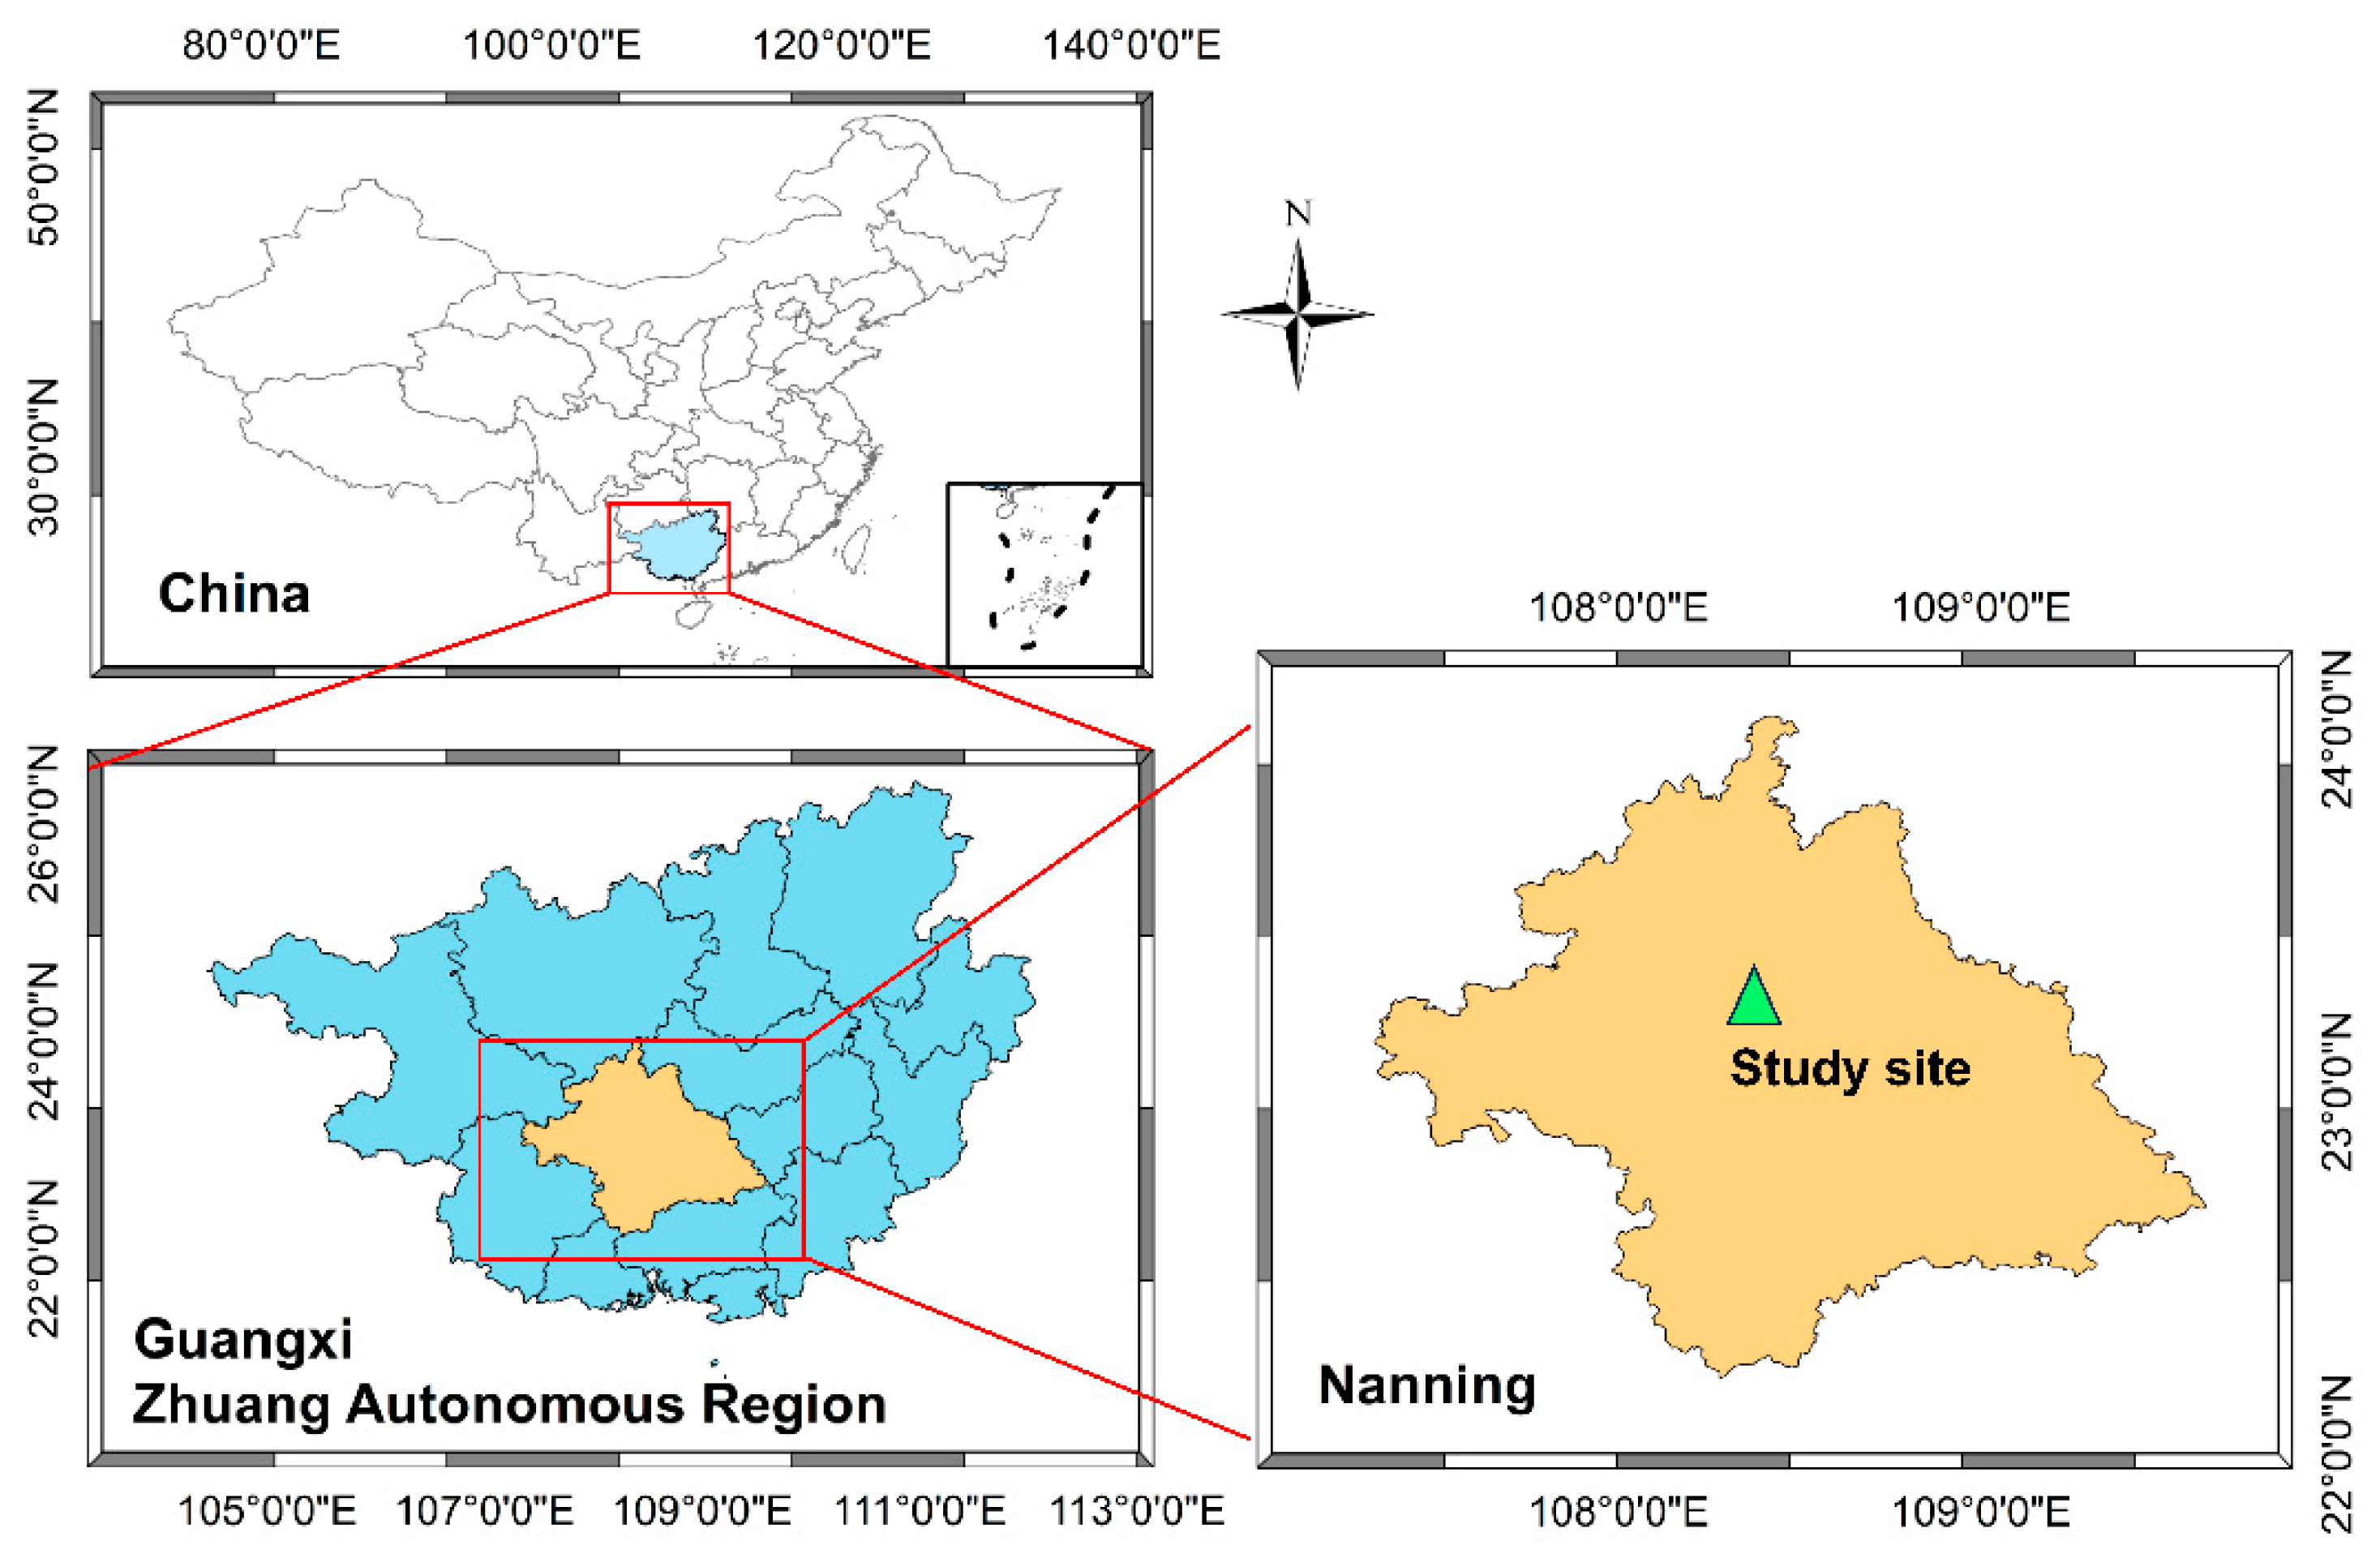
2.1. Study Site

The study was conducted at Qipo Forest Farm (108°43′–108°44′ E, 23°37′–23°38′ N) in Nanning city, Guangxi Zhuang Autonomous Region, within the southern subtropical hill area of China (Figure 1). The altitude of the study site is approximately 300 m. The climate in this region is subtropical monsoon, with annual mean, maximum, and minimum temperatures of 21.4 °C, 39.0 °C, and −2.2 °C, respectively. The annual total precipitation is 1300 mm and concentrates in the summer, with approximately 300 days of accumulated temperature over 10 °C per year and an annual total accumulated temperature of about 7200 °C. The dominant soil type in the area is Latosol, with a pH range of about 4.0–5.0, developed from granite or milestone, and a depth of about 80–90 cm. The understory plant community is composed of several common species, including Miscanthus floridulus, Microlepia hancei, Pteris semipinnata, Rubus cochinchinensis, and Maesa japonica.

2.2. Experimental Design

The high density and short rotation E. urophylla × E. grandis DH32-28 experimental plantation located on a sloping land of sedimentary hill with an initial density of 1665 trees ha−1 and 8 years as a rotation. This forest, 1st generation, was planted by saplings in 2005, and all of the timber was harvested by clear cutting in April 2013. Some silvicultural practices were used to regenerate: (1) stumps were protected by spraying disinfector to promote coppice budding when harvesting was complete; (2) after two months, the 3–4 stronger coppices were retained, which budded from different sides on a stump with similar height and diameter; meanwhile, other coppices were removed; and (3) two months later again, we selected the best one, which would be cultivated to 2nd stand, from the retained coppices and removed others on every stump. In every August during 2013–2015, 0.5 kg of NPK compound fertilizer was applied to every tree at four spots around the trunk; the distance from the fertilizing spots to the trunk was about 30 cm. In March 2019, we established fifteen 400 m2 (20 × 20 m) plots with similar growth conditions, slop aspect, slop gradient, and understory plant community at this 2nd Eucalyptus coppice (Table 1). The distance between each single plot was 30 m. Five thinning treatments with different intensities were assigned to fifteen plots through a completely randomized design. Each thinning-intensity treatment was replicated three times. The 5 thinning intensities were 83% (T1), 66% (T2), 50% (T3), 33% (T4), and 0% (CK), and the stand densities were 283, 566, 833, 1116, and 1665 tree ha−1 after thinning, respectively (Table 1). We selectively thinned weakened trees under the canopy, and no logging slash, including root, bark, branch, and leaf, was removed. After thinning, no further silviculture activity was conducted, and a 10 m buffer zone was established around every plot.

2.3. Sampling and Analysis

In September 2021, we measured the growth characteristics of Eucalyptus trees and canopy densities at every plot (Table 1). Simultaneously, we set nine sample dots following an “S” pattern in the middle of planting lines within each plot according to the method outlined by Dang et al. [11]. We carefully removed the litter from the soil surface and subsequently collected one soil sample from each designated point in both the 0–20 and 20–40 cm layers. The nine soil cores within a plot and layer were mixed together to create a composite sample. A total of 30 mixed soil composites (5 treatments × 3 plots of a treatment × 2 layers) were stored in 4 °C boxes with dry ice. In the laboratory, we fully mixed all the soil composites again, removed any residual debris and litter, passed them through a 2 mm griddle, and then divided them into two sub-amples. One sub-sample was processed by air drying, grinding, and sieving using a 0.25 mm griddle for measuring abiotic indicators. The other sub-sample was stored at 4 °C in a refrigerator for biotic indicator determination.
SOC and TN were measured using an elemental analyzer (Vario EL III; Elementar, Frankfurt, Germany) [35]. Additionally, AN was determined using the previous method described by Wang et al. [36]. The soil samples were digested and processed by 0.5 mol NaOH, steam distillation in succession, and then titration with boric acid. To measure TP, the soil sample was digested with HClO4-H2SO4 mixed liquor, and the supernatant was absorbed and analyzed using the molybdenum blue colorimetric method at 880 mm (UV-3600i Plus, SHIMADZU, Hadano, Japan) [37,38]. Furthermore, microbial biomass carbon, nitrogen, and phosphorus (MBC, MBN, and MBP) were analyzed using the chloroform fumigation-extraction method [37]. The soil samples were incubated in darkness in an incubator (MJ-250-I, Jiecheng Experimental Instrument CO, LTD, Shanghai, China) for 48 h and then fumigated and extracted before being extracted with 0.5 mol L−1 K2SO4 for MBC and MBN and with Bray-1 (0.03 mol L−1 NH4F-0.025 mol L−1 HCL) for MBP [39]. The oscillator shaking method (WSZ-100AR, Yiheng, Shanghai, China) was used during extraction. The C and N contents in the supernatant were measured using a TOC/TN analyzer (Multi N/C 3100, Analytic Jena, Jena, Germany), and the P content was analyzed using the molybdenum blue colorimetric method (UV-3600i Plus, SHIMADZU, Japan). DOC and AP were measured as the C and P contents of the leaching solutions before fumigation, respectively [35]. A universal conversion factor of 0.45, 0.54, and 0.4 was used to calculate MBC, MBN, and MBP, respectively [40]. The quotients of microbial biomass carbon, nitrogen, and phosphorus (qMBC, qMBN, and qMBP) are expressed as the ratios of MBC:SOC, MBN:TN, and MBP:TP, respectively. The activities of soil β-glucosidase (BG) and acid phosphatase (ACP) were determined using the microplate technique as previously described by Saiya-Cork et al. [41]. Whereas the previous method described by Fei et al. was used to measure urease (URE) activity [42], it was presented by the ammoniacal N content of 5 g of fresh soil dissolved in 10 mL of urea solution (10%, w/w) and 10 mL of citrate buffer (pH = 6.7), incubated at 38 °C under dark conditions for 24 h.

2.4. Statistical Analysis

SPSS 18.0 (IBM, Chicago, IL, USA) was used for statistical analysis. A one-way of variance (ANOVA) was conducted to test statistical significance among treatments, followed by Duncan’s multiple range test (p < 0.05) for various comparisons. The data were presented as mean ± standard difference. Meanwhile, the Pearson correlation was analyzed by this software. The ggplot2 in R version 4.2.1 and the R Studio 2022.07.0 interface were used for regression analysis. Based on the results of Pearson correlation, partial least squares path modeling (PLS-PM) was conducted using the pls-pm package to explore the direct or indirect connections of soil nutrients (including SOC, DOC, TN, and TP), enzymes of C and N cycling (including BG and URE), quotients of microbial biomass (including qMBC and qMBP), ACP, MBP, and AP [35,43]. Finally, we used Origin Pro 2022 (Originlab, Northampton, MA, USA) and Microsoft PowerPoint 2016 (Microsoft, Redmond, WA, USA) for drawing figures.

3. Results

3.1. Response of Soil Nutrients Content to Thinning Intensity in E. urophylla × E. grandis Coppice Stands

The soil nutrient content of different thinning treatments from different soil layers is presented in Table 2. Soil total nutrient content (SOC, TN, TP, and AN) increased and then decreased with increasing thinning intensity at the 0–20 cm layer. However, no significant differences (p < 0.05) were observed for these nutrients between the different thinned E. urophylla × E. grandis coppice stands in two layers. Soil TP in the 0–20 cm layer was significantly higher (p < 0.05) in the T1 treatment (81.41%) compared to the CK treatment, as well as in the T4 and T3 treatments (92.26%) (Table 2), but there were no significant differences (p < 0.05) observed in the 20–40 cm layer among the five treatments. This suggests that the stronger thinning intensities benefited the soil P content in the surface layer. In the 0–20 cm soil layer, the trend of AP content was observed as follows: T2 > T3 > T1 > CK > T4. Both T2 and T3 exhibited significantly higher (p < 0.05) AP levels than CK by 130.56% and 99.36%, respectively (Table 2). Similarly, these two treatments, T2 and T3, displayed significantly higher (p < 0.05) AP contents than T4 by 132.47% and 101.30%, respectively (Table 2). In the 20–40 cm layer, the trend was T2 > T1 > T3 > T4 > CK, with significantly (p < 0.05) increased soil AP content in the T2 treatment compared to the T4 and CK treatments by 142.31% and 215.00%, respectively (Table 2).

3.2. Response of Soil Microbial Biomass to Thinning Intensity in E. urophylla × E. grandis Coppice Stands

The qMBC and MBC in soil showed the same trend (decreased and then increased with an increase in thinning intensity) among treatments except for the 20–40 cm layer of T4 (Figure 2a,b). Among soil layers, MBC was enhanced in 0–20 cm soil layers across thinning treatments (Figure 2a). Whereas qMBC showed the highest value in the 20–40 cm layer among all thinning treatments (Figure 2b). Among the treatments, T2 treatment had the lowest qMBC among all thinning treatments, with a significant difference (p < 0.05) of 47.34% and 44.81% compared to CK in the 0–20 cm and 20–40 cm layers, respectively (Figure 2b, Table 3). Moreover, T2 resulted in the lowest qMBN, which was significantly lower (p < 0.05) than T1, T3, T4, and CK by 39.13%, 36.04%, 40.09%, and 36.51%, respectively (Figure 2d, Table 3). Interestingly, soil MBP and qMBP in the 20–40 cm layer showed an increase followed by a decrease with stand density increasing. T2 was significantly higher (p < 0.01) than other treatments, showing an increase of 91.23%–189.45% in MBP and 67.55%–211.47% in qMBP (Figure 2e,f, Table 3). This suggests that T2 benefits soil P accumulation in microorganisms. However, thinning had no significant influence (p < 0.05) on MBN, MBP, and qMBP in the 0–20 cm layer (Figure 2c,e,f, Table 3), or on qMBN in the 20–40 cm layer (Figure 2d, Table 3).

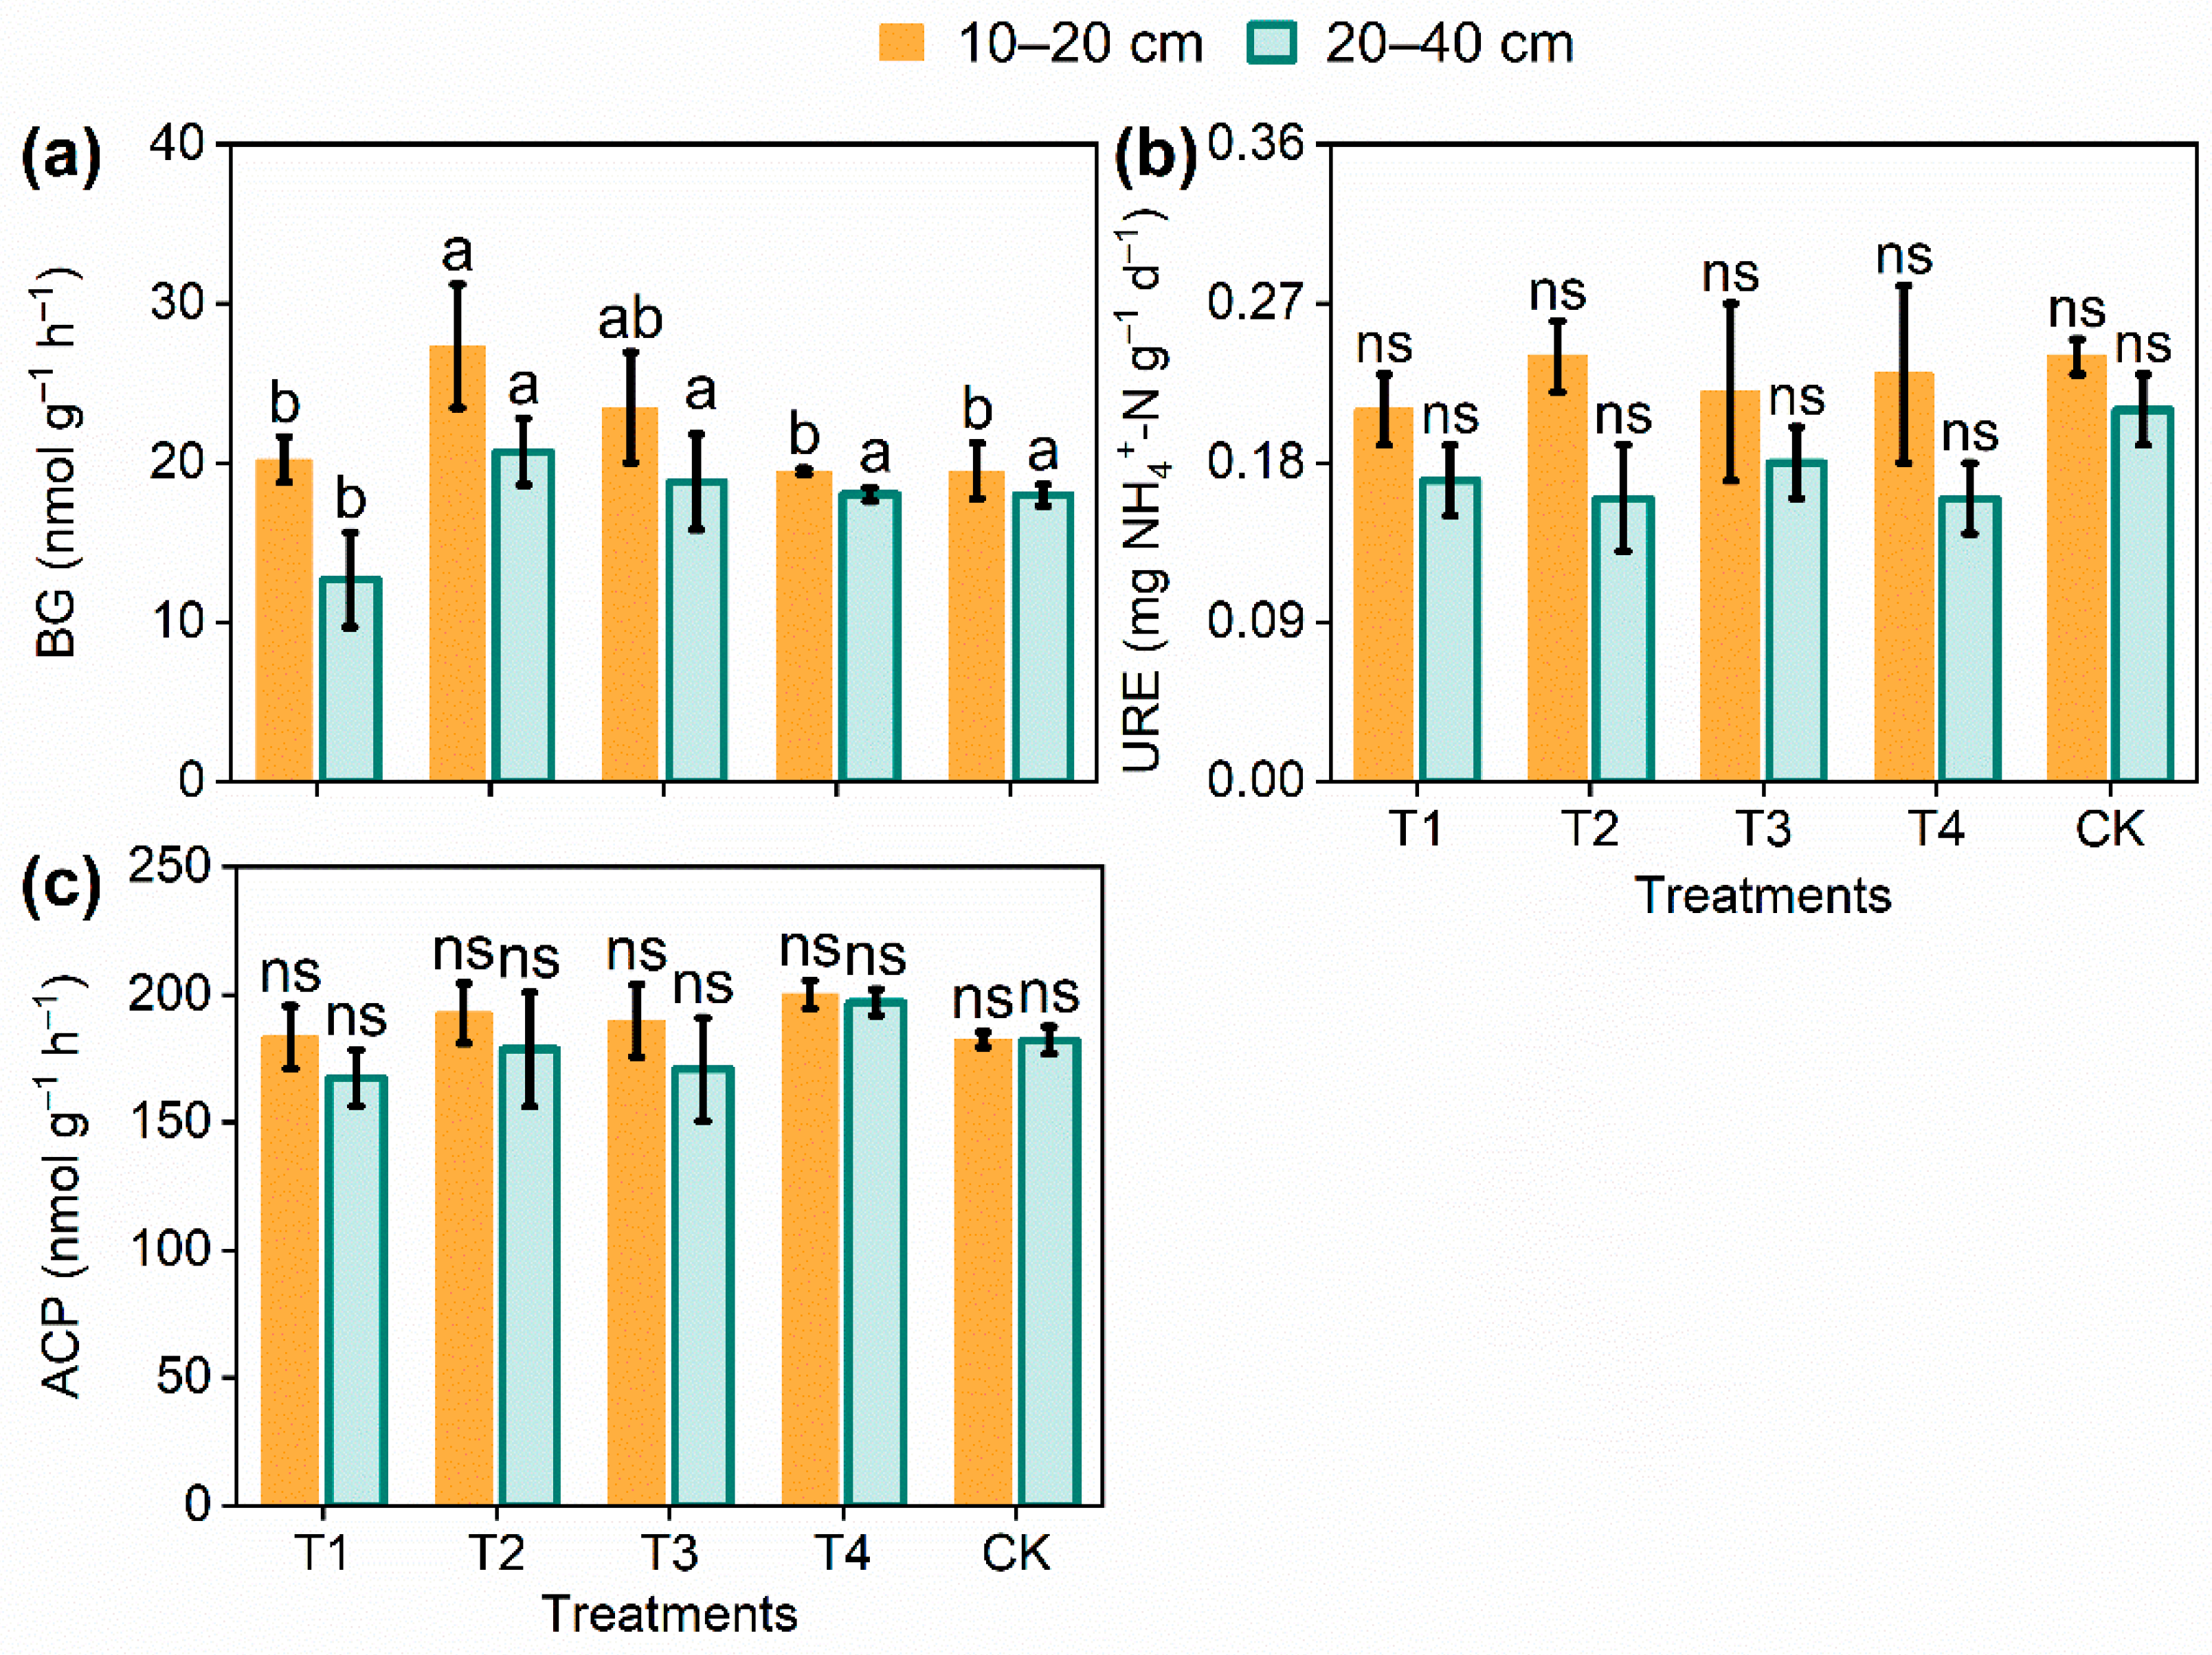
3.3. Response of Soil Enzyme Activities to Thinning Intensity in E. urophylla × E. grandis Coppice Stands

Among soil enzyme activities, only BG activity was significantly affected (p < 0.05) by various thinning treatments (Figure 3a, Table 3), while the URE and ACP activities were not significantly (p < 0.05) influenced (Figure 3b, c, Table 3). BG activity was increased first and then decreased as thinning intensity increased, following the order T2 > T3 > T1 > CK > T4 and T2 > T3 > T4 > CK > T1 in 0–20 cm and 20–40 cm layers, respectively (Figure 3a). BG activity in T2 was higher than other treatments by 16.37%–40.35% in the 0–20 cm layer and by 10.10%–63.22% in the 20–40 cm layer (Figure 3a).

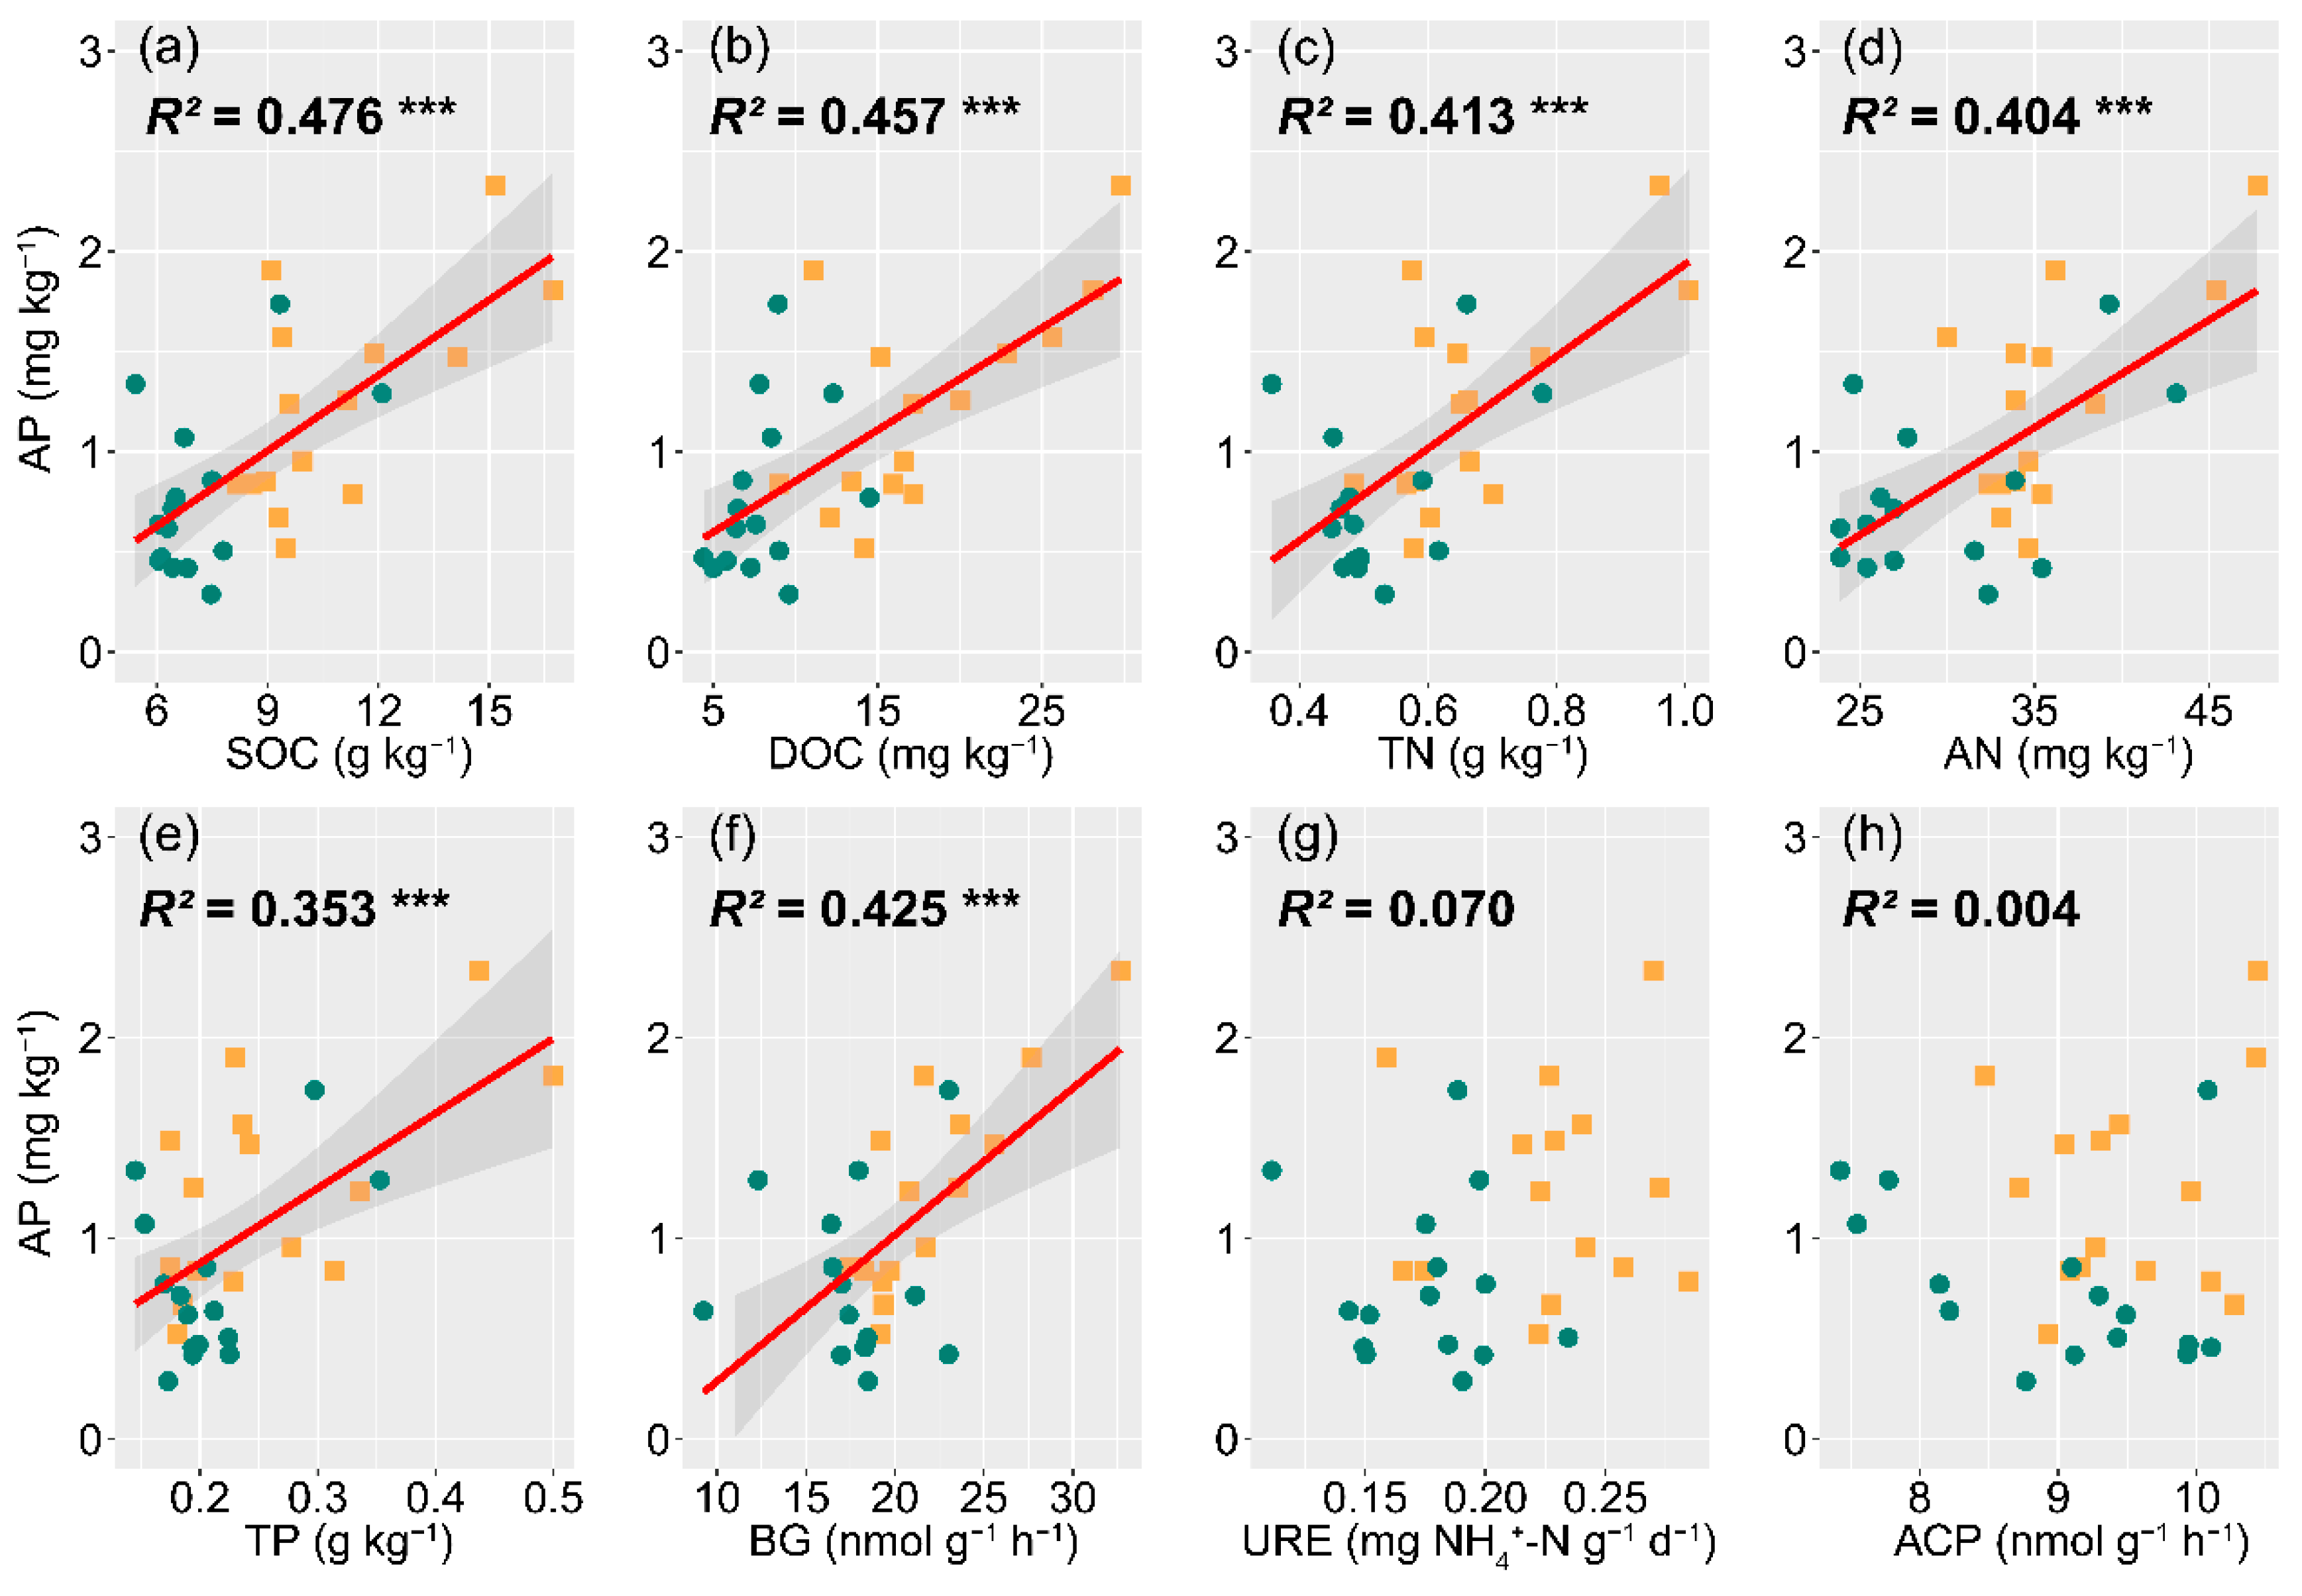
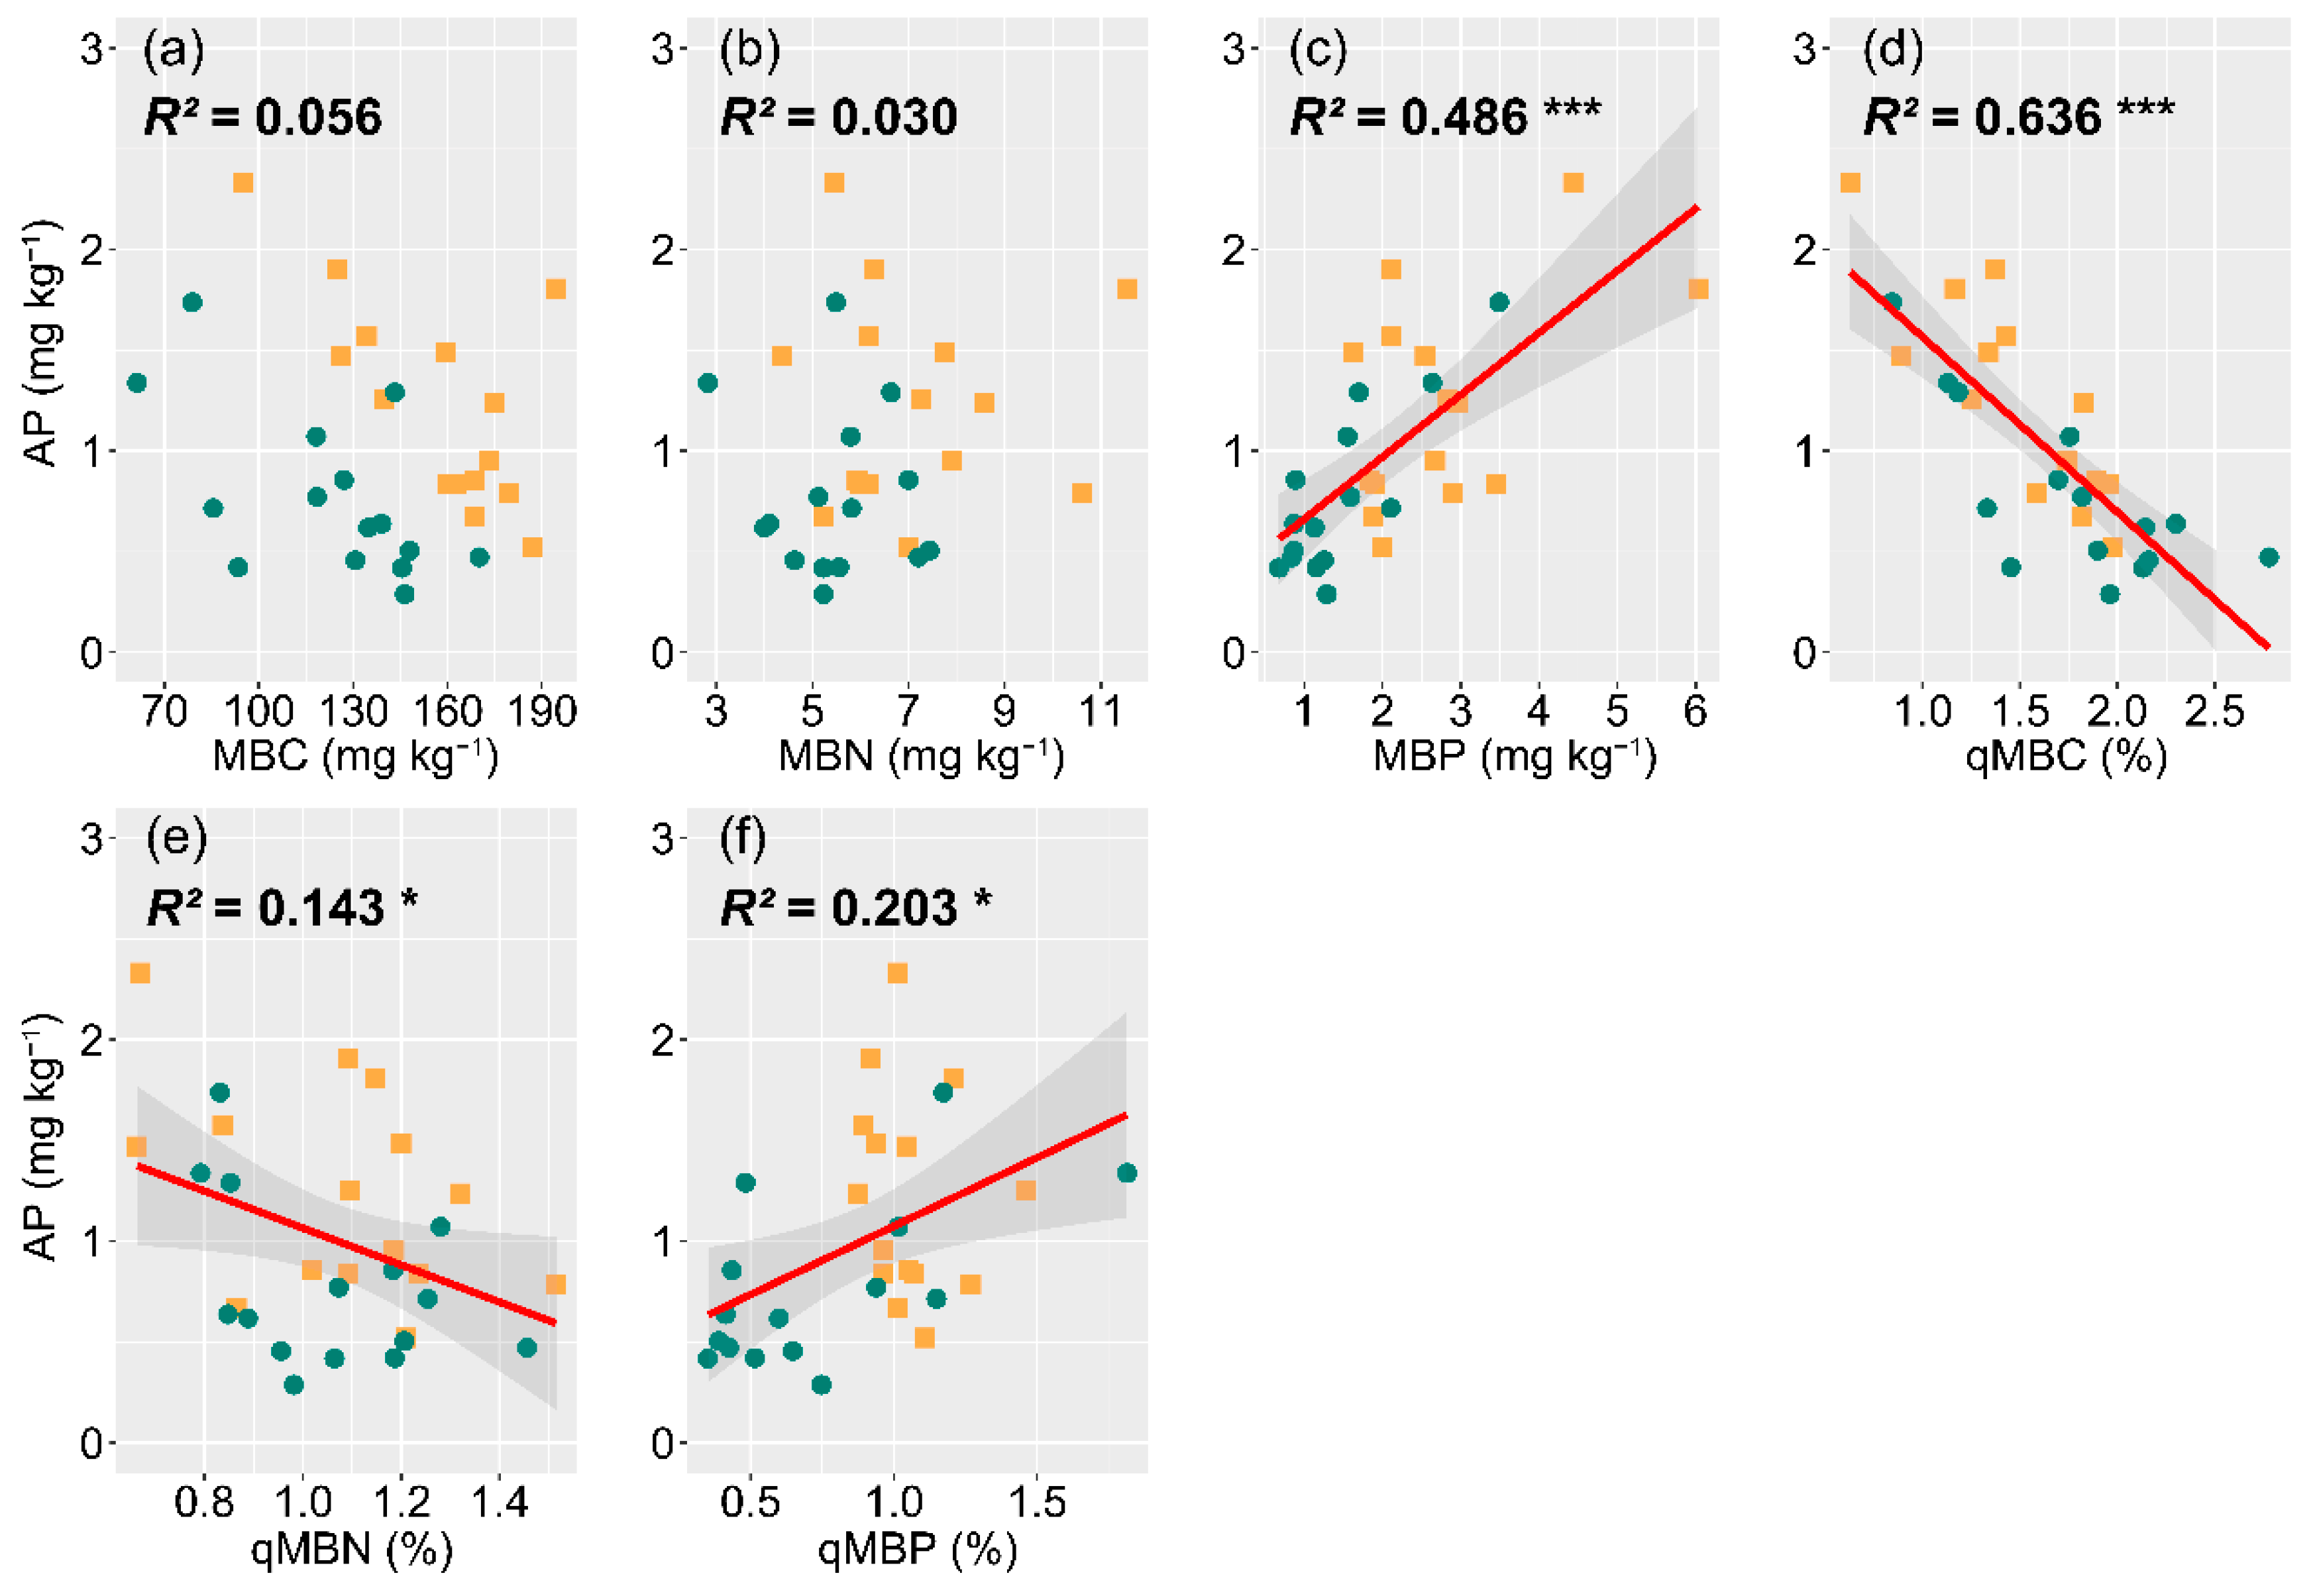
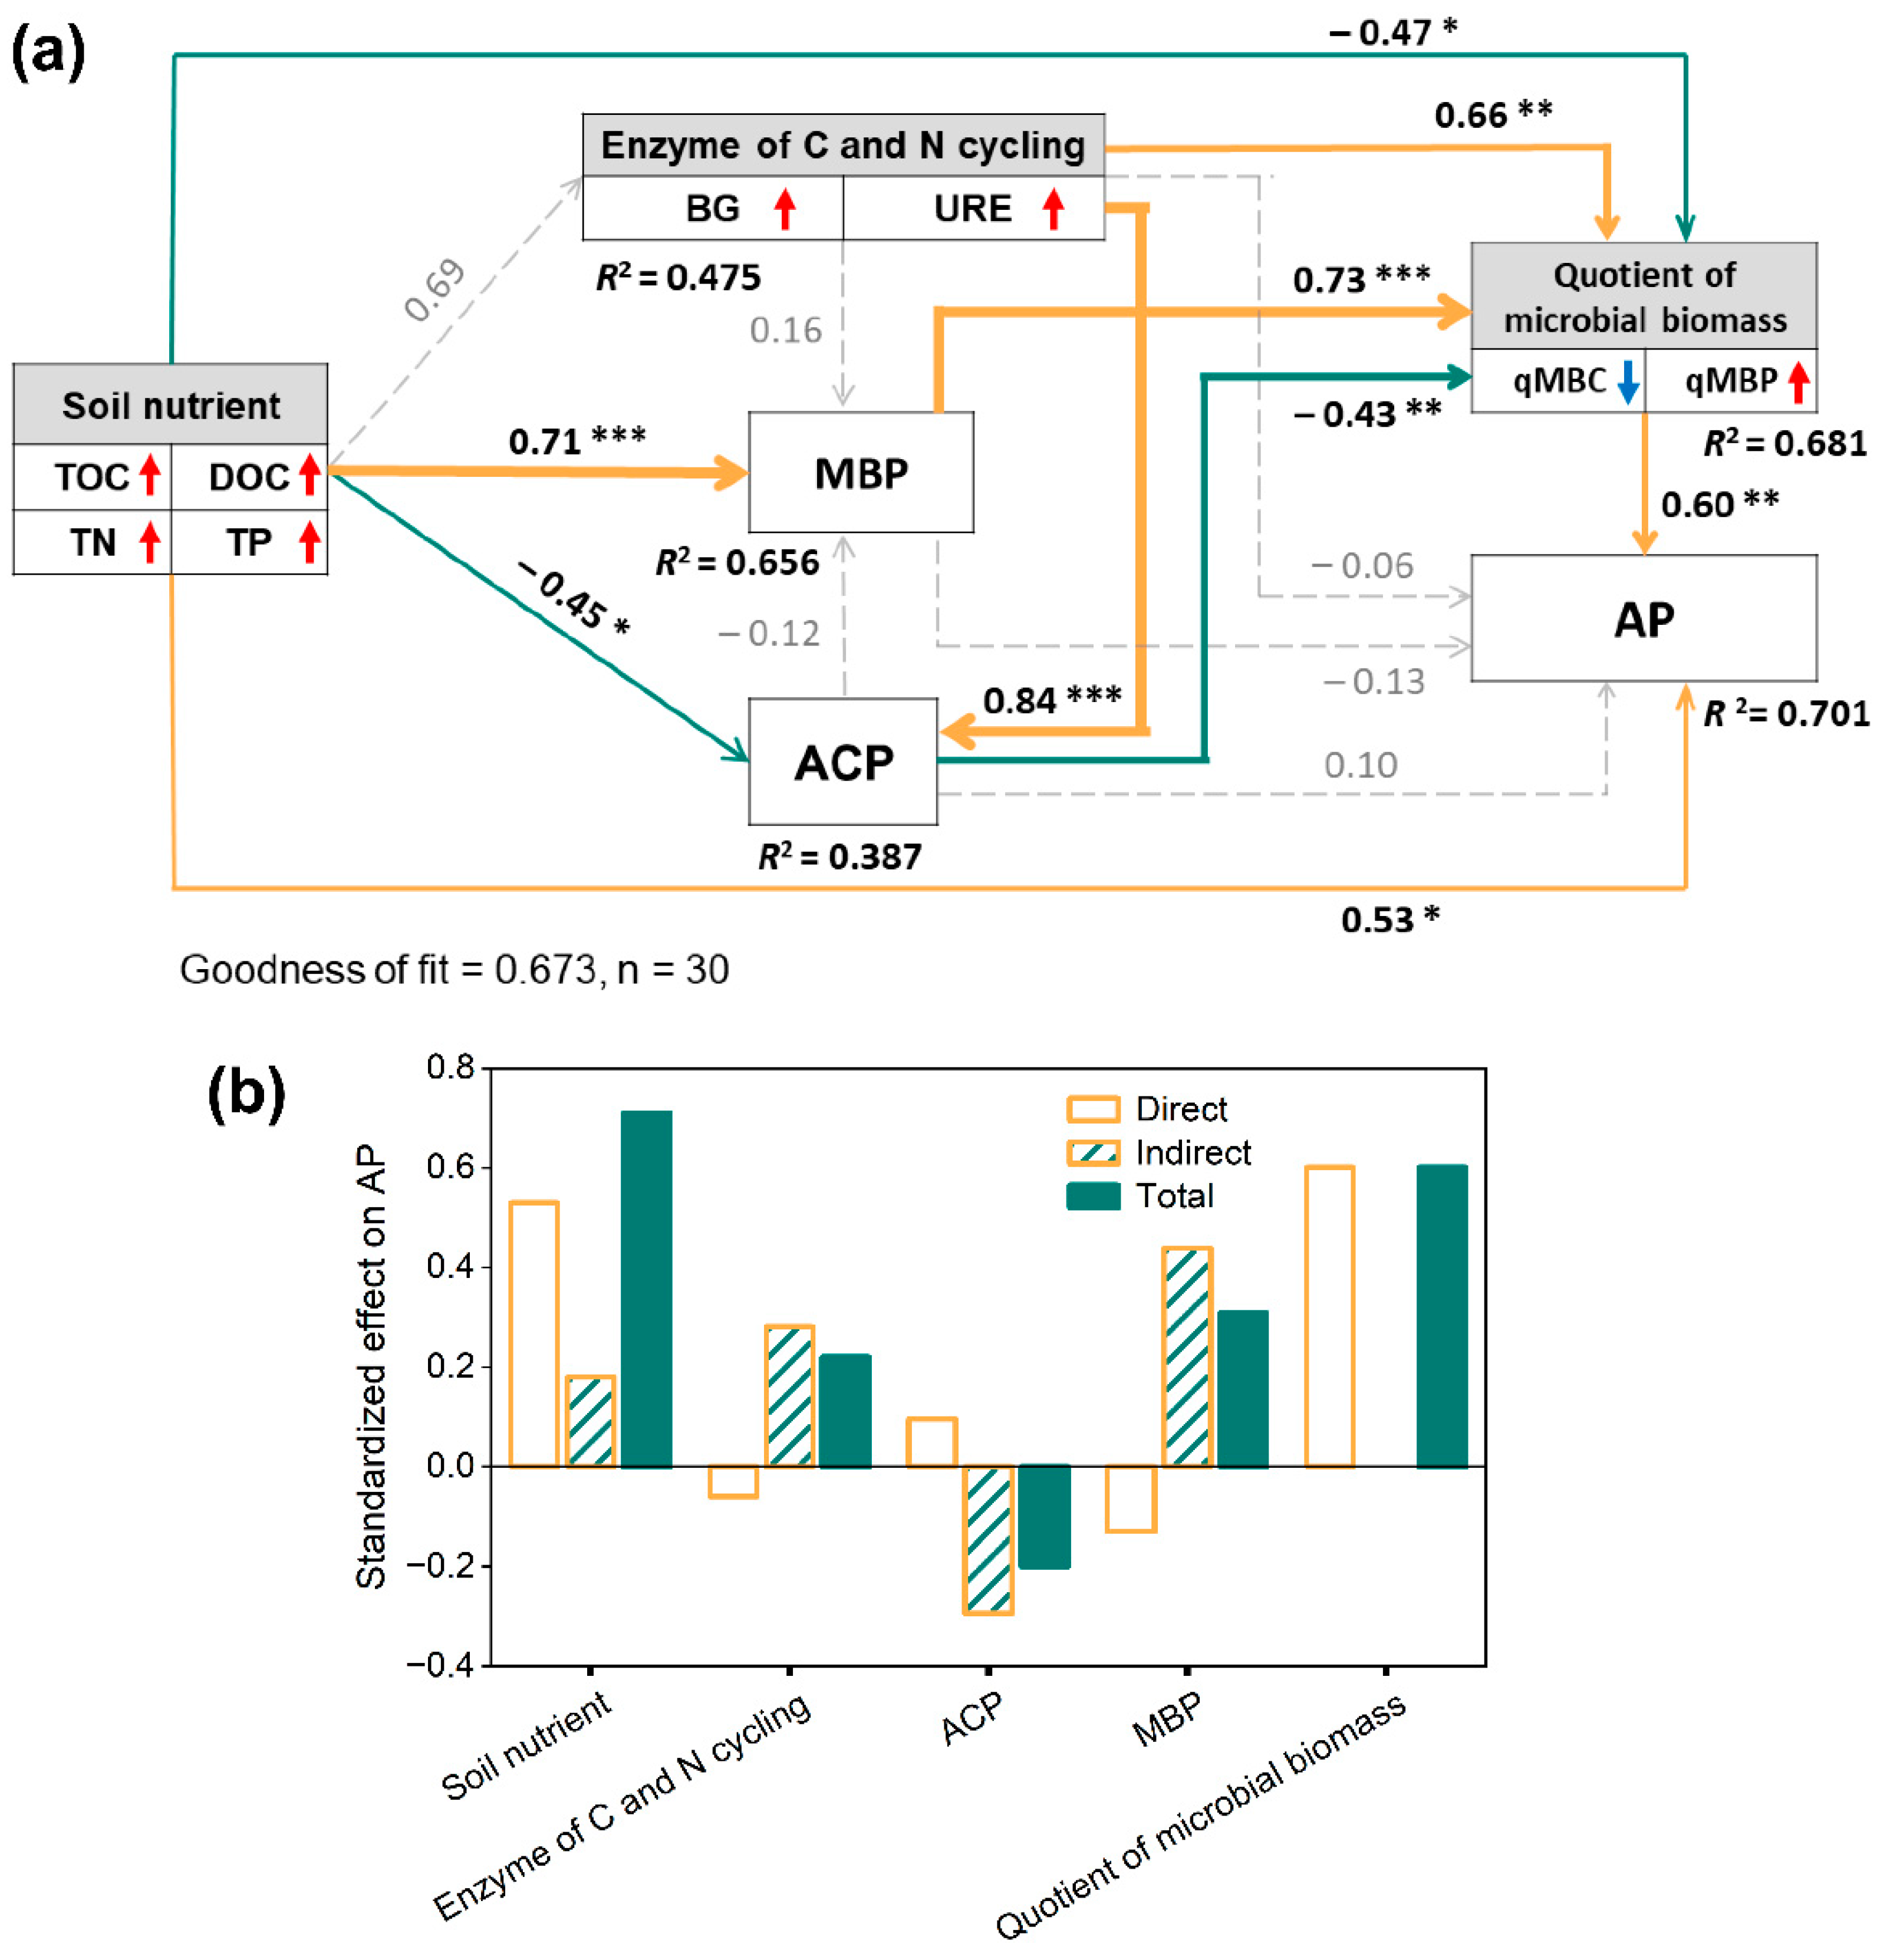
3.4. The Influence of Soil Nutrients, Microbial Biomass, and Enzyme Activity on P Availability

Regression and Pearson correlation analysis indicated that AP was significantly positively correlated with SOC (R2 = 0.476), DOC (R2 = 0.457), TN (R2 = 0.413), AN (R2 = 0.404), TP (R2 = 0.353), BG (R2 = 0.425), MBP (R2 = 0.48) and qMBP (R2 = 0.203) (p < 0.05) (Figure 4a–f and Figure 5c,f, Table S1), while significantly negatively correlated with qMBC (R2 = 0.636) and qMBN (R2 = 0.143) (p < 0.05) (Figure 5d,e, Table S1). These results suggested that soil AP was affected by soil nutrients and microbial biomass indicators in E. grandis × E. urophylla coppice forests. Increasing nutrient supply and qMBP can promote soil P turnover from a stable to a bioavailable fraction.
The PLS-PM model revealed that soil nutrients had the highest standardized effect on AP, as shown in Figure 6b. The direct and indirect effects of soil nutrients through MBP, ACP, and the quotient of microbial biomass on AP were significant (p < 0.05) (Figure 6a). These results imply soil nutrient content was the most important factor affecting P bioavailability in Eucalyptus coppice forest. The quotient of microbial biomass was significantly affected by soil nutrients (p < 0.05), an enzyme of C and N cycling (p < 0.01), ACP (p < 0.01), and MBP (p < 0.001) directly (Figure 6a). However, the direct effects of enzymes C and N cycling, ACP, and MBP on AP were not significant (p < 0.05) (Figure 6a). Meanwhile, AP was significantly (p < 0.01) directly affected by the quotient of microbial biomass, suggesting that the effects of enzymes of C and N cycling, ACP, and MBP on AP were mainly through an indirect pathway (Figure 6). The two parameters of the quotient of microbial biomass, qMBC and qMBP, had different influences on AP, with qMBC having an adverse effect and qMBP having a positive impact (Figure 5d,f and Figure 6a, Table S1). These results indicate that different indicators of microbial quotient had a varied influence on soil AP in an E. grandis × E. urophylla coppice forest.

4. Discussion

4.1. Soil Nutrients of Different Intensity Thinned E. grandis × E. urophylla Coppice Plantations

Previous studies suggested that increasing soil SOC and TN after thinning requires an extended period [44,45]. In the present study, soil SOC, DOC, TN, and AN were not significantly influenced (p < 0.05) (Table 2) in different thinned E. grandis × E. urophylla coppice forests after two years. These results confirmed the regular fitting of the Eucalyptus plantation in Guangxi. Thinning of Eucalyptus plantations in short rotation can lead to a decrease in stand density, an increase in canopy openness, and destruction of the understory plant community and soil structure, which can accelerate the loss of soil C and nutrients, especially some labile C and N fractions, due to an increase in soil temperature, priming effect, and enzyme activity [27,46,47,48]. In the long term, thinning benefits plant community structure and promotes the soil nutrient cycle [11]. However, thinning provides Eucalyptus trees with more space for growth, enhancing their photosynthesis and nutrient uptake. Meanwhile, 6-year-old to 8-year-old Eucalyptus trees in the current study were in a rapid growth period; these accelerated soil nutrients utilized by trees and reduced litter input [49], which prolonged the process of increasing soil C and N contents in thinned Eucalyptus plantations. The SOC, DOC, TN, and AN trends were varied in two layers. These four indicators were higher in the T2 and T3 treatments than CK in the 0–20 cm layer but lower in the 20–40 cm layer (Table 2). The results comply with the rule of soil nutrients content in different layers that aggregate on the soil surface in subtropical plantations [50,51] and may be related to spatial variation of litter input and organism nutrients demand: (1) the understory vegetation root system may not develop entirely in these stands, and litter is mainly concentrated on the soil surface [52]; (2) meanwhile, Eucalyptus trees usually uptake nutrients from the depth of the soil layer, and microorganisms indicate higher N demand in soil below 20 cm in subtropical forests [50]. Therefore, the amount of soil nutrients consumed is higher in the 20–40 cm layer compared to the 0–20 cm layer.
Qiao et al. reported that the average TP content of native broad-leaved forest in the 0–20 cm and 20–40 cm layers was 0.38 ± 0.12 g kg−1 and 0.31 ± 0.11 g kg−1, respectively, in Tiantong National Park, a subtropical region similar to our study area [53]. Our findings indicated that the soil TP contents of the CK treatment were 0.21 ± 0.05 g kg−1 and 0.20 ± 0.02 g kg−1 in these two layers (Table 2). This suggests that soil P accumulations in our 2nd generation E. grandis × E. urophylla coppice plantation were lower than in the native forest ecosystem. It is well known that there is more soil nutrient consumption and erosion in short-rotation and high-density Eucalyptus plantations than in native forest ecosystems [4,54,55]. Soil TP increased in both the T1 and T2 treatments after two years (Table 2), suggesting that thinning, especially high-intensity thinning, can promote soil P levels. Bedrock and mineral conditions are essential factors that affect soil TP content [56], indicating that TP is relatively stable in a specific ecosystem and that limited research exists. Therefore, litter input is an essential source for the soil P pool [20]. Our study found that soil TP is significantly positively (p < 0.001) related to SOC (Table S1), which suggests that increased litter input is the main reason for soil P accumulation in the 0–20 cm layer of T1 and T2 treatments. Soil AP content in the T2 and 0–20 cm layer of T3 was significantly higher than in the CK (p < 0.05) (Table 2), suggesting that moderate thinning intensities can improve P plant availability in E. grandis × E. urophylla coppice forest, thus confirming that thinning can improve soil AP content in E. grandis × E. urophylla coppice forest.

4.2. Soil Microbial Biomass and Enzyme Activity of Different Intensity Thinned E. grandis × E. urophylla Coppice Plantations

The results showed that soil MBN and MBP were significantly positively correlated (p < 0.01) with soil SOC, DOC, TN, AN, and TP (Table S1). However, MBC did not show a significant correlation (p < 0.05) with these soil nutrients (Table S1), suggesting that MBN and MBP were controlled by soil nutrient supply, while MBC was impacted by changes in the understory plant community and root traits after thinning [27,57]. The changes in plant structure after thinning were found to be a major reason affecting soil fungi [58,59], such as community, distribution, structure, and physiological activity. Fungi have a higher C proportion than bacteria in the soil and are the main fraction of soil MBC [11,60,61]; hence, the MBC of our stand soil changed after thinning. On a global scale, the average qMBN and qMBP in tropical and subtropical forest soils are 3.08% and 6.32%, respectively [62]. In our study, the soil average qMBN and qMBP of E. grandis × E. urophylla coppice plantations were 1.07% and 0.90%, respectively (Figure 2d,f), which are only a part of 34.74% and 14.24%, respectively, on the global scale. These results may be related to worse soil nutrient loss, physico-chemical properties, microbial multifunctionality, and increasing generations in Eucalyptus plantations [5,63,64]. This implied that the proportions of MBN and MBP in soil TN and TP were lower. Regression, Pearson correlation, and PLS-PM analysis suggested a significant positive relationship between qMBP and AP (p < 0.05) (Figure 5f and Figure 6, Table S1). These results implied that the relatively inferior qMBP was a reason for low P bioavailability [23].
Soil BG activities rose initially and then decreased with thinning intensity in the current study (Figure 3a); this trend was opposite to the findings of Chen et al., who reported lower BG activity in low-intensity thinning treatment and higher activity in high-intensity treatment than CK in Chinese fir plantations [65]. These varied trends in BG activities suggest that tree species are one of the reasons affecting enzyme activity in thinned plantations. There are different forest structures, light environments, plant communities, and soil nutrient cycling characteristics in these plantations, which are constructed by various broad-leaved or coniferous tree species [66,67]. We found that BG activity had a very significant positive correlation (p < 0.01) with SOC and DOC (Table S1), suggesting that it was affected by substrate quantity and quality [68]. However, according to the results found by Zhou et al., N and P hydrolytic enzyme activity increased after thinning in the larch (Larix olgensis) plantation [48]. While our study found no significant difference (p < 0.05) in URE and ACP activity in E. grandis × E. urophylla coppice forest (Figure 3b,c), this result was reported in other tropical and subtropical plantations, such as teak (Tectona grandis) [69]. In nutrient-faulty acid soils, N and P absorbed by Fe and Al ions limit hydrolytic reactions of URE and ACP, and uptake of N and P from soil organic matter through mycorrhiza is a more efficient way for plants [19,22]. Therefore, URE and ACP activity in bulk soil may not be essential indicators for N and P uptake in E. grandis × E. urophylla, and matched studies between rhizosphere and bulk soils should be conducted in Eucalyptus plantations.

4.3. Function of Soil Total Nutrient and DOC on P Bioavailability in E. grandis × E. urophylla Coppice Forest

We observed that the standardized total effect on AP of soil nutrients (SOC, DOC, TN, and TP) was higher than enzyme activities, MBP, and the quotient of microbial biomass (Figure 6b). These results suggested soil total nutrients and DOC contents were the most important indicators for P bioavailability. Furthermore, C, N, and P are major elements required for microbial activity, especially heterotrophs. Adequate soil nutrient supply promotes continual turnover of soil nutrients and enzyme activity, thereby accelerating soil P plant availability [14,31]. Additionally, higher soil total nutrient levels promote plant growth, leading to improved litter input and long-term maintenance of forest soil fertility [70,71,72]. Moreover, DOC is the most effective energy resource for soil microbes and can affect soil microbial community and function [73]. Previously, several studies reported different effects of soil total nutrient and DOC on the soil P biochemical cycle; for example, Margalef et al. (2017) documented that TN was the principal factor that influenced the spatial gradient change of phosphatase activity on a global scale [31], and Zhang et al. found that long-term fertilizer input improved soil SOC and TN contents, resulting in increased MBP in the Loess Plateau [74]. Some fractions of DOC, such as low-molecular-weight organic acids, can occupy or change positions of soil particles that bind inorganic P, inhibiting the absorption of bioavailable P fractions and consequently increasing soil AP content [75].

4.4. Effects of Soil Microbial Biomass Turnover and Enzyme Activity on P Availability

Extracellular enzyme activities and microbial biomass turnover are two major pathways of soil P bioavailability [19,31]. Through regression, Pearson correlation, and PLS-PM analysis, we found that the relationship between MBP and AP was stronger than that between ACP and AP (Figure 4h, Figure 5c and Figure 6a, Table S1). Furthermore, the total standardized effects on AP of MBP and ACP were 0.31 and 0.20, respectively (Figure 6b), suggesting that MBP turnover had a stronger influence on AP than ACP in 2nd generation Eucalyptus coppice plantations [76]. Soil AP is utilized by microbes for their metabolism [77], but we found that the direct standardized effect on AP of MBP was not significant (p < 0.05) in our Eucalyptus plantation (Figure 6a). These results confirmed that microbial biomass turnover was more important than enzyme hydrolysis for soil AP in E. grandis × E. urophylla coppice forest. Additionally, the direct standardized effect of MBP on AP was negative and not significant (p < 0.05), but its indirect standardized effect on AP was positive, and the pathway MBP—the quotient of microbial biomass—AP was highly significant (p < 0.01) (Figure 6). This implies that regulating qMBP was the main way that MBP affected AP in the Eucalyptus coppice plantation. These results highlighted that accelerating P relative accumulation in microbial biomass effectively promotes soil P bioavailable turnover.
The effects of two quotients of microbial biomass indicators on AP were varied, with qMBC and qMBP having a significant negative correlation (p < 0.01) and a significant positive correlation (p < 0.05) with AP, respectively (Figure 5d,f and Figure 6a, Table S1). These results suggest that the increases in MBC to SOC ratio and MBP to TP ratio had negative and positive effects on soil P bioavailability, respectively, in our Eucalyptus stands. On the one hand, C is a restricted element for soil microbes, according to former studies. Soil microbe activity and priming effect are maintained by an abundant C supply. Conversely, soil microbes are in inactive dormancy if soil C is insufficient, so soil nutrients cycle and turnover through microbial biomass are controlled by SOC contents [14,78]. The qMBC is an important indicator that reflects the ability of soil C supply; a lower qMBC means specific quantities of microbes can gain more C sources relatively from soil [79,80], and then some activities related to soil P bioavailability, which are mediated by microbial turnover, can be sustained [24,81]. Therefore, the relationship between qMBC and AP was significantly negative (p < 0.001) (Figure 5d, Table S1). We found that T2 treatment and the 0–20 cm layer of T3 treatment were significantly lower (p < 0.05) than T4 and CK treatments in qMBC (Figure 2b). These results imply that soil microbes can gain more energy resources from these treatments and layers, which benefits soil P bioavailability. Soil AP content was significantly enhanced (p < 0.05) in these two treatments (Table 2). On the other hand, soil microbes can uptake organic P and immobilize it in microbial biomass as nucleic acid, phosphatide, ATP, etc., and return it to the soil in small molecular organic P such as metabolic exude and residual body. These can be taken up by plant-mycorrhizal fungi systems [24,82,83]. Furthermore, this suggests that enhancing the MBP-to-TP ratio can promote soil P bioavailable turnover. This is the major reason for the significant positive relationship of qMBP with AP in Eucalyptus coppice plantations (Figure 5f, Table S1).
The regulation of the global soil P cycle and bioavailability are regulated by hydrolytic enzymes; however, the function of hydrolytic enzymes varies depending on the ecosystem [68,77,84]. For example, Zhu et al. found that standardized total effects on bioavailable-P of ACP were negative in subalpine coniferous (Abies fabri) forests in the eastern edge of the Tibetan Plateau [68]. This phenomenon also emerged in our study and the E. grandis × E. urophylla coppice forest (Figure 6). Lu et al. conducted a county-scale study in China to determine the role of biotic factors on soil bioavailable P fraction, and they concluded that other hydrolytic enzymes, in addition to ACP, that link with soil P mineral processes, e.g., phytase, were in an essential location in soil P bioavailable turnover, especially in some land use types that were disturbed by human activities [56]. Short rotation and frequent fertilizer input make E. grandis × E. urophylla plantations an ecosystem seriously influenced by industrialized forest management. Therefore, using ACP alone may not accurately reflect the function of hydrolytic enzymes related to soil P mineralization. According to Lu et al., this was the main reason soil ACP showed no significant difference (p < 0.05) along five intensities of thinning treatments (Figure 3c) [56]. Furthermore, we found soil BG activity had a significant (p < 0.01) positive relationship with AP (Figure 4f, Table S1). In the PLS-PM model, the enzymes involved in C and N cycles (BG and URE) were key variations on AP through ACP and the quotient of microbial biomass (Figure 6). This suggests that increasing BG and URE activities can indirectly promote soil P bioavailability in Eucalyptus plantations. High BG and URE activities can (1) supply sufficient nutrients for soil microbes [14], (2) promote soil P accumulation in microbial biomass and enzyme synthesis [85], and (3) increase the microbial turnover rate [76]. These results suggested a tight relationship between C, N, and P cycles in the soil of E. grandis × E. urophylla coppice plantations, which has been confirmed in grassland and cropland [27,85,86,87].

5. Conclusions

In conclusion, our study found no significant differences (p < 0.05) in SOC, DOC, TN, and AN among five thinned-intensity treatments. However, we observed that the T1 stand had a significantly higher (p < 0.05) TP content in the 0–20 cm layer; meanwhile, the T2 and 20–40 cm layers of T3 had significantly higher (p < 0.05) AP contents. Additionally, our analysis implies that various soil indicators can be used to assess P bioavailability. Firstly, soil SOC, TN, TP, and DOC contents had the highest standardized effect on AP. Secondly, microbial turnover was the key process in the soil P cycle, and increasing qMBP benefited P bioavailability, while lower qMBP restricted soil AP content in Eucalyptus plantations. Lastly, soil P plant bioavailability is closely connected with soil C and N supply and cycle. These findings, which confirmed hypotheses 1 and 3, and rejected hypotheses 2, suggest that relatively heavy thinned intensity can accelerate soil P content and bioavailable turnover and highlight the primary functions of microbial biomass turnover and soil nutrient supply in the P plant-available mechanism in Eucalyptus coppice plantations. Therefore, some silviculture practices, such as prolonging rotation and introducing broad leaf or nitrogen-fixing tree species, should be used to inhibit soil nutrients loss and increase litter input for maintaining soil nutrient bioavailable turnover after thinning. More future research should focus on the influences of thinning soil nutrients and biochemical processes in the long term.

Supplementary Materials

The following supporting information can be downloaded at: https://www.mdpi.com/article/10.3390/f14102067/s1, Table S1. Pearson correlation matrix of soil nutrient, microbial biomass, and enzyme activity in E. grandis × E. urophylla sprout forests.

Author Contributions

Funding acquisition, S.Y. and M.Y.; Investigation, X.D. and Y.X.; Writing—original draft, X.X.; Writing—review and editing, I.A. All authors have read and agreed to the published version of the manuscript.

Funding

This work was supported by the National Natural Science Foundation of China (32371856) and the Key Projects of Guangxi Natural Science Foundation (2021GXNSFDA196003).

Data Availability Statement

Data will be made available upon request.

Acknowledgments

This work was supported by National Natural Science Foundation of China (32371856) and Key Projects of Guangxi Natural Science Foundation (2021GXNSFDA196003). We sincerely thank Qipo Forest Farm which gave help in plots selecting and soil sampling. And we sincerely thank Hongxiang Wang for beneficial advice in writing.

Conflicts of Interest

The authors have no relevant financial or non-financial interests to disclose.

References

  1. Yang, G.R.; Wen, M.J.; Deng, Y.S.; Su, X.L.; Jiang, D.H.; Wang, G.; Chen, Y.W.; Chen, G.J.; Yu, S.F. Occurrence patterns of black water and its impact on fish in cutover areas of Eucalyptus plantations. Sci. Total Environ. 2019, 693, 133393. [Google Scholar] [CrossRef] [PubMed]
  2. Lemessa, D.; Mewded, B.; Legesse, A.; Atinfau, H.; Alemu, S.; Maryo, S.; Tilahun, S. Do Eucalyptus plantation forests support biodiversity conservation. For. Ecol. Manag. 2022, 523, 120492. [Google Scholar] [CrossRef]
  3. Wen, Y.G.; Ye, D.; Chen, F.; Liu, S.R.; Liang, H.W. The changes of understory plant diversity in continuous cropping system of Eucalyptus plantations, South China. J. For. Res. 2010, 15, 252–258. [Google Scholar] [CrossRef]
  4. Wang, J.Y.; Deng, Y.S.; Li, D.Y.; Liu, Z.F.; Wen, L.L.; Huang, Z.G.; Jiang, D.H.; Lu, Y.P. Soil aggregate stability and its response to overland flow in successive Eucalyptus plantations in subtropical China. Sci. Total Environ. 2022, 807, 151000. [Google Scholar] [CrossRef]
  5. Xu, Y.X.; Li, C.; Zhu, Y.L.; Wang, Z.C.; Zhu, W.K.; Wu, L.C.; Du, A.P. The shifts in soil microbial community and association network induced by successive planting of Eucalyptus plantations. For. Ecol. Manag. 2022, 505, 119877. [Google Scholar] [CrossRef]
  6. Li, X.; Ye, D.; Liang, H.; Zhu, H.; Qin, L.; Zhu, Y.; Wen, Y. Effects of successive rotation regimes on carbon stocks in Eucalyptus plantations in subtropical China measured over a full rotation. PLoS ONE 2015, 10, e0132858. [Google Scholar] [CrossRef]
  7. Laclau, J.P.; Deleporte, P.; Ranger, J.; Bouillet, J.P.; Kazotti, G. Nutrient dynamics throughout the rotation of Eucalyptus clonal stands in Congo. Ann. Bot. 2003, 91, 879–892. [Google Scholar] [CrossRef]
  8. Foltran, E.C.; Rocha, J.H.T.; Bazani, J.H.; Gonçalvesa, J.L.M.; Rodriguesd, M.; Pavinatod, P.; Valdugae, G.R.; Errof, J.; Garcia-Mina, J.M. Phosphorus pool responses under different P inorganic fertilizers for a eucalyptus plantation in a loamy Oxisol. For. Ecol. Manag. 2019, 435, 170–179. [Google Scholar] [CrossRef]
  9. McMahona, D.E.; Vergützb, L.V.; Valadares, S.V.; Silvab, I.R.D.; Jacksona, R.B. Soil nutrient stocks are maintained over multiple rotations in Brazilian Eucalyptus plantations. For. Ecol. Manag. 2019, 448, 364–375. [Google Scholar] [CrossRef]
  10. Tsai, H.C.; Chiang, J.M.; McEwan, R.W.; Lin, T.C. Decadal effects of thinning on understory light environments and plant community structure in a subtropical forest. Ecosphere 2018, 9, e02464. [Google Scholar] [CrossRef]
  11. Dang, P.; Gao, Y.; Li, J.L.; Yu, S.C.; Zhao, Z. Effects of thinning intensity on understory vegetation and soil microbial communities of a mature Chinese pine plantation in the Loess Plateau. Sci. Total Environ. 2018, 630, 171–180. [Google Scholar] [CrossRef] [PubMed]
  12. Chen, X.; Page-Dumroese, D.; Lv, R.H.; Wang, W.W.; Li, G.L.; Liu, Y. Interaction of initial litter quality and thinning intensity on litter decomposition rate, nitrogen accumulation and release in a pine plantation. Silva Fenn. 2014, 48, 1211. [Google Scholar] [CrossRef]
  13. Çömez, A.; Güner, Ş.T.; Tolunay, D. The effect of stand structure on litter decomposition in Pinus sylvestris L. stands in Turkey. Anna. For. Sci. 2021, 78, 19. [Google Scholar] [CrossRef]
  14. Camenzind, T.; Hattenschwiler, S.; Treseder, K.K.; Lehmann, A.; Rillic, A. Nutrient limitation of soil microbial processes in tropical forests. Ecol. Monogr. 2018, 88, 4–21. [Google Scholar] [CrossRef]
  15. Qiu, X.C.; Wang, H.B.; Peng, D.L.; Liu, X.; Yang, F.; Lia, Z.; Cheng, S. Thinning drives C:N:P stoichiometry and nutrient resorption in Larix principis-rupprechtii plantations in North China. For. Ecol. Manag. 2020, 462, 117984. [Google Scholar] [CrossRef]
  16. Forrester, D.I. Growth responses to thinning, pruning and fertiliser application in Eucalyptus plantations: A review of their production ecology and interactions. For. Ecol. Manag. 2018, 310, 336–347. [Google Scholar] [CrossRef]
  17. Zhou, L.; Cai, L.; He, Z.; Wang, R.W.; Wu, P.F.; Ma, X.Q. Thinning increases understory diversity and biomass, and improves soil properties without decreasing growth of Chinese fir in southern China. Environ. Sci. Pollut. Res. 2016, 23, 24135. [Google Scholar] [CrossRef] [PubMed]
  18. Shen, Y.; Cheng, R.; Xiao, W.; Yang, S.; Guo, Y.; Wang, N.; Zeng, L.X.; Lei, L.; Wang, X.R. Labile organic carbon pools and enzyme activities of Pinus massoniana plantation soil as affected by understory vegetation removal and thinning. Sci. Rep. 2018, 8, 573. [Google Scholar] [CrossRef]
  19. Lambers, H. Phosphorus acquisition and utilization in plants. Annu. Rev. Plant Biol. 2022, 73, 17–42. [Google Scholar] [CrossRef]
  20. Chen, X.; Chen, H.Y.H.; Chang, S.X. Meta-analysis shows that plant mixtures increase soil phosphorus availability and plant productivity in diverse ecosystems. Nat. Ecol. Evol. 2022, 6, 1112–1121. [Google Scholar] [CrossRef]
  21. Han, T.T.; Ren, H.; Hui, D.F.; Wang, J.; Lu, H.F.; Liu, Z.F. Light availability, soil phosphorus and different nitrogen forms negatively affect the functional diversity of subtropical forests. Glob. Ecol. Conserv. 2020, 24, e01334. [Google Scholar] [CrossRef]
  22. Clarholm, M.; Skyllberg, U.; Rosling, A. Organic acid induced release of nutrients from metal-stabilized soil organic matter—The unbutton model. Soil Biol. Biochem. 2015, 84, 168–176. [Google Scholar] [CrossRef]
  23. Menezes-Blackburn, D.; Giles, C.; Darch, T.; George, T.S.; Blackwell, M.; Stutter, M.; Shand, C.; Lumsdon, D.; Cooper, P.; Wendler, R.; et al. Opportunities for mobilizing recalcitrant phosphorus from agricultural soils: A review. Plant Soil 2018, 427, 5–16. [Google Scholar] [CrossRef] [PubMed]
  24. Richardson, A.E.; Simpson, R.J. Soil microorganisms mediating phosphorus availability update on microbial phosphorus. Plant Physiol. 2011, 156, 989–996. [Google Scholar] [CrossRef]
  25. Xu, D.; Dell, B.; Malajczuk, N.; Gong, M. Effects of P fertilisation and ectomycorrhizal fungal inoculation on early growth of eucalypt plantations in southern China. Plant Soil 2001, 233, 47–57. [Google Scholar] [CrossRef]
  26. Kurth, J.K.; Albrecht, M.; Karsten, U.; Glaser, K.; Schloter, M.; Schulz, S. Correlation of the abundance of bacteria catalyzing phosphorus and nitrogen turnover in biological soil crusts of temperate forests of Germany. Biol. Fertil. Soils 2021, 57, 179–192. [Google Scholar] [CrossRef]
  27. Chen, C.; Chen, H.Y.H.; Chen, X.; Huang, Z.Q. Meta-analysis shows positive effects of plant diversity on microbial biomass and respiration. Nat. Commun. 2019, 10, 1332. [Google Scholar] [CrossRef]
  28. Reichart, T.; Rammig, A.; Fuchslueger, L.; Lugli, L.F.; Quesada, C.A.; Fleischer, K. Plant phosphorus-use and -acquisition strategies in Amazonia. New Phytol. 2022, 234, 1126–1143. [Google Scholar] [CrossRef]
  29. Tedersoo, L.; Bahram, M.; Zobel, M. How mycorrhizal associations drive plant population and community biology. Science 2020, 367, eaba1223. [Google Scholar] [CrossRef]
  30. Wang, J.P.; Chen, G.R.; Ji, S.H.; Zhong, Y.Q.; Zhao, Q.; He, Q.Q.; Wu, Y.H.; Bing, H.J. Close relationship between the gene abundance and activity of soil extracellular enzyme: Evidence from a vegetation restoration chronosequence. Soil Biol. Biochem. 2023, 177, 108929. [Google Scholar] [CrossRef]
  31. Margalef, O.; Sardans, J.; Fernández-Martínez, M.; Molowny-Horas, R.; Janssens, I.A.; Ciais, P.; Goll, D.; Richter, A.; Obersteiner, M.; Asensio, D.; et al. Global patterns of phosphatase activity in natural soils. Sci. Rep. 2017, 7, 1337. [Google Scholar] [CrossRef]
  32. Hu, B.; Yang, B.; Pang, X.Y.; Bao, W.K.; Tian, G.L. Responses of soil phosphorus fractions to gap size in a reforested spruce forest. Geoderma 2016, 279, 61–69. [Google Scholar] [CrossRef]
  33. Xue, W.; Zhang, W.; Chen, Y. Heavy thinning temporally reduced soil carbon storage by intensifying soil microbial phosphorus limitation. Plant Soil 2023, 484, 33–48. [Google Scholar] [CrossRef]
  34. Zhou, X.G.; Zhu, H.G.; Wen, Y.G.; Goodale, U.M.; Zhu, Y.L.; Yu, S.F.; Li, C.T.; Li, X.Q. Intensive management and declines in soil nutrients lead to serious exotic plant invasion in Eucalyptus plantations under successive short-rotation regimes. Land Degrad. Dev. 2022, 31, 297–310. [Google Scholar] [CrossRef]
  35. Deng, X.; Cheng, F.; Li, M.; He, P.; Shen, L.; Liu, H.Y. Effect of different decay classes of Eucalyptus stump substrates on microbial resource limitation and carbon-use efficiency. Plant Soil 2022, 478, 651–669. [Google Scholar] [CrossRef]
  36. Wang, Y.L.; Wu, P.N.; Qiao, Y.B.; Li, Y.M.; Liu, S.M.; Gao, C.K.; Liu, C.S.; Shao, J.; Yu, H.L.; Zhao, Z.H.; et al. The potential for soil C sequestration and N fixation under different planting patterns depends on the carbon and nitrogen content and stability of soil aggregates. Sci. Total Environ. 2023, 897, 165430. [Google Scholar] [CrossRef]
  37. Carter, M.R.; Gregorich, E.G. Soil Sampling and Methods of Analysis, 2nd ed.; CRC Press: Boca Raton, FL, USA, 2008. [Google Scholar]
  38. Watanade, F.S.; Olsen, S.R. Test of an ascorbic acid methods for determination phosphorus in water and NaHCO3 extracts from soil. Soil Sci. Soc. Am. J. 1965, 29, 677–678. [Google Scholar] [CrossRef]
  39. Wu, J.; He, Z.L.; Wei, W.X.; O’Donnell, A.G.; Syers, J.K. Quantifying microbial biomass phosphorus in acid soil. Bio. Fert. Soil 2000, 32, 500–507. [Google Scholar] [CrossRef]
  40. Buttler, A.; Teuscher, R.; Deschamps, N.; Gavazov, K.; Bragazza, L.; Mariotte, P.; Schlaepfer, R.; Jassey, V.E.J.; Freund, L.; Cuartero, J.; et al. Impacts of snow-farming on alpine soil and vegetation: A case study from the Swiss Alps. Sci. Total Environ. 2023, 903, 166225. [Google Scholar] [CrossRef]
  41. Saiya-Corka, K.R.; Sinsabaugha, R.L.; Zak, D.R. The effects of long term nitrogen deposition on extracellular enzyme activity in an Acer saccharum forest soil. Soil Biol. Biochem. 2002, 34, 1309–1315. [Google Scholar] [CrossRef]
  42. Fei, Y.F.; Huang, S.Y.; Zhang, H.B.; Tong, Y.Z.; Wena, D.S.; Xia, X.Y.; Han Wang, H.; Luo, Y.M.; Barceló, D. Response of soil enzyme activities and bacterial communities to the accumulation of microplastics in an acid cropped soil. Sci. Total Environ. 2020, 707, 135634. [Google Scholar] [CrossRef]
  43. Tian, S.Y.; Zhu, B.J.; Yin, R.; Wang, M.W.; Jiang, Y.J.; Zhang, C.Z.; Li, D.M.; Chen, X.Y.; Kardol, P.; Liu, M.J. Organic fertilization promotes crop productivity through changes in soil aggregation. Soil Biol. Biochem. 2022, 165, 108533. [Google Scholar] [CrossRef]
  44. Zhou, T.; Wang, C.K.; Zhou, Z.H. Thinning promotes the nitrogen and phosphorous cycling in forest soils. Agric. For. Meteorol. 2021, 311, 108665. [Google Scholar] [CrossRef]
  45. Zhang, X.Z.; Guan, D.X.; Li, W.B.; Sun, D.; Jin, C.G.; Yuan, F.H.; Wang, A.Z.; Wu, J.B. The effects of forest thinning on soil carbon stocks and dynamics: A meta-analysis. For. Ecol. Manag. 2018, 429, 36–43. [Google Scholar] [CrossRef]
  46. Melilloa, J.M.; Butlera, S.; Johnson, J.; Tang, J. Soil warming, carbon–nitrogen interactions, and forest carbon budgets. Proc. Natl. Acad. Sci. USA 2011, 108, 9508–9512. [Google Scholar] [CrossRef]
  47. Kuzyakov, Y.; Blagodatskaya, E. Microbial hotspots and hot moments in soil: Concept & review. Soil Biol. Biochem. 2015, 83, 184–199. [Google Scholar] [CrossRef]
  48. Zhou, Z.H.; Wang, C.K.; Jin, Y.; Sun, Z.H. Impacts of thinning on soil carbon and nutrients and related extracellular enzymes in a larch plantation. For. Ecol. Manag. 2019, 450, 117523. [Google Scholar] [CrossRef]
  49. Xu, Y.X.; Du, A.P.; Wang, Z.C.; Zhu, W.K.; Li, C.; Wu, L.C. Effects of different rotation periods of Eucalyptus plantations on soil physiochemical properties, enzyme activities, microbial biomass and microbial community structure and diversity. For. Ecol. Manag. 2020, 456, 117683. [Google Scholar] [CrossRef]
  50. Liu, J.B.; Chen, J.; Chen, G.S.; Guo, J.F.; Li, Y.Q. Enzyme stoichiometry indicates the variation of microbial nutrient requirements at different soil depths in subtropical forests. PLoS ONE 2020, 15, e0220599. [Google Scholar] [CrossRef]
  51. Yu, Y.; Yang, J.; Zeng, S.; Wu, D.M.; Jacobs, D.F.; Sloan, J.L. Soil pH, organic matter, and nutrient content change with the continuous cropping of Cunninghamia lanceolata plantations in South China. J. Soils Sediments 2017, 17, 2230–2238. [Google Scholar] [CrossRef]
  52. Yang, H.J.; Pan, C.; Wu, Y.; Qing, S.Q.; Wang, Z.B.; Wang, D.H. Response of understory plant species richness and tree regeneration to thinning in Pinus tabuliformis plantations in northern China. For. Ecosyst. 2023, 10, 100105. [Google Scholar] [CrossRef]
  53. Qiao, Y.; Wang, J.; Liu, H.M.; Huang, K.; Yang, Q.S.; Lu, R.L.; Yan, L.M.; Wang, X.H.; Xia, J.Y. Depth-dependent soil C-N-P stoichiometry in a mature subtropical broadleaf forest. Geoderma 2020, 370, 114357. [Google Scholar] [CrossRef]
  54. Berhe, A.A.; Barnes, R.T.; Six, J.; Marín-Spiotta, E. Role of soil erosion in biogeochemical cycling of essential elements: Carbon, nitrogen, and phosphorus. Annu. Rev. Earth Planet. Sci. 2018, 46, 521–548. [Google Scholar] [CrossRef]
  55. Alewell, C.; Ringeval, B.; Ballabio, C.; Robinson, D.A.; Panagos, P.; Borrelli, P.Q. Global phosphorus shortage will be aggravated by soil erosion. Nat. Commun. 2020, 11, 4546. [Google Scholar] [CrossRef]
  56. Lu, J.L.; Jia, P.; Feng, S.W.; Wang, Y.T.; Zheng, J.; Ou, S.N.; Wu, Z.H.; Liao, B.; Shu, W.S.; Liang, J.L. Remarkable effects of microbial factors on soil phosphorus bioavailability: A country-scale study. Glob. Chang. Biol. 2022, 28, 4459–4471. [Google Scholar] [CrossRef] [PubMed]
  57. Wu, L.J.; Wang, B.; Wu, Y.; Chen, D.M. Regional-scale evidence that determinants of soil microbial biomass and N mineralization depend on sampling depth and layer on the Mongolian Plateau. Catena 2022, 213, 106180. [Google Scholar] [CrossRef]
  58. Zhang, J.; Quan, C.X.; Ma, L.L.; Chu, G.W.; Liu, Z.F.; Tang, X.L. Plant community and soil properties drive arbuscular mycorrhizal fungal diversity: A case study in tropical forests. Soil Ecol. Lett. 2021, 3, 52–62. [Google Scholar] [CrossRef]
  59. Taki, H.; Inoue, T.; Tanaka, H. Responses of community structure, diversity, and abundance of understory plants and insect assemblages to thinning in plantations. For. Ecol. Manag. 2010, 259, 607–613. [Google Scholar] [CrossRef]
  60. See, C.R.; Keller, A.B.; Hobbie, S.E.; Pett-Ridge, J. Hyphae move matter and microbes to mineral microsites: Integrating the hyphosphere into conceptual models of soil organic matter stabilization. Glob. Chang. Biol. 2022, 28, 2527–2540. [Google Scholar] [CrossRef] [PubMed]
  61. Camargo, A.P.; Souza, R.S.C.; Jose, J.; Gerhardt, I.R.; Dante, R.A.; Mukherjee, S.; Huntemann, M.; Kyrpides, N.C.; Carazzolle, M.F.; Arruda, P. Plant microbiomes harbor potential to promote nutrient turnover in impoverished substrates of a Brazilian biodiversity hotspot. ISME J. 2022, 17, 354–370. [Google Scholar] [CrossRef]
  62. Xu, X.F.; Thornton, P.E.; Post, W.M. A global analysis of soil microbial biomass carbon, nitrogen and phosphorus in terrestrial ecosystems. Glob. Ecol. Biogeogr. 2013, 22, 737–749. [Google Scholar] [CrossRef]
  63. Chu, S.S.; Ouyang, J.H.; Liao, D.D.; Zhou, Y.D.; Liu, S.S.; Shen, D.C.; Wei, X.H.; Zeng, S.C. Effects of enriched planting of native tree species on surface water flow, sediment, and nutrient losses in a Eucalyptus plantation forest in southern China. Sci. Total Environ. 2019, 675, 224–234. [Google Scholar] [CrossRef] [PubMed]
  64. Chen, F.L.; Zheng, H.; Zhang, K.; Ouyang, Z.Y.; Li, H.L.; Wu, B.; Shi, Q. Soil microbial community structure and function responses to successive planting of Eucalyptus. J. Environ. Sci. 2013, 25, 2102–2111. [Google Scholar] [CrossRef]
  65. Chen, X.L.; Chen, H.Y.H.; Chen, X.; Wang, J.; Chen, B.; Wang, D.; Guan, Q.W. Soil labile organic carbon and carbon-cycle enzyme activities under different thinning intensities in Chinese fir plantations. Appl. Soil Ecol. 2016, 107, 162–169. [Google Scholar] [CrossRef]
  66. Huang, Y.X.; Wu, Z.J.; Zong, Y.Y.; Li, W.Q.; Chen, F.S.; Wang, G.G.; Li, J.J.; Fang, X.M. Mixing with coniferous tree species alleviates rhizosphere soil phosphorus limitation of broad-leaved trees in subtropical plantations. Soil Biol. Biochem. 2022, 175, 108853. [Google Scholar] [CrossRef]
  67. Lin, Y.; Xia, C.K.; Wu, G.Y.; Wang, F.C.; Wang, S.N.; Liu, Y.Q.; Chen, F.S. Replanting of broadleaved trees alters internal nutrient cycles of native and exotic pines in subtropical plantations of China. For. Ecosyst. 2022, 9, 100067. [Google Scholar] [CrossRef]
  68. Adetunji, A.T.; Lewu, F.B.; Mulidzi, R. The biological activities of β-glucosidase, phosphatase and urease as soil quality indicators: A review. J. Soil Sci. Plant Nutr. 2017, 17, 794–807. [Google Scholar] [CrossRef]
  69. Zhang, Q.Q.; Zhou, J.J.; Huang, G.H.; Yang, G.; Liu, G.F.; Liang, K.N. Effects of thinning intensity on soil quality and growth of teak plantation. For. Res. 2021, 34, 127–134. (In Chinese) [Google Scholar]
  70. Prommer, J.; Wanek, W.; Hofhansl, F.; Trojan, D.; Offre, P.; Urich, T.; Schleper, C.; Sassmann, S.; Kitzle, B.; Soja, G.; et al. Biochar decelerates soil organic nitrogen cycling but stimulates soil nitrification in a temperate arable field trial. PLoS ONE 2014, 9, e86388. [Google Scholar] [CrossRef]
  71. Witzgall, K.; Vidal, A.; Schubert, D.I.; Höschen, C.; Schweizer, S.A.; Buegger, F.; Pouteau, V.; Chenu, C.; Mueller, C.W. Particulate organic matter as a functional soil component for persistent soil organic carbon. Nat. Commun. 2021, 12, 4115. [Google Scholar] [CrossRef]
  72. Chenua, C.; Angersb, D.A.; Barré, P.; Derrien, D.; Arrouays, D.; Balesdent, J. Increasing organic stocks in agricultural soils: Knowledge gaps and potential innovations. Soil Tillage Res. 2019, 188, 41–52. [Google Scholar] [CrossRef]
  73. Yang, X.; Zhang, Y.; Liu, Q.; Guo, J.H.; Zhou, Q.C. Progress in the interaction of dissolved organic matter and microbes (1991–2020): A bibliometric review. Environ. Sci. Pollut. R. 2022, 29, 16817–16829. [Google Scholar] [CrossRef]
  74. Zhang, S.L.; Li, Z.J.; Liu, J.M.; Li, Q.H.; Yang, X.Y. Long-term effects of straw and manure on crop micronutrient nutrition under a wheat-maize cropping system. J. Plant Nutr. 2015, 38, 742–753. [Google Scholar] [CrossRef]
  75. Bolan, N.S.; Naidu, R.; Mahimairaja, S.; Baskaran, S. Influence of low-molecular-weight organic acids on the solubilization of phosphates. Biol. Fertil. Soils 1994, 18, 311–319. [Google Scholar] [CrossRef]
  76. Achat, D.L.; Morel, C.; Bakker, M.R.; Augusto, L.; Pellerin, S.; Gallet-Budynek, A.; Gonzalez, M. Assessing turnover of microbial biomass phosphorus: Combination of an isotopic dilution method with a mass balance model. Soil Biol. Biochem. 2010, 42, 2231–2240. [Google Scholar] [CrossRef]
  77. Jiang, C.; Zhu, B.; Zeng, H. Soil extracellular enzyme stoichiometry reflects the unique habitat of karst tiankeng and helps to alleviate the P-limitation of soil microbes. Ecol. Indic. 2022, 144, 109552. [Google Scholar] [CrossRef]
  78. Wang, Z.Q.; Zhao, M.Y.; Yan, Z.B.; Yang, Y.H.; Niclas, K.J.; Huang, H.; Mipan, T.D.; He, X.J.; Hu, H.F.; Wright, J. Global patterns and predictors of soil microbial biomass carbon, nitrogen, and phosphorus in terrestrial ecosystems. Catena 2022, 211, 1060377. [Google Scholar] [CrossRef]
  79. Insam, H.; Domsch, K.H. Relationship between soil organic carbon and microbial biomass on chronosequences of reclamation sites. Microb. Ecol. 1988, 15, 177–188. [Google Scholar] [CrossRef]
  80. Kaschuk, G.; Alberton, Q.; Hungria, M. Three decades of soil microbial biomass studies in Brazilian ecosystems: Lessons learned about soil quality and indications for improving sustainability. Soil Biol. Biochem. 2010, 42, 1–13. [Google Scholar] [CrossRef]
  81. Heuck, C.; Weig, A.; Spohn, M. Soil microbial biomass C:N:P stoichiometry and microbial use of organic phosphorus. Soil Biol. Biochem. 2015, 85, 119–129. [Google Scholar] [CrossRef]
  82. Zhao, Y.; Li, Y.L.; Yang, F. Critical review on soil phosphorus migration and transformation under freezing-thawing cycles and typical regulatory measurements. Sci. Total Environ. 2021, 751, 141614. [Google Scholar] [CrossRef]
  83. Zhang, D.S.; Kuzyakov, Y.; Zhu, H.T.; Alharbi, H.; Li, H.B.; Rengel, Z. Increased microbial biomass and turnover underpin efficient phosphorus acquisition by Brassica chinensis. Soil Tillage Res. 2022, 223, 105492. [Google Scholar] [CrossRef]
  84. Zhu, H.; Bing, H.J.; Wu, Y.H.; Sun, H.Y.; Zhou, J. Low molecular weight organic acids regulate soil phosphorus availability in the soils of subalpine forests, eastern Tibetan Plateau. Catena 2021, 203, 105328. [Google Scholar] [CrossRef]
  85. Hacker, M.; Ebeling, A.; Gessler, A.; Gleixner, G.; Macé, O.G.; Kroon, H.D.; Lange, M.; Mommer, L.; Eisenhauer, N.; Ravenek, J.; et al. Plant diversity shapes microbe-rhizosphere effects on P mobilisation from organic matter in soil. Ecol. Lett. 2015, 18, 1356–1365. [Google Scholar] [CrossRef] [PubMed]
  86. Gu, Y.; Wang, P.; Kong, C.H. Urease, invertase, dehydrogenase and polyphenoloxidase activities in paddy soil influenced by allelopathic rice variety. Eur. J. Soil Biol. 2009, 45, 436–440. [Google Scholar] [CrossRef]
  87. Vazqueza, E.; Benitoa, M.; Masaguera, A.; Espejo, R.; Díaz-Pinés, E.; Teutscherov, N. Long-term effects of no tillage and Ca-amendment on the activity of soil proteases and β-glucosidase in a Mediterranean agricultural field. Eur. J. Soil Biol. 2019, 95, 103135. [Google Scholar] [CrossRef]
Figure 1. The location of the study site.
Forests 14 02067 g001
Figure 2. Changes in soil microbial biomass carbon (MBC) (a), nitrogen (MBN) (c), phosphorus (MBP) (e), the quotient of microbial biomass carbon (qMBC) (b), nitrogen (qMBN) (d), and phosphorus (qMBP) (f) of different thinned E. grandis × E. urophylla coppices forests (mean ± SD, n = 3). Note: ns—no significant difference. Different lower-case letters indicate significant differences among the treatments (p < 0.05).
Forests 14 02067 g002
Figure 3. Effects of various thinning intensities on soil β-Glucosidase (BG) (a), urease (URE) (b), and acid phosphatase (ACP) (c) activities in E. grandis × E. urophylla coppices forests (mean ± SD, n = 3). Note: ns: no significant difference. Different lower-case letters indicate significant differences among the treatments (p < 0.05).
Forests 14 02067 g003
Figure 4. Regression analysis between AP and soil nutrients (ae) and enzyme activities (fh). Note: ***: p < 0.001. The confidence interval and fitting line were revealed at p < 0.05. Orange and depth green points were data in the 0–20 and 20–40 cm layers, respectively.
Forests 14 02067 g004
Figure 5. Regression analysis between AP and to microbial biomass (ac) and quotient of microbial biomass (df). Note: *: p < 0.05, ***: p < 0.001. The confidence interval and fitting line were revealed at p < 0.05. Orange and depth green points were data in 0–20 and 20–40 cm layers, respectively.
Forests 14 02067 g005
Figure 6. Partial least squares path model (PLS-PM) of soil nutrient, enzyme activity, microbial biomass, quotient of microbial biomass, and AP (a), and standardized direct, indirect, and total effect on AP of these indicators (b). Note: The numbers of the arrowed lines are path coefficients. Orange and deep green solid arrows indicate positive and negative significant (p < 0.05) paths, respectively. Gray dotted arrows represent a non-significant (p < 0.05) path. Red and blue arrows indicate positive and negative relationships, respectively, between measured variables and associated variables in measurement models of PLS-PM. *: p < 0.05, **: p < 0.01, ***: p < 0.001.
Forests 14 02067 g006
Table 1. Basic information of E. grandis × E. urophylla coppices forest on different thinnings.
IndexesT1T2T3T4CK
Slop gradient (°)2524232725
Slop aspectNorthwestNorthwestNorthwestNorthwestNorthwest
Elevation (m)302.1299.8304.5303.9304.6
Stand density (tree ha−1)28356683311161665
Canopy density0.350.550.700.820.96
Average tree height (m)26.2323.8723.5825.3724.67
Average diameter at breast height (cm)24.1719.5319.6019.4316.77
Stock volume (m3 ha)113.86148.41199.56259.27365.60
Soil bulk density (g cm−3)1.281.311.381.411.47
Soil total porosity (%)45.5643.4341.6940.4237.14
Soil water content (%)14.1415.1812.0811.9612.60
Soil pH4.294.094.174.114.25
Note: T1—83% intensity thinning; T2—66% intensity thinning; T3—50% intensity thinning; T4—33% intensity thinning; CK—Control.
Table 2. Changes in soil nutrient content and the p-value and F-value of different thinned E. urophylla × E. grandis coppices forests.
IndexesLayers (cm)T1T2T3T4CKFp
SOC
(g kg−1)
0–2011.62 ± 3.62 ns12.90 ± 2.51 ns10.72 ± 1.18 ns9.59 ± 1.30 ns9.46 ± 0.42 ns0.9170.491
20–408.55 ± 2.58 ns7.06 ± 1.66 ns6.56 ± 0.13 ns6.16 ± 0.10 ns7.37 ± 1.40 ns0.8660.516
DOC
(mg kg−1)
0–2020.40 ± 5.48 ns23.53 ± 5.17 ns18.01 ± 5.05 ns12.79 ± 3.37 ns17.74 ± 1.38 ns1.7330.219
20–408.89 ± 2.43 ns7.75 ± 1.00 ns10.11 ± 3.16 ns5.54 ± 0.83 ns7.87 ± 2.05 ns1.3070.332
TN
(g kg−1)
0–200.74 ± 0.19 ns0.78 ± 0.15 ns0.63 ± 0.04 ns0.60 ± 0.09 ns0.61 ± 0.04 ns0.9870.457
20–400.62 ± 012 ns0.49 ± 0.13 ns0.47 ± 0.01 ns0.48 ± 0.02 ns0.55 ± 0.05 ns1.1700.381
AN
(mg kg−1)
0–2038.76 ± 5.35 ns37.73 ± 7.41 ns34.65 ± 1.09 ns33.88 ± 1.09 ns34.39 ± 0.36 ns0.5640.694
20–4034.14 ± 7.23 ns30.29 ± 6.42 ns26.44 ± 0.96 ns24.90 ± 1.45 ns33.11 ± 1.66 ns1.6450.238
TP
(g kg−1)
0–200.38 ± 0.08 a0.31 ± 0.09 ab0.20 ± 0.02 b0.20 ± 0.02 b0.21 ± 0.05 b3.5730.047 *
20–400.26 ± 0.07 ns0.21 ± 0.06 ns0.18 ± 0.03 ns0.19 ± 0.00 ns0.20 ± 0.02 ns0.8210.541
AP
(mg kg−1)
0–201.29 ± 0.40 bc1.79 ± 0.38 a1.55 ± 0.27 ab0.77 ± 0.07 c0.78 ± 0.19 c5.0440.017 *
20–400.93 ± 0.27 ab1.26 ± 0.42 a0.76 ± 0.27 ab0.52 ± 0.07 b0.40 ± 0.09 b3.4980.049 *
Note: The lowercase letter indicates a significant difference (p < 0.05) between different thinning treatments in the same layer. T1—83% intensity thinning; T2—66% intensity thinning; T3—50 intensity thinning; T4—33% intensity thinning; CK—Control; SOC—Soil organic carbon; DOC—Dissolved organic carbon; TN—Total nitrogen; AN—Alkaline hydrolysable nitrogen; TP—Total phosphorus; AP—Available phosphorus; * and ns—significant difference at p < 0.05 and non-significant, respectively. (mean ± SD, n = 3).
Table 3. The F-value and p-value of one-way ANOVA of MBC, qMBC, MBN, qMBN, MBP, qMBP, BG, URE, and ACP in different thinning treatments and layers.
IndexesLayers (cm)Fp
MBC0–208.5280.003 **
20–4015.242<0.001 **
qMBC0–205.2020.016 *
20–405.7820.011 *
MBN0–201.2390.355
20–400.4030.802
qMBN0–204.1630.031 *
20–400.6130.663
MBP0–202.1550.148
20–408.8750.003 **
qMBP0–200.1910.937
20–408.0460.004 **
BG0–203.6040.046 *
20–403.8920.037 *
URE0–200.3440.409
20–401.4160.298
ACP0–200.9890.457
20–401.2320.357
Note: * and ** stand significance differences at p < 0.05 and p < 0.01, respectively.
Disclaimer/Publisher’s Note: The statements, opinions and data contained in all publications are solely those of the individual author(s) and contributor(s) and not of MDPI and/or the editor(s). MDPI and/or the editor(s) disclaim responsibility for any injury to people or property resulting from any ideas, methods, instructions or products referred to in the content.

