Abstract
Forest fires have become a habitual threat in all types of ecosystems, which is the reason why it is necessary to improve management of the territories and optimization of prevention and means of extinction. This study compares three machine learning techniques: logistic regression, logistic decision tree, and multivariate adaptive regression spline to identify areas susceptible to forest fires in the Loja canton. In the training of the machine learning models, a multitemporal database with 1436 points was used, fed with the information from seven variables related to fuel moisture, proximity to anthropic activities, and ground elevation. After analyzing the performance of the three models, better results were observed with the LMT, thus offering application ease for local decision-makers. The results show that the technique used allowed generating a model with a good predictive capacity and that the maps resulting from the model can be updated in short periods of time. However, it is necessary to highlight the lack meteorological data availability at the local level and to encourage future researchers to implement improvements in this regard.
1. Introduction
Forest fires are uncertain events, both in terms of their causes and impacts on ecosystems and the economy. Although some forest fires occur spontaneously, most of them are caused by human activities. Hence the importance of identifying the seasons and zones that represent greater risks to inform the citizens, warn the authorities, and streamline the available surveillance and extinction means. To such end, it is recommended to analyze the four basic factors involved in the occurrence of forest fires, namely: weather, type of vegetation cover, topography, and human activity. The first three factors have been analyzed in various publications, converging in that: when information on the fuel type of the vegetation is not available, it is possible to approximate it by using the vegetation spectral indices; the topography, with ground altitude, slope, and orientation factors; and the meteorological conditions, with relevant variables, such as temperature, relative humidity in the air, wind, rainfall, and water vapor pressure [1,2,3,4,5]. All these conditions have the potential to boost or, on the contrary, delay fire propagation [6].
Although forest fires occur in most of the biomes, in countries with Template-Mediterranean climates, especially in Europe and North America, the effect of the seasons is more accentuated, especially with the increase in temperatures and the reduction in rainfall volume [7]. These meteorological changes have driven the creation of several indices to determine the likelihood of fire occurrence in specific areas, with the National Fire Danger Rating System (NFDRS), the McArthur Forest Fire Danger Index (FFDI), the Canadian Forest Fire Weather Index System (FWI), and the Fire Potential Index (FPI) standing out [8]. All these indices use weather data as a basis [9,10,11,12] and, although they have been used for several decades to plan and manage forest fires in North American countries, they are not designed for Ecuadorian tropical zones nor do they include anthropic interaction measurements, as recommended by [13].
The study of forest fires evolves continuously following environmental and social changes. The first meteorological approaches were centered on the likelihood occurrence and on the locations’ susceptibility assessment with regression models, geographically weighted regression, or generalized additive regression [14]. In this sense, protocols for zoning the risk of fires following the Saaty multicriteria analysis methodology also became popular; such methodology allows designing hierarchization models to weight variables with the criteria of professionals from various areas and generate an equation that multiplies the value of each variable by the weight obtained in the technical analysis [15].
In the last decade, forest fire modeling has undergone significant advances thanks to the integration of machine learning algorithms, mainly Artificial Neural Networks (ANNs), Random Forests (RFs), and Supporting Vector Machines (SVMs) [13]. In parallel, the use of the maximum entropy (MaxEnt) algorithm has gained ground, which had, typically, been used in the analysis of species distribution and modeling of ecological niches [16]. The most recent trend is that of the forest fire simulation systems such as FARSITE, FSim, CFast, FlamMap, or Burn-P3, which allow for quantitative estimations of both ignition probability and fire propagation to guide fuel treatment as a forest management measure [17]. A more in-depth analysis of the forest fire modeling techniques can be found in these research studies [18,19,20]. Despite its easy application and interpretation, decision trees have been scarcely employed in similar studies, in which techniques such as ANN, SVMs, or RF have been preferred.
The extremely unstable fire behavior of forest fires is boosted by the topographical, geological, and climatic conditions characteristic of tropical and subtropical countries, such as Ecuador. The low seasonality throughout the year is due to the country’s location above the Ecuadorian line and is the reason why the difference between the regions is only defined in two seasons: wet or winter, and dry or summer [21]. Generally, in the Coastal region, the rain season begins in December and lasts until May, while the dry season is between June and November. In the Sierra and Amazonia region, there is rainfall from October to May, and the dry season extends between June and September, with slight differences in the North Amazonia (province of Sucumbíos), where the rainy season lasts from March to November and the dry season extends from December to February [22].
The altitude range is another conditioning factor for weather in inland Ecuador, since the topography generates a wide gradient of temperatures and exerts an influence on rainfall volume. Generally, the high areas receive low rainfall, while the low zones up to 2000 m.a.s.l. present an ample variation in annual rainfall volume [23]. This division caused by the pluviometric and thermal regimes makes it possible for forest fires to occur in almost all the months throughout the national territory.
As already mentioned, the meteorological variables (temperature, relative humidity, and accumulated rainfall) are habitually used as the cornerstone for the models of forest fire occurrence, regardless of the technique followed [5,24,25]. Some authors, such as [26], add to the analysis information about the vegetation cover, classifying it especially according to the type of fuel. In other models, the distance to access routes or other human infrastructures is also used [27], as well as forestry productivity or demographic density [28] for an approximation to the ignition risk in forest fires.
Although the meteorological variables are present practically in all the models, access to good resolution information in Ecuador is limited. There are several internet services offering weather information, although predominantly at broad scales and as weekly or monthly averages. Such is the case of the ERA5-Land collection [29] with monthly data regarding temperature, rainfall, atmospheric pressure, or wind speed at a resolution of 0.1 arc degrees (approximately 1.11 km). The TerraClimate [30] dataset offers a broader catalog of variables, the following among them: Actual and potential evapotranspiration, water deficit, soil moisture, accumulated rainfall, and the maximum and minimum temperatures of each month at a global level; however, it is only available in a 2.5-km scale. On its part, GLDAS-2.1 [31] offers more than 30 meteorological variables estimated every 3 h at a resolution of 0.25 arc degrees (approximately 25 km).
The experience of modeling the occurrence probability of forest fires in Ecuador is semi-empirical, and little has been published on the subject. The most relevant corresponds to the Metropolitan District of Quito (DMQ), in which case FlamMap software was used to simulate the spread of a forest fire that occurred in 2018 in the Atacazo hill. This study recognizes the lack of baseline information at the country level and how the performance of firefighters is affected by this gap. Other recommendations of the authors are the generation of mapping at local scale mapping with their own models, or, the use of factors that allow adapting or calibrating popular models in other areas of the world [32].
Is it possible to generate, using supervised learning techniques such as decision trees, logistic regression or MARS, a reliable model that allows obtaining fire probability maps periodically? To answer this question, this study was carried out in the Loja canton (province of Loja, Ecuador). The data were obtained from open sources, both to identify hot spots (fires) and explanatory variables. Once the database was generated, the three techniques mentioned above were applied to generate the model which was later validated using cross-validation.
This manuscript begins with an explanation of how to obtain the explanatory variables considered for the forest fire susceptibility model, as well as it is explained the importance analysis and other metrics that allow prioritizing variables and discarding multicollinearity. Aspects of the experimental design for training and validation in machine learning are later discussed. Being this a comparative article of the performance of three different techniques, a section that evaluates their performance and allows to choose a technique was drafted. Given the scarce application of machine learning models in the country, the discussion section recapitulates the most novel aspects of the research and compares it with available studies for similar contexts. The concluding paragraphs emphasize recommendations for future researchers and the challenges to follow after this research.
2. Materials and Methods
2.1. Study Area
Loja canton is a part of the province of Loja, located in southern Ecuador, and has an approximate area of 1928 km2. About 31% of the territory is used for agricultural activities (crops and/or animal breeding), 26% corresponds to remnants of native forest and, in a lower proportion, are other types of natural vegetation: 17% shrubs, 13% grass, and only 7% moors; on their turn, the urbanized zones correspond to 6% of the total area of the canton [33].
The average temperature varies from 57 °F (14 °C) in the rainiest months to 63 °F (17 °C) in the driest ones. The south-western part of the canton has higher temperatures (71 °F or 22 °C). In contrast, the north-eastern zone is characterized by low temperatures throughout the year (45 °F or 7 °C). In the central zone, the most urbanized sector, the average annual temperature is 61 °F or 16 °C; the coldest month is July (43 °F or 6 °C), and the hottest month is November (81 °F or 27 °C). A climate variable extremely related to temperature in the study area is humidity, whose ranges goes from 86% between December and July to 75% between August and November.
The average annual rainfall is 1300 mm, the areas that receive the least rainfall are the eastern areas; in terms of seasonality, the months with the least rainfall tend to be august or September, while the months with the highest rainfall are December, January, and February [34].
According to the last population and housing census, 2010, the canton Loja holds a population of 214,855 inhabitants (48% of the province of Loja). The capital Loja is the most populated with 180,617 inhabitants, followed by Malacatos (7114 inhabitants), Vilcabamba (4778 inhabitants), San Lucas (4673 inhabitants), and Taquil (3663 inhabitants). In terms of population density, the city of Loja and the parish capitals are the most populated; in contrast, the parishes of Jimbilla, Malacatos, San Pedro de Vilcabamba, Vilcabamba, and Yangana have extensive uninhabited areas (located to the south-east). Internal migration is a progressive phenomenon in the canton: currently, 80% of the territory is considered urban and only 20% rural.
The canton has multiple natural hazards throughout the year. In recent years, during the rainy season, were reported overflowing canals, landslides, and floods in several areas of the territory. The main risk in the canton is the increasing of forest fires in the driest months. According to official statistics of the National Service for Risk and Emergency Management (Servicio Nacional de Gestión de Riesgos y Emergencias, SNGRE), available since 2016, in 2020 more than 100 events a year were identified in the province of Loja, which represented between 13% and 39% of the burned area in the entire country [35].
The only fire risk map available is a model elaborated in 2014 by several governmental institutions. It uses Multicriteria Evaluation (MCE) techniques based on cartographic information of the fuel, temperature, rainfall, solar radiation, humidity, and cover-soil complex texture model [36]. Although it is the official country-scale model, it is based on subjective criteria, so it is not possible to evaluate its accuracy with objective parameters. As it is a static map, it does not reflect the constant changes that the canton has undergone during these eight years, both in anthropogenic activities and in the state of vegetation.
2.2. Preselection of Explanatory Variables and Generation of the Database
The model was generated based on data collected between 2015 and 2020 in a 5-km influence area around the canton limits. This period was selected due to the availability of Sentinel 2 information. 1910 hot spots (fires) were obtained from the data generated by the VIIRS [37] and MODIS [38] satellites, from which a random selection of 887 points was made. In addition, from Sentinel 2 images [38], 549 points of unburned sites and that were on dates close to those when the hot spots were recorded were identified (Figure 1). From these 1436 points and considering the dates on which the fire took place within the study period, a database with 23 variables related to the topography, vegetation, and proximity to human activities was generated, selecting the images immediately preceding occurrence of the event. These variables were reduced to eight after an importance analysis. The NDVI and NDMI indices were generated from Sentinel 2 imagery using the code editor of Google Earth Engine (GEE).
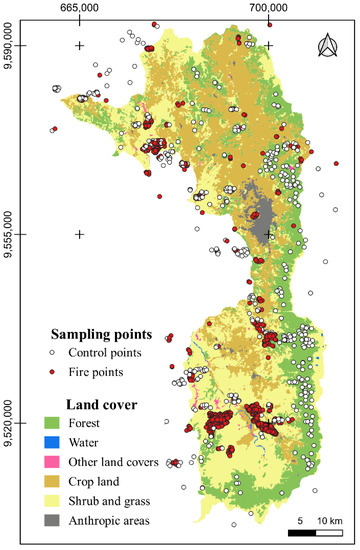
Figure 1.
Sampling points and location area.
2.3. Multi-Collinearity Checking of Forest Fire Influencing Variables
In order to test for multicollinearity, we applied the tolerance (Equation (1)), and VIF (variance inflation factor) (Equation (2)), of the R olsrr package [39], definided as:
where is the determining factor for the regression of explanatory variables and d concerns all other explanatory variables, and are the maximum and the kth eigen values, respectively. Tolerance < 0.1, VIF > 10 indicates serious collinearity problem [39,40,41,42].
2.4. Forest Fire Occurrence Probability Models
2.4.1. Logistic Regression (LR)
Logistic regression aims to predict, from independent variables, the probability (from 0 to 1) of occurrence (Equation (3)). The LR equation (Equation (4)) is as follows [43]:
where P is the probability of occurrence of the event (dichotomous variable); z is obtained from a linear combination of independent variables based on adjustment of maximum likelihood, with constant α, coefficient of partial lineal regression β, and original values of variables x.
2.4.2. Multivariate Adaptive Regression Spline (MARS)
Multivariate Adaptive Regression Splines (MARS) is a method developed for flexible modelling of high-dimensional data. This method uses classical linear regression, mathematical construction of splines, and binary partitioning to create a local model.
When the response y assumes only two values, linear logistic regression is used. The MARS model predicts a function using “basic function (BF)”, a linear combinations and interactions of the adaptive piecewise linear regression [44]. The basic function of MARS non-parametric regression is [45]:
where ε shows the error, f(x) is an unknown regression model that calculated by:
where is the coefficient of the constant basis function, is the coefficient of the basis function, is the basis function, and is the number of basic functions in the model.
2.4.3. Logistic Model Trees (LMT)
The logistic model tree is a classification model, which combines decision tree learning methods and logistic regression (LR). From the number of iterations, a simple regression function is adjusted using the attributes that generate the lowest error and incorporate it into an additive model. The optimum number of iterations is determined by means of cross-validation when performance of the model stops increasing. When no more improvements can be attained by adding more simple linear models, the data are divided, and boosting is resumed separately in each subset. This process takes the logistic model generated up to this moment and de-bugs it separately for the data in each subset. Cross-validation is once again performed in each subset to determine the suitable number of iterations to perform in this subset. To prevent data overfitting, a tree-pruning process is applied, producing smaller but very precise trees with linear-logistic models in the leaves. A more detailed explanation of the model can be found in [46].
2.5. Forest Fire Occurrence Probability Analysis
Data analysis applying (i) LR; (ii) MARS, and (iii) LMT. All models were executed in R using ‘caret’ package [47]. MARS was executed using additionally the ‘earth’ package [48], with the “backward” pmethod for prune the model, and 1 degree of interaction. And for LMT we use RWeka [49], the number of iterations was cross-validated, and the rest of the parameters used were those configured by default (Figure 2).
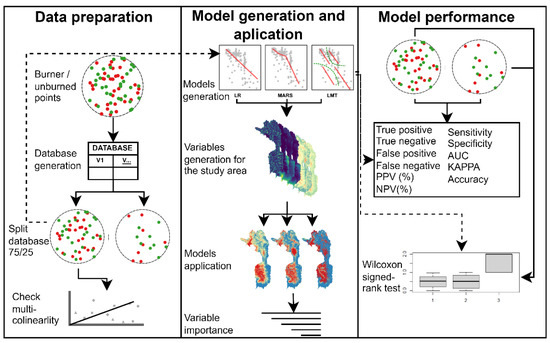
Figure 2.
Detailed explanation of the experimental design.
In addition, the variable importance was calculated using the Varimp command of the caret package in R software. For Varimp interpretation of each model, see the Caret package documentation [47].
2.6. Performance Assessment
Two tools were used to assess performance of the model, namely: Area Under the Curve (AUC) and Cohen’s Kappa Coefficient.
2.6.1. Area under the Curve
The ROC (Receiver Operating Characteristic) curve allows evaluating the ability of the trained model to classify information, regardless of the algorithm used or of the scale of the predictive variables. It measures the relationship between sensitivity (Equation (7)), or “rate of true positives”, and 1-specificity (Equation (8)), or “rate of false positives”.
TP = true positives, FN = false negatives.
Sensitivity = TP/((TP + FN))
Specificity = TN/((FP + TN))
In 1988, the forth some approximate parameters were set to classify precision [40] as follows: 0.50–0.60 = insufficient; 0.60–0.70 = poor; 0.70–0.80 = fair; 0.80–0.90 = good; and 0.90–1.00 = excellent [46].
2.6.2. Cohen’s Kappa Coefficient
The Kappa index was calculated, which is a statistical instrument that estimates agreement between two observers or measuring tools for the same phenomenon, with the intention of adjusting the random effect in the agreement proportion expected, as established by Equation (9) [50].
P0 = observed concordance ratio, and Pe = expected random matching concordance ratio.
Kappa = (P0 − Pe)/(1 − Pe)
The expected value of the Kappa coefficient takes on values between 0 and 1; where 1 represents perfect consistency. To intercept the results, the appraisal scale for the Kappa index proposed by [51] was adopted, which, with 0.2 intervals, proposes the following agreement levels: no agreement (0.00), insignificant (0.00–0.20), discreet (0.21–0.40), moderate (0.41–0.60), substantial (0.61–0.80), and almost perfect (0.81–1.00).
Once the models were generated, they were applied to the entire study area. Additionally, 5 categories were developed (very low: 0–0.2, low: 0.2–0.4, moderate: 0.4–0.6, high: 0.6–0.8, and very high: 0.8–1) using the equal interval method. NDVI and NDMI values for the month of August 2020 were used for this purpose, mainly because it is the month with the lowest cloud cover in Sentinel images. To compare the models, the percentage of estimated area within each of the categories was calculated.
Finally, positive predicted value (PPV) and negative predicted value (NPV) were calculated to determine the proportions of positive and negative results that are true positive and true negative results, respectively.
2.6.3. Wilcoxon Test Rank
With the aim of identifying statistically significant differences between the values observed in the training and test dataset and the results of each model, and to compare any statistically significant differences between the values generated by the models, the Wilcoxon signed-rank test was applied. According to this method, when the p-values are less than the significance level (0.05), the null hypothesis is rejected and, therefore, the performances of the models are significantly different [52].
3. Results
3.1. Multi-Collinearity Analysis
The multi-collinearity test showed strong multicollinearity problems among the variables ‘Accessibility from towns’ and ‘Accessibility from roads’. Once the variable ‘Accessibility from towns’ was eliminated, the achieved tolerance, and variance inflation factor (VIF) values below the upper and lower limits, respectively (Table 1). Therefore, no multicollinearity issues were identified for the seven variables tested (Figure 3).

Table 1.
Multicollinearity analysis in the current study.
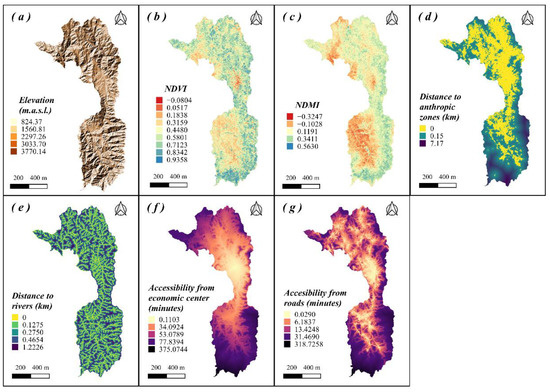
Figure 3.
Final selection of predictor variables for the susceptibility model. Five of these variables are permanent: elevation (a), distance to anthropic zones (d), distance to rivers (e), accessibility from economic center (f) and accessibility from roads (g) and correspond to an estimate of the proximity to human activities that represent a risk of smoldering ignition. The two updateable layers are the NDVI (b) and NDMI (c) vegetation indices, which provide information on the state of moisture and vitality of the vegetation cover throughout the year in the study area.
3.2. Forest Fire Occurrence Mapping Results
The maps generated by each model are shown in Figure 4. Additionally, a bar chart identifying the number of pixels assigned to each class is shown in each map. In the case of LR, the very low class has the largest area (32%), followed by low (21%), moderate (17%), high (15%), and very high (15%). For MARS, the dominant classes are very low (45%), and then very high (20%), although some areas are classified as low (13%), and finally moderate (13%) and high (13%). As for LMT, the largest proportion of area classified as very low has the largest area (59%), followed by very high (30%), while low percentages are classified as low (7%), high (3%), and moderate (2%) (Figure 4).

Figure 4.
Forest fire occurrence mapping using LR model (a), MARS model (b), and LMT model (c).
3.3. Variable Importance
The results of the variable importance are showed in the Table 2. According to it, for LR, the most important variables are humidity (NDMI), accessibility from roads and NDVI. Elevation, accessibility from economic center and distance to anthropic zones are of intermediate importance, while the least important variable, is the distance to rivers. For MARS, two variables have a strong weight, namely: humidity and elevation. NDVI and accessibility from roads are of intermediate importance, while accessibility from economic center, distance to anthropogenic zones, and distance to rivers are of less importance. For LMT, humidity, accessibility from roads, and elevation are the most important variables, followed by distance to anthropic zones, accessibility from economic center, distance to rivers, and, finally, NDVI, which are of less importance.
Table 2.
Variable importance of the forest fire occurrence independent variables using the varImp function from Caret package. In the three algorithms analyzed, the most important variable turned out to be the NDMI index; while the variable with the least impact for the models based on LR and MARS was Distance to anthropic zones, for the LMT algorithm the variable with least importance was the NDVI index.
3.4. Models’s Performance
The training and test result of the forest fire occurrence probability is shown in the Table 3. Using the training data, the LR model has a good ability to classify the information (AUC > 0.8), while the ability of MARS and LMT is excellent (AUC > 0.9). Regarding the degree of agreement measured with the kappa index, it is observed that the model generated by LR is moderate, while in the MARS and LMT models it is substantial, with LMT approaching near perfect. It is also observed that the LR model tends to generate a considerable number of false positives, which generates a positive predictive value (PPV) of 0.7632, and a lower accuracy than the other models. In contrast, LMT generates a low number of false positives, yielding a positive predictive value of 0.8894, and a model accuracy of 0.9017.
Table 3.
Performance of models generated by three statistical techniques. LR: logistic regression. MARS: Multivariate adaptive regression spline. LMT: Logistic model tree.
With the validation dataset, the overall accuracy of the models decreases, but they still maintain good classification accuracy (AUC between 0.8 and 0.9). As with the training data, in the validation data the kappa index is moderate for the LR model (0.4964) and substantial for the MARS and LMT models (0.6569 and 0.6642, respectively). While LR generates a considerable number of false positives, leading to a PPV d 0.7361 and an accuracy of 0.7482, the models generated by MARS and LMT still maintain PPV values and accuracy greater than 0.8.
The pairwise comparisons of the three models and the observed data are shown in Table 4. In both, the training and test databases, the models generated by LR and MARS show a significant difference with respect to the observed data, while LMT does not show a significant difference with respect to the observed data.
Table 4.
Results of the Wilcoxon signed rank test applied to the observed and predicted data generated by each model. Numbers within each cell represent the p-value associated with the null hypothesis being true: no difference between the data generated by a given pair of models. LR: logistic regression; MARS: multivariate adaptive regression splines; and LMT: logistic model tree.
Likewise, there are no significant differences between the data generated by the LR and MARS models, while the p-values allow us to infer that there are significant differences between LMT and the other two models, which leads us to conclude that the LMT model is significantly better than LR and MARS in this experiment.
4. Discussion
Our results demonstrate that nonparametric techniques (MARS and LMT) are able to generate more accurate models than traditional logistic regression models, such as LMT, for the identification of the probability of forest fire occurrence, nevertheless, this difference is statistically significant in LMT. The models obtained present a performance level that is similar to that of other studies that have used more complex techniques for the evaluation of risk events, such as forest fires or landslides. In the case of the Random Forests (RFs), its performance is generally high, with AUC values within the 0.80–0.90 range in similar studies conducted in Honduras and China, respectively [13,53]. On their turn, [54] generated a model based on Alternative Decision Trees (ADT) with an AUC value slightly higher than 0.9 and obtained AUC results slightly lower than that in our study when using other techniques, such as LMT, Functional Trees (FTs) and Naïve Bayes Tree (NBT).
One of the advantages of generating models with LMT and MARS is that they allow the generation of zones in which the variables that affect the probability of forest fire occurrence have a greater or lesser influence on the definition of this probability. Another greatest advantage in using LMT and MARS is its simplicity in the final application of the model since, unlike other alternatives such as random forests and artificial neural networks, there is no need to use software programs specialized in machine learning. Both the classification in subgroups and the application of the equations can be adapted to geographic information systems, thus facilitating its implementation by local decision-makers and visualization by citizens.
Part of the elements that ensure usefulness in the modeling processes are related to access to the initial data, as well as to the ease to implement the final model. Regarding the former, it is to be noted that, in our model, the use of weather variables was avoided due to the difficulty in permanent access to good resolution data in developing countries, as already verified by [55,56] in the case of Argentina by [57] at the regional level (South America). Although these research studies analyze several sources of meteorological variables, they all seem to reach the same conclusion: their spatial resolution is useful in large-scale modeling and, as the analysis scale increases, the importance of the meteorological variables decreases. In their absence, variables that result from the interaction of weather conditions were used, such as vegetation moisture (NDMI) and, to a certain extent, NDVI.
For the permanent application of susceptibility models based on satellite images, there is a common inconvenience, the shadows or masking caused by the presence of clouds on the capture date. For this, the recommendation is to build a tile free of clouds during longer periods of time [8,53,58]; or, if not possible, to remove the contaminated pixels, as was the case in this study, with the consequent information sacrifice to obtain more periodic maps. Finally, the incidence of human activities on the occurrence of forest fires was corroborated. Of the seven variables included in the model generated, four corresponded to proximity to anthropic zones. As stated by [59], the ecosystems located farthest away from human activities present more resilience to thermal stress and to sporadic ignition
5. Conclusions
In this study, the predictive ability of models based on LR, MARS, and LMT to determine the probability of forest fire occurrence was evaluated. Several experiments were conducted using a dataset that included a database of burned and unburned points and seven conditioning variables. The performance of the forest fire probability models was evaluated using ROC curves and statistical measures. The LMT and MARS classification models obtained higher AUC values for the training and validation datasets, but only LMT differed significantly in the statistical measures with respect to LR. Nevertheless, the MARS and LMT techniques are promising for mapping probability of forest fire occurrence. Additionally, vegetation moisture, represented by the variable MDMI, proved to be of highest importance in the models generated by the three techniques, while distance to anthropogenic zones was of a low importance in all three models. The accuracy of the forest fire probability model presented in this work, and the ease of obtaining geographic data to apply it, as well as the implementation of the results in more user-friendly environments, such as geographic information systems, make these results useful for the generation, in a simple and fast way, of permanently updated information on the probability of occurrence of forest fires by decision-makers.
Author Contributions
Conceptualization, F.R.-B.; methodology, F.R.-B.; software, F.R.-B., and J.L.-C.; validation, F.R.-B., and J.L.-C.; formal analysis, F.R.-B., and J.L.-C.; investigation, F.R.-B., and J.L.-C.; resources, F.R.-B., and J.L.-C.; data curation, F.R.-B., and J.L.-C.; writing—original draft preparation, F.R.-B., and J.L.-C.; writing—review and editing, F.R.-B., and J.L.-C.; visualization, F.R.-B., and J.L.-C.; supervision, F.R.-B.; project administration, F.R.-B.; funding acquisition, F.R.-B. All authors have read and agreed to the published version of the manuscript.
Funding
This research was funded by the Universidad Técnica Particular de Loja.
Conflicts of Interest
The authors declare no conflict of interest.
References
- Alcasena, F.V.; Ager, A.; Salis, M.; Nauslar, N.; Mendizabal, F.; Castell, R. Metodología de evaluación del riesgo de incendios forestales y priorización de tratamientos multifuncionales en paisajes mediterráneos. Cuad. Investig. Geográfica 2019, 45, 571–600. [Google Scholar] [CrossRef]
- Hidalgo Cantabrana, Í. Desarrollo de un Índice de Gravedad Potencial en Incendios Forestales. Master’s Thesis, University of Oviedo, Oviedo, Spain, 2016. [Google Scholar]
- León, J.; Echeverría, M. Aproximación, a partir de un modelo de vulnerabilidad, a técnicas de rehabilitación en zonas afectadas por incendios forestales. Análisis espacial y representación geográfica: Innovación y aplicación. In Proceedings of the XXIV Congreso de la Asociación de Geógrafos Españoles, Zaragoza, Spain, 28–30 October 2015; De La Riva, J., Ibarra, P., Montorio, R., Rodrigues, M., Eds.; Asociación de Geógrafos Españoles: Madrid, Spain, 2015; pp. 691–697. [Google Scholar]
- Pompa, M.; Vázquez, L.; Zapata, M.; Solís, R. Modelo conceptual del potencial de incendios forestales en Durango: Avances preliminares. Rev. Mex. Cienc. For. 2012, 3, 95–106. [Google Scholar]
- Vicente-López, F. Diseño de un Modelo de Riesgo Integral de Incendios Forestales Mediante Técnicas Multicriterio y su Automatización en Sistemas de Información Geográfica: Una Aplicación en la Comunidad Valenciana. Ph.D. Thesis, Universidad Politécnica de Madrid, Madrid, Spain, 2012. [Google Scholar]
- Seco Granja, R.A. Aplicación de un Sistema de Información Geográfica al Análisis de los Datos de Incendios Forestales en España; Universidad Politécnica de Madrid: Madrid, Spain, 2010. [Google Scholar]
- Moreira, F.; Ascoli, D.; Safford, H.; Adams, M.A.; Moreno, J.M.; Pereira, J.M.C.; Catry, F.X.; Armesto, J.; Bond, W.; González, M.E.; et al. Wildfire management in Mediterranean-type regions: Paradigm change needed. Environ. Res. Lett. 2020, 15, 011001. [Google Scholar] [CrossRef]
- Maffei, C.; Menenti, M. Predicting forest fires burned area and rate of spread from pre-fire multispectral satellite measurements. ISPRS J. Photogramm. Remote Sens. 2019, 158, 263–278. [Google Scholar] [CrossRef]
- Burgan, R.E.; Klaver, R.W.; Klaver, J.M. Fuel Models and Fire Potential from Satellite and Surface Observations. Int. J. Wildl. Fire 1998, 8, 159–170. [Google Scholar] [CrossRef]
- Dowdy, A.; Mills, G.; Groot, W. Australian Fire Weather as Represented by the McArthur Forest Fire Danger Index and the Canadian Forest Fire Weather Index. 2009. Available online: https://www.cawcr.gov.au/technical-reports/CTR_010.pdf (accessed on 22 August 2021).
- Huesca, M.; Litago, J.; Merino-de-Miguel, S.; Cicuendez-López-Ocaña, V.; Palacios-Orueta, A. Modeling and forecasting MODIS-based Fire Potential Index on a pixel basis using time series models. Int. J. Appl. Earth Obs. Geoinf. 2014, 26, 363–376. [Google Scholar] [CrossRef]
- National Wildfire Coordinating Group. NWCG NFDRS System Inputs and Outputs; National Wildfire Coordinating Group: Boise, ID, USA, 2021.
- Valdez, M.; Chang, K.-T.; Chen, C.-F.; Chiang, S.-H.; Santos, J. Modelling the spatial variability of wildfire susceptibility in Honduras using remote sensing and geographical information systems. Geomat. Nat. Hazards Risk. 2017, 8, 1–17. [Google Scholar] [CrossRef]
- Leuenberger, M.; Parente, J.; Tonini, M.; Pereira, M.G.; Kanevski, M. Wildfire susceptibility mapping: Deterministic vs. stochastic approaches. Environ. Model. Softw. 2018, 101, 194–203. [Google Scholar] [CrossRef]
- IDEAM. Protocolo Para la Realización de Mapas de Zonificación de Riesgos a Incendios de la Cobertura Vegetal—Escala 1:100.000; IDEAM: Bogotá, Colombia, 2011.
- Tracy, J.L.; Trabucco, A.; Lawing, A.M.; Giermakowski, J.T.; Tchakerian, M.; Drus, G.M.; Coulson, R.N. Random subset feature selection for ecological niche models of wildfire activity in Western North America. Ecol. Modell. 2018, 383, 52–68. [Google Scholar] [CrossRef]
- Zigner, K.; Carvalho, L.M.V.; Peterson, S.; Fujioka, F.; Duine, G.-J.; Jones, C.; Roberts, D.; Moritz, M. Evaluating the Ability of FARSITE to Simulate Wildfires Influenced by Extreme, Downslope Winds in Santa Barbara, California. Fire 2020, 3, 29. [Google Scholar] [CrossRef]
- Jain, P.; Coogan, S.C.P.; Subramanian, S.G.; Crowley, M.; Taylor, S.; Flannigan, M.D. A review of machine learning applications in wildfire science and management. Environ. Rev. 2020, 28, 478–505. [Google Scholar] [CrossRef]
- Costafreda-Aumedes, S.; Comas, C.; Vega-Garcia, C. Human-caused fire occurrence modelling in perspective: A review. Int. J. Wildl. Fire 2017, 26, 983. [Google Scholar] [CrossRef]
- Oliveira, S.; Rocha, J.; Sá, A. Wildfire risk modeling. Curr. Opin. Environ. Sci. Health 2021, 23, 100274. [Google Scholar] [CrossRef]
- Pourrut, P. Los Climas del Ecuador—Fundamentos Explicativos; Orstom: Quito, Ecuador, 1983. [Google Scholar]
- Barros, J.G.; Troncoso, A.Y. Atlas Climatológico del Ecuador; Escuela Politécnica Nacional: Quito, Ecuador, 2010. [Google Scholar]
- Cedeño, J.; Donoso, M.C. Atlas pluviométrico del Ecuador. In Programa Hidrológico Internacional de la UNESCO para América Latina y el Caribe; UNESCO: Paris, France, 2010; Volume 21, pp. 1–86. [Google Scholar]
- Álvarez, E.; García, M.A.; Fuente, C. De la Nuevo índice de riesgo de incendios forestales para Aragón. In Proceedings of the III Congreso Forestal Español, Granada, Spain, 25–28 September 2001. [Google Scholar]
- Serra, M.; Plana, E.; Cerdan, R. La integración del riesgo de incendios forestales en el urbanismo: Una aproximación normativa, analítica y práctica para el caso de Cataluña. In Proceedings of the XI Seminario Internacional de Investigación en Urbanismo, Barcelona-Santiago de Chile, Spain, 2–6 September 2019. [Google Scholar]
- Keane, R.E.; Gray, K.; Davis, B.; Holsinger, L.M.; Loehman, R. Evaluating ecological resilience across wildfire suppression levels under climate and fuel treatment scenarios using landscape simulation modelling. Int. J. Wildl. Fire 2019, 28, 533–549. [Google Scholar] [CrossRef]
- Vargas-Sanabria, D.; Campos-Vargas, C. A wildfires vulnerability model for Guanacaste Conservation Area, Costa Rica. UNED Res. J. 2018, 10, 435–446. [Google Scholar] [CrossRef]
- Carrillo García, R.L.; Rodríguez Trejo, D.A.; Tchikoué, H.; Rivas, M.; Ismael, A.; Santillan Pérez, J. Análisis espacial de peligro de incendios forestales en Puebla. México Interciencia 2012, 37, 678–683. [Google Scholar]
- Muñoz-Sabater, J.; Dutra, E.; Agustí-Panareda, A.; Albergel, C.; Arduini, G.; Balsamo, G.; Boussetta, S.; Choulga, M.; Harrigan, S.; Hersbach, H.; et al. ERA5-Land: A state-of-the-art global reanalysis dataset for land applications. Earth Syst. Sci. Data 2021, 13, 4349–4383. [Google Scholar] [CrossRef]
- Abatzoglou, J.; Dobrowski, S.; Parks, S.; Hegewisch, K. Monthly Climate and Climatic Water Balance for Global Terrestrial Surfaces; University of Idaho: Moscow, Idaho, 1958. [Google Scholar]
- NASA. Global Land Data Assimilation System; NASA: Washington, DC, USA, 2000.
- Mollocana Lara, J.G.; Álvarez Mendoza, C.I.; Jaramillo Coronel, L.J. Evaluación de información relacionada con combustibles en el Distrito Metropolitano de Quito para el modelado y simulación de incendios forestales, caso de estudio: Incendio del cerro Atacazo. La Granja 2021, 34, 45–62. [Google Scholar] [CrossRef]
- MAATE. Mapa Interactivo del Ministerio de Ambiente, Agua y Transición Ecológica; MAATE: Quito, Ecuador, 2018. [Google Scholar]
- SmartLand; UTPL. Observatorio de Clima. Available online: https://vinculacion.utpl.edu.ec/es/observatorios/clima (accessed on 15 March 2021).
- SNGRE. Informe de Situación por Incendios Forestales; SNGRE: Loja, Ecuador, 2021. [Google Scholar]
- Instituto Geográfico Militar Los eventos Antrópicos. Tema: Incendios. In Atlas de Espacios Geográficos Expuestos a Amenazas Naturales y Antrópicas; Ministerio de Defensa Nacional, Comando Conjunto de las Fuerzas Armadas, Ejército Ecuatoriano, Secretaria de Gestión de Riesgos, Eds.; Instituto Geográfico Militar: Quito, Ecuador, 2018; pp. 107–113. [Google Scholar]
- NASA. Visible Infrared Imaging Radiometer Suite; NASA: Washington, DC, USA, 2011.
- NASA. Moderate Resolution Imaging Spectroradiometer; NASA: Washington, DC, USA, 1999.
- Hebbali, A. Package ‘Olsrr’ Version 0.5.3; CRAN, 2017. Available online: https://cran.r-project.org/web/packages/olsrr/olsrr.pdf (accessed on 22 August 2021).
- Arabameri, A.; Asadi Nalivan, O.; Saha, S.; Roy, J.; Pradhan, B.; Tiefenbacher, J.P.; Thi Ngo, P.T. Novel Ensemble Approaches of Machine Learning Techniques in Modeling the Gully Erosion Susceptibility. Remote Sens. 2020, 12, 1890. [Google Scholar] [CrossRef]
- Zhao, X.; Chen, W. Optimization of Computational Intelligence Models for Landslide Susceptibility Evaluation. Remote Sens. 2020, 12, 2180. [Google Scholar] [CrossRef]
- Senaviratna, N.A.M.R.; Cooray, T.M.J.A. Diagnosing Multicollinearity of Logistic Regression Model. Asian J. Probab. Stat. 2019, 5, 1–9. [Google Scholar] [CrossRef]
- Nhongo, E.J.S.; Fontana, D.C.; Guasselli, L.A.; Bremm, C. Probabilistic modelling of wildfire occurrence based on logistic regression, Niassa Reserve, Mozambique. Geomat. Nat. Hazards Risk 2019, 10, 1772–1792. [Google Scholar] [CrossRef]
- Park, S.; Hamm, S.-Y.; Jeon, H.-T.; Kim, J. Evaluation of Logistic Regression and Multivariate Adaptive Regression Spline Models for Groundwater Potential Mapping Using R and GIS. Sustainability 2017, 9, 1157. [Google Scholar] [CrossRef]
- Mosavi, A.; Golshan, M.; Janizadeh, S.; Choubin, B.; Melesse, A.M.; Dineva, A.A. Ensemble models of GLM, FDA, MARS, and RF for flood and erosion susceptibility mapping: A priority assessment of sub-basins. Geocarto Int. 2020, 35, 1–20. [Google Scholar] [CrossRef]
- Witten, I.; Frank, E.; Hall, M.; Pal, C. Data Mining: Practical Machine Learning Tools and Techniques, 4th ed.; Morgan Kaufmann: Burlington, MA, USA, 2017; ISBN 978-0-12-804291-5. [Google Scholar]
- Kuhn, M. Building Predictive Models in R Using the caret Package. J. Stat. Softw. Artic. 2008, 28, 1–26. [Google Scholar] [CrossRef]
- Milborrow, S. Derived from Mda: Mars by Trevor Hastie and Rob Tibshirani. Uses Alan Miller’s Fortran Utilities with Thomas Lumley’s Leaps Wrapper, Earth: Multivariate Adaptive Regression Splines, R Package Version 4.4. 4; The Comprehensive R Archive Network, 2021. Available online: https://cran.r-project.org/web/packages/earth/earth.pdf (accessed on 22 August 2021).
- Hornik, K.; Buchta, C.; Zeileis, A. Open-Source Machine Learning: {R} Meets {Weka}. Comput. Stat. 2009, 24, 225–232. [Google Scholar] [CrossRef]
- Landa, F.; Cruz, N.; Coria, G.; Rebolledo, G.; Hernández, S. El Índice Kappa de Cohen como Herramienta para la Reducción de Ruido de Información Cerebral en la Identificación de Niveles de Valencia. Puebla, Mexico. 2014. Available online: https://www.researchgate.net/publication/326316956_El_Indice_Kappa_de_Cohen_como_Herramienta_para_la_Reduccion_de_Ruido_de_Informacion_Cerebral_en_la_Identificacion_de_Niveles_de_Valencia (accessed on 22 August 2021).
- Landis, J.; Koch, G. The measurement of observer agreement for categorical data. Biometrics 1977, 33, 159–174. [Google Scholar] [CrossRef]
- Tien Bui, D.; Tuan, T.A.; Klempe, H.; Pradhan, B.; Revhaug, I. Spatial prediction models for shallow landslide hazards: A comparative assessment of the efficacy of support vector machines, artificial neural networks, kernel logistic regression, and logistic model tree. Landslides 2016, 13, 361–378. [Google Scholar] [CrossRef]
- Chen, W.; Xie, X.; Wang, J.; Pradhan, B.; Hong, H.; Tien Bui, D.; Duan, Z.; Ma, J. A comparative study of logistic model tree, random forest, and classification and regression tree models for spatial prediction of landslide susceptibility. Catena 2017, 151, 147–160. [Google Scholar] [CrossRef]
- Jaafari, A.; Zenner, E.K.; Pham, B.T. Wildfire spatial pattern analysis in the Zagros Mountains, Iran: A comparative study of decision tree based classifiers. Ecol. Inform. 2018, 43, 200–211. [Google Scholar] [CrossRef]
- Gavilan, S.; Pastore, J.I.; Uranga, J.; Ferral, A.; Lighezzolo, A.; Aceñolaza, P. Metodología operativa para la obtención de datos históricos de precipitación a partir de la misión satelital Tropical Rainfall Measuring Mission. Validación de resultados con datos de pluviómetros. Rev. Fac. Agron. 2019, 118, 105–115. [Google Scholar] [CrossRef][Green Version]
- Bontemp, M.; Rossi Lopardo, M.S.; Fernández Long, M.E.; Spennemann, P.C.; Gattinoni, N.N. Verificación de la precipitación estimada con información satelital y terrestre en un balance hidrológico. In Proceedings of the XVIII Reunión Argentina y IX Latinoamericana de Agrometeorología: RALDA, Parana, Brazil, 23–27 November 2020. [Google Scholar]
- Minetti, J.L.; Vargas, W.M.; Poblete, A.G.; de la Zerda, L.R.; Acuña, L.R. Regional droughts in southern South America. Theor. Appl. Climatol. 2010, 102, 403–415. [Google Scholar] [CrossRef]
- Younes, O.S.; Mousannif, H.; Al Moatassime, H. Predictive modeling of wildfires: A new dataset and machine learning approach. Fire Saf. J. 2019, 104, 130–146. [Google Scholar] [CrossRef]
- Vitolo, C.; Di Napoli, C.; Di Giuseppe, F.; Cloke, H.; Pappenberger, F. Mapping combined wildfire and heat stress hazards to improve evidence-based decision making. Environ. Int. 2019, 127, 21–34. [Google Scholar] [CrossRef]


Publisher’s Note: MDPI stays neutral with regard to jurisdictional claims in published maps and institutional affiliations. |
© 2022 by the authors. Licensee MDPI, Basel, Switzerland. This article is an open access article distributed under the terms and conditions of the Creative Commons Attribution (CC BY) license (https://creativecommons.org/licenses/by/4.0/).