Article

Changes in Soil Organic Carbon Concentration and Stock after Forest Regeneration of Agricultural Fields in Taiwan

1
School of Forestry and Resource Conservation, National Taiwan University, Taipei 106, Taiwan
2
Institute of Forest Research SB RAS, 660036 Krasnoyarsk, Russia
3
Joint FAO/IAEA Centre of Nuclear Techniques in Food and Agriculture, Soil and Water Management & Crop Nutrition Laboratory, 2444 Seibersdorf, Austria
*
Author to whom correspondence should be addressed.
Forests 2021, 12(9), 1222; https://doi.org/10.3390/f12091222
Submission received: 19 August 2021 / Revised: 4 September 2021 / Accepted: 5 September 2021 / Published: 8 September 2021
(This article belongs to the Special Issue Forest Soil Carbon and Climate Changes)

Abstract

:
Afforestation or abandonment of agricultural fields to forest regeneration is a method of sequestering carbon to offset the increasing atmospheric concentration of CO2. We selected 11 sites with altitudes ranging from 14 to 2056 m and with paired forest regenerated and adjacent agricultural fields. Our objectives were to (1) examine the changes in soil organic carbon (SOC) concentration and stock after forest regeneration of agricultural fields and (2) identify the factors related to elevation and adjacent agricultural practices that affect the SOC accumulation rate. Our results demonstrated overall increases in both SOC concentrations and stocks after forest regeneration of the abandoned agricultural fields. The average increase rates of SOC concentrations in the forest regenerated soil samples were 1.65 and 0.95 g C kg−1 at 0–10 and 10–20 cm depths, respectively, representing 101% and 65% increases relative to those in the soil samples from agricultural fields. The average accumulation rates of SOC stocks in the regenerated forests were 13.0 and 6.7 ton C ha−1 at the 0–10 and 10–20 cm depths, respectively, representing 96% and 62% increases relative to those in the agricultural soil samples. The average annual sequestration rate was 1.03 Mg C ha−1 year−1 for the top 0–20 cm soils, which is greater than that observed by previous reviews and meta-analyses. The tropical/subtropical climate, sampling soil depth, forest regeneration period, and tree species in this study are likely to have contributed to the high average SOC accumulation levels. In addition, the SOC stock accumulation rates were higher at low-elevation sites than at middle-elevation sites, which could also be attributed to the favorable climatic conditions at the low-elevation sites. Along with the build-up of carbon sequestration in the forest floor and tree biomass, the afforestation/abandonment of agricultural fields to forest regeneration appears to be a promising carbon offset mechanism.

1. Introduction

Because of the increase in global warming and the frequency of extreme climate events, our attention to the development of approaches for mitigating climate change has increased. Afforestation or abandonment of surplus arable lands contributes to the mitigation of the increasing atmospheric CO2 concentration [1]. Changing land use from agriculture to forest regeneration triggers a series of differences in soil carbon fluxes. Consequently, soil organic carbon (SOC) concentrations and stocks can be enhanced through increased biomass input and minor soil disturbance under forest regeneration [2,3].
Several reviews and meta-analyses have demonstrated the SOC sequestration potential after forest regeneration of agricultural fields in tropical zones [4,5], in temperate regions [6,7,8,9], and worldwide [2,3,10,11,12]. However, estimates of the SOC sequestration potential have varied considerably between studies. Some studies have demonstrated that forest regeneration could produce a decrease [13] or a minor change [14] in the soil C pool. Differences in climate, soil types, tree species, management practices, and forest regeneration durations influence the SOC sequestration potential. Thus, estimates of the SOC sequestration potential in previous studies may be limited to the extent of SOC changes in specific regions. Accordingly, a practical measurement approach is required for areas that are still misrepresented.
The precise estimation of SOC sequestration is essential in many aspects of soil management. For example, in the IPCC Good Practice Guidance for LULUCF, changes in SOC stock constitute one of five carbon pools identified as accounting for greenhouse gas emissions and removals on forest and agricultural lands converted to forest [1]. The annual changes in SOC stock are also integral to the “4 per 1000” initiative, which aims to increase SOC stocks to aid in halting the annual increase of CO2 in the atmosphere (http://4p1000.org, accessed on 5 September 2021). Moreover, determining the changes in SOC stock is crucial to strengthening soil management. Increasing SOC stocks can positively affect soil health, water retention, nutrient supply, and ecosystem services [15,16].
The connection between SOC changes and land-use change from agricultural fields to forest regeneration is still poorly quantified in Taiwan. The study by Lin et al. [17] is among the few studies reporting changes in SOC after land-use change from agricultural fields; nevertheless, the study by Lin et al. focused on sites confined to the lowlands. Examining possible SOC enhancement at a national scale requires the use of an extensive data set to estimate the SOC sequestration potential and reduce possible uncertainties robustly. Accordingly, this study selected 11 pairwise sites with forest regenerated and adjacent agricultural fields whose elevation gradient ranged from lowlands to montane areas. The wide geographic coverage of the study sites offered an ideal opportunity to examine changes in SOC concentration and stock after the forest regeneration of agricultural fields. Our objectives were to (1) examine the changes in SOC concentration and stock after forest regeneration of agricultural fields and (2) identify the factors related to elevation and adjacent agricultural practices that affect the SOC accumulation rate.

2. Materials and Methods

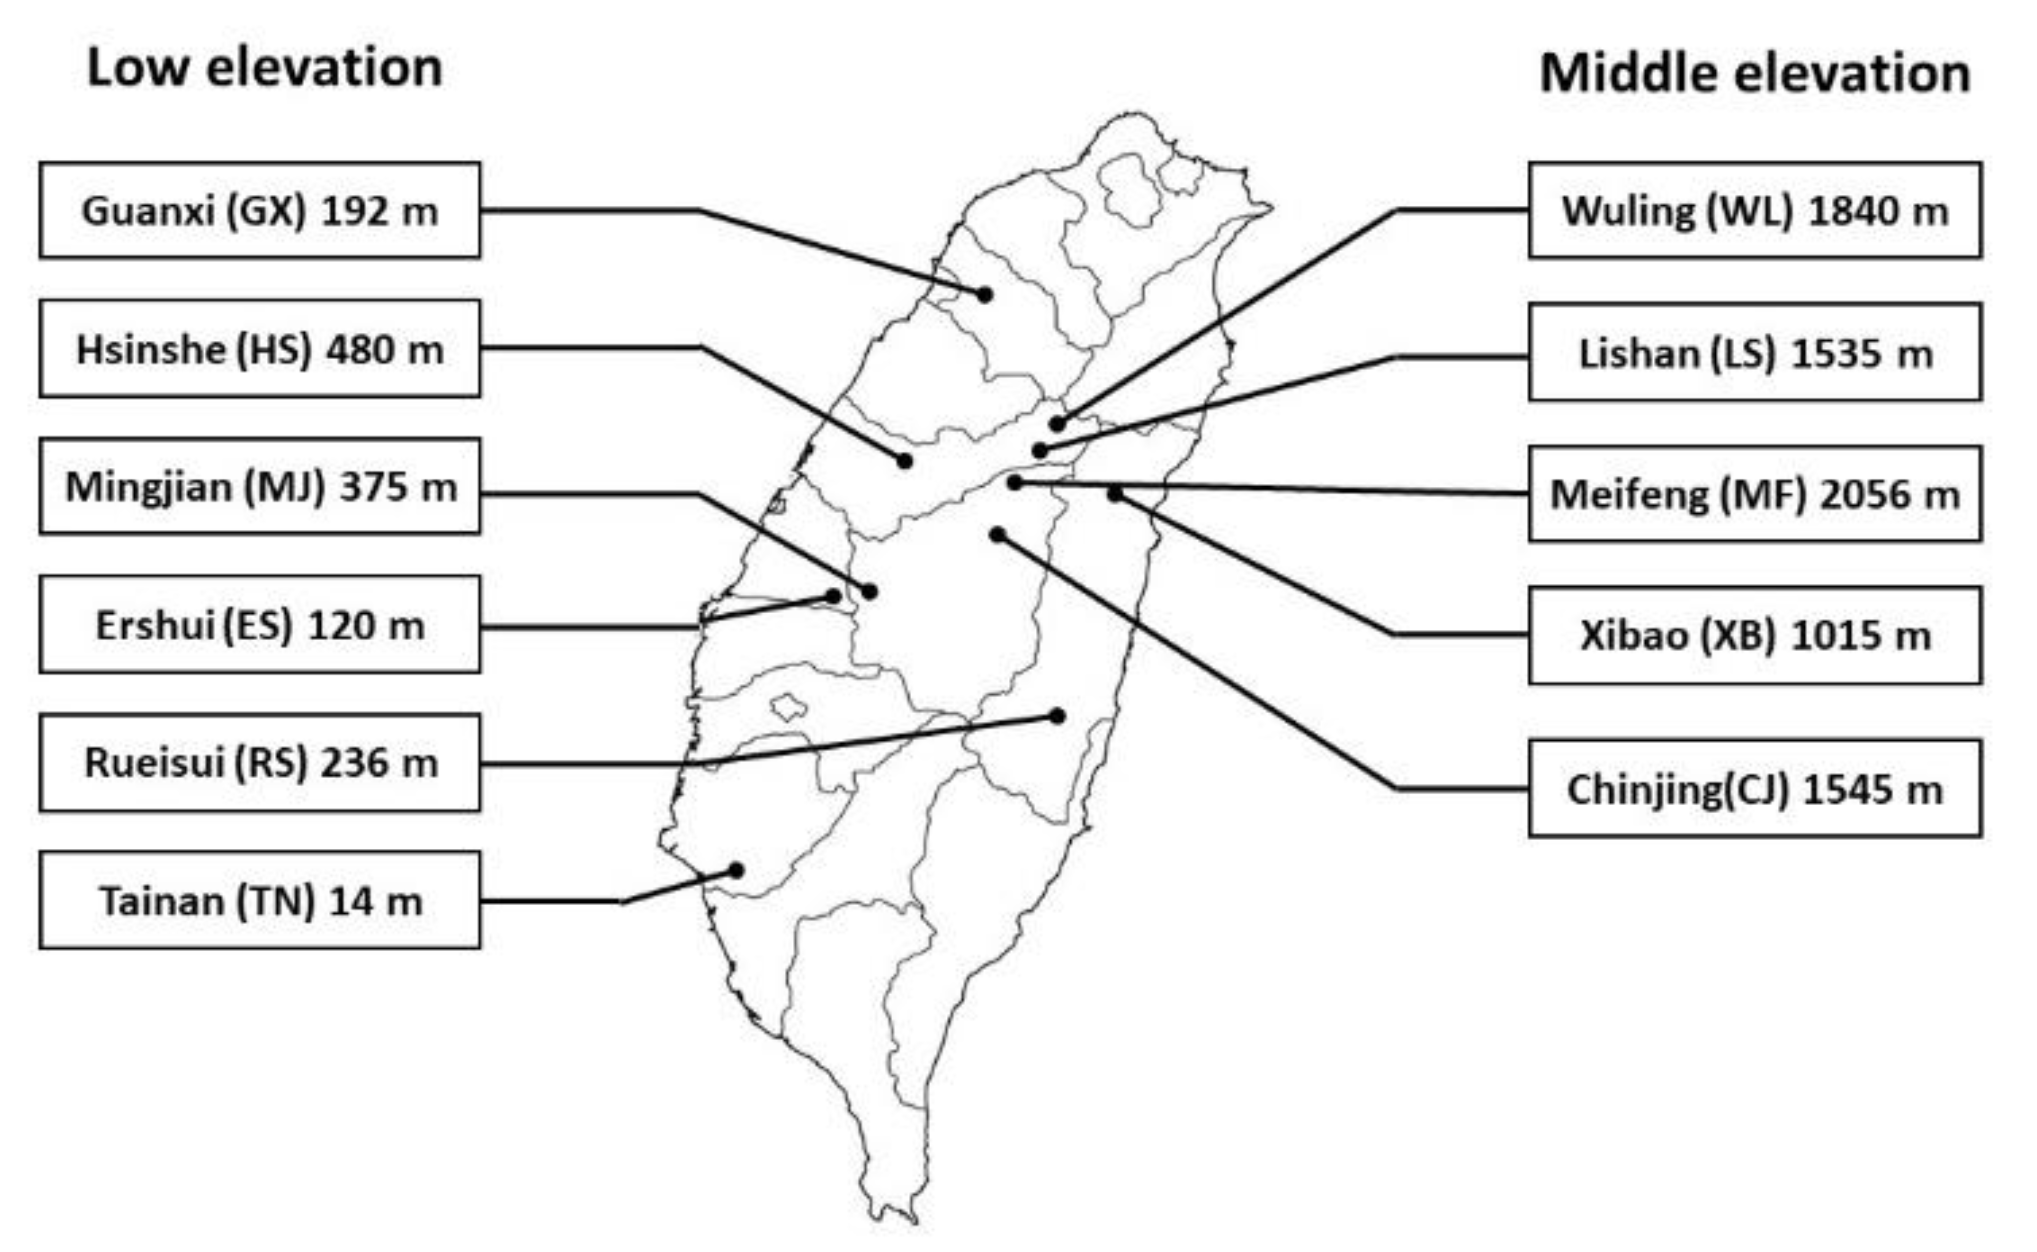
2.1. Study Sites and Sampling

The study was conducted in Taiwan, an island located at the subtropical and tropical climate zone boundary. The history of agriculture in Taiwan spans more than 250 years. Agricultural lands were initially developed in flat lowland plains and then gradually migrated to hillside and mountainous farming. The major framing systems involve the cultivation of rice and mixed vegetables in lowland plains, tea and fruits on hillslopes, and alpine orchards and vegetables in mountainous areas. Arable lands in Taiwan reached their maximum area size of 1.23 million ha in the 1980s, representing 34% of the total extent of agricultural land [18]. However, with socioeconomic changes and the evolution of attitudes toward forest conservation, some agricultural fields were abandoned or afforested afterward. For example, the dwindling numbers of farmers and other agricultural workers due to advancing age have stimulated the relinquishment of farming lands. Agricultural fields in mountainous areas may also be afforested/abandoned through conservation policy. These land-use conversions occurred across the island from low elevation fields to mountainous fields.
This study selected 11 study sites with elevations ranging from 14 to 2056 m (Figure 1). Each of the selected sites had paired land uses: agricultural fields and forest regenerated fields that were previously agricultural fields. We chose the study sites on the basis of the following criteria: (i) the site must contain both forest regenerated fields and nearby old agricultural fields, and both fields must exhibit similar soil and landscape characteristics; (ii) both fields must have available information on the conversion time and recent management practices; and (iii) the fields must be larger than 0.5 ha. Except for those at the Wuling (WL) site, the forest regenerated and old agricultural fields at all selected sites were next to each other or less than 100 m apart. At the WL site, the regenerated and agricultural fields were 2 km apart. However, we retained the WL site because it is an instructive example of the ecological value of the government policy of abandoning agricultural fields to reduce nutrient pollution and protect endangered fish species [19].
Table 1 presents the locations, climate characteristics, forest regeneration period (years), and vegetation/crop types of the selected study sites. The average forest regeneration period for the 11 sites was 21.1 years (range: 17–33 years). The mean annual temperature at the study sites ranged from 12.3 °C to 24.3 °C and decreased with elevation. The mean annual precipitation increased slightly from 1700 to 3200 mm with elevation due to the orographic effect. On the basis of elevation related to climate and agricultural background, the sites can be roughly classified as the low-elevation fields with altitudes below 1000 m above sea level and the middle-elevation fields with altitudes above 1000 m.
Vegetation present in the forest regenerated fields comprised afforested plantations (e.g., Meifeng site) or abandoned secondary forests (e.g., Xibao and Guanxi sites). All forest regenerated fields were composed of closed-canopy vegetation, except for the HS site, which maintained vegetation of scattered pioneer trees and dense bush. The agricultural fields included annual and perennial crops (e.g., tea field at Guanxi or orchards at Lushan). Historical aerial photos and interviews with the landowners indicated that the perennial crop fields and the corresponding forest regenerated fields had previously been tilled for row crops. We denote the afforested or naturally regenerated areas as “Forest regenerated (F)” fields due to their forest regeneration, and we denote the adjacent agricultural areas as “A” fields.

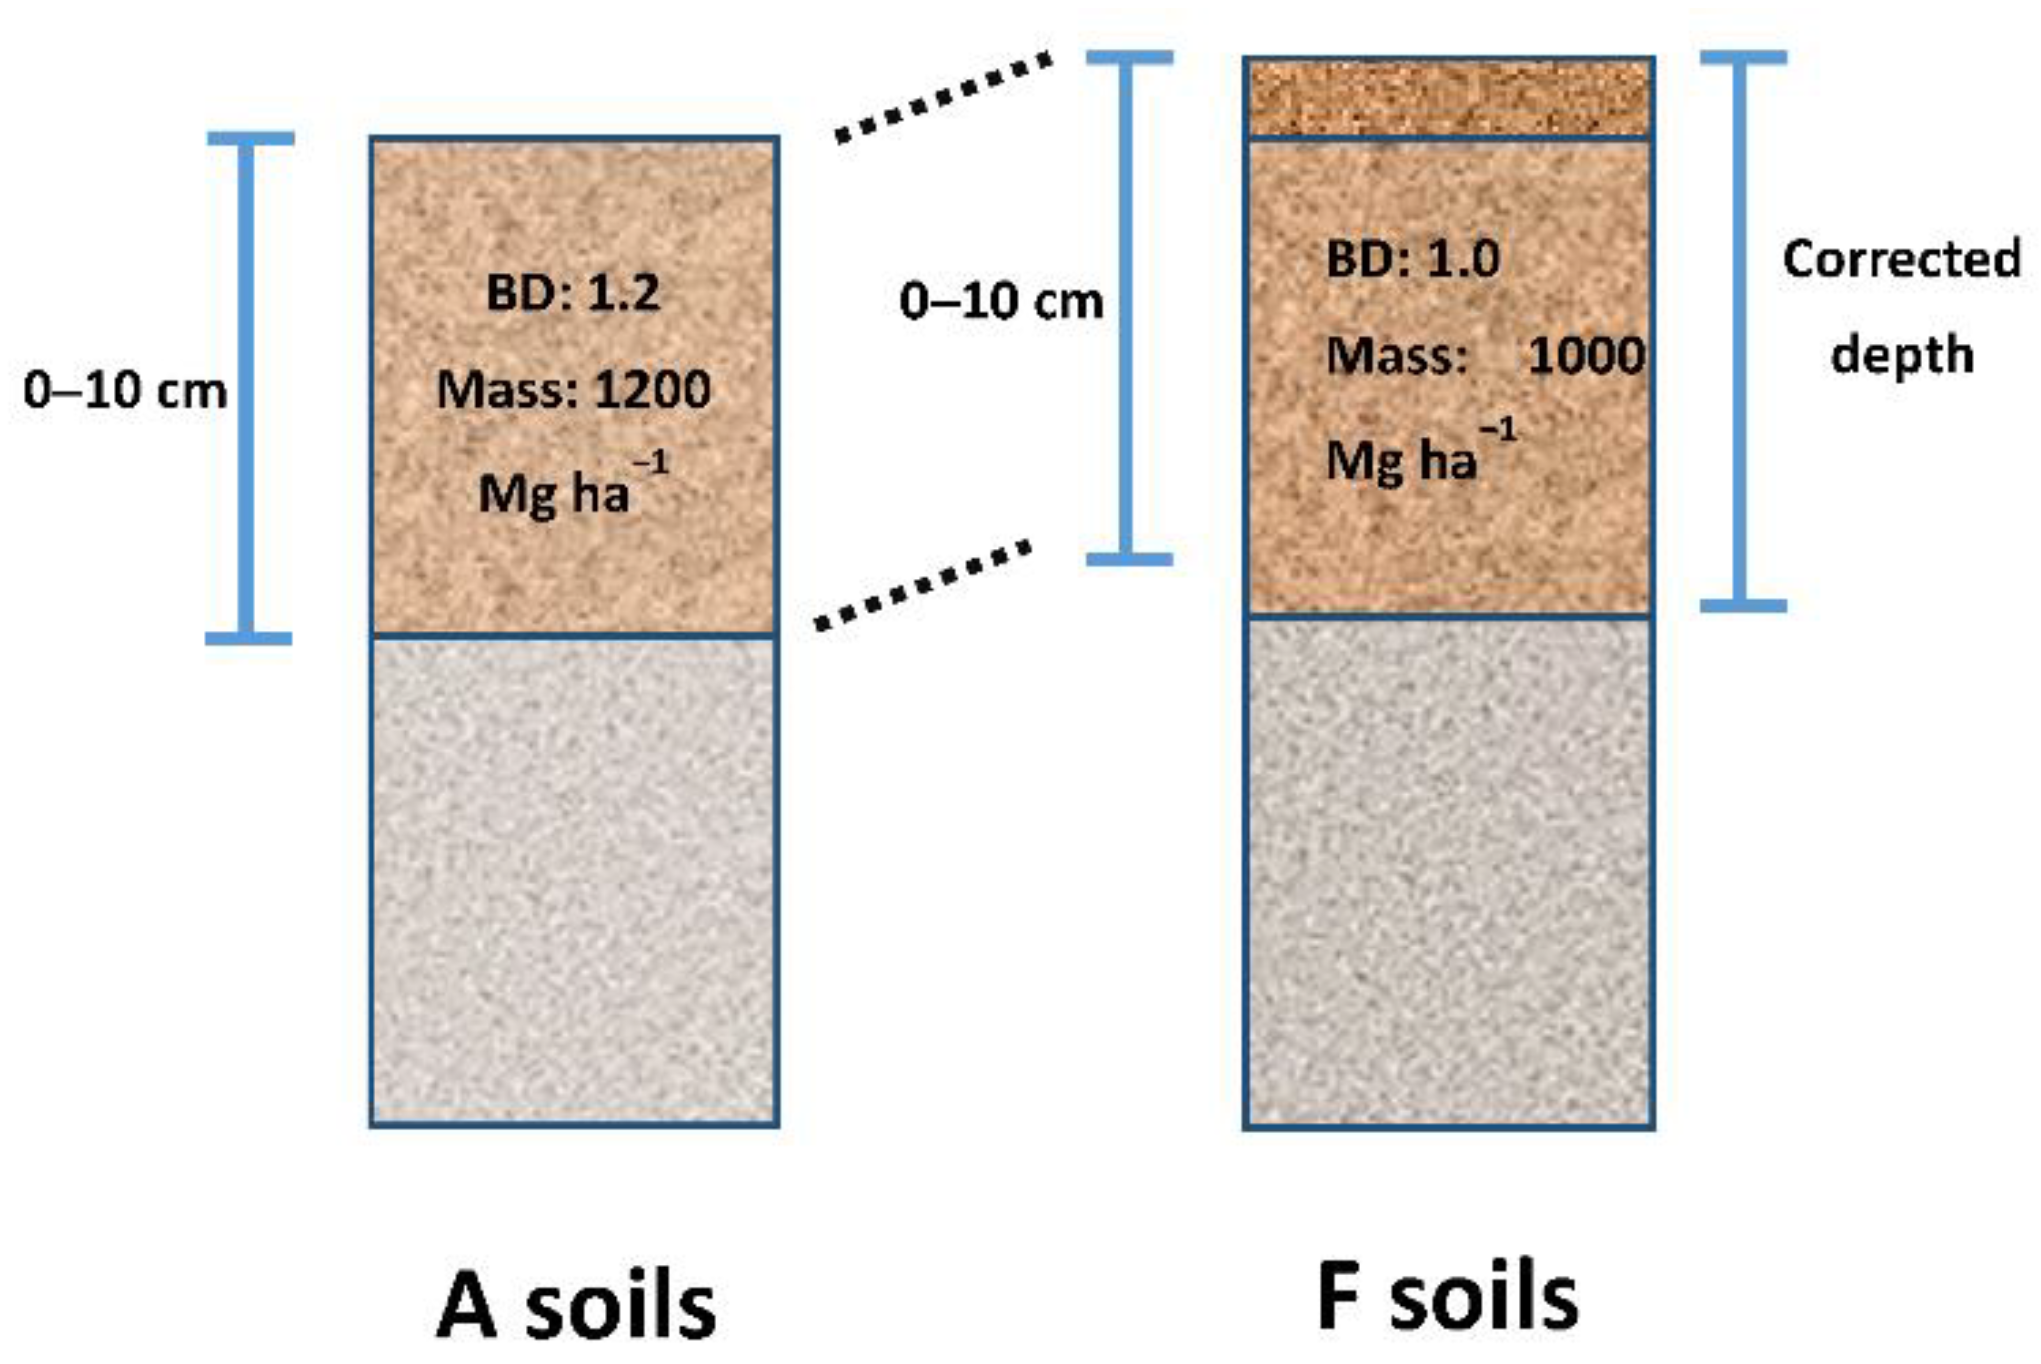
2.2. Soil Sampling and Measurements

Three 20 × 20 m2 plots were randomly established in the F and A fields at each site. In each plot, composite samples were collected from at least three sampling pits to reduce spatial heterogeneity. We collected samples at two soil depths: 0–10 cm (surface) and 10–20 cm (subsurface). We used a stainless core tool to collect undisturbed soil samples for determining the bulk density and percentage of rock fragments (particle size > 2 mm). We dug the soil pits and collected approximately 2 kg of soil for chemical analyses. The collected soil samples were packed in plastic zip-lock bags, transported to the laboratory, air dried, and ground for soil analyses.
Soil pH was measured using a glass electrode pH meter at a 2.5 soil/water ratio. Some soil samples were ball milled (MM 400, Retsch, Hann, Germany) and analyzed for SOC concentration by using an elemental analyzer (2400 Series II, Perkin Elmer, Norwalk, CT, USA). According to Thomas [20], inorganic carbon does not exist in soil with a pH lower than 7.6; therefore, the total carbon concentration could be considered the organic carbon concentration. Among the soil samples collected from the 11 study sites, only those collected from the WL site had a pH value higher than 7.6. The WL samples were treated with 1.2 M HCl to remove the inorganic carbon before the elemental analysis. The SOC stocks (ton C ha−1), expressed on an area basis, were calculated as follows:
SOC stocksi = SOCi × BDi × (1 − Ri(%)/100) × di × 10
where SOC stocks represent the SOC storage (ton C ha−1) at the ith layer (0–10 or 10–20 cm), SOCi represents SOC concentration (g kg−1), BDi represents the bulk density (g cm−3), Ri represents the percentage of rock fragments (%), di represents the depth of the soil layer (0.1 m), and 10 represents the unit conversion factor.
In F soil samples, the bulk density may substantially affect carbon balance calculation because F soil samples collected at a certain depth would not be directly comparable to A soil samples collected at the same depth [5,6]. Don et al. [5] suggested that land-use change effects would be underestimated by 28% without soil mass correction. The thickness of the F soil samples was adjusted to maintain the SOC stocks at an equivalent soil mass in both land-use types. Figure 2 illustrates the depth correction for the F soil samples, which was calculated as follows [21]:
SOC stocks (corrected) in F soils = SOC stocks (uncorrected) × (BDA/BDF)
where BDA and BDF represent the bulk density for A and F soils, respectively. We used the corrected SOC stocks to calculate the absolute changes in SOC stock between the F and A soil samples. The bulk density and percentage of rock fragments used for the calculation of SOC stocks are provided in Table S1 of the Supplementary Material. The SOC stocks calculated for the F sites without bulk density correction are also presented in Tables S2 and S3 of the Supplementary Material.
In addition to calculating the absolute changes in SOC concentration and stock, we determined the relative changes in SOC concentration and stock and the annual accumulation rates at each site. The relative changes in SOC in the F soil samples were calculated as follows [5]:
Relative change (%) = (SOCF − SOCA)/SOCA × 100%
where SOCA denotes the SOC concentrations or stocks in the A fields and SOCF denotes the SOC concentrations or stocks in the F fields. The annual SOC accumulation rate in the F soil samples was calculated as follows:
Annual SOC accumulation rate = (SOCF − SOCA)/t
where t represents the afforestation/abandonment period at each site (Table 1).

2.3. Statistical Analysis
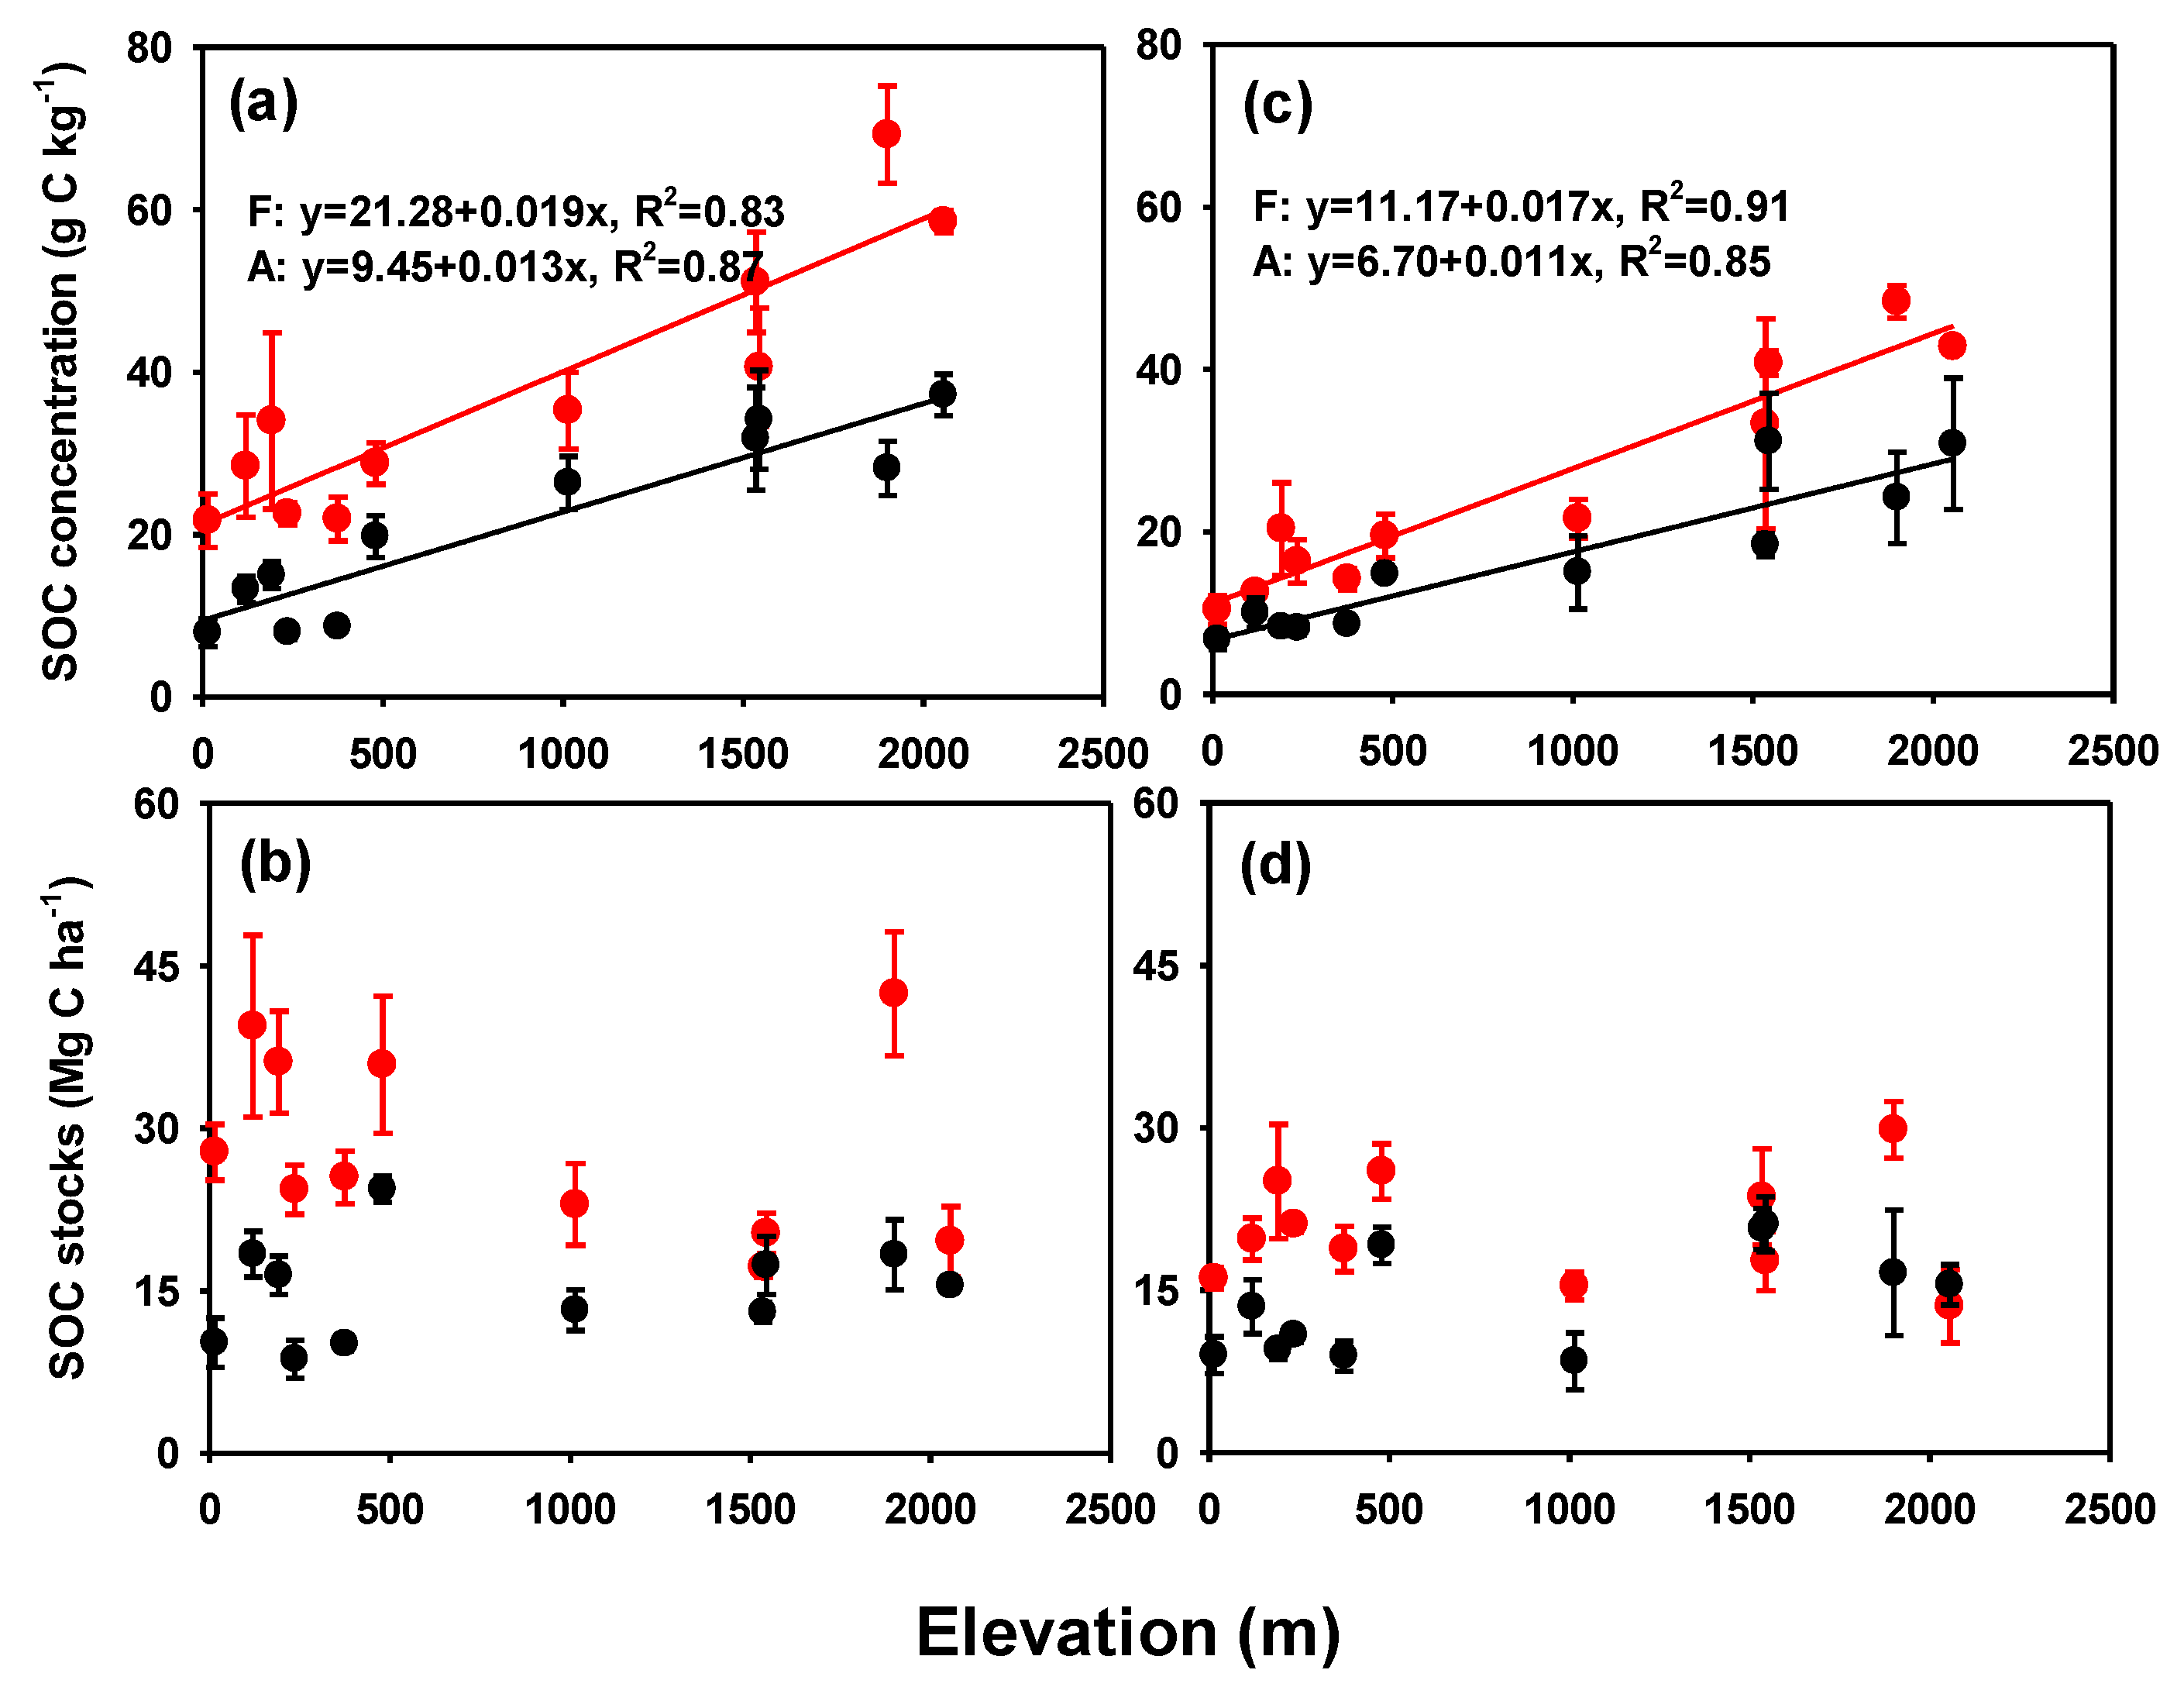
We used one-way analysis of variance (ANOVA) to determine the differences in soil properties between the forest regenerated and adjacent agricultural fields (p < 0.05). To test the overall changes across sites, a paired t test was applied to compare forest regenerated and adjacent agricultural fields. In addition, the differences between the low- and middle-elevation sites and those between the annual and perennial crop (e.g., LS, HS, and GX) sites were tested using one-way ANOVA by grouping the sites with the same subject. All statistical analyses were performed using SAS software.

3. Results

The SOC concentrations and stocks varied between the study sites. At the 0–10 cm depth, the SOC concentrations ranged from 7.9 to 37.2 g kg−1 in the A soil samples and from 21.7 to 69.2 g kg−1 in the F soil samples (Table 2). The SOC stocks ranged from 10.1 to 24.3 Mg C ha−1 in the A soil samples and from 18.5 to 34.9 Mg C ha−1 in the F soil samples. The SOC concentration and stocks at the 10–20 cm depth were lower than those at the 0–10 cm depth (Table 2). Figure 3 illustrates the relationships of SOC concentrations and stocks with elevation. The SOC concentrations increased with elevation in both the F and A soil samples collected at the 0–10 and 10–20 cm depths. However, no significant linear relationship was observed between the SOC stocks and elevation. The SOC stocks were more site specific rather than being related to elevation (Figure 3).
After 17–33 years of forest regeneration of agricultural fields, the F soil samples showed higher SOC concentrations and stocks than did the A soil samples (Table 2). At most of the study sites, the SOC concentrations and stocks were significantly greater in the F soil samples, particularly at the 0–10 cm depth. The paired t test indicated an overall significant increase in both SOC concentrations and stocks in the F soil samples. The average absolute change in SOC concentration in the F soil samples was 16.5 g C kg−1 at the 0–10 cm depth and 9.5 g C kg−1 at the 10–20 cm depth, accounting for 101% and 65% increases relative to those observed for the A soil samples, respectively (Table 3). The average accumulation rates of SOC stocks in the F soil samples were 13.0 and 6.7 ton C ha−1 at the 0–10 and 10–20 cm depths, respectively, accounting for 96% and 62% increases relative to those observed for the A soil samples. The annual increase rates of SOC concentrations were 0.81 and 0.48 g C kg−1 year−1 at the 0–10 and 10–20 cm depths, respectively, and the annual accumulation rates of SOC stocks were 0.68 and 0.35 ton C ha−1 year−1 at the 0–10 and 10–20 cm depths, respectively (Table 3).
Furthermore, the SOC stock accumulation rates were higher at the low-elevation sites than those at the middle-elevation sites (Table 4). The difference became more significant once the outlying WL site was excluded (Table 4). Except for the WL site, the average absolute SOC stock accumulation, relative change, and annual accumulation rates at the 0–20 cm depth were 12.6 ton C ha−1, 43%, and 0.66 ton C ha−1 year−1, respectively, at the middle-elevation sites and 25.7 ton C ha−1, 110%, and 1.35 ton C ha−1 year−1, respectively, at the low-elevation sites. In general, existing agricultural practices in A fields may affect their SOC sequestration potential, where the forest regeneration of less disturbed no-tilled agricultural fields may engender less C sequestration potential due to the relatively low disturbance of these fields [4,22]. However, we found no significant difference in SOC sequestration potential between the F sites and the adjacent A fields with annual or perennial crops (p > 0.05; Table 4).

4. Discussion

4.1. Forest Regeneration of Agricultural Fields

Our results reveal a clear increase in SOC concentrations and stocks after the forest regeneration of agricultural fields, confirming most of the findings of relevant studies [2,3,4,5,6,7,8,9,10,11,12]. We observed that the average SOC sequestration potential was 13.0 ton C ha−1 at the 0–10 cm depth and 6.7 ton C ha−1 at the 10–20 cm depth. Thus, the average absolute SOC sequestration potential was 19.7 (−0.48 to 25.39) ton C ha−1 in the soils within the 0–20 cm depth. The average annual sequestration rate was 1.03 Mg C ha−1 year−1 in the soils within the 0–20 cm depth. These results are consistent with those reported by Silver et al. [4], who conducted their study in the tropical region and proposed that soil C accumulated at a rate of 1.3 ton C ha−1 year−1. Nevertheless, the results are slightly higher than those reported by other reviews and meta-analyses [2,5,9,12]. For example, Post and Kwon [2], Li et al. [12], and Kampf et al. [9] reported that the average rate of soil C accumulation after afforesting was at 0.34–0.72 Mg C ha−1 year−1 in temperate regions and worldwide. Our results also indicate 96% and 62% increases in SOC stocks in the F soils at the 0–10 and 10–20 cm depths, respectively, after forest regeneration. These changing ratios are higher than those of other studies, where the worldwide SOC stocks increased by 18–53%, on average, after land-use conversion from crop production to secondary forestation or plantation [3,5,11].
The rates of SOC sequestration after forest regeneration depend on climate, length of land-use conversion, prior land use, soil clay content, sampling depth, and tree species; thus, such rates differ among sites and studies [3,5,6,10,11,12]. Nevertheless, the average SOC sequestration rate observed in this study is markedly higher than those reported by previous studies. Several mechanisms might explain this. First, the climatic conditions in the subtropical zone in Taiwan are favorable for plant growth; therefore, high carbon input rates enhance SOC accumulation [4,12]. Paul et al. [10], Laganiere et al. [11], and Li et al. [12] have reported a similar trend; that is, the rate of SOC accumulation increased to a greater extent in the tropical and subtropical climatic regions than in temperate areas. Second, our sampling depths were at 20 cm; soils at this depth are more prone to land-use change than those at greater depths. The higher SOC sequestration rates at the 0–10 cm depth in this study confirm the notion that soil carbon accumulation initially occurs in surface soils. Third, the average period of forest regeneration was 21 years in this study, which may reflect a fast sequestration rate during the aggrading stage of afforestation in tropical or subtropical regions [4]. Silver et al. [4] reported that the maximum rates of C accumulation were observed approximately 20 years after afforestation and slowed over time because of a limit on the amount of C that can accumulate per unit area. Fourth, the forest regenerated tree species involved in this study, particularly at the low-elevation sites, were broadleaf trees. Broadleaf forests were reported to accumulate more SOC stocks than do coniferous forests [11,16].
The change in SOC concentration was also significant after the forest regeneration of agricultural fields. The average increase in SOC concentrations in the F soil samples was 16.5 g C kg−1 at the 0–10 cm depth and 9.5 g C kg−1 at the 10–20 cm depth, accounting for annual increase rates of 0.81 and 0.48 g C kg−1 year−1 or 100% and 60%, respectively, relative to those in the A soil samples. These findings indicate a rapid enhancement of SOC concentrations after forest regeneration. As mentioned, the climate, sampling soil depth, forest regeneration period, and tree species may contribute to these high average levels. Therefore, understanding the corresponding changes in soil physical, chemical, and nutritional properties related to the increase of SOC concentration [16,23] warrants further research.
SOC concentration was linearly correlated with elevation in both the F and A fields. A similar linear correlation has been reported by other studies [24,25]. The decreasing temperatures that accompany increasing elevation reduce the decomposition rates of SOC and consequently increase the SOC concentration. In this study, we determined that elevation (natural factor) and land-use practices (human activities factor) were dominant factors influencing SOC concentrations in the F and A soil samples. The SOC concentrations increased by 19 and 17 g C kg−1 at the 0–10 and 10–20 cm depths, respectively, for every 1000-m increase in elevation in the F soil samples and by 13 and 11 g C kg−1 at the 0–10 and 10–20 cm depths, respectively, for every 1000-m increase in elevation in the A soil samples (Figure 3). The average differences in SOC concentration between the F and A soil samples were 16.5 and 9.5 g C kg−1 at the 0–10 and 10–20 cm depths, respectively, at all paired sites (Table 3). However, the SOC stocks did not correlate with elevation because the bulk density and percentage of rock fragments varied among sites and compensated for the increasing altitudinal trend of SOC concentration.

4.2. Elevation and Agricultural Practice Effects on SOC Stock Sequestration

Our results indicate overall increases in both SOC concentration and stock after the forest regeneration of agricultural fields. The results further reveal that differences in elevation significantly influenced the changes in SOC stock after the forest regeneration of agricultural fields. Higher SOC accumulation existed at the low-elevation sites compared with those at the middle-elevation sites. This tendency corresponds with previous research observations that SOC sequestration rates were higher in the tropical and subtropical regions than those in the temperate areas [10,11,12]. Broadleaf trees at the low-elevation sites were considered to be partially responsible for the higher SOC accumulation potential (Table 1). Hence, the high SOM accumulation at the low-elevation sites may be attributed to their favorable climate and broadleaf trees that lead to greater vegetation productivity and a faster carbon mineralization rate from litter [26].
Agricultural practices applied before or after abandonment have been reported to affect the SOC sequestration potential [4,9]. However, we found a similar SOC sequestration potential at the sites with adjacent A fields with annual or perennial crops. As mentioned, the perennial A fields had previously been tilled for row crops. The disturbances engendered by tillage may be sufficiently severe to obscure the effects of the relatively few disturbances engendered by perennial practices [4,22].

4.3. Implications of Afforestation/Abandonment of Agricultural Fields

In addition to forest regeneration of agricultural fields, management options available to sequester C in soils include the implementation of reduced and zero tillage, planting of perennial crops, and more efficient use of organic amendment [27,28,29]. In all types of agricultural management, the accumulation of agricultural fields after forest regeneration may represent the upper limits of mitigation potential [27]. The average annual SOC accumulation rate from forest regeneration of 3.7% (79% for a 21.1-year forest regeneration period) observed in the top 20 cm soil samples sufficiently surpasses the “4 per 1000” initiative [29,30]. Along with the build-up of ample carbon sequestration in forest floors and tree biomass [4,31,32], the afforestation/abandonment of agricultural fields should be considered a promising carbon offset mechanism. Moreover, forest regeneration provides multiple economic and ecological benefits.
At a national scale, the carbon sequestration potential in soils in Taiwan may represent only a fraction of the total quantity of carbon emissions from fossil fuel combustion [32,33]. If 10% of surplus agricultural fields, equivalent to 80,000 ha, were converted to forest regeneration, the total amount of C sequestration would be 80 × 103 ton C year−1, which could counteract less than 0.1% of total fossil fuel consumption. The low proportion is attributed to the substantial amounts of fossil fuels used for combustion in Taiwan [32]. Similarly, Smith et al. [27] proposed that afforestation of 30% of arable land in Europe would sequester only 0.8% of annual anthropogenic CO2. Considering the relatively minor portion from forest regeneration, comprehensive management practices to enhance CO2 sequestration or reduce CO2 emission are essential to mitigate the rising atmospheric CO2 concentration.

5. Conclusions

Our results demonstrate overall increases in both SOC concentrations and stocks after the abandonment/afforestation of agricultural fields. The average increase rates of SOC concentrations in F soil samples were 1.65 and 0.95 g C kg−1 at 0–10 and 10–20 cm depths, respectively, accounting for 101% and 65% increases relative to those in the A soil samples. The average accumulation rates of SOC stocks in the F soil samples were 13.0 and 6.7 ton C ha−1 at the 0–10 and 10–20 cm depths, respectively, accounting for 96% and 62% increases relative to those in the A soil samples. Thus, the annual accumulation rates of SOC stocks were 0.68 and 0.35 ton C ha−1 year−1 at the 0–10 and 10–20 cm depths, respectively. The average annual sequestration rate in the topsoil samples collected at the 0–20 cm depths was 1.03 Mg C ha−1 year−1, which is greater than those reported by other reviews and meta-analyses. We speculate that climate, sampling soil depth, afforestation/abandonment period, and tree species contributed to the high average levels. Along with the ample increase in carbon sequestration in the forest floor and tree biomass, the forest regeneration of agricultural fields should be viewed as a promising carbon offset mechanism.

Supplementary Materials

The following are available online at https://www.mdpi.com/article/10.3390/f12091222/s1, Table S1: Soil texture, pH, bulk density, and rock fragments in the study sites with paired forest regenerated and adjacent agricultural fields in Taiwan. Table S2: Soil organic carbon (SOC) concentration and stocks in forest regenerated (F) and adjacent agricultural (A) fields at surface 0–10 cm and subsurface 10–20 cm in Taiwan. Note that the SOC stocks in the F soils were not corrected with bulk density. Table S3: Absolute change, relative change, and annual accumulation rate of SOC concentration and stocks after afforestation/abandonment of agricultural fields. Note that the SOC stocks in the F soils were not corrected with bulk density.

Author Contributions

Y.-H.L. and C.-H.C. planned the study, analyzed the data, and developed the paper. P.-C.L. and O.V.M. aided the field study and provided input to the manuscript. All authors have read and agreed to the published version of the manuscript.

Funding

This study was supported by the Ministry of Science and Technology of Taiwan, a cooperative grant from the Ministry of Science and Technology of Taiwan and the Russian Foundation for Basic Research (RFBR), and the NTU Core Consortiums.

Data Availability Statement

The data used to support the findings of this study are available from the authors upon request.

Acknowledgments

This study was supported by the Ministry of Science and Technology of Taiwan, a cooperative grant from the Ministry of Science and Technology of Taiwan and the Russian Foundation for Basic Research (RFBR), and the NTU Core Consortiums. We gratefully acknowledge H.J. Ruan and C.Y. Chen for their assistance with field and lab work.

Conflicts of Interest

The authors declare that they have no competing interests.

References

  1. Watson, R.T.; Noble, I.R.; Bolin, B.; Ravindranath, N.H.; Verardo, D.J.; Dokken, D.J. Land Use, Land-Use Change and Forestry: A Special Report of the Intergovernmental Panel on Climate Change; Cambridge University Press: Cambridge, UK, 2000; p. 388. [Google Scholar]
  2. Post, W.M.; Kwon, K.C. Soil carbon sequestration and land-use change: Processes and potential. Glob. Chang. Biol. 2000, 6, 317–327. [Google Scholar] [CrossRef] [Green Version]
  3. Guo, L.B.; Gifford, R.M. Soil carbon stocks and land use change: A meta analysis. Glob. Chang. Biol. 2002, 8, 345–360. [Google Scholar] [CrossRef]
  4. Silver, W.L.; Ostertag, R.; Lugo, A.E. The potential for carbon sequestration through reforestation of abandoned tropical agricultural and pasture lands. Restor. Ecol. 2000, 8, 394–407. [Google Scholar] [CrossRef]
  5. Don, A.; Schumacher, J.; Freibauer, A. Impact of tropical land-use change on soil organic carbon stocks—A meta-analysis. Glob. Chang. Biol. 2011, 17, 1658–1670. [Google Scholar] [CrossRef] [Green Version]
  6. Poeplau, C.; Don, A.; Vesterdal, L.; Leifeld, J.; Van Wesemael, B.; Schumacher, J.; Gensior, A. Temporal dynamics of soil organic carbon after land-use change in the temperate zone–carbon response functions as a model approach. Glob. Chang. Biol. 2011, 17, 2415–2427. [Google Scholar] [CrossRef]
  7. Poeplau, C.; Don, A. Sensitivity of soil organic carbon stocks and fractions to different land-use changes across Europe. Geoderma 2013, 192, 189–201. [Google Scholar] [CrossRef]
  8. Barcena, T.G.; Kiar, L.P.; Vesterdal, L.; Stefansdottir, H.M.; Gundersen, P.; Sigudsson, B.D. Soil carbon stock change following afforestation in Northern Europe: A meta-analysis. Glob. Chang. Biol. 2014, 20, 2393–2405. [Google Scholar] [CrossRef]
  9. Kämpf, I.; Hölzel, N.; Störrle, M.; Broll, G.; Kiehl, K. Potential of temperate agricultural soils for carbon sequestration: A meta-analysis of land-use effects. Sci. Total Environ. 2016, 566–567, 428–435. [Google Scholar] [CrossRef]
  10. Paul, K.I.; Polglase, P.J.; Nyakuengama, J.G.; Khanna, P.K. Change in soil carbon following afforestation. For. Ecol. Manag. 2002, 168, 241–257. [Google Scholar] [CrossRef]
  11. Laganiere, J.; Angers, D.A.; Pare, D. Carbon accumulation in agricultural soils after afforestation: A meta-analysis. Glob. Chang. Biol. 2010, 16, 439–453. [Google Scholar] [CrossRef]
  12. Li, D.; Niu, S.; Luo, Y. Global patterns of the dynamics of soil carbon and nitrogen stocks following afforestation: A meta-analysis. New Phytol. 2012, 195, 172–181. [Google Scholar] [CrossRef]
  13. Vesterdal, L.; Ritter, E.; Gundersen, P. Change in soil organic carbon following afforestation of former arable land. For. Ecol. Manag. 2002, 169, 137–147. [Google Scholar] [CrossRef]
  14. Richter, D.D.; Markewitz, D.; Trumbore, S.E.; Wells, C.G. Rapid accumulation and turnover of soil carbon in a re-establishing forest. Nature 1999, 400, 56–58. [Google Scholar] [CrossRef] [Green Version]
  15. Lal, R. Soil carbon sequestration impacts on global climate change and food security. Science 2004, 304, 1623–1627. [Google Scholar] [CrossRef] [PubMed] [Green Version]
  16. Berthrong, S.T.; Jobbagy, E.G.; Jackson, R.B. A global meta-analysis of soil exchangeable cations, pH, carbon and nitrogen with afforestation. Ecol. Appl. 2009, 19, 2228–2241. [Google Scholar] [CrossRef] [PubMed] [Green Version]
  17. Lin, Y.R.; Cheng, C.H.; Tseng, T.Y. Carbon sequestration potential of afforestation in the plain areas in Taiwan: Examples from long-term abandoned orchards and afforested sites. Quart. J. Chin. For. 2011, 44, 567–588. (In Chinese) [Google Scholar]
  18. Chen, Y.Y.; Huang, W.; Wang, W.H.; Juang, J.Y.; Hong, J.S.; Kato, T.; Luyssaert, S. Reconstructing Taiwan’s land cover changes between 1904 and 2015 from historical maps and satellite images. Sci. Rep. 2019, 9, 3643. [Google Scholar] [CrossRef] [PubMed] [Green Version]
  19. Chang, C.L.; Kuan, W.H.; Lui, P.S.; Hu, C.Y. Relationship between landscape characteristics and surface water quality. Environ. Monit. Assess. 2008, 147, 57–64. [Google Scholar] [CrossRef]
  20. Thomas, G.D. pH. In Encyclopedia of Soil Science; Lal, R., Ed.; Taylor & Francis Group: New York, NY, USA, 2006; pp. 1270–1274. [Google Scholar]
  21. Ellert, B.H.; Bettany, J.R. Calculation of organic matter and nutrients stored in soils under contrasting management regimes. Can. J. Soil Sci. 1995, 75, 529–538. [Google Scholar] [CrossRef] [Green Version]
  22. Ledo, A.; Smith, P.; Zerihun, A.; Whitaker, J.; Vicente-Vicente, J.L.; Qin, Z.; McNamara, N.P.; Zinn, Y.L.; Llorente, M.; Liebig, M.; et al. Changes in soil organic carbon under perennial crops. Glob. Chang. Biol. 2020, 26, 4158–4168. [Google Scholar] [CrossRef]
  23. Del Galdo, I.; Six, J.; Peressotti, A.; Cotrufo, M.F. Assessing the impact of land-use change on soil C sequestration in agricultural soils by means of organic matter fractionation and stable C isotops. Glob. Chang. Biol. 2009, 9, 1204–1213. [Google Scholar] [CrossRef]
  24. Garten, C.T., Jr.; Hanson, P.J. Measured forest soil C stocks and estimated turnover times along an elevation gradient. Geoderma 2006, 136, 342–352. [Google Scholar] [CrossRef]
  25. Tsui, C.C.; Tsai, C.C.; Chen, Z.S. Soil organic carbon stocks in relation to elevation gradients in volcanic ash soils of Taiwan. Geoderma 2013, 209–210, 119–127. [Google Scholar] [CrossRef]
  26. Huang, Y.H.; Hung, C.Y.; Lin, I.R.; Kume, T.; Menyailo, O.V.; Cheng, C.H. Soil respiration patterns and rates at three Taiwanese forest plantations: Dependence on elevation, temperature, precipitation, and litterfall. Bot. Stud. 2017, 58, 1–12. [Google Scholar]
  27. Smith, P.; Powlson, D.S.; Glendining, M.J.; Smith, J. Potential for carbon sequestration in European soils: Preliminary estimates for five scenarios using results from long-term experiments. Glob. Chang. Biol. 1997, 3, 67–79. [Google Scholar] [CrossRef]
  28. Amelung, W.; Bossio, D.; de Vries, D.; Kogel-Knabner, I.; Lehmann, J.; Amundson, R.; Bol, R.; Collins, C.; Lal, R.; Leifeld, J.; et al. Towards a global-scale soil climate mitigation strategy. Nat. Commun. 2020, 11, 5427. [Google Scholar] [CrossRef]
  29. Page, K.P.; Dang, Y.P.; Dalal, R.C. The ability of conservation agriculture to conserve soil organic carbon and the subsequent impact on soil physical, chemical, and biological properties and yield. Front. Sustain. Food Syst. 2020, 4, 31. [Google Scholar] [CrossRef] [Green Version]
  30. Poulton, P.; Johnston, J.; Macdonald, A.; White, R.; Powlson, D. Major limitations to achieving “4 per 1000” increases in soil organic carbon stock in temperate regions: Evidence from long-term experiments at Rothamsted Research, United Kingdom. Glob. Chang. Biol. 2018, 24, 2563–2584. [Google Scholar] [CrossRef] [Green Version]
  31. Morris, S.J.; Bohm, B.; Haile-Mariam, S.; Paul, E.A. Evaluation of carbon accrual in afforested agricultural soils. Glob. Chang. Biol. 2007, 13, 1145–1156. [Google Scholar] [CrossRef] [Green Version]
  32. Cheng, C.H.; Huang, Y.H.; Menyailo, O.V.; Chen, C.T. Stand development and aboveground biomass carbon accumulation with cropland afforestation in Taiwan. Taiwan J. For. Sci. 2016, 31, 105–118. [Google Scholar]
  33. Cheng, C.H.; Hung, C.Y.; Chen, C.P.; Pei, C.W. 2013. Biomass carbon accumulation in aging Japanese cedar plantations in Xitou, central Taiwan. Bot. Stud. 2013, 54, 60. [Google Scholar] [CrossRef] [PubMed] [Green Version]
Figure 1. Locations of the study sites and their corresponding elevations.
Forests 12 01222 g001
Figure 2. Changes in soil horizonation, bulk density (BD), and mass after forest regeneration of agricultural soils (A soils). The additions of fresh soil organic matter from litter and dead roots in the forest regenerated soils (F soils) caused decreases in the changes in both bulk density and soil mass below a certain depth. The corrected soil organic carbon (SOC) stocks in F soils were calculated as follows: SOC stocks(corrected) = SOC stocks(uncorrected) × (BDA/BDF). BDA and BDF are the bulk density for A and F soils, respectively.
Forests 12 01222 g002
Figure 3. Relationships of soil organic carbon (SOC) concentrations and stocks with elevation in forest regenerated (F) and adjacent agricultural (A) fields at 0–10 cm (surface; a,b) and 10–20 cm (subsurface; c,d). Red circles and red lines represent the data obtained from F soil samples. Black circles and black lines represent the data obtained from A soil samples.
Forests 12 01222 g003
Table 1. Site and climate characteristics of the study sites with paired forest regenerated (F) and adjacent agricultural (A) fields in Taiwan.
SiteElevationPrecipitationTemperatureRegeneration AgeVegetation/Crop Types
(m)(mm)(°C)(Years)Forest Regenerated (F) FieldsAgricultural (A) Fields
Meifeng (MF)2056320012.319Metasequoia glyptostroboidesHigh altitude cabbage/flower garden
Wuling (WL)1840327113.120Chamaecyparis formosensisHigh altitude cabbage
Chinjing (CJ)1545285713.519Calocedrus formosanaHigh altitude cabbage
Lishan (LS)1535256412.518Chamaecyparis formosensisOrchard (persimmon)
Xibao (XB)1015210016.518Secondary broadleaf forest with bamboo (Phyllostachys makinoi)High altitude vegetables
Hsinshe (HS)480225020.917Secondary broadleaf forest
(Scattered trees and dense bushes)
Orchard (loquat)
Mingjian (MJ)375204321.527Fraxinus formosana
Cinnamomum camphora
Pineapple/Ginger/Yam
Rueisui (RS)236172522.319Cinnamomum camphoraMiscellaneous vegetables
Guanxi (GX)192226323.022Secondary broadleaf forestTea/Miscellaneous vegetables
Ershui (ES)120205523.721Heritiera littoralis
Dillenia indica
Miscellaneous vegetables
Tainan (TN)14169824.333Secondary broadleaf forestSugarcane
Table 2. Soil organic carbon (SOC) concentrations and stocks in forest regenerated (F) and adjacent agricultural (A) fields at 0–10 cm (surface) and 10–20 cm (subsurface) in Taiwan.
SOC Concentration (g C kg−1)SOC Stocks (Mg C ha−1)
0–10 cm10–20 cm0–10 cm10–20 cm
FAFAFAFA
MF58.5 ± 13.6 1 a 237.2 ± 2.6 b42.8 ± 0.430.8 ± 8.119.6 ± 3.415.5 ± 0.613.5 ± 3.615.5 ± 1.9
WL69.2 ± 6.0 a28.2 ± 3.3 b48.3 ± 2.0 a24.2 ± 5.6 b42.4 ± 7.3 a18.3 ± 3.2 b29.8 ± 3.316.6 ± 5.8
CJ40.6 ± 7.3 a34.2 ± 6.1 b40.8 ± 1.5 a31.1 ± 5.9 b20.3 ± 0.917.4 ± 2.717.7 ± 4.421.1 ± 2.5
LS51.1 ± 6.231.6 ± 6.433.3 ± 12.918.4 ± 1.417.0 ± 1.412.6 ± 2.723.6 ± 5.17.8 ± 2.9
XB35.3 ± 4.726.3 ± 3.321.6 ± 2.415.0 ± 4.522.7 ± 4.3 a13.2 ± 1.9 b15.4 ± 1.5 a8.4 ± 2.6 b
HS28.8 ± 2.6 a19.8 ± 2.6 b19.5 ± 2.7 a14.8 ± 0.4 b32.4 ± 7.224.4 ± 1.226.0 ± 2.919.1 ± 1.7
MJ21.9 ± 2.7 a8.7 ± 0.5 b14.2 ± 1.3 a8.6 ± 0.6 b25.5 ± 2.9 a10.1 ± 0.7 b18.8 ± 2.5 a8.9 ± 1.4 b
RS22.6 ± 1.4 a8.0 ± 1.0 b16.4 ± 2.7 a8.2 ± 0.8 b24.4 ± 2.4 a8.7 ± 1.7 b21.1 ± 0.8 a10.9 ± 0.7 b
GX34.0 ± 10.8 a15.0 ± 1.7 b20.4 ± 5.7 a8.3 ± 0.9 b36.1 ± 5.6 a16.4 ± 1.8 b25.0 ± 6.3 a9.5 ± 0.9 b
ES28.4 ± 6.3 a13.3 ± 1.6 b12.6 ± 1.010.0 ± 1.840.3 ± 7.9 a18.4 ± 2.1 b10.7 ± 2.0 a13.5 ± 2.5 b
TN21.7 ± 3.3 a7.9 ± 1.7 b10.4 ± 1.8 a6.7 ± 1.2 b27.8 ± 3.2 a10.2 ± 2.3 b16.1 ± 1.3 a9.0 ± 1.7 b
Mean37.5 ± 15.920.9 ± 11.125.5 ± 13.416.0 ± 9.128.1 ± 8.615.0 ± 4.620.6 ± 5.012.8 ± 4.7
Pair t testp < 0.01p < 0.01p < 0.01p < 0.01
1 Mean ± standard deviation; 2 Different letters indicate differences between F and A fields at each soil depth (p < 0.05).
Table 3. Absolute change, relative change, and annual accumulation rate of soil organic carbon (SOC) concentrations and stocks after forest regeneration of agricultural fields in Taiwan.
Absolute SOC Concentration ChangeRelative SOC Concentration ChangeAnnual SOC Concentration Increasing RateAbsolute SOC Stocks ChangeRelative SOC Stocks ChangeAnnual SOC Stocks Accumulation Rate
(g C kg−1)(%)(g C kg−1 Year−1)(ton C ha−1)(%)(ton C ha−1 Year−1)
0–10 cm10–20 cm0–10 cm10–20 cm0–10 cm10–20 cm0–10 cm10–20 cm0–10 cm10–20 cm0–10 cm10–20 cm
MF21.312.057391.10.64.1−1.926−130.22−0.10
WL41.124.11461002.11.224.113.2131801.270.70
CJ6.49.619310.30.52.9−3.417−160.15−0.18
LS19.314.961811.10.84.12.932140.220.15
XB8.96.634440.50.49.67.072830.500.37
HS9.04.746320.50.38.06.833360.420.36
MJ13.35.6153640.50.215.49.91521110.810.52
RS14.68.21821000.80.415.710.2181940.830.54
GX19.012.11271450.90.519.715.61201641.040.82
ES15.12.6114260.70.121.96.3119471.150.33
TN13.83.7175540.40.117.67.1173790.930.38
Mean16.59.5101650.810.4813.06.796620.680.35
Table 4. Differences in absolute change, relative change, and annual accumulation rate of soil organic carbon (SOC) concentrations and stocks between low-elevation and middle-elevation sites and between annual crop and perennial crop sites.
Absolute SOC Concentration ChangeRelative SOC Concentration ChangeAnnual SOC Concentration Increasing RateAbsolute SOC Stocks ChangeRelative SOC Stocks ChangeAnnual SOC Stock Accumulation Rate
(g C kg−1)(%)(g C kg−1 Year−1)(ton C ha−1)(%)(ton C ha−1 Year−1)
0–10 cm10–20 cm0–10 cm10–20 cm0–10 cm10–20 cm0–10 cm10–20 cm0–10 cm10–20 cm0–10 cm10–20 cm
Middle-elevation20.013.466621.040.719.03.656300.470.19
Low-elevation14.16.1133710.630.2816.49.3130890.860.49
p = 0.15p = 0.06p = 0.02p = 0.38p = 0.07p = 0.04p = 0.11p = 0.10p = 0.07p = 0.04p = 0.11p = 0.10
Middle-elevation 114.710.846530.790.585.21.137170.270.06
(exclude WL site)
Low-elevation14.16.1133710.630.2816.49.3130890.860.49
p = 0.41p = 0.13p = 0.01p = 0.28p = 0.14p = 0.09p < 0.01p = 0.01p < 0.01p = 0.04p < 0.01p = 0.01
Annual crops16.89.0110570.800.4513.96.1109580.730.32
Perennial crops15.71.178860.820.5510.68.461710.560.44
p = 0.88p = 0.74p = 0.45p = 0.28p = 0.95p = 0.67p = 0.54p = 0.57p = 0.27p = 0.74p = 0.55p = 0.57
1 The outlying WL is excluded from this row.
Publisher’s Note: MDPI stays neutral with regard to jurisdictional claims in published maps and institutional affiliations.

