Article

Integrating Detailed Timber Assortments into Airborne Laser Scanning (ALS)-Based Assessments of Logging Recoveries

1
School of Forest Sciences, University of Eastern Finland, Yliopistokatu 7, FI-80101 Joensuu, Finland
2
Metsäteho Ltd., Vernissakatu 1, FI-01300 Vantaa, Finland
3
Suomen Metsäkeskus, Aleksanterinkatu 18 A, FI-15140 Lahti, Finland
4
Arbonaut Ltd., Kaislakatu 2, FI-80130 Joensuu, Finland
*
Author to whom correspondence should be addressed.
Forests 2021, 12(9), 1221; https://doi.org/10.3390/f12091221
Submission received: 14 July 2021 / Revised: 3 September 2021 / Accepted: 6 September 2021 / Published: 8 September 2021

Abstract

:
The methodology presented here can assist in making timber markets more efficient when assessing the value of harvestable timber stands and the amounts of timber assortments during the planning of harvesting operations. Information on wood quality and timber assortments is essential for wood valuation and procurement planning as varying wood dimensions and qualities may be utilized and refined in different places, including sawmills, plywood mills, pulp mills, heating plants or combined heat and power plants. We investigate here alternative approaches for generating detailed timber assortments for Norway spruce (Picea abies (L.) H.Karst.), Scots pine (Pinus sylvestris L.) and birch (Betula spp.) from airborne laser scanning (ALS) data, aerial images, harvester data and field data. For this purpose, we used 665 circular plots, and logging recovery information recorded from 249 clear-cut stands using cut-to-length harvesters. We estimated timber assortment volumes, economic values and wood paying capabilities (WPC) for each stand in different bucking scenarios, and used the resulting timber assortment estimates to assess logging recoveries. The bucking scenarios were (1) bucking-to-value using maximum sawlog and pulpwood volumes excluding quality (theoretical maximum), and (2) bucking-to-value using sawlog lengths at 30 cm intervals for Norway spruce and Scots pine and veneer logs of lengths 4.7 m, 5.0 m, 6.0 m and 6.7 m for birch, either excluding quality (the usual business practice) or including quality (a novel business practice). The results showed that our procedure can assist in locating stands that are likely to be more valuable and have the desired timber assortment distributions. We conclude that the method can estimate WPC with root mean square errors of 28.7%, 66.0% and 45.7% in Norway spruce, Scots pine and birch, respectively, for sawlogs and 19.3%, 63.7% and 29.5% for pulpwood.

1. Introduction

Forest stand structure, timber assortment information and simulated future developments should all be taken into account when planning harvesting operations [1,2,3], as forest owners can use this knowledge to decide when to offer their timber for sale and from which stands it should be taken. The forest industries, in turn, optimize their production by obtaining timber assortments from the harvesting sites that best fit their feedstock needs [2]. Furthermore, industrial timber buyers acquiring roundwood for refinement can make better pricing decisions if they have detailed pre-harvest information [4].
Depending on the requirements in terms of wood dimensions and quality, tree stems can be bucked into assortments such as grade A butt logs, sawlogs, small-diameter logs and pulpwood, in descending order of quality and monetary value. These assortments may be utilized and refined by processing plants such as sawmills, plywood mills, pulp mills, heating plants or combined heat and power plants. Some such plants can process various tree species with particular specifications in terms of dimensions and quality, while others may process only one tree species, mixed softwood or hardwood species or both softwood and hardwood (see [5,6]). To optimize wood procurement planning and various end user-driven refinement processes, it is essential to know the timber assortments prior to trading and harvesting. This is especially important in countries where intensive small-scale family forestry takes place, e.g., in the Nordic countries.
Species-specific forest inventory attributes such as stem number, basal area, volume, and mean diameter and height can be predicted from airborne laser scanning (ALS) data and aerial images together with field-measured sample plots [7,8,9], after which species-specific diameter distributions can be estimated at the stand level through statistical relationships [3,10,11]. The predicted data can then be used in taper curves and timber assortment reduction models to estimate timber assortment volumes at the stand or tree level [12,13,14]. Thus, tree size distribution models can convert information obtained at the stand level into tree-level data [15]. It should be noted, however, that all the predictions involved in the previous steps introduce some measure of uncertainty [16,17]. Timber assortments can be estimated from species-specific diameter-height distributions [3] and, as cut-to-length harvesters that record data such as tree species and diameters at different intervals along the stems are commonly used in Nordic countries, these timber assortments can be calculated employing cut-to-length harvesting methods such as the nonparametric k most similar neighbour (k-MSN) technique [18] or bucking optimizations and tree stem simulations [4,19,20].
ALS data also characterize canopy height, height variation and canopy density in a fairly direct manner [21,22] and these characteristics can be linked to some of the essential indicators of wood quality [23]. Therefore, ALS data can also be used to decide which stands are more liable to have a particular log quality distribution. While some quality variables are easy to model, many others can be hard to predict accurately, since local variation and historical stand development (including silvicultural treatments of the stands), among other things, are not captured by the laser data. Moreover, timber quality depends on internal and external stem properties, and some of the internal factors are not disclosed until the logs are processed at the mill [24].
The aims of this work were (1) to assess the accuracy of timber assortment predictions and to observe how these affect the commercial value of the final harvest, and (2) to present a method for assessing timber volume, value and wood paying capability (WPC) by timber assortments in the case of Norway spruce (Picea abies (L.) H.Karst.), Scots pine (Pinus sylvestris L.) and birch (Betula spp.). The hypothesis was that detailed timber assortments for Norway spruce, Scots pine and birch can be estimated by means of ALS data, aerial images, harvester data and field data.

2. Materials and Methods
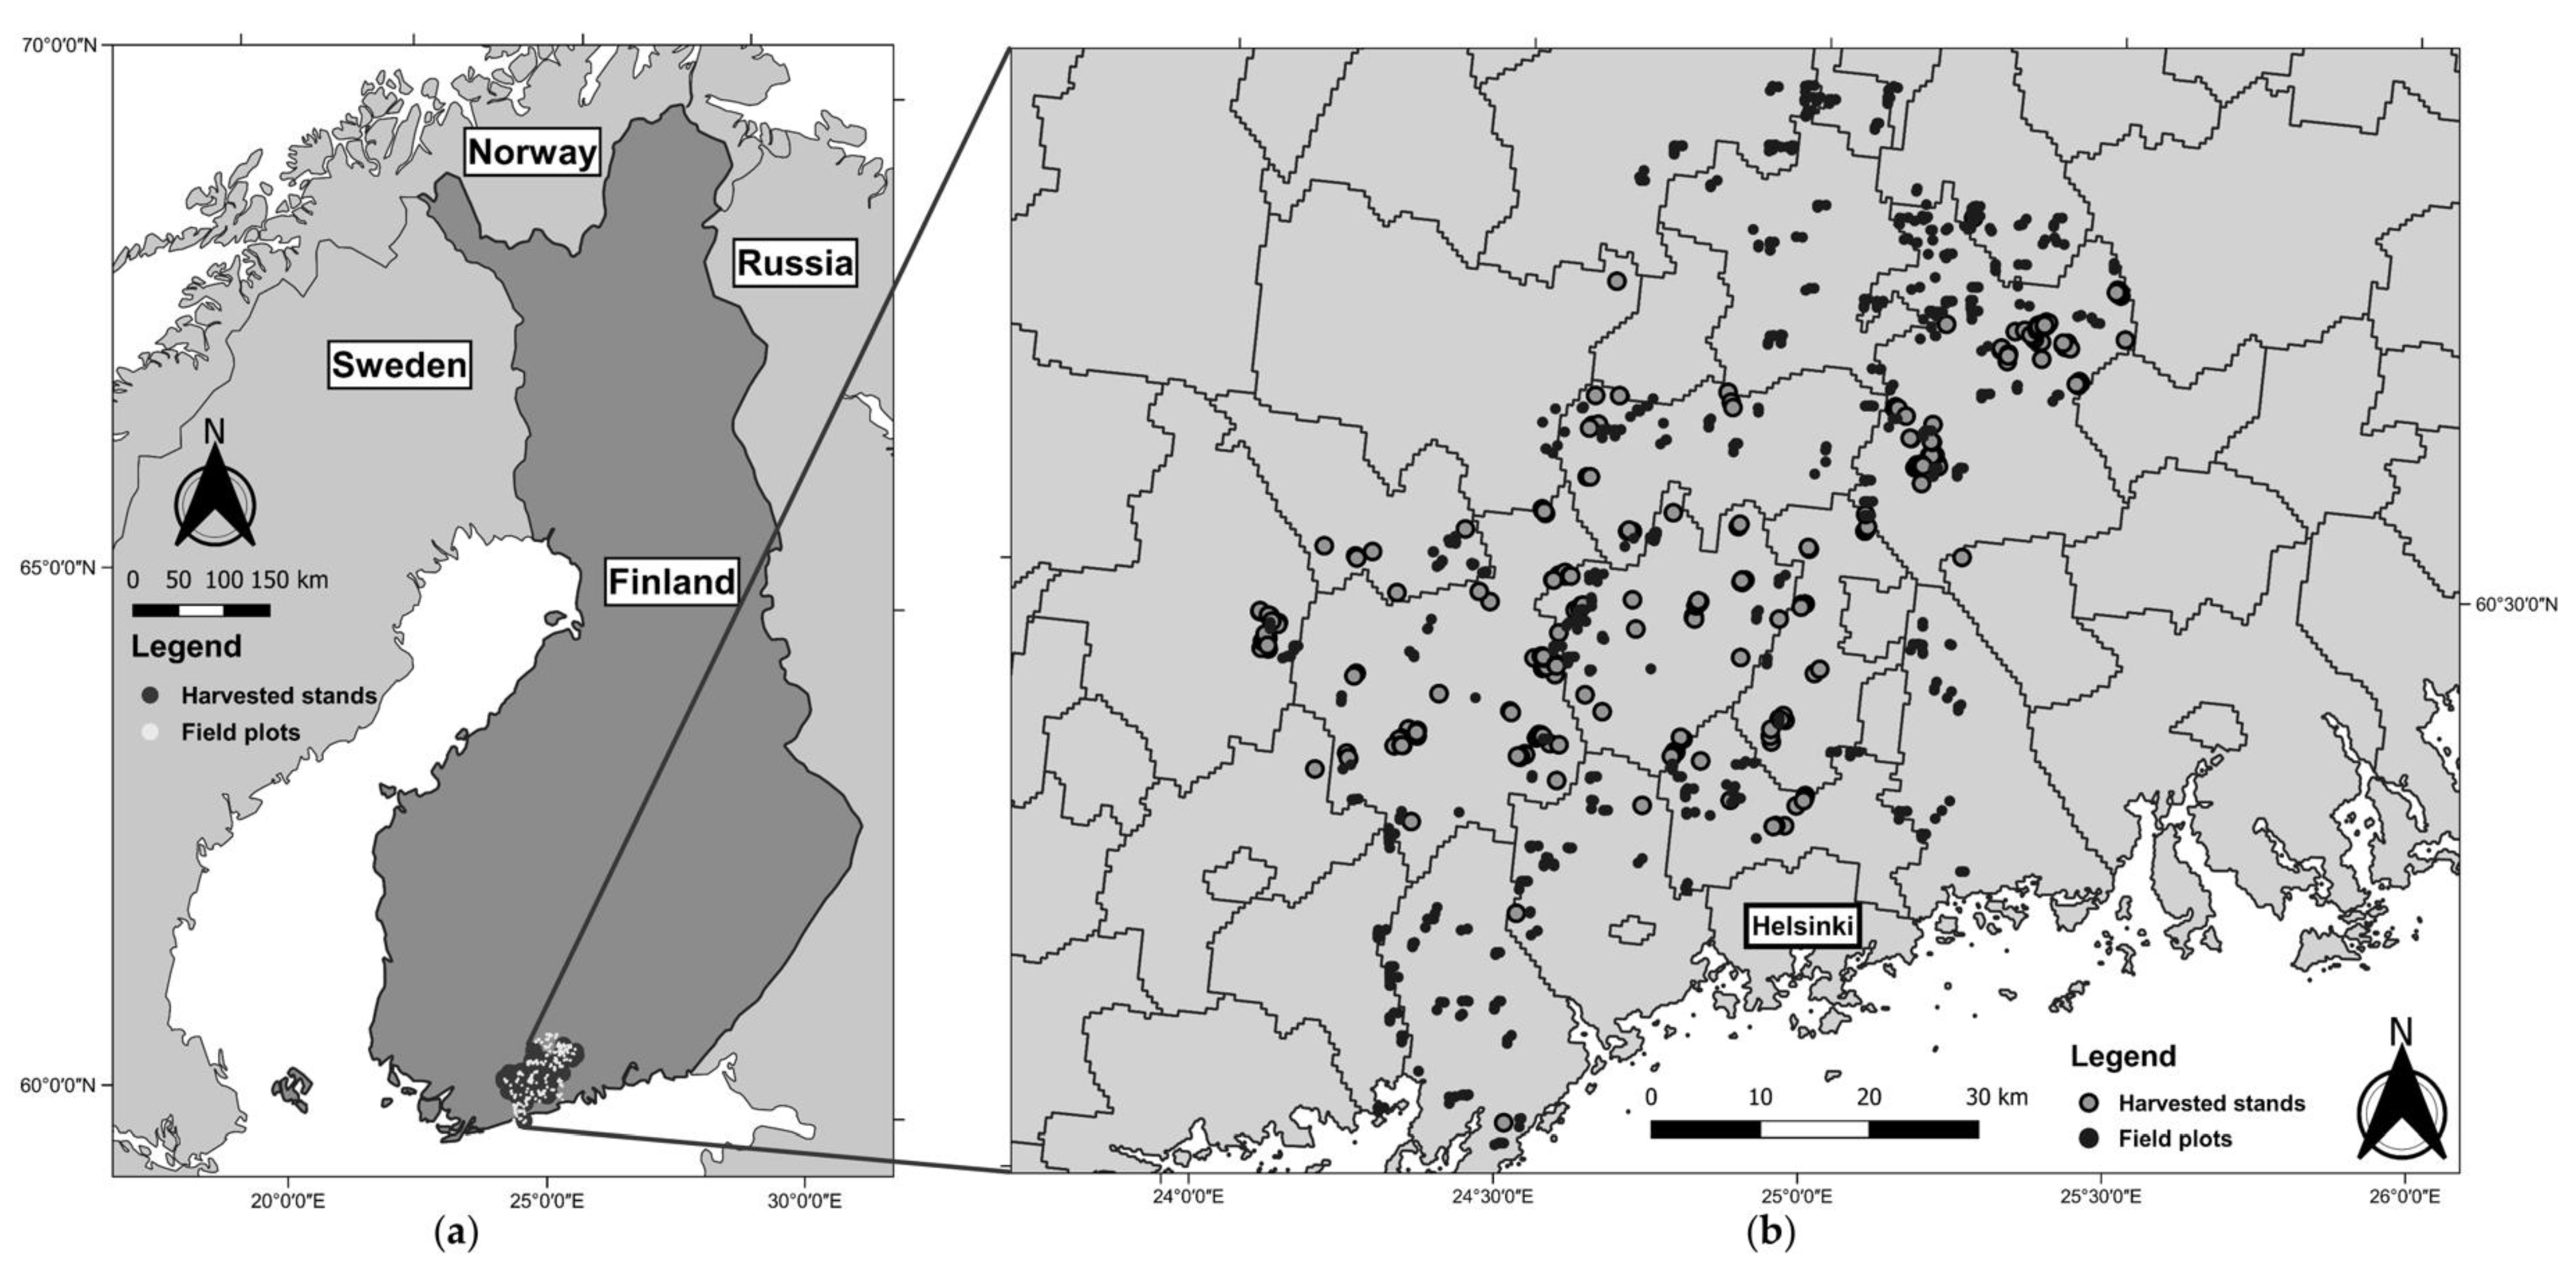
2.1. Materials

2.1.1. Field Data

The area of Southern Finland studied here covers 477,000 ha, of which 257,000 ha is classified as forest land (Figure 1). The landscape is generally undulating, with elevations fluctuating from 0 to 174 m above sea level and has a complex mosaic of forest, agricultural and urban land use [25].

2.1.2. Harvester Data

The harvester data, covering altogether 202,428 stems, were collected from 249 clear-cut stands (Figure 1) between June 2015 and September 2016. Each stem was located with the harvester’s global navigation satellite system (GNSS), i.e., the geographical coordinates recorded for each tree represent the location of the harvester at the time of cutting, not the original location of the stems. In addition to the geographical coordinates, the data recorded for each stem included tree species, diameters at 10 cm intervals along the stem, length, volume and timber assortment information. Although the data were collected using different harvesters, all of them recorded similar data according to the harvester production (HPR) standards and the standard for forest data and communication (StandForD) [26]. Statistics concerning the harvester data are shown in Table 1. Among the clear-cut stands, there were 170, 12 and 10 stands dominated by Norway spruce, Scots pine and birch, respectively. Dominated stands were considered those with a basal area proportion of a single tree species bigger than 60%. The collection, pre-processing and fitting of the harvester data were performed by Metsäteho Ltd. (Vantaa, Finland) in cooperation with the forest companies and harvester manufacturers (for a more detailed description, see [25]).

2.1.3. Field Plots

The field data were collected between May and September 2015 by the Finnish Forest Centre (FFC). A total of 831 field plots were allocated to forests with varying structure based on the existing stand register information. In view of possible further analyses, those field plots that were located in seedling stands were removed from the data. The remainder then consisted of 665 circular plots (Figure 1) with a radius of 5.64 m, 9.00 m or 12.62 m depending on the tree density and development class, following the general FFC guidelines [27]. The locations of the field plots were defined with a GNSS device capable of achieving sub-metre accuracy after post-processing. Species and diameter at breast height (DBH) were defined for all of the trees with a DBH larger than 5 cm, and the height of every fifth tree was measured. Callipers and clinometers were used for these measurements. The heights of all the trees were also estimated using DBH as a predictor in locally calibrated species-specific allometric models, and volumes were calculated using species-specific allometric models based on DBH and height [12]. Forest inventory attributes for the field plots were computed from the measured or predicted tree attributes. Descriptive statistics for the field plots are presented in Table 1.

2.1.4. ALS Data and Aerial Images

The ALS data were collected between June and August 2015 using a Leica ALS60 SN6114 system (Leica Geosystems AG, Heerbrugg, Switzerland) at 2050 m above ground level. The ground speed was 160 m/s, the scan angle was 20°, the beam divergence was 0.22 mrad (1/e) and the pulse repetition frequency was 114.6 kHz. The density of the first-echo pulses was 1.8 hits per m2. A digital terrain model (DTM) with 2 m resolution was used to normalize the original ALS point cloud. The DTM was generated by classifying points into ground and non-ground points as described by [28]. The aerial images were obtained within the same time window. The imaging sensors used were Vexcel (Denver, CO, USA) Ultra Cam UCXp and S/N UC-SXp. The area was covered by 194 images in total. The flying height was 5 km and the ground sample distance (GSD) approximately 0.3 m. The images were delivered as 16-bit visible light (RGB) and colour infrared (CIR) composites. Furthermore, 8-bit orthorectified images were provided by the data vendor (Blom Kartta Oy, Helsinki, Finland).

2.2. Methods

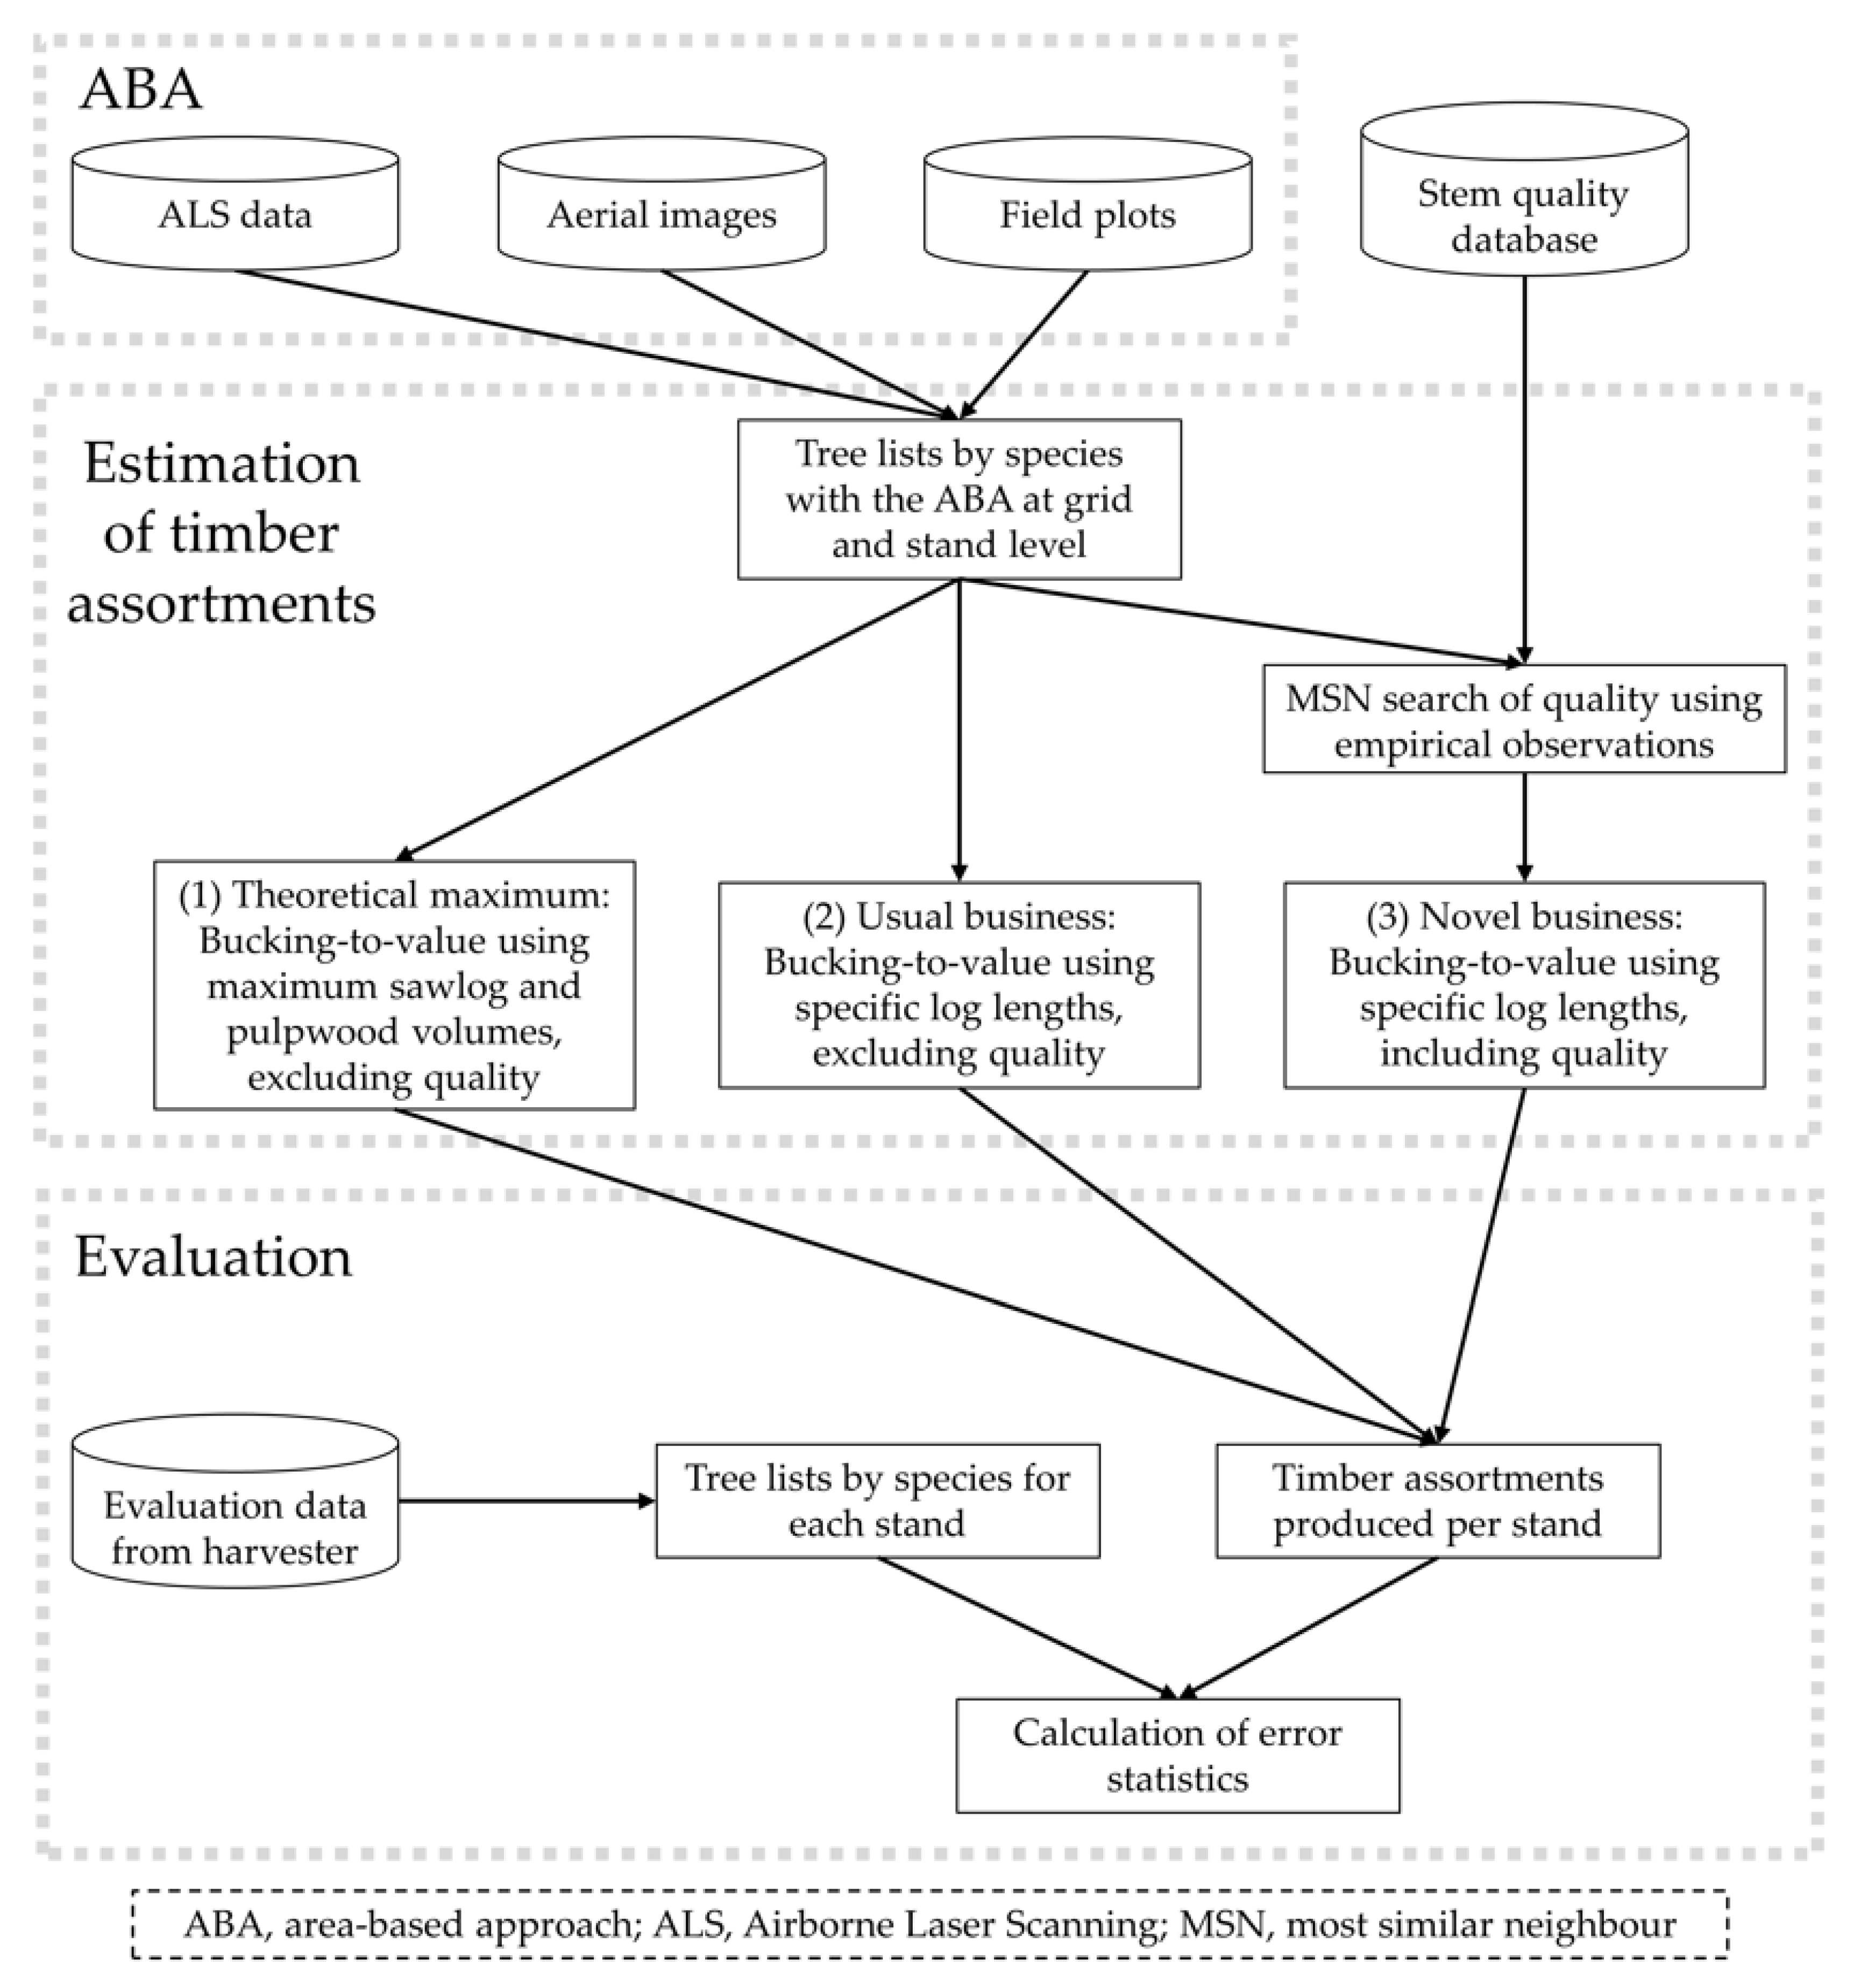
2.2.1. Prediction of Stand-Level Timber Assortments Using ALS Data and Aerial Images

The ALS data were fused with the aerial image data using the back-projecting ALS method, i.e., every ALS point was provided the information from unrectified aerial image scenes to avoid geometric errors (see [29]). The point cloud data including spectral information from aerial images were then used to derive numerous features for each grid cell describing the height, density and spectral data distributions. The grid size used was 16 m by 16 m, which is employed in operative ALS-based inventories in Finland and has the same area as the standard circular field plots of a radius of 9.00 m utilized in these inventories. Features included percentiles from the height distribution of both the first and last echo data, the density at given absolute and relative heights, and mean and standard deviations of height observations. Linearizing transformations of the features were also calculated. Spectral distribution features included mean and standard deviations calculated from the spectral distributions of the absolute and relative height thresholds. Spectral distributions were estimated for the red, green and near infrared bands and for the band ratios.
Diameter distributions were estimated from the ALS data fused with the aerial image data for Norway spruce, Scots pine and birch employing the area-based approach (ABA) at grid level for the 249 clear-cut stands, using the 665 field plots studied by the FFC as a reference (for more details about the ABA, see, e.g., [7,9]). The k-MSN method (see [18]) utilized the field plot data as well as the ALS data fused with the aerial image data, and it was applied using the following process:
(1)
An initial set of variables explaining species distribution, total volume, basal area and mean tree size was selected using correlations;
(2)
An exhaustive search was then carried out for the initial feature set by testing different feature combinations and minimizing the root mean square errors (RMSEs) of the species volumes, basal area and mean tree size. The number of most similar neighbours was set at six, which means that every grid cell was allotted to the six most similar field plots and their MSN weights. Tree lists (also known as lists of stems) were predicted for each grid cell and weighted by the average of the trees measured from the six most similar field plots;
(3)
The information from the predicted tree lists at the grid level was aggregated at the stand level.
K-MSN imputation predicts a tree list which provides a weight for every tree in the field plot data occurring in the stand. For further analyses, the imputed tree list was transformed to a list that contained only complete trees. This was performed by means of a sample from the tree lists estimated with the ABA, the stems were then divided into 1 cm diameter classes, weighted by their probability of occurrence and assigned the corresponding number of trees for each diameter class. The stems selected in the sample were specified in terms of species, diameter at breast height, height and volume as obtained from the ABA data (see Figure 2).

2.2.2. Alternative Bucking Methods for Deriving Timber Assortments for each Stand

To enable comparisons between the estimates, two alternative tree lists were available for each stand: one obtained directly from the harvester data and the other using the ABA (see Figure 2). Tree lists and timber assortments obtained from the harvester data were always used for reference purposes. We then compared the differences between the approaches for deriving timber assortments from the tree lists predicted using the ABA. First, we calculated the differences in the volume estimates between the ABA and the harvester data in order to reveal the differences caused by the tree list prediction, and second, we assessed the differences in the timber assortments between the ABA and the harvester data that were attributable to the tree list prediction and the simulated bucking. In this second case we further evaluated three bucking options for the tree lists: (1) bucking without any reductions due to dimensions or quality (Scenario 1), (2) bucking with reductions due to dimensions (Scenario 2), and (3) bucking with reductions due to dimensions and quality (Scenarios 3 and 4) (see Figure 2 and Table 2).
Species-specific taper curve models using DBH and height as the other inputs were used to taper the stems in the tree lists from the harvester data and from the ABA [12]. When quality was not taken into account, the bucking-to-value simulator used the tapering of the stems, the tree species and the species-wise bucking objectives, whereas when quality was considered, the same simulator employed external quality expressed in terms of vertical stem sections fulfilling different timber assortment quality requirements as specified by the Finnish forest companies [30]. The external quality that affected bucking was estimated in Scenarios 3 and 4, in which a stem quality database was used with the MSN method [30,31] (see Figure 2). For these two scenarios, technical defects of the target stems were estimated by selecting the most similar stem from the quality database in accordance with the stand variables, diameter at breast height, and height of the stem. The stem quality database contained over 13,000 trees measured for dimensions and evaluated for stem quality [31]. The quality assessment was based on visual estimation of the occurrence of technical defects (scars, crooks, sweeps, forks, knots, etc.). The database was collected in various research projects at the Finnish Forest Research Institute between 1998 and 2010 (for a more detailed description and the geographic coverage of the database, see [30]).
The minimum top-end diameters and minimum and maximum lengths used in the bucking are presented in Table 3. The taper curve models of [12] were used to determine the theoretical sawlog volume, which is the stem volume exceeding the minimum diameter, given a minimum diameter of 15 cm and a minimum length of 3.7 m.
The unit prices for the timber assortment volumes (TAV) were EUR 67·m−3 for Scots pine Grade A butt logs, EUR 67·m−3 for Norway spruce sawlogs, EUR 64·m−3 for Scots pine sawlogs, EUR 45·m−3 for birch sawlogs, EUR 33·m−3 for Norway spruce small-diameter logs, EUR 29·m−3 for Scots pine small-diameter logs, EUR 22·m−3 for Norway spruce pulpwood, EUR 20·m−3 for Scots pine pulpwood, and EUR 19·m−3 for birch pulpwood. These were typical stumpage prices paid in Finland in week 16 of 2021 [32]. The total volumes were solid volumes over bark calculated from the stump to the top of the stem.
The WPC figures used in bucking can be defined as the residual values that a producer can pay for wood when all the other costs are deducted from the sales price [33]. We calculated the WPC for each stand as the value divided by the volume obtained with the bucking-to-value simulator. It should be noted that WPC is size-dependent (since longer and thicker logs are more valuable) and depicts the range in which values may vary (see Table 3).
The root mean square error (RMSE), relative root mean square error (RMSE%), bias, relative bias (bias%) and standard deviation (SD) between the measured and estimated values were calculated for the timber assortments to compare the volumes, WPC results and values obtained for the harvester data with those from the ABA data. The RMSE and RMSE% were used to assess the accuracy of the various methods relative to the reference:
RMSE = j = 1 n ( y i j y ^ i j ) 2 n
RMSE % = RMSE y ¯ i   ×   100
where yij is the reference value of the variable i in stand j derived directly from the harvester data, y ^ i j is the estimated value of the variable i in stand j, y ¯ i is the average of the reference values of variable i derived directly from the harvester data, and n is the number of observations.
The bias and bias% of the estimates were calculated as follows:
Bias = j = 1 n ( y i j y ^ i j ) n
Bias % = Bias y ¯ i   ×   100

3. Results

3.1. Differences in Timber Assortments due to Tree List Prediction and Simulated Bucking

The differences between the maximum theoretical volume and the volume based on bucking predictions that emerged from the effect of the log length constraints are presented in Table 4 Table 5 and Table 6. Use of the bucking objectives reduced the sawlog volume for Norway spruce, Scots pine and birch by 4.1%, 0.9% and 22.9%, respectively, in the harvester data, and 5.0%, 1.1% and 26.7%, respectively, in the ABA data (see Table 4). The differences in WPC estimates are shown in Table 5 and Table 6.

3.2. Differences in Volume Estimates due to Tree List Prediction

The RMSE% values of the bucking estimates for sawlog volume for Norway spruce, Scots pine and birch were 0.2 percentage points (pp) lower, 0.7 pp lower and 12.9 pp higher, respectively, when considering quality (Scenario 3) than when quality was not considered (Scenario 2). In the case of pulpwood volume, the RMSE% values of the bucking estimates were 1.3 pp lower, 49.7 pp lower and 1.0 pp higher, respectively, for the same species when quality was also estimated (Scenario 3) than when it was not considered (Scenario 2) (see Table 4). Table 4 does not include the total values as these were constant in all the scenarios, as presented in Table 6.
Table 6 also shows the species-specific timber volume estimates and their accuracies before and after bucking at the stand level. The bucking predictions reduced the total volume most in the case of Scots pine (28.6% in the harvester data and 11.8% in the ABA data) and least in the case of Norway spruce (6.9% in the harvester data and 5.7% in the ABA data) (see Table 6).

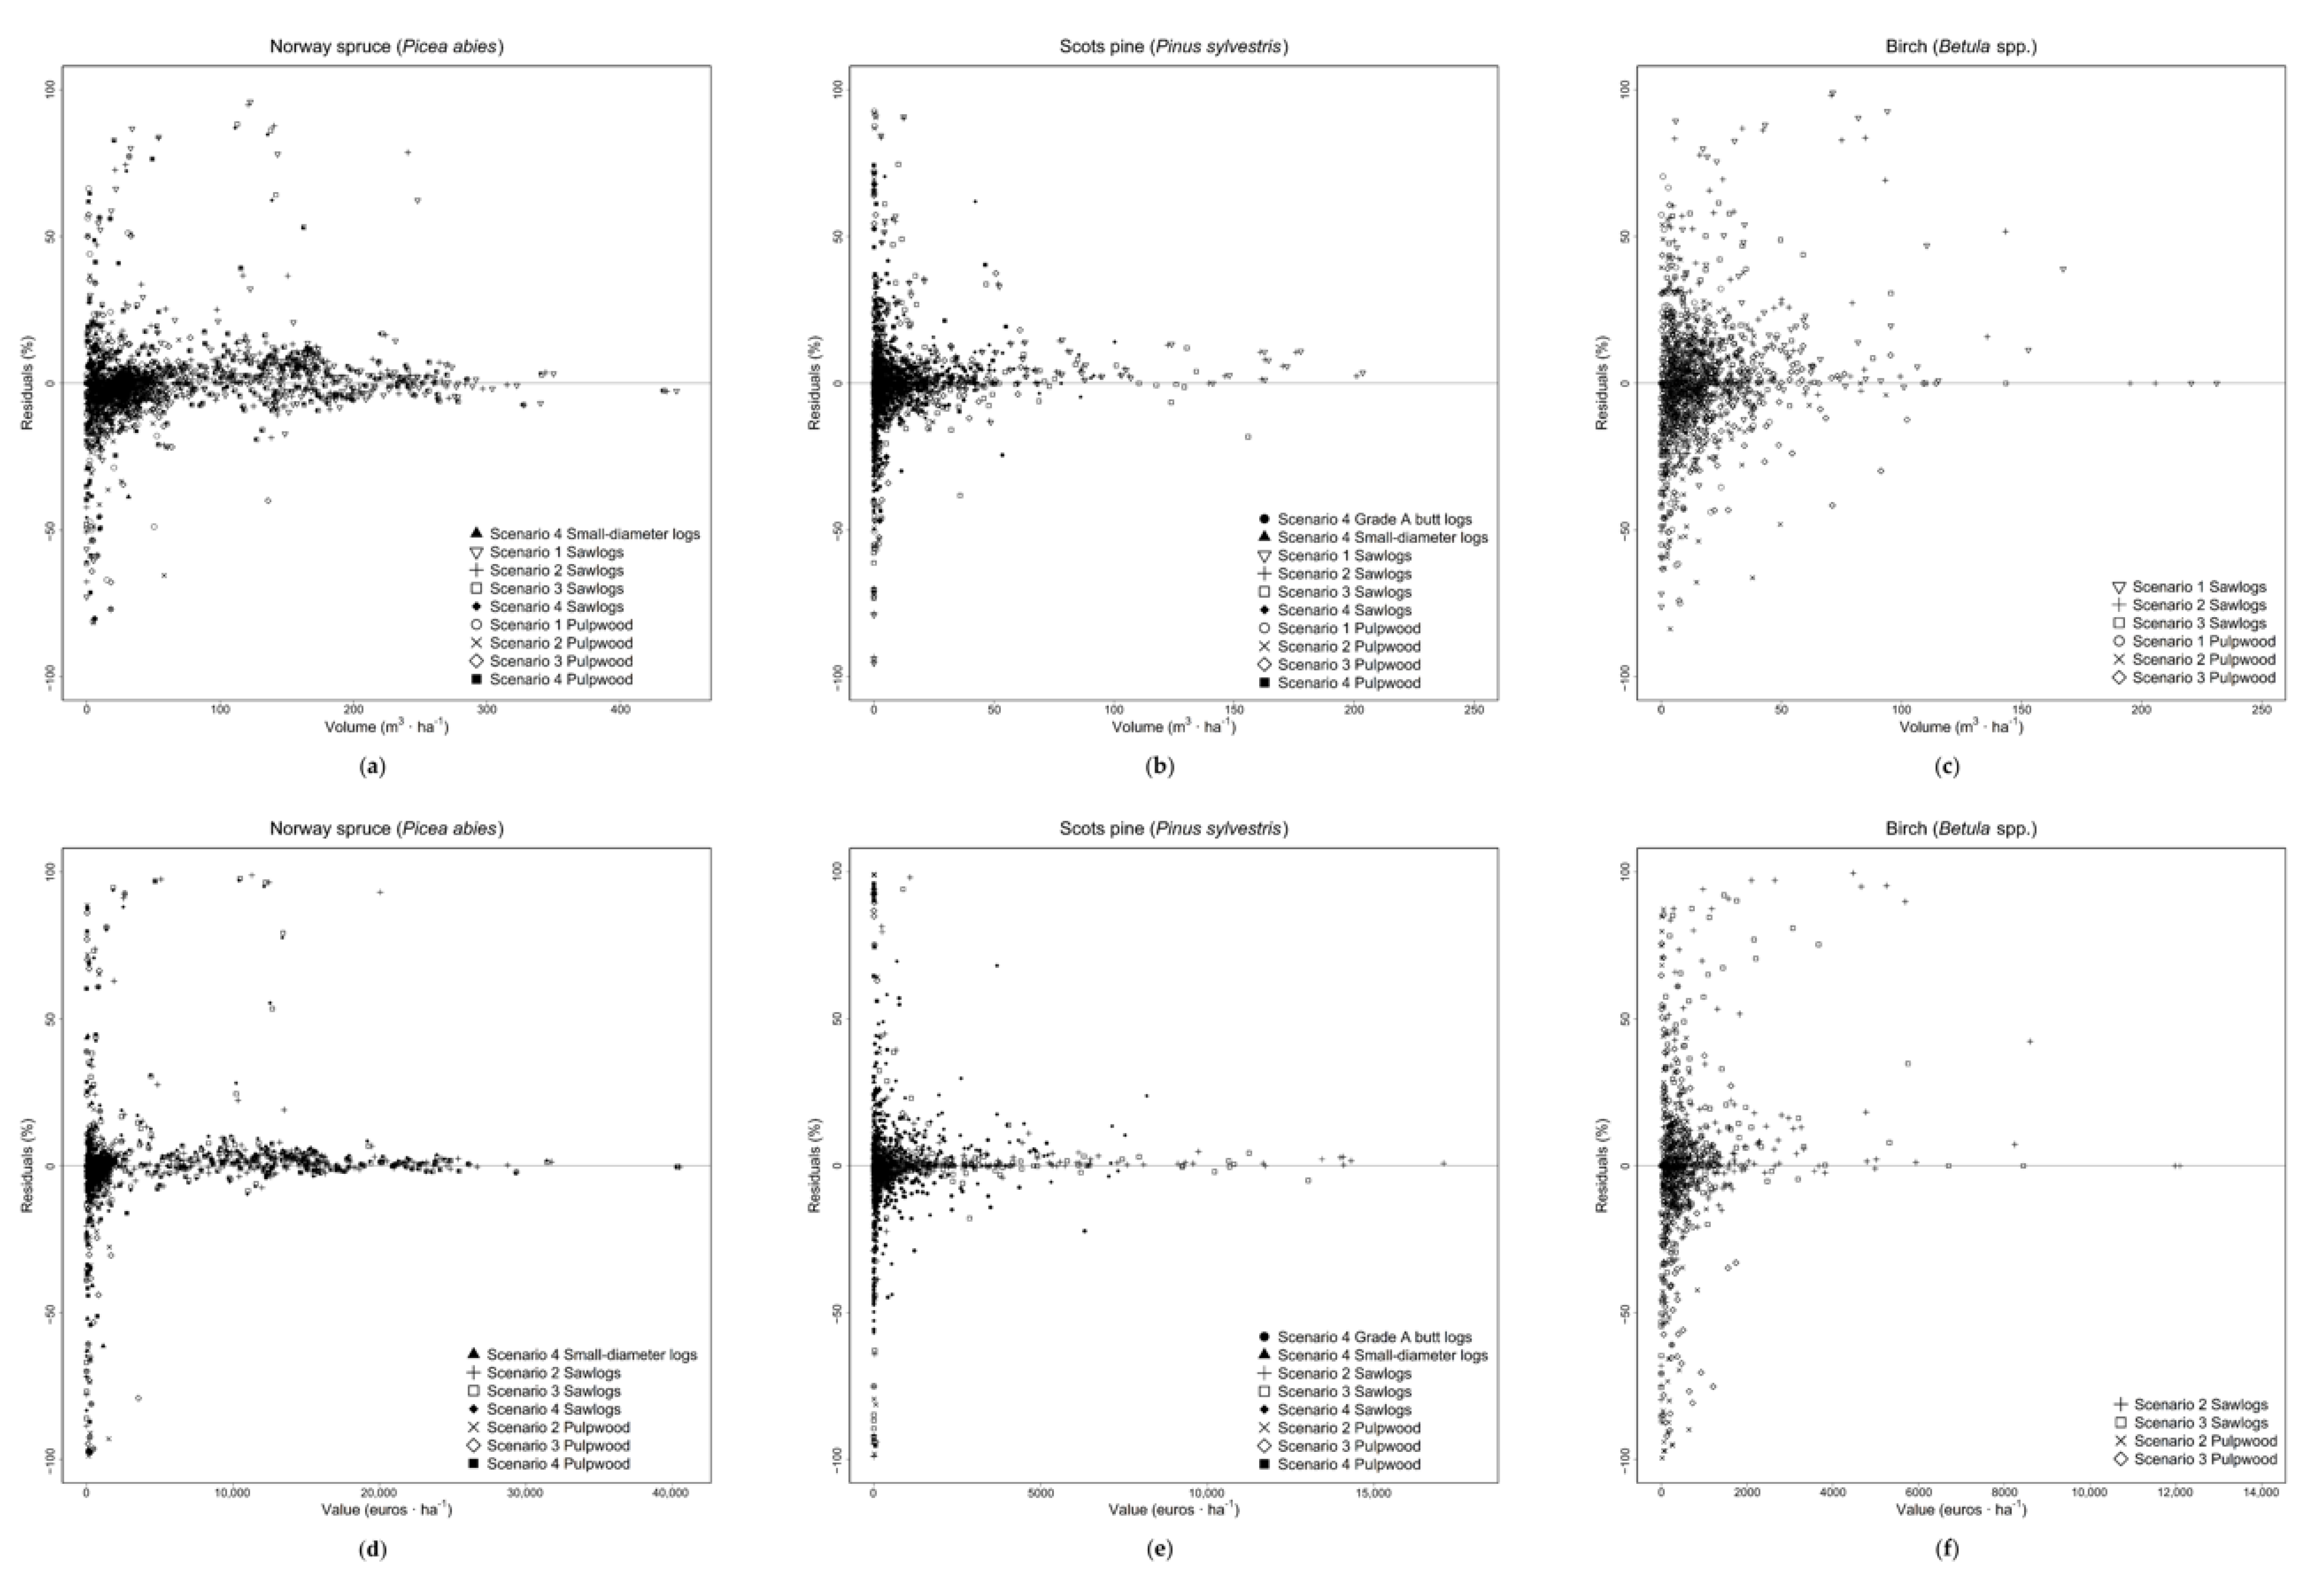
3.3. Residual Errors

The residual errors in the timber assortment volumes obtained for Norway spruce, Scots pine and birch and in the values for the various scenarios are shown in Figure 3. For Scots pine, Figure 3b,e show that the residual errors decreased as the sawlog volume and its value increased, while Norway spruce followed a similar trend, although in this case there were few stands with high residual errors for large volumes and values (Figure 3a,d). The most scatter residuals for both volume and its value occurred in the case of birch (Figure 3c,f).

4. Discussion

Our research was aimed at understanding and supporting wood procurement practices, with the prospect of making timber markets more efficient by supplying each user with more suitable roundwood for processing. The idea was to introduce a method for measuring timber volume, its value and the WPC by timber assortments for Norway spruce, Scots pine and birch.
There are many reasons why different species are used for particular products and this affects how they are traded. Grade A butt logs represent a branchless grade, but Norway spruces have branches all the way down. Veneers can be fabricated from high quality spruce butt logs, but these are usually traded at the same price as sawlogs. Norway spruces are not used for poles, since poles are impregnated, and Norway spruce is unsuitable for this. There are only a few small sawmills in Finland that deal in birch, so birch sawlogs are almost entirely veneer logs, but for simplicity these are referred to here as sawlogs. It is for this reason that the lengths of veneer logs differ from the actual sawlog lengths (multiple veneer logs are obtained according to the width of the lathe). Residual wood is woody biomass which can be collected for energy use or left in the forest to decay and fertilize the next generation of trees and thereby to increase biodiversity.
The bucking of maximum sawlog and pulpwood volumes excluding quality estimation (Scenario 1) and of all sawlog and pulpwood volumes excluding quality estimation (Scenario 2) have similar outcomes (Table 4). Overall, it can be interpreted from the RMSE% values that the combination of the k-MSN search (from existing stem quality database) and ALS data presented here can be used to predict both dimensions and log quality (Table 4 Table 5 and Table 6). It is also the case that the RMSE% values for both Norway spruce and Scots pine are smaller for sawlogs than for pulpwood volumes, whereas the RMSE% values for birch are slightly larger for sawlogs than for pulpwood volumes. When three or four timber assortments were considered (Scenario 4), the bucking of grade A butt log volumes (for Scots pine) and small-diameter log volumes (for Scots pine and Norway spruce) produced larger RMSE% values than the bucking of sawlog volumes. In this context it seems that our approach can help to locate the stands that are likely to be more valuable and have the desired timber assortment distributions.
For all the timber assortments (i.e., grade A butt logs, sawlogs, small-diameter logs and pulpwood) and all three tree species (i.e., Norway spruce, Scots pine and birch) the RMSE% values for the WPC are smaller than those for the volume (Table 4 Table 5 and Table 6). The probable reason for this is that while the volume of each timber assortment is only influenced by the proportion of that timber assortment per unit volume, the WPC is affected by the size of the logs as well (i.e., large logs from overstory trees are usually more valuable than small logs from understory ones). However, even though understory trees are less valuable, the commercial value of timber stands is substantially affected by the amount of understory trees [34].
Other studies have similarly estimated timber assortment volumes. The authors of [3,4,16,35], for example, used an ABA-based on ALS data to assess the amount and value of harvestable timber, whereas Malinen et al. [31] used timber assortment recovery regression models and a decision support tool employing empirical data from sample plots. Holopainen et al. [16] reported RMSE% results of 79.2% for sawlog volume and 167.6% for pulpwood volume in the case of Scots pine, 33.6% for sawlog volume and 46.7% for pulpwood volume where Norway spruce was concerned, and 78.6% for sawlog volume and 218.5% for pulpwood volume in birch, while Siipilehto et al. [3] obtained RMSE% values of 41.1% for total volume, 40.1% for sawlog volume, and 52.8% for pulpwood volume when studying Scots pine. Likewise Sanz et al. [4] reported RMSE% results of 52.0% for total volume, 209.5% for grade A butt logs, 89.9% for sawlogs, 42.8% for small-diameter logs and 49.4% for pulpwood in the case of Scots pine, and Vähä-Konka et al. [35] RMSE% reported 67.1% for sawlogs and 107.1% for pulpwood in Scots pine, 48.6% for sawlogs and 54.8% for pulpwood in Norway spruce, and 169.8% for sawlogs and 97.7% for pulpwood in the case of deciduous trees (mainly birch). By contrast, Malinen et al. [31] reported RMSE% values of 6.7% for grade A butt logs, 7.1% for sawlogs, 2.5% for small-diameter logs and 7.1% for pulpwood when considering both Scots pine and Norway spruce.
Although we used ALS data for prediction purposes, our field data were collected from a large area, allowing inferences to be made with regard to subpopulation parameters and indirect estimators or predictors to be used that borrow information from other geographical areas. This partly affected the bias introduced into the design by the use of different vegetation zones, stem shapes and other geographically related factors. Special attention needs to be focused on the covariance structure of the training area data as compared with the target area when non-parametric estimation is used [36]. The attribute value distribution of reference database is important in k-MSN methodology. If the target population has a different covariance structure of major variables, it can lead to design bias. For example, the reason why the RMSE% and bias% values quoted here are larger for Scots pine and birch than for Norway spruce (see Table 4 Table 5 and Table 6) is that Norway spruce is the main tree species in our study (see Table 1 and Table 6) and our estimation method was focused on getting better results for the main tree species than for the minor ones.
The field plots, ALS data and aerial images were collected within 5 months of the year 2015, and the harvester data were collected between 2015 and 2016. We could have selected newer data for our study, but we considered these data suitable for our research because they were extensive, detailed and collected within a similar period of time. The taper curve models of [12] used here are old, but they were compiled using extensive data and they are still used in operational forestry in Finland. The presented methodology can be further improved (1) with denser ALS data (which can make better predictions of the tree lists), (2) by having a more representative database for the k-MSN search (such as more plots from near the target area), (3) by using more precise harvester data, and (4) by collecting more extensive stem quality data with terrestrial laser scanning (which can improve the stem quality estimation).
The two main novelties in this research are (1) that the investigation was implemented using a real-life forest inventory area and its related data sources, and (2) that this choice of material was supplemented with enhanced methodological developments such as the use of a bucking-to-value simulator, the use of harvester data as a reference source and the imputation of tree lists from field plots in ABA.

5. Conclusions

In conclusion, our method can be used to estimate WPC values with RMSE% levels of 28.7%, 66.0%, and 45.7% for sawlogs, and 19.3%, 63.7%, and 29.5% for pulpwood in the case of Norway spruce, Scots pine and birch, respectively. It can thus be used for assessing forest stand structure and especially the amounts of the various timber assortments when planning harvesting operations. Further studies will be needed, however, to optimise the parameters and define the restrictions that may apply to this non-parametric approach.

Author Contributions

Conceptualization, B.S., J.M., S.S., J.P., V.L., T.M., K.R., T.K., M.V. and T.T.; Data curation, B.S., S.S., J.P., T.M. and K.R.; Formal analysis, B.S., S.S. and J.P.; Funding acquisition, J.M., M.V. and T.T.; Investigation, B.S., S.S., J.P., T.M. and K.R.; Methodology, B.S., J.M., S.S., J.P., V.L., T.K., M.V. and T.T.; Project administration, J.M., J.P., M.V. and T.T.; Resources, B.S., J.M., S.S., J.P., V.L., T.M., K.R., T.K., M.V. and T.T.; Software, B.S., S.S., J.P., V.L. and T.K.; Supervision, J.M., J.P., V.L., T.K., M.V. and T.T.; Validation, B.S., J.M., M.V. and T.T.; Visualization, B.S., J.M., M.V. and T.T.; Writing–original draft, B.S., J.M., J.P., M.V. and T.T.; Writing–review and editing, B.S., J.M., S.S., J.P., V.L., T.M., K.R., T.K., M.V. and T.T. All authors have read and agreed to the published version of the manuscript.

Funding

This research was funded by the Doctoral Programme in Forests and Bioresources at the University of Eastern Finland, and by the Academy of Finland Flagship Programme, Forest-Human-Machine Interplay–Building Resilience, Redefining Value Networks and Enabling Meaningful Experiences (UNITE, decision number 337127).

Acknowledgments

This work was financed by the Doctoral Programme in Forests and Bioresources at the University of Eastern Finland. We are grateful to the Academy of Finland Flagship Programme for financial support Forest-Human-Machine Interplay–Building Resilience, Redefining Value Networks and Enabling Meaningful Experiences (UNITE, decision number 337127). The authors also thank Malcolm Hicks for his help with the English manuscript.

Conflicts of Interest

The authors declare no conflict of interest.

References

  1. Holopainen, M.; Vastaranta, M.; Hyyppä, J. Outlook for the Next Generation’s Precision Forestry in Finland. Forests 2014, 5, 1682–1694. [Google Scholar] [CrossRef] [Green Version]
  2. Kankare, V.; Vauhkonen, J.; Tanhuanpää, T.; Holopainen, M.; Vastaranta, M.; Joensuu, M.; Krooks, A.; Hyyppä, J.; Hyyppä, H.; Alho, P.; et al. Accuracy in estimation of timber assortments and stem distribution—A comparison of airborne and terrestrial laser scanning techniques. ISPRS J. Photogramm. Remote Sens. 2014, 97, 89–97. [Google Scholar] [CrossRef]
  3. Siipilehto, J.; Lindeman, H.; Vastaranta, M.; Yu, X.; Uusitalo, J. Reliability of the predicted stand structure for clear-cut stands using optional methods: Airborne laser scanning-based methods, smartphone-based forest inventory application Trestima and pre-harvest measurement tool EMO. Silva Fenn. 2016, 50, 1568. [Google Scholar] [CrossRef] [Green Version]
  4. Sanz, B.; Malinen, J.; Leppänen, V.; Valbuena, R.; Kauranne, T.; Tokola, T. Valuation of growing stock using multisource GIS data, a stem quality database, and bucking simulation. Can. J. For. Res. 2018, 48, 888–897. [Google Scholar] [CrossRef]
  5. Malinen, J.; Kilpeläinen, H.; Piira, T.; Redsven, V.; Wall, T.; Nuutinen, T. Comparing model-based approaches with bucking simulation-based approach in the prediction of timber assortment recovery. Forestry 2007, 80, 309–321. [Google Scholar] [CrossRef] [Green Version]
  6. Hyvönen, P.; Lempinen, R.; Lappi, J.; Laitila, J.; Packalen, T. Joining up optimisation of wood supply chains with forest management: A case study of North Karelia in Finland. Forestry 2019, 93, 163–177. [Google Scholar] [CrossRef]
  7. White, J.C.; Wulder, M.A.; Varhola, A.; Vastaranta, M.; Coops, N.C.; Cook, B.D.; Pitt, D.; Woods, M. A best practices guide for generating forest inventory attributes from airborne laser scanning data using an area-based approach. For. Chron. 2013, 89, 722–723. [Google Scholar] [CrossRef] [Green Version]
  8. White, J.C.; Coops, N.C.; Wulder, M.A.; Vastaranta, M.; Hilker, T.; Tompalski, P. Remote Sensing Technologies for Enhancing Forest Inventories: A Review. Can. J. Remote Sens. 2016, 42, 619–641. [Google Scholar] [CrossRef] [Green Version]
  9. White, J.C.; Tompalski, P.; Vastaranta, M.; Wulder, M.A.; Saarinen, N.; Stepper, C.; Coops, N.C. A Model Development and Application Guide for Generating an Enhanced Forest Inventory Using Airborne Laser Scanning Data and an Area-Based Approach; Natural Resources Canada, Canadian Forest Service, Canadian Wood Fibre Centre: Victoria, BC, Canada, 2017; pp. 1–48. [Google Scholar] [CrossRef]
  10. Peuhkurinen, J.; Maltamo, M.; Malinen, J. Estimating Species-Specific Diameter Distributions and Saw Log Recoveries of Boreal Forests from Airborne Laser Scanning Data and Aerial Photographs: A Distribution-Based Approach. Silva Fenn. 2008, 42, 625–641. [Google Scholar] [CrossRef] [Green Version]
  11. Gobakken, T.; Næsset, E. Estimation of Diameter and Basal Area Distributions in Coniferous Forest by Means of Airborne Laser Scanner Data. Scand. J. For. Res. 2004, 19, 529–542. [Google Scholar] [CrossRef]
  12. Laasasenaho, J. Taper curve and volume functions for pine, spruce and birch. Commun. Inst. For. Fenn. 1982, 108, 1–74. [Google Scholar]
  13. Mehtätalo, L. Valtakunnalliset puukohtaiset tukkivähennysmallit männylle, kuuselle, koivuille ja haavalle [Nationwide species-specific sawlog reduction models for Scots pine, Norway spruce, birches and aspen]. Metsätieteen Aikakausk. 2002, 4, 575–591. [Google Scholar] [CrossRef] [Green Version]
  14. Kangas, A.; Maltamo, M. Anticipating the Variance of Predicted Stand Volume and Timber Assortments with Respect to Stand Characteristics and Field Measurements. Silva Fenn. 2002, 36, 799–811. [Google Scholar] [CrossRef] [Green Version]
  15. Maltamo, M.; Karjalainen, T.; Repola, J.; Vauhkonen, J. Incorporating tree-and stand-level information on crown base height into multivariate forest management inventories based on airborne laser scanning. Silva Fenn. 2018, 52, 10006. [Google Scholar] [CrossRef]
  16. Holopainen, M.; Vastaranta, M.; Rasinmäki, J.; Kalliovirta, J.; Mäkinen, A.; Haapanen, R.; Melkas, T.; Yu, X.; Hyyppä, J. Uncertainty in timber assortment estimates predicted from forest inventory data. Eur. J. For. Res. 2010, 129, 1131–1142. [Google Scholar] [CrossRef]
  17. Karjalainen, T. Predicting commercial tree quality by means of airborne laser scanning. Diss. For. 2020, 307, 1–60. [Google Scholar] [CrossRef]
  18. Malinen, J.; Maltamo, M.; Harstela, P. Application of Most Similar Neighbor Inference for Estimating Marked Stand Characteristics Using Harvester and Inventory Generated Stem Databases. Int. J. For. Eng. 2001, 12, 33–41. [Google Scholar] [CrossRef]
  19. Kivinen, V.-P.; Uusitalo, J.; Nummi, T. Comparison of four measures designed for assessing the fit between the demand and output distributions of logs. Can. J. For. Res. 2005, 35, 693–702. [Google Scholar] [CrossRef]
  20. Kivinen, V.-P. Design and testing of stand-specific bucking instructions for use on modern cut-to-length harvesters. Diss. For. 2007, 37, 1–65. [Google Scholar] [CrossRef] [Green Version]
  21. Bouvier, M.; Durrieu, S.; Fournier, R.A.; Renaud, J.P. Generalizing predictive models of forest inventory attributes using an area-based approach with airborne LiDAR data. Remote Sens. Environ. 2015, 156, 322–334. [Google Scholar] [CrossRef]
  22. Vastaranta, M.; Yrttimaa, T.; Saarinen, N.; Yu, X.; Karjalainen, M.; Nurminen, K.; Karila, K.; Kankare, V.; Luoma, V.; Pyörälä, J.; et al. Airborne Laser Scanning Outperforms the Alternative 3D Techniques in Capturing Variation in Tree Height and Forest Density in Southern Boreal Forests. Balt. For. 2018, 24, 268–277. [Google Scholar]
  23. Pyörälä, J.; Saarinen, N.; Kankare, V.; Coops, N.C.; Liang, X.; Wang, Y.; Holopainen, M.; Hyyppä, J.; Vastaranta, M. Variability of wood properties using airborne and terrestrial laser scanning. Remote Sens. Environ. 2019, 235, 111474. [Google Scholar] [CrossRef]
  24. Bollandsås, O.M.; Maltamo, M.; Gobakken, T.; Lien, V.; Næssset, E. Prediction of Timber Quality Parameters of Forest Stands by Means of Small Footprint Airborne Laser Scanner Data. Int. J. For. Eng. 2011, 22, 14–23. [Google Scholar] [CrossRef]
  25. Saukkola, A.; Melkas, T.; Riekki, K.; Sirparanta, S.; Peuhkurinen, J.; Holopainen, M.; Hyyppä, J.; Vastaranta, M. Predicting Forest Inventory Attributes Using Airborne Laser Scanning, Aerial Imagery, and Harvester Data. Remote Sens. 2019, 11, 797. [Google Scholar] [CrossRef] [Green Version]
  26. Skogforsk. StanForD/StanForD 2010-Standard for Forest Machine Data and Communication. 2018. Available online: http://www.skogforsk.se/english/projects/stanford/ (accessed on 29 June 2021).
  27. Suomen Metsäkeskus. Puustotulkintakoealojen Maastotyöohje. 2018. Available online: https://www.metsakeskus.fi/sites/default/files/document/koealojen-maastotyoohje.pdf (accessed on 29 June 2021).
  28. Axelsson, P. DEM generation from laser scanner data using adaptive TIN models. In Proceedings of the International Archives of Photogrammetry and Remote Sensing, Amsterdam, The Netherlands, 16–22 July 2000; pp. 110–117. [Google Scholar]
  29. Valbuena, R.; Mauro, F.; Arjonilla, F.J.; Manzanera, J.A. Comparing airborne laser scanning-imagery fusion methods based on geometric accuracy in forested areas. Remote Sens. Environ. 2011, 115, 1942–1954. [Google Scholar] [CrossRef]
  30. Malinen, J.; Kilpeläinen, H.; Verkasalo, E. Validating the predicted saw log and pulpwood proportions and gross value of Scots pine and Norway spruce harvest at stand level by Most Similar Neighbour analyses and a stem quality database. Silva Fenn. 2018, 52, 9972. [Google Scholar] [CrossRef]
  31. Malinen, J.; Kilpeläinen, H.; Ylisirniö, K. Description and evaluation of Prehas software for pre-harvest assessment of timber assortments. Int. J. For. Eng. 2014, 25, 66–74. [Google Scholar] [CrossRef]
  32. Metsäkustannus Oy. Roundwood Prices for Standing Sales. 2021. Available online: https://www.metsalehti.fi/puunhinta/puunhinta/ (accessed on 27 April 2021).
  33. Paavilainen, L. (Ed.) Finnish Forest Cluster Research Programme WOOD WISDOM (1998–2001); Tekes: Helsinki, Finland, 2002; pp. 1–441. [Google Scholar]
  34. Sanz, B.; Malinen, J.; Heiskanen, J.; Tokola, T. Need for Pre-Harvest Clearing of Understory Vegetation Determined by Airborne Laser Scanning. Forests 2020, 11, 294. [Google Scholar] [CrossRef] [Green Version]
  35. Vähä-Konka, V.; Maltamo, M.; Pukkala, T.; Kärhä, K. Evaluating the accuracy of ALS-based removal estimates against actual logging data. Ann. For. Sci. 2020, 77, 84. [Google Scholar] [CrossRef]
  36. Tokola, T.; Heikkilä, J. Improving Satellite Image Based Forest Inventory by Using A Priori Site Quality Information. Silva Fenn. 1997, 31, 67–78. [Google Scholar] [CrossRef] [Green Version]
Figure 1. (a) Location of the area of Southern Finland studied; (b) the harvested stands (grey circles) and the field plots (black circles) investigated.
Forests 12 01221 g001
Figure 2. Flowchart of the methodology followed to obtain the timber assortments and error statistics.
Forests 12 01221 g002
Figure 3. Residual errors for the timber assortment volumes for Norway spruce (a), Scots pine (b) and birch (c), and values for Norway spruce (d), Scots pine (e) and birch (f).
Forests 12 01221 g003
Table 1. Forest structure within the 665 field plots and the 249 harvested stands.
Field PlotsHarvested Stands
VariableMinimumMeanMaximumSDMinimumMeanMaximumSD
DBH (cm)5.019.847.38.77.422.4413.9
Height (m)4.716.832.75.97.519.325.12.3
Density (stems·ha−1)6013988205109132.9519.91093217.7
Volume (m3·ha−1)7.0193.9693.3127.98.8235565.2110.5
Basal area (m2·ha−1)2.322.152.210.21.221.550.69
Norway spruce basal area (m2·ha−1)0.09.952.211.9014.8388.6
Scots pine basal area (m2·ha−1)0.07.440.99.702.420.43.8
Birch basal area (m2·ha−1)0.04.738.26.203.5283.7
Note: SD: standard deviation; DBH: basal area weighted mean diameter at breast height; Height: basal area weighted mean height.
Table 2. Distinctions between the calculation scenarios.
Bucking MethodTimber AssortmentsQuality Included
Scenario 1Maximum sawlog and pulpwood volumesSawlogsNo
Pulpwood
Scenario 2Scots pine and Norway spruce: sawlog lengths at 30 cm intervals
Birch: veneer logs of lengths 4.7 m, 5.0 m, 6.0 m and 6.7 m
SawlogsNo
Pulpwood
Scenario 3Scots pine and Norway spruce: sawlog lengths at 30 cm intervals
Birch: veneer logs of lengths 4.7 m, 5.0 m, 6.0 m and 6.7 m
SawlogsYes
Pulpwood
Scenario 4Sawlog lengths at 30 cm intervalsGrade A butt logs (only for Scots pine)Yes
Sawlogs
Small-diameter logs
Pulpwood
Table 3. Minimum and maximum parameters used in bucking.
Minimum Diameter (cm)Minimum Length (m)Maximum Length (m)Minimum WPC (EUR/m3)Maximum WPC (EUR/m3)
Scots pineGrade A butt logs21.02.86.168129
Sawlogs15.03.75.85798
Small-diameter logs12.03.14.02865
Pulpwood7.02.85.21717
Norway spruceSawlogs16.03.76.16298
Small-diameter logs12.02.84.93165
Pulpwood7.02.85.22626
BirchSawlogs18.04.76.75565
Pulpwood7.02.86.11717
Note: WPC, wood paying capability.
Table 4. Timber assortment volume estimates and their error statistics at the stand level (n = 249 stands).
Norway Spruce (Picea abies)Scots Pine (Pinus sylvestris)Birch (Betula spp.)
Scenario 1Scenario 2Scenario 3Scenario 4Scenario 1Scenario 2Scenario 3Scenario 4Scenario 1Scenario 2Scenario 3
Sawlogs
Average volume based on harvester data (m3·ha−1)126.8121.6116.1115.421.321.116.410.924.018.510.6
Average volume based on ABA data (m3·ha−1)114.9109.1105.0104.326.326.020.812.618.713.77.5
RMSE (m3·ha−1)53.451.949.349.132.331.924.616.530.226.716.6
RMSE%42.142.742.542.5151.3151.1150.4152.1126.0144.2157.1
Bias (m3·ha−1)11.912.511.111.2−4.9−4.9−4.5−1.75.34.83.1
Bias%9.410.39.69.7−23.2−23.0−27.3−16.122.026.128.8
SD (m3·ha−1)52.150.448.147.931.931.624.316.529.826.316.4
Pulpwood
Average volume based on harvester data (m3·ha−1)23.028.332.819.02.72.97.35.88.413.920.8
Average volume based on ABA data (m3·ha−1)26.932.836.119.85.35.610.47.79.614.720.5
RMSE (m3·ha−1)15.117.820.212.25.86.011.69.58.212.318.6
RMSE%65.762.861.564.4217.5208.3158.6163.198.088.589.5
Bias (m3·ha−1)−4.0−4.5−3.3−0.8−2.6−2.7−3.1−1.9−1.3−0.80.3
Bias%−17.2−15.9−10.1−4.1−98.0−94.1−41.7−32.6−15.3−6.11.5
SD (m3·ha−1)14.617.220.012.25.25.311.29.38.112.318.6
Residual wood
Average volume based on harvester data (m3·ha−1)5.55.46.36.40.50.50.80.91.51.52.5
Average volume based on ABA data (m3·ha−1)4.24.04.85.00.60.61.01.11.71.72.1
RMSE (m3·ha−1)3.63.64.04.00.80.81.31.41.81.73.7
RMSE%66.266.862.862.2167.3169.5158.7155.1118.2119.4147.2
Bias (m3·ha−1)1.31.31.51.5−0.1−0.1−0.2−0.2−0.2−0.20.4
Bias%24.425.023.422.7−23.4−23.4−19.5−17.7−12.9−13.116.9
SD (m3·ha−1)3.43.33.73.70.80.81.31.41.81.73.6
Note: ABA: area-based approach; RMSE: root mean square error; RMSE%: relative root mean square error; bias%: relative bias; SD: standard deviation. Volume estimates for grade A butt logs and small-diameter logs in the timber assortments and their error statistics in Scenario 4 are shown in Table 6.
Table 5. Wood paying capability (WPC) estimates for the timber assortments and their error statistics at the stand level (n = 249 stands).
Norway Spruce (Picea abies)Scots Pine (Pinus sylvestris)Birch (Betula spp.)
Scenario 2Scenario 3Scenario 4Scenario 2Scenario 3Scenario 4Scenario 2Scenario 3
Total
Average WPC based on harvester data (EUR·m−3)68.065.566.652.142.848.532.824.8
Average WPC based on ABA data (EUR·m−3)63.361.562.961.151.359.630.923.8
RMSE (EUR·m−3)17.516.316.132.627.632.015.310.7
RMSE%25.724.824.162.764.466.146.643.1
Bias (EUR·m−3)4.64.03.7−9.0−8.5−11.11.81.0
Bias%6.86.15.6−17.2−20.0−22.95.54.0
SD (EUR·m−3)16.915.815.731.526.330.115.210.7
Sawlogs
Average WPC based on harvester data (EUR·m−3)82.982.582.758.857.155.249.047.5
Average WPC based on ABA data (EUR·m−3)79.579.279.472.370.269.046.645.5
RMSE (EUR·m−3)23.823.924.038.837.437.922.422.6
RMSE%28.729.029.066.065.568.745.747.4
Bias (EUR·m−3)3.43.33.3−13.5−13.1−13.82.42.1
Bias%4.14.04.0−22.9−23.0−24.94.94.3
SD (EUR·m−3)23.623.723.936.535.135.422.322.5
Pulpwood
Average WPC based on harvester data (EUR·m−3)25.725.725.712.812.812.815.915.9
Average WPC based on ABA data (EUR·m−3)25.225.225.215.615.615.616.016.0
RMSE (EUR·m−3)4.94.94.98.18.18.14.74.7
RMSE%19.319.319.363.763.763.729.529.5
Bias (EUR·m−3)0.50.50.5−2.8−2.8−2.8−0.1−0.1
Bias%2.02.02.0−21.9−21.9−21.9−0.4−0.4
SD (EUR·m−3)4.94.94.97.77.77.74.74.7
Note: ABA: area-based approach; RMSE: root mean square error; RMSE%: relative root mean square error; bias%: relative bias; SD: standard deviation. WPC estimates for grade A butt logs and small-diameter logs in the timber assortments and their error statistics in Scenario 4 are shown in Table 6.
Table 6. Volume and wood paying capability (WPC) estimates for the total volume and timber assortments of grade A butt logs and small-diameter logs and their error statistics at the stand level (n = 249 stands).
Total VolumeGrade A Butt Logs
(Scenario 4)
Small-Diameter Logs
(Scenario 4)
Norway Spruce (Picea abies)Scots Pine (Pinus sylvestris)Birch (Betula spp.)Norway Spruce (Picea abies)Scots Pine (Pinus sylvestris)Birch (Betula spp.)Scots pine (Pinus sylvestris)Norway Spruce (Picea abies)Scots Pine (Pinus sylvestris)Norway Spruce (Picea abies)Scots Pine (Pinus sylvestris)
Volume before BuckingVolume after BuckingVolumeWPCVolumeWPC
Average volume (m3·ha−1) or WPC (EUR·m−3) based on harvester data166.834.337.4155.324.533.85.272.514.41.736.536.1
Average volume (m3·ha−1) or WPC (EUR·m−3) based on ABA data154.836.532.4145.932.230.17.493.617.03.335.946.9
RMSE (m3·ha−1 or EUR·m−3)69.237.636.563.735.935.48.454.79.63.58.127.3
RMSE%42.0146.1103.741.0146.4104.6162.075.566.4206.822.375.8
Bias (m3·ha−1 or EUR·m−3)14.4−7.74.69.3−7.73.8−2.2−21.1−2.5−1.60.6−10.9
Bias%8.7−29.913.06.0−31.311.2−43.0−29.1−17.5−95.91.7−30.2
SD (m3·ha−1 or EUR·m−3)67.836.936.363.135.135.38.150.69.33.18.125.1
Note: ABA: area-based approach; RMSE: root mean square error; RMSE%: relative root mean square error; bias%: relative bias; SD: standard deviation. Sawlog and pulpwood volume and WPC estimates for timber assortments and their error statistics in Scenario 4 are shown in Table 4 and Table 5.
Publisher’s Note: MDPI stays neutral with regard to jurisdictional claims in published maps and institutional affiliations.

