Article

Metabolically Active Prokaryotic Complex in Grassland and Forests’ Sod-Podzol under Polycyclic Aromatic Hydrocarbon Influence

by
Natalia A. Manucharova
*,
Lev A. Pozdnyakov
,
Anastasiya P. Vlasova
,
Anastasiya S. Yanovich
,
Natalia A. Ksenofontova
,
Maria A. Kovalenko
,
Pavel Y. Stepanov
,
Alexander N. Gennadiev
,
Alla V. Golovchenko
and
Alexey L. Stepanov
Department of Soil Biology, Lomonosov Moscow State University, 1–12, GSP-1, Leninskie Gory, 119991 Moscow, Russia
*
Author to whom correspondence should be addressed.
Forests 2021, 12(8), 1103; https://doi.org/10.3390/f12081103
Submission received: 8 June 2021 / Revised: 13 August 2021 / Accepted: 16 August 2021 / Published: 18 August 2021
(This article belongs to the Special Issue Forest Soil Carbon and Climate Changes)

Abstract

:
Molecular genetic techniques (FISH, RT-PCR, and metagenomic analysis) were used to investigate the comparative functional biodiversity in the prokaryotic complex in grassland and forests’ sod-podzol under polycyclic aromatic hydrocarbon influence. The polluted samples showed a decrease in the biomass of the prokaryotic community representatives and a change in the metabolically active dominants–representatives of the Bacteria and Archaea domains compared to the control samples. The suppression of the metabolic activity of prokaryote cells under the influence of PAHs in sod-podzolic soil under meadow vegetation was more pronounced compared to soils under forest vegetation. The representatives of prokaryotes that are sensitive and resistant to the studied PAHs were identified. The representatives of the phylogenetic groups from the bacterial complex resistant to PAH pollution were Proteobacteria (Alphaproteobacteria), Bacteroidetes, Firmicutes, Chloroflexi, and Thaumarhaeota in the archaeal complex. Representatives of the phylum Acidobacteria and Actinobacteria (Streptosporangiales) are noted among those sensitive to PAH contamination. The presence and expression of the functional alkane monooxygenase (alkB) gene were established in all the experimental variants studied. In the plant variants, the number of copies of alkB genes increased by an order of magnitude and the biomass of metabolically active prokaryotic representatives with the functional alkB gene doubled compared to the unpolluted territories. The copy number index of the alkB gene can be used as one of the parameters when characterizing an ecosystem for the presence of PAH pollutants.

Graphical Abstract

1. Introduction

Pollution of ecosystems with polycyclic aromatic hydrocarbon (PAH) is one of the most important problems of modern ecology. Anthropogenic influence on the environment is becoming more and more irreversible. PAH compounds are the most dangerous among those produced as a result of burning fossil fuels and as by-products inpulp and paper, chemical, petrochemical, and metallurgical industries [1]. Large industrial sites and municipal lands are the most contaminated [2].
PAHs have basic properties of persistent organic pollutants (POPs): environmental stability, acute and chronic toxicity, degradation resistance, environmental transboundary flows over long distances, and bioaccumulation.
The state of soil microbial communities (SMC) depends on many factors and is mostly sensitive to changes in the water regime, structure of the soil adsorption complex, and the level of toxic pollution. SMCs respond to the influence of such factors in a manner that alters its ecotrophic structure and species composition, leads to changes in the circulation direction of biogenic elements, causes a disturbance of the ecological functions of the soil, and increases phytotoxicity [3].
Microbial oxidation is the most effective means to destroy PAH based on the studies of the processes behind their biological degradation. Selectivity of the microbial degradation and oxidation rate of PAHs depend on the starting chemical properties and structure of a PAH, such as the number of aromatic rings in the molecule, presence and size of side substituents, and degree of ring saturation.
With the advancement of methods in molecular genetics to study functional and structural genomics of destructing bacteria, a general understanding now exists regarding the molecular mechanisms of biodegradation of the above mentioned compounds, as well as the possibility to evaluate microbial activity in soil affected by different levels of PAH pollution.
In situ remediation technologies for the soils polluted with benzo[a]pyrene that combine humin and humin-mineral compounds with selected additives of bio-destructors of organic compounds (such has bacteria and fungi) are promising. Therefore, it has become a pressing issue to search for new bacterial strains for soil recultivation that could be resistant to the conditions of territories under restoration and provide significant utilization of PAH.
The aim of this study was to assess the effect of PAHs on the metabolically active prokaryotes of sod-podzolic soils under forest and meadow vegetations.
While evaluating metabolically active prokaryotic natural complexes, special attention was paid to the analysis of the dynamics of structural and functional indicators during the succession of microbial communities of terrestrial biocenoses.
The dynamics of carbon dioxide emission from samples; the diversity and abundance of metabolically active cells of the prokaryotic microbial community of sod-podzolic soil; and the presence and expression of alkan-monooxygenase (alkB), the functional gene responsible for the degradation of n-alkanes contaminated with PAHs and in the control during the succession initiated by moistening the samples, were studied.

2. Materials and Methods

The objects of the study were samples of the humus horizon (A) of sod-podzolic soil (sampling depth of 5–10 cm) taken from a plot located in the subzone of mixed coniferous-broad-leaved forests in the Noginsk district of the Moscow region, within the city limits of Electrougli and parts of suburban areas located to the east of the city, in June 2019 (GPS coordinates of the sampling locations are shown in Table 1). Soil samples under forest and meadow vegetationswere taken at distances of 0.3 km and 12 km (control) from the Elektorougli Technical Carbon Plant, CJSC, which operates in the chemical and oil refining industry. Predominant soils were Sod-podzolic and Agrozeme salfegumusor Umbric Luvisol and Antric Podzol, respectively [4] (Table 1). An average sample was taken from each site and analyzed in five repetitions. From the moment of sampling until the moment of study, the samples were stored in a freezer at −18 °C. The study area has been under technogenic impact caused by the operation of the Elektorougli Technical Carbon Plant for a long time. Pollutants in most areas came from this source through the atmosphere. A large amount of solid material, represented by various industrial wastes including hydrocarbon-containing substances, were present within and near the industrial zone [5].
Chemical analysis data on the content of the most common groups of polycyclic aromatic hydrocarbons, as well as the total content of PAHs, was available for each sample (Table 2) [5]. Organic horizons of forest soils and urban soils may even reach individual PAH concentrations of several 100 μg kg−1 [6].
Microbial succession in the soil samples was initiated by the soil moisture pressure matrix −3.2 kPa and microcosms were incubated at 27 °C, which corresponds to the most optimal conditions for the development of most microorganisms. Soil collected at 12 km from the pollution source moistened with 1 mL of water served as a background control. The experiment was conducted for 30 days.

Research Methods

The total number and number of metabolically active cells in the studied samples were determined by microscopic FISH method (fluorescent in situ hybridization for cells) using different fluorochromes, namely acridine orange and Cy3 [7]. Cell counting was performed on the tenth day of hydration-initiated succession.
The total number of prokaryotes was determined using acridine orange dye reacting with cell DNA. The number of metabolically active cells was established by staining the rRNA in the cells with specific fluorescent-labeled oligonucleotide probes, which allowed not only evaluate the viability of microorganisms but also study microbial diversity in situ. A set of probes specific to the Archaea and Bacteria domains were applied to the studied samples. The oligonucleotide sequences of the probes are shown in Table 3.
All bacteria observed were individual. Desorption of microorganisms from various plant organs and soils was carried out using an UZDN-1 ultrasonic unit (2 min, current 0.40 A, frequency 22 kHz). The Axioskop 2 plus microscope (ZEISS, Germany) was used for the direct counting of microorganisms. The Axioskop 2 plus microscope equipped with Filter set 15 for the probes (Cy3) and Filter set 09 for acridine orange staining was used. The number of microbial cells contained in 1 g of the sample was calculated according to the formula: N = S1an/vS2c, where N is the number of bacterial cells (or mycelium length in µm) in 1 g of the soil sample; S1 is the area of the sample in μm2; a is the number of cells (or mycelium length, μm) in one field of view (averaging was performed for all preparations); n is the index of suspension dilution in mL; v is the volume of the drop applied to the slide in mL; S2 is the area of the microscope field in μm2; and c is the weight of the soil sample in g. The specific bacterial mass was assumed equal to 1 g/cm3 and the water content in cells was 80%. The biomass of microbial cells was calculated assuming the following values for dry biomass: 2 × 10⁻¹⁴ g for one bacterial cell with a volume of 0.1 µm3 and 3.9 × 10⁻⁸ g for 1 m of actinomycete mycelium with a diameter of 0.5 µm [7].
A similar in situ hybridization method with rRNA-specific fluorescent-labeled oligonucleotide probes (FISH, fluorescent in situ hybridization) was used to determine the expression of the functional gene alkane monooxygenase (alkB), responsible for the destruction of n-alkanes in the studied samples [8]. The primer was designed based on the Pesudomonas AJ233397 alkB gene sequence. The target amplification region was 870 base pairs.
Hybridization of the samples with fluorescence-labeled probes was performed at 46 °C and 50% formamide [23]. The hybridization conditions used for the alkB probes, formamide concentration in the hybridization buffer, and NaCl concentration in the washing buffer are shown in Table 4.
The real-time PCR method was used for the quantitative analysis of the number of DNA copies of bacteria carrying the functional gene alkB responsible for n-alkane degradation.
The Standard Power Soil DNA Isolation Kit (MO BIO, Carlsbad, CA, USA) was used for the total DNA extraction, following the manufacturer’s instructions.
The measurement was performed on a DTLite4 DNA-Technology detection amplifier on certain days of succession (day 14 after hydration-initiated succession). Obtained results were processed using the program package Realtime_PCR. This DTLite4 detection amplifier combines the functions of a programmable thermocycler and an optical system to record the fluorescence of the reaction mixture in test tubes during the polymerase chain reaction. SYBR® Green intercalating dye and primer-bound dyes (light cycler: two probes that bind to the target DNA short distance from each other) were used. The reaction mixture was prepared using Super MixEva Green Biorad (concentrated buffer with deoxyribonucleotides, Sso7d-fusion polymerase, MgCl2, EvaGreen dye, and stabilizers). The instrument was calibrated based on the correlation of the fluorescence intensity and logarithm of the DNA concentrations in standard solutions. Streptomyces violaceus [sec. Roseus: ser. Roseoviolaceus] culture, capable of using hydrocarbons as the only nutrient source (toluene), was used as a standard. The primer sequences used to identify representatives possessing the functional alkB gene are presented in Table 5.
The following protocol for amplification was used: First, 1 cycle: 94.0 °C for 5 min. Second, 30 cycles: 94.0 °C for 1 min; 60 °C for 1 min; and 72 °C for 1 min. Third, 1 cycle: 72 °C for 3 min. Fourth, 1 cycle: 4 °C of cooling [24].
The amount of tested DNA was expressed in absolute or relative units. Each DNA matrix quantification requires three standards and a negative control (sample without DNA matrix).
The data were statistically processed using STATISTICA 8.0 software. An average sample was taken from the site and examined in 5-fold replications. The ANOVA analysis of variance was applied to the results. The Shapirotest showed a normal distribution of results. An LSD test was applied to the results.
To analyze the biodiversity of the prokaryotic complex of the studied soil samples, we used the method of high-throughput sequencing of the conserved 16S rRNA gene region. Amplification of 16S rRNA gene fragments was performed using degenerate primers complementary to the sequences of both bacteria and archaea:PRK341F (CCTACGGGRBGCASCAG) and PRK806R (GGACTACYVGGGTATCTAAT). The obtained PCR fragments were purified via QIAquick columns according to the manufacturer’s protocol. Each PCR fragment was dissolved in 50 μL of TE buffer; the obtained material was sufficient for further analysis. The nucleotide sequences of variable 16S ribosomal RNA gene fragments from metagenomic DNA samples were determined by high-throughput sequencing. Sequencing was performed on an Illumina MiSeq polygenomic sequencer with the read time of 39 h and the number of pair-end reads of8 million. After the reads from both ends of the DNA were collected, a file was generated with forward and reverse reads, which represented a textual description of the primary structure of linear macromolecules in the form of a monomer sequence. Sequencing data processing was performed using an automated algorithm, namely QIIME 1.9.1, which included unification of the forward and reverse reads; deletion of technical sequences; filtering out of sequences with low read reliability scores for single nucleotides (quality less than Q20) and chimeric sequences; alignment of reads with the reference of the 16S rRNA sequence; and distribution of sequences into taxonomic units with the help of the Silva database version 132. We used an algorithm for the classification of operational taxonomic units (OTUs) with an open-reference OTU classification threshold of 97%.
The gas chromatography method was used to study carbon dioxide emissions from soil samples. Gas samples were taken using a syringe. The instrument was a chromatograph with a thermal conductivity detector. The column length was 3 m and Polysorb-1 was used as the filler. The flow rate of the carrier gas (He) was 25 mL/min. Soil samples (5 replications, 5 g each) were placed in hermetically sealed vials. The accumulation of carbon dioxide in the gas phase over the samples was evaluated after one day of incubation at room temperature. Soil collected 12 km from the pollution source served as a background control. Measurements were taken on the second, fourth, seventh, ninth, fourteenth, and twenty-first days. The experiment was conducted for 30 days. Calculationswere carried out according to Formula (1):
µgC:CO2/g soil × day = [instrument readings] × 0.002124 × 12 × Va/m × t,
where Va is the volume of air in the vial ml; m is the weight of the soil sample in g; t is the time of incubation between vial airing and measuring in days; 12 g/mol is the molecular weight of carbon; and 0.002124 is the calibration factor.

3. Results

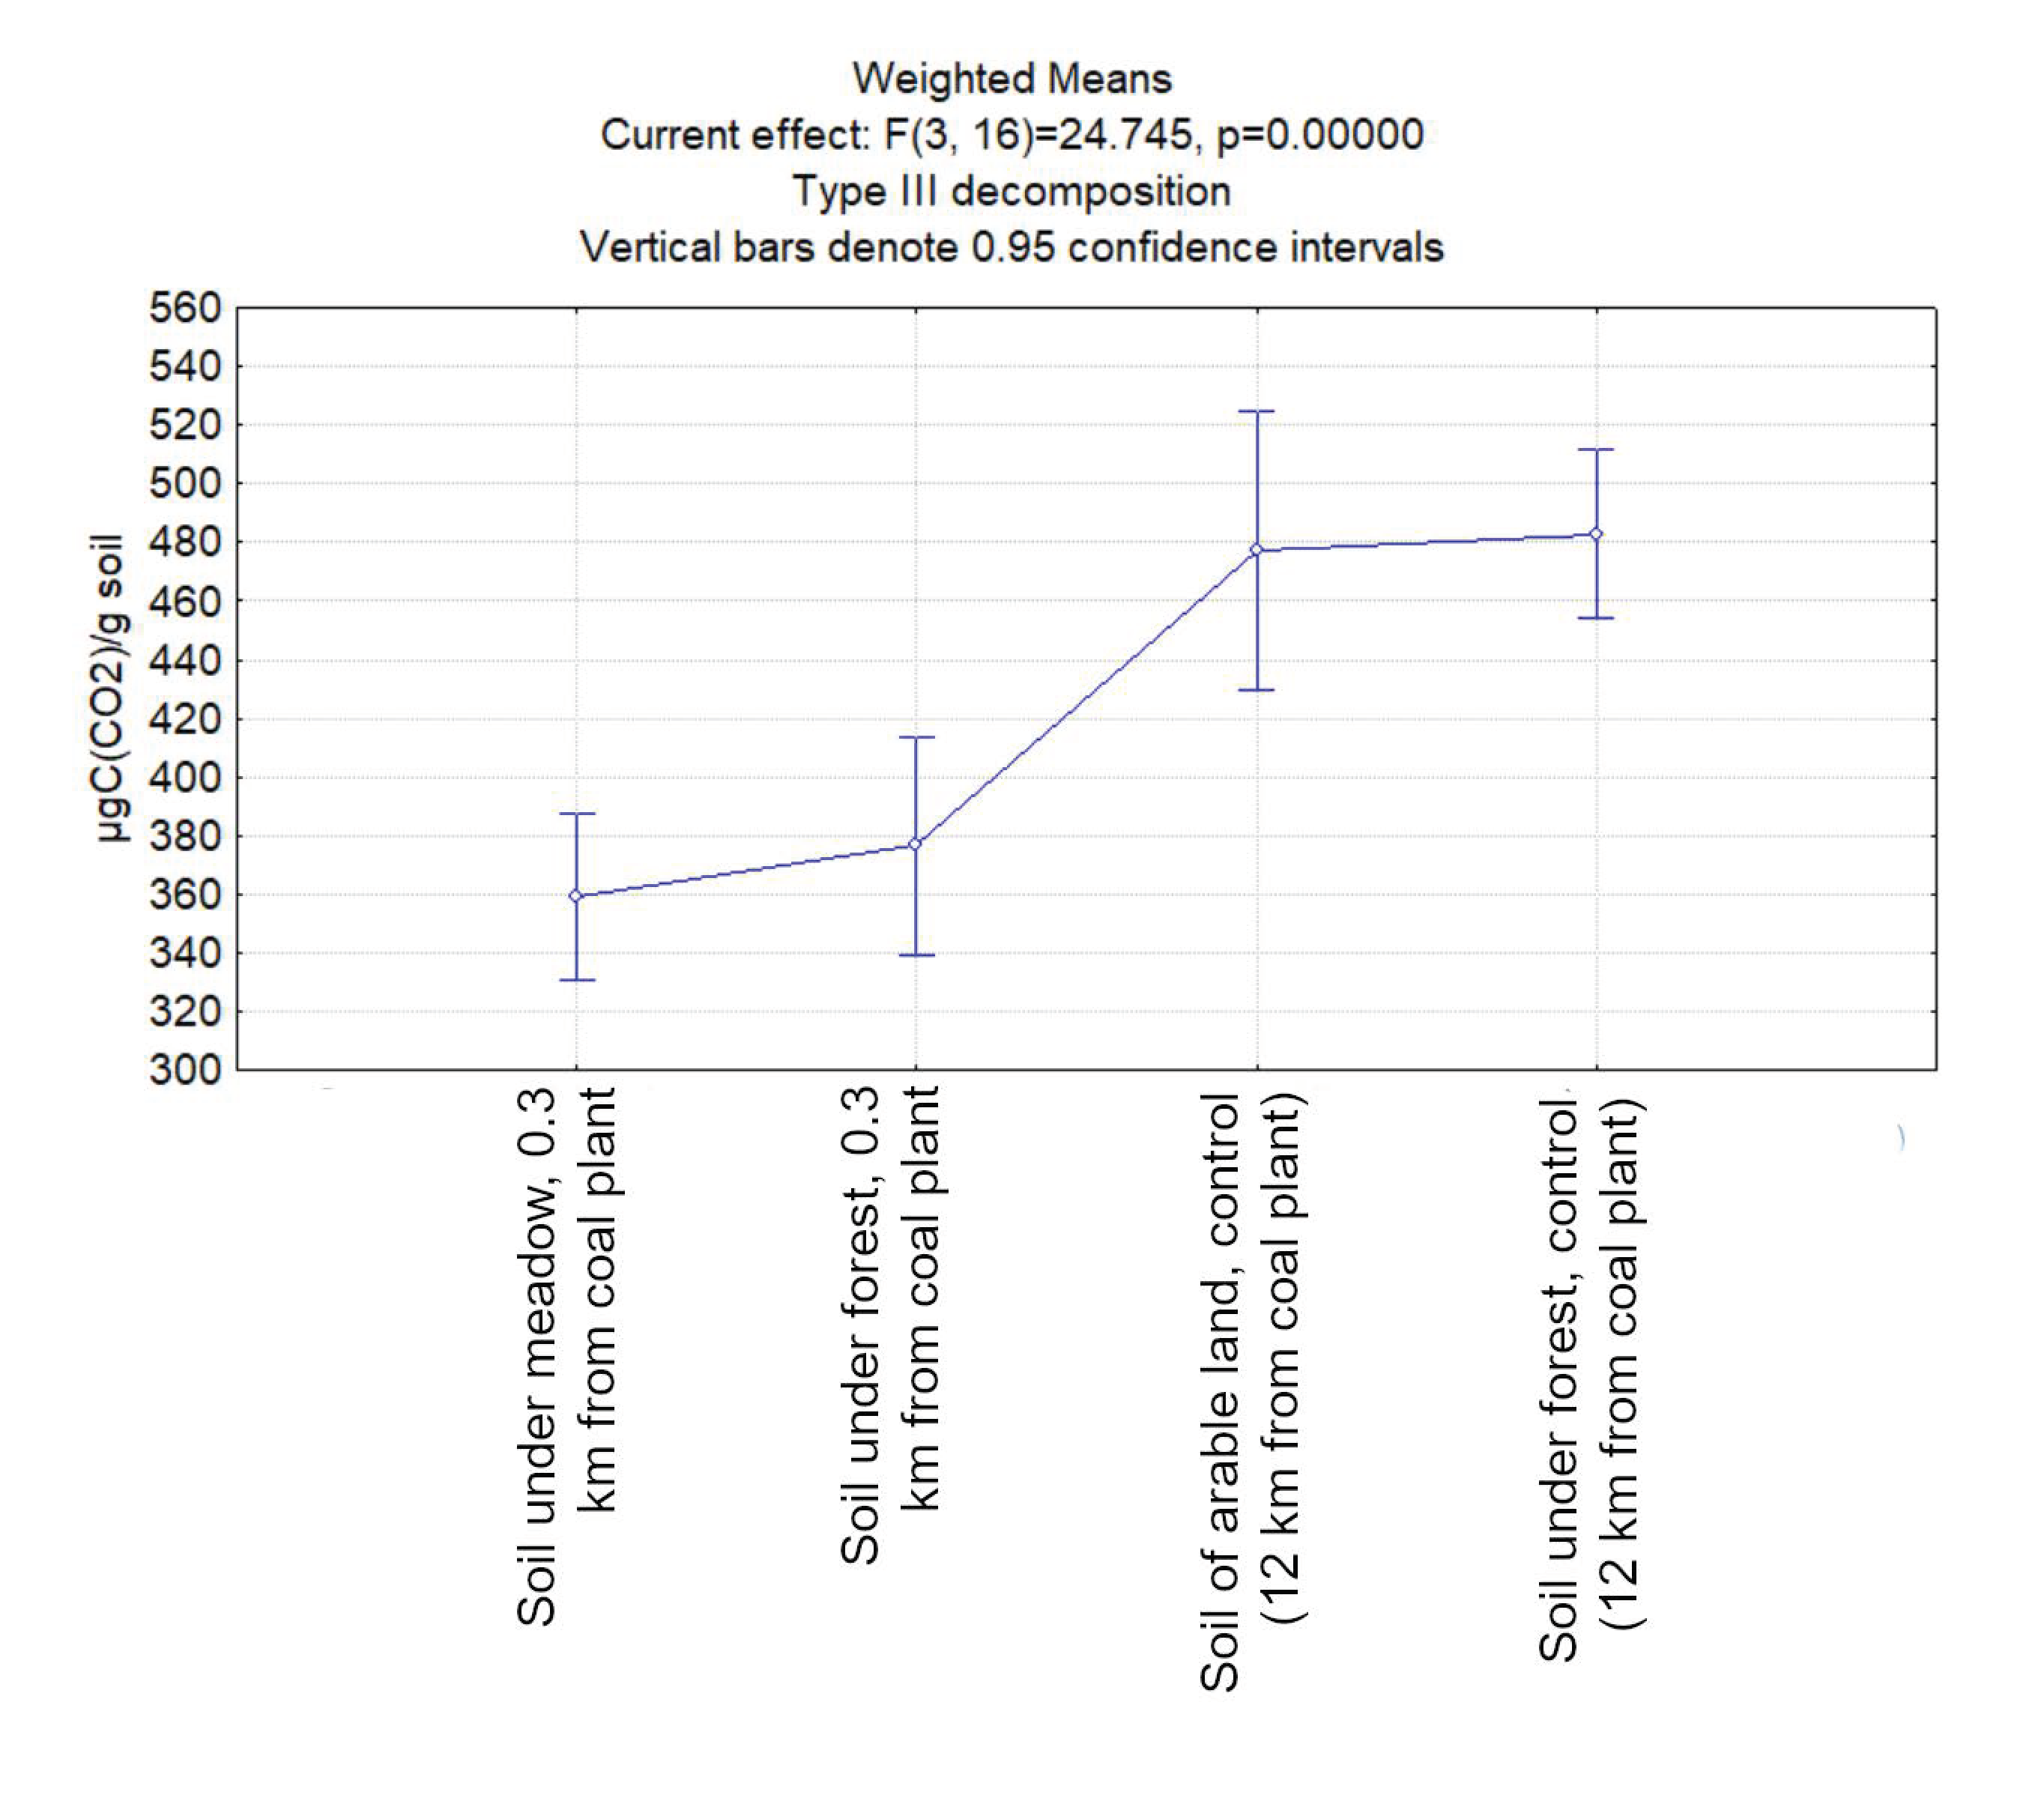
3.1. Carbon Dioxide Emission from the Studied Soil Samples

In order to assess the effect of PAHs on soil microorganisms, the method of succession initiation by wetting was applied. Samples taken at a distance of 12 km from the plant and moistened with water served as a control. The intensity of processes in the control was determined by the rate of the decomposition of organic matter present in the soil. We considered the parameters of carbon dioxide emission activity as one of the indicators of the impact of polycyclic aromatic hydrocarbons on the metabolic activity of the microbial community.
When comparing soil samples taken from the meadow and forest, as the distance from the source of pollution increased, all three locations showed an increase in carbon dioxide emission from 360 to 480 µg C-CO2/g day. The graph of combined CO2 emission also showed a clear relationship between the activity of carbon dioxide emission by soil organisms and the proximity of the samples to the source of pollution. The higher the concentrations of PAH in soil, the lower the total amount of CO2 emitted by microbiota during the experiment (Figure 1, Table 6).

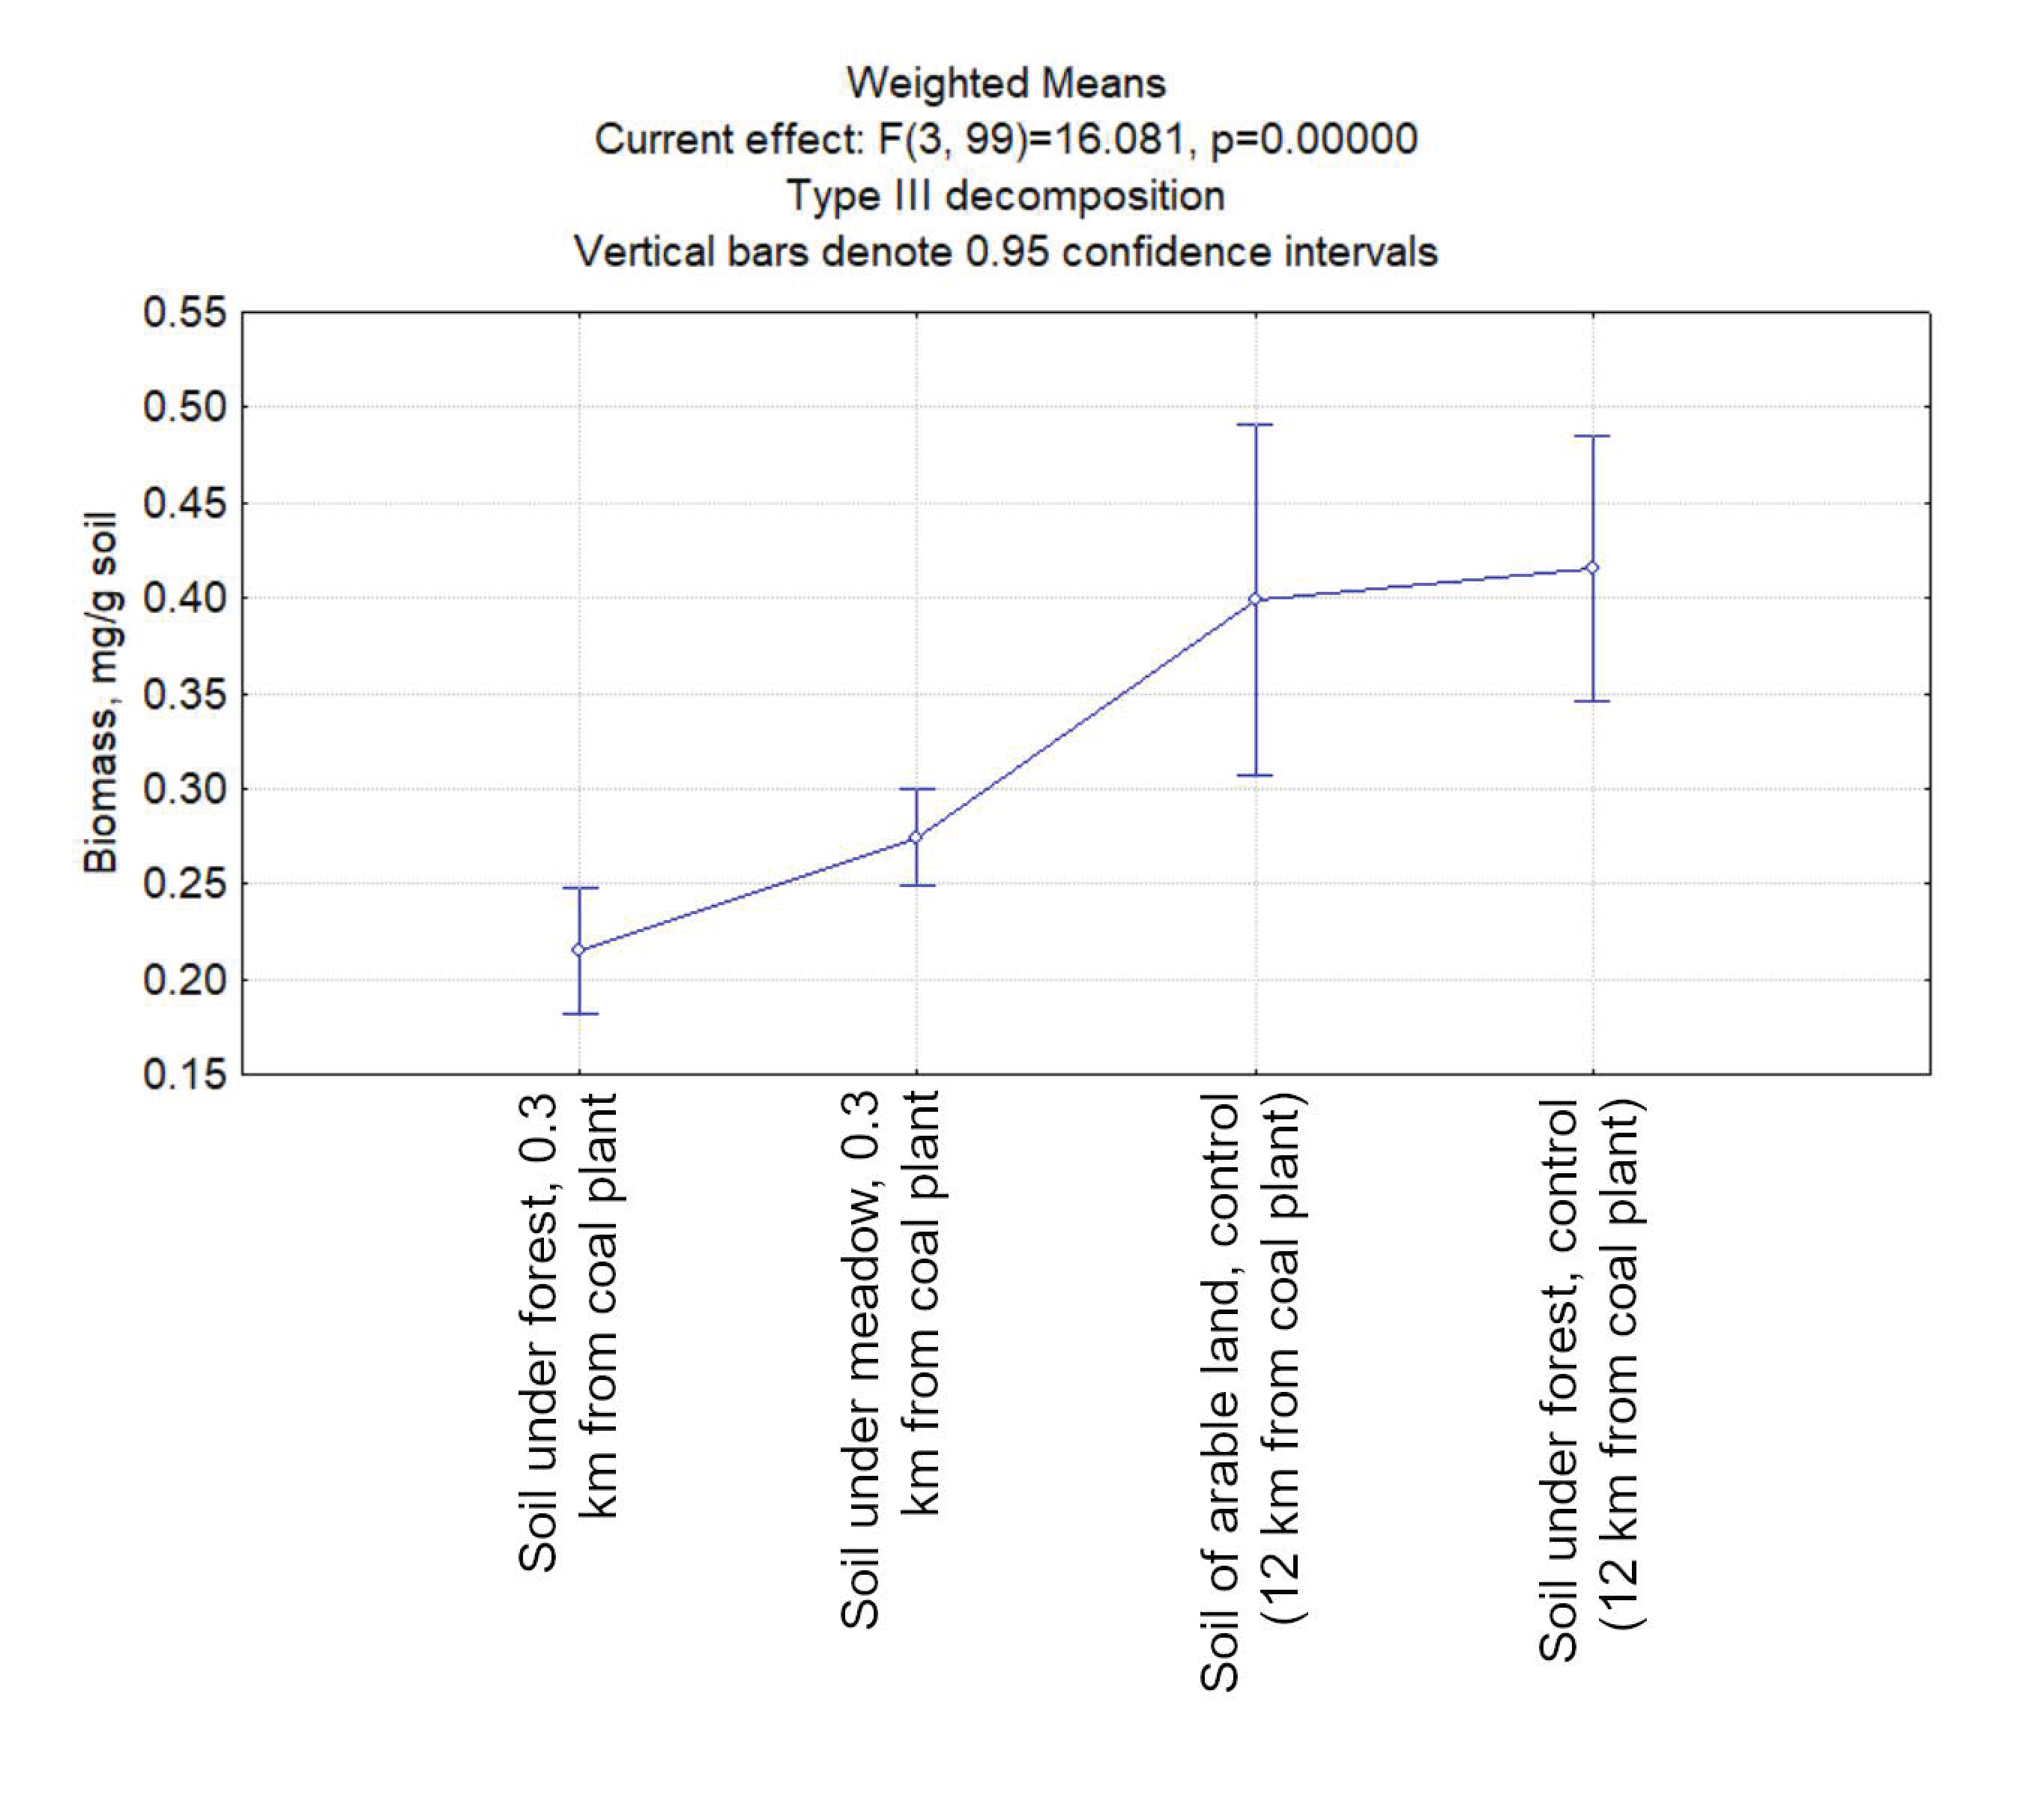
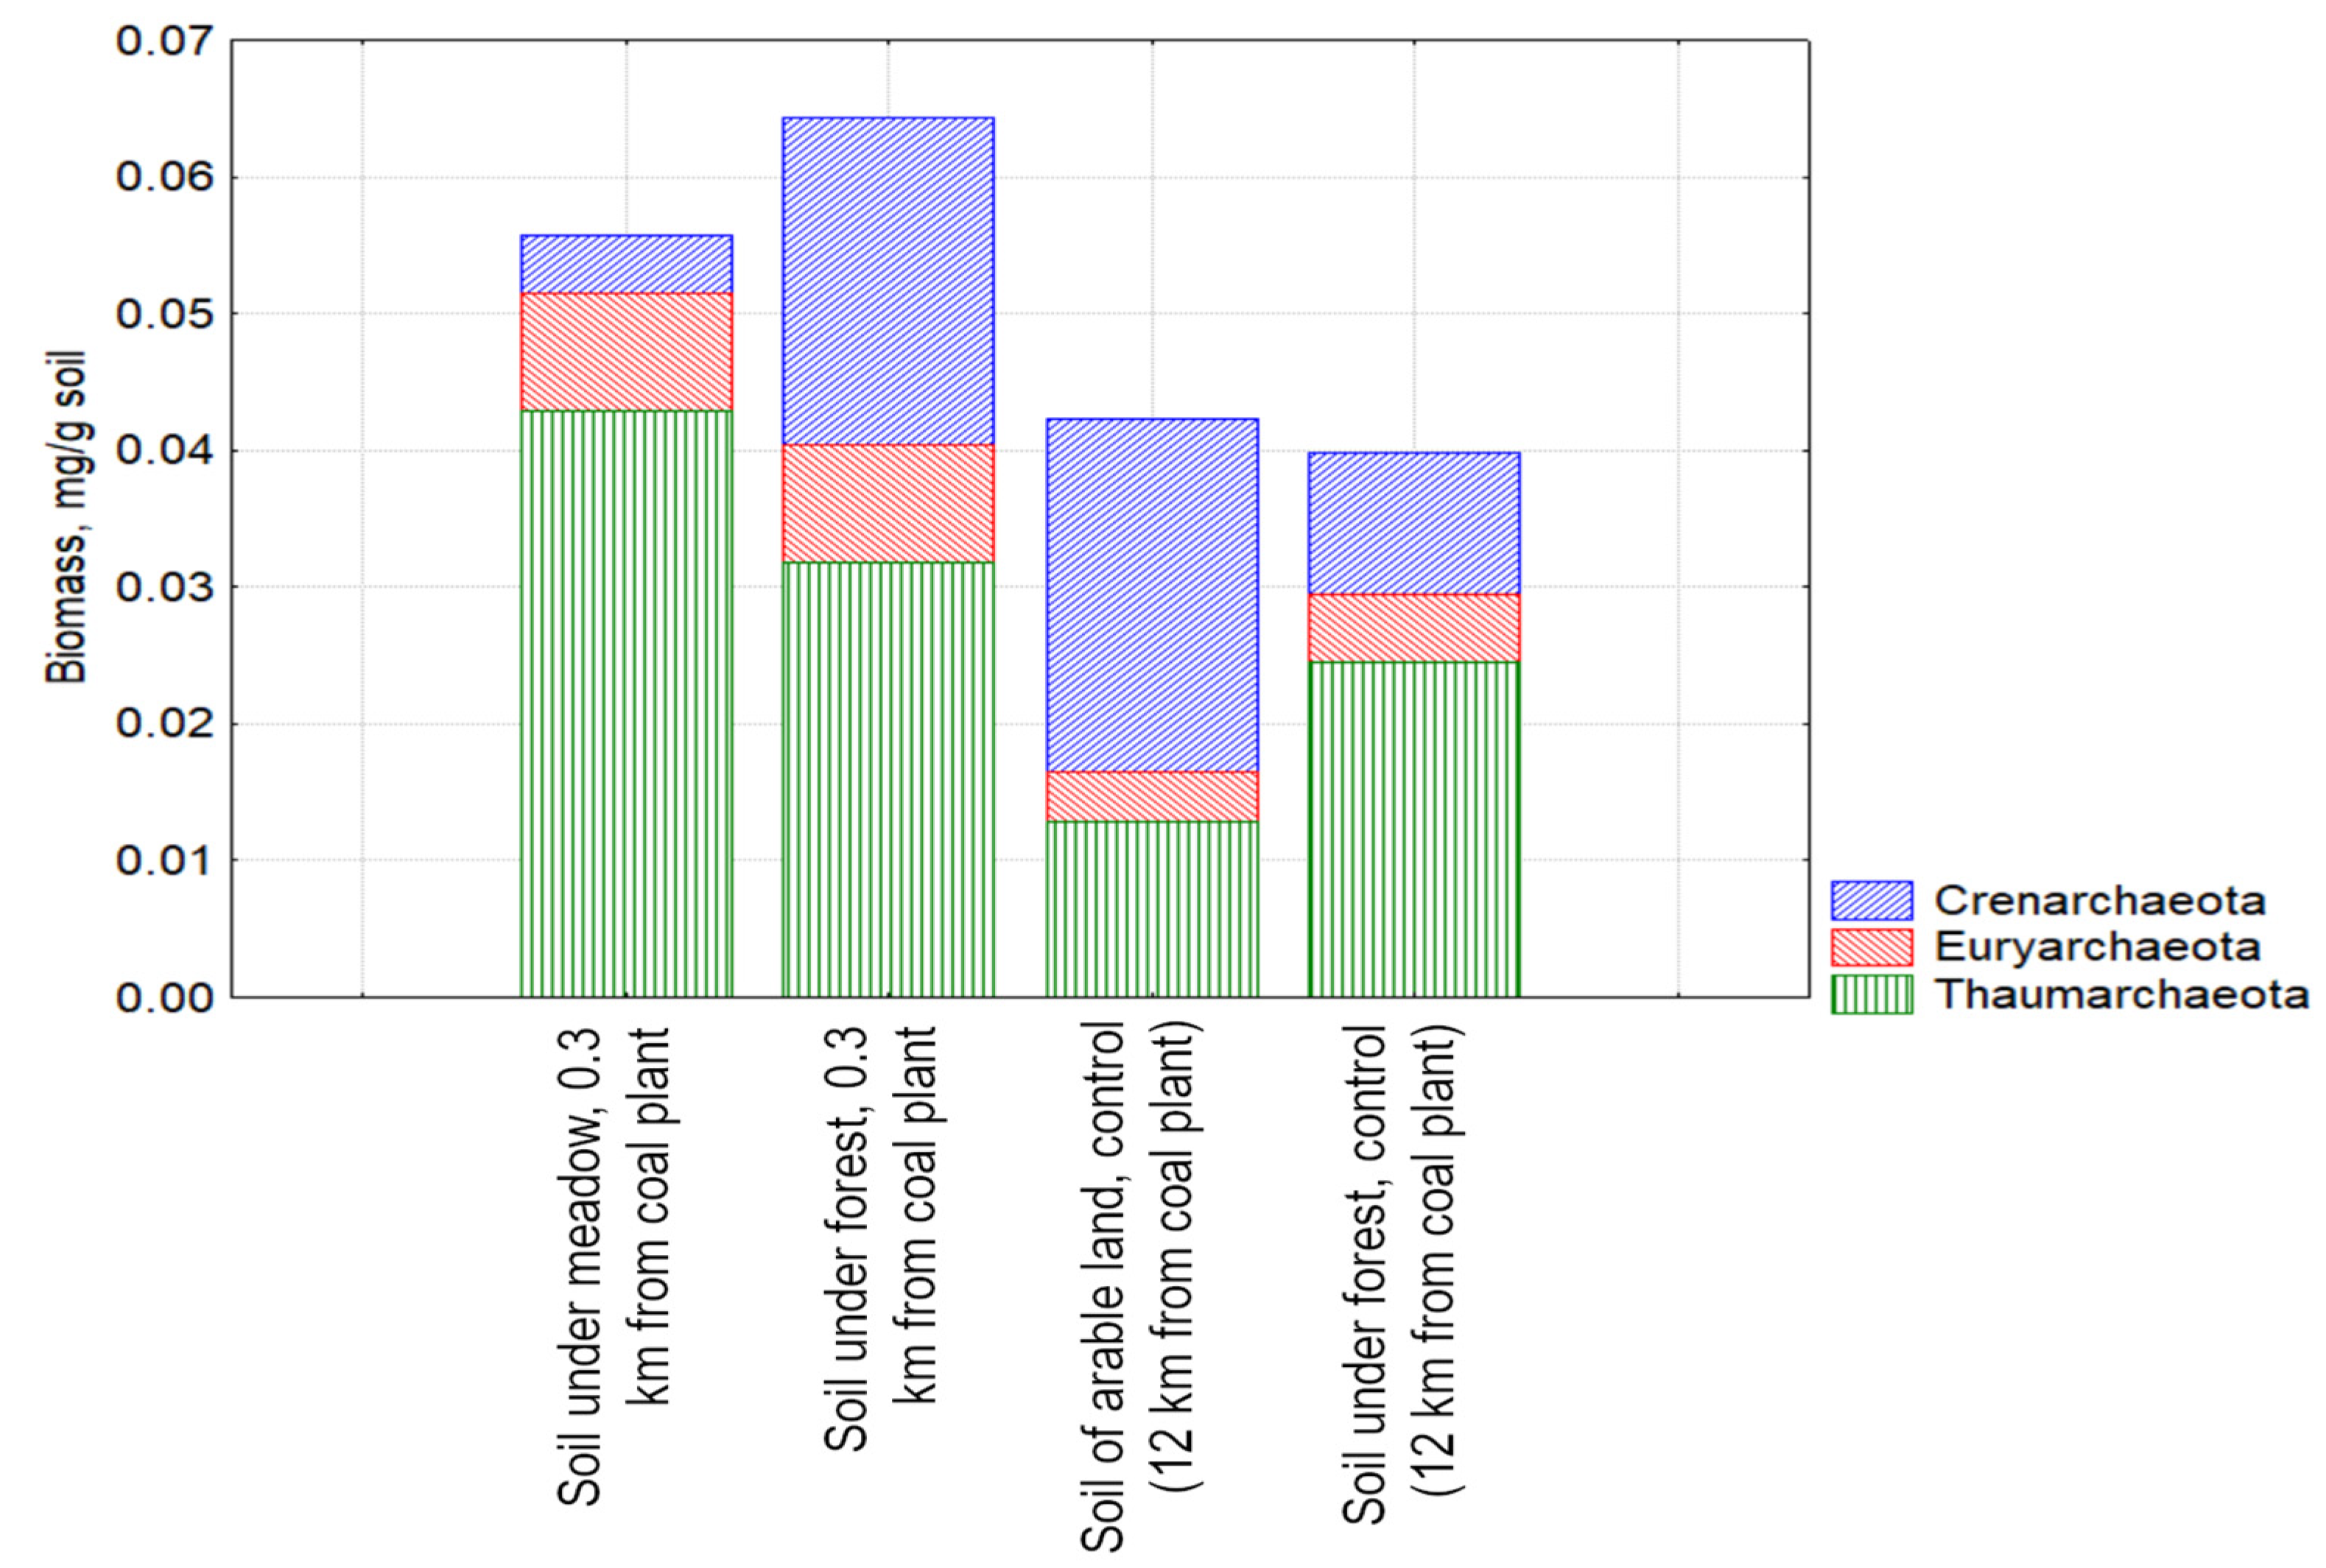
3.2. The Biomass of Prokaryotes in the Studied Soil Samples

A similar pattern noted in the CO2 emission was observed when analyzing the total prokaryotic biomass, namely a decrease in the total abundance indicator as the content of pollutants in the soil increased (Figure 2, Table 7). The background biomass values were about 0.4 mg/g soil (400 µg/g soil) and the biomass in soils closer to the source of contamination under the meadow vegetation was 260–270 µg/g soil, while under forest vegetation it was half as high at 200–215 µg/g soil.
The metabolically active prokaryotic microbial community (actively growing and dividing cells with the presence of rRNA) of the soils in the study area was analyzed by in situ hybridization with rRNA-specific fluorescent-labeled oligonucleotide probes (FISH, fluorescent in situ hybridization). The biomass of metabolically active prokaryote cells decreased in the soils as the PAH concentration increased (Figure 3, Table 8a–c). Specifically, the biomass values were 230–240 µg/g of the soil in the background samples, although they did not exceed the 185 and 135 µg/g of the soil in the samples taken from the plant territory under the forest and meadow vegetation, respectively.
It is known from the literature that, compared to the control, in the pollutant-containing experimental sod-podzolic microcosms, a decrease in the share of metabolically active prokaryotic cells was observed, as well as changes of the hydrolytic complex structure [25].
The suppression of the metabolic activity of prokaryote cells under the influence of PAHs in sod-podzolic soil under meadow vegetation was more pronounced compared to soils under forest vegetation, for which the microbial complex is characterized by greater tolerance and buffering to the contaminant.

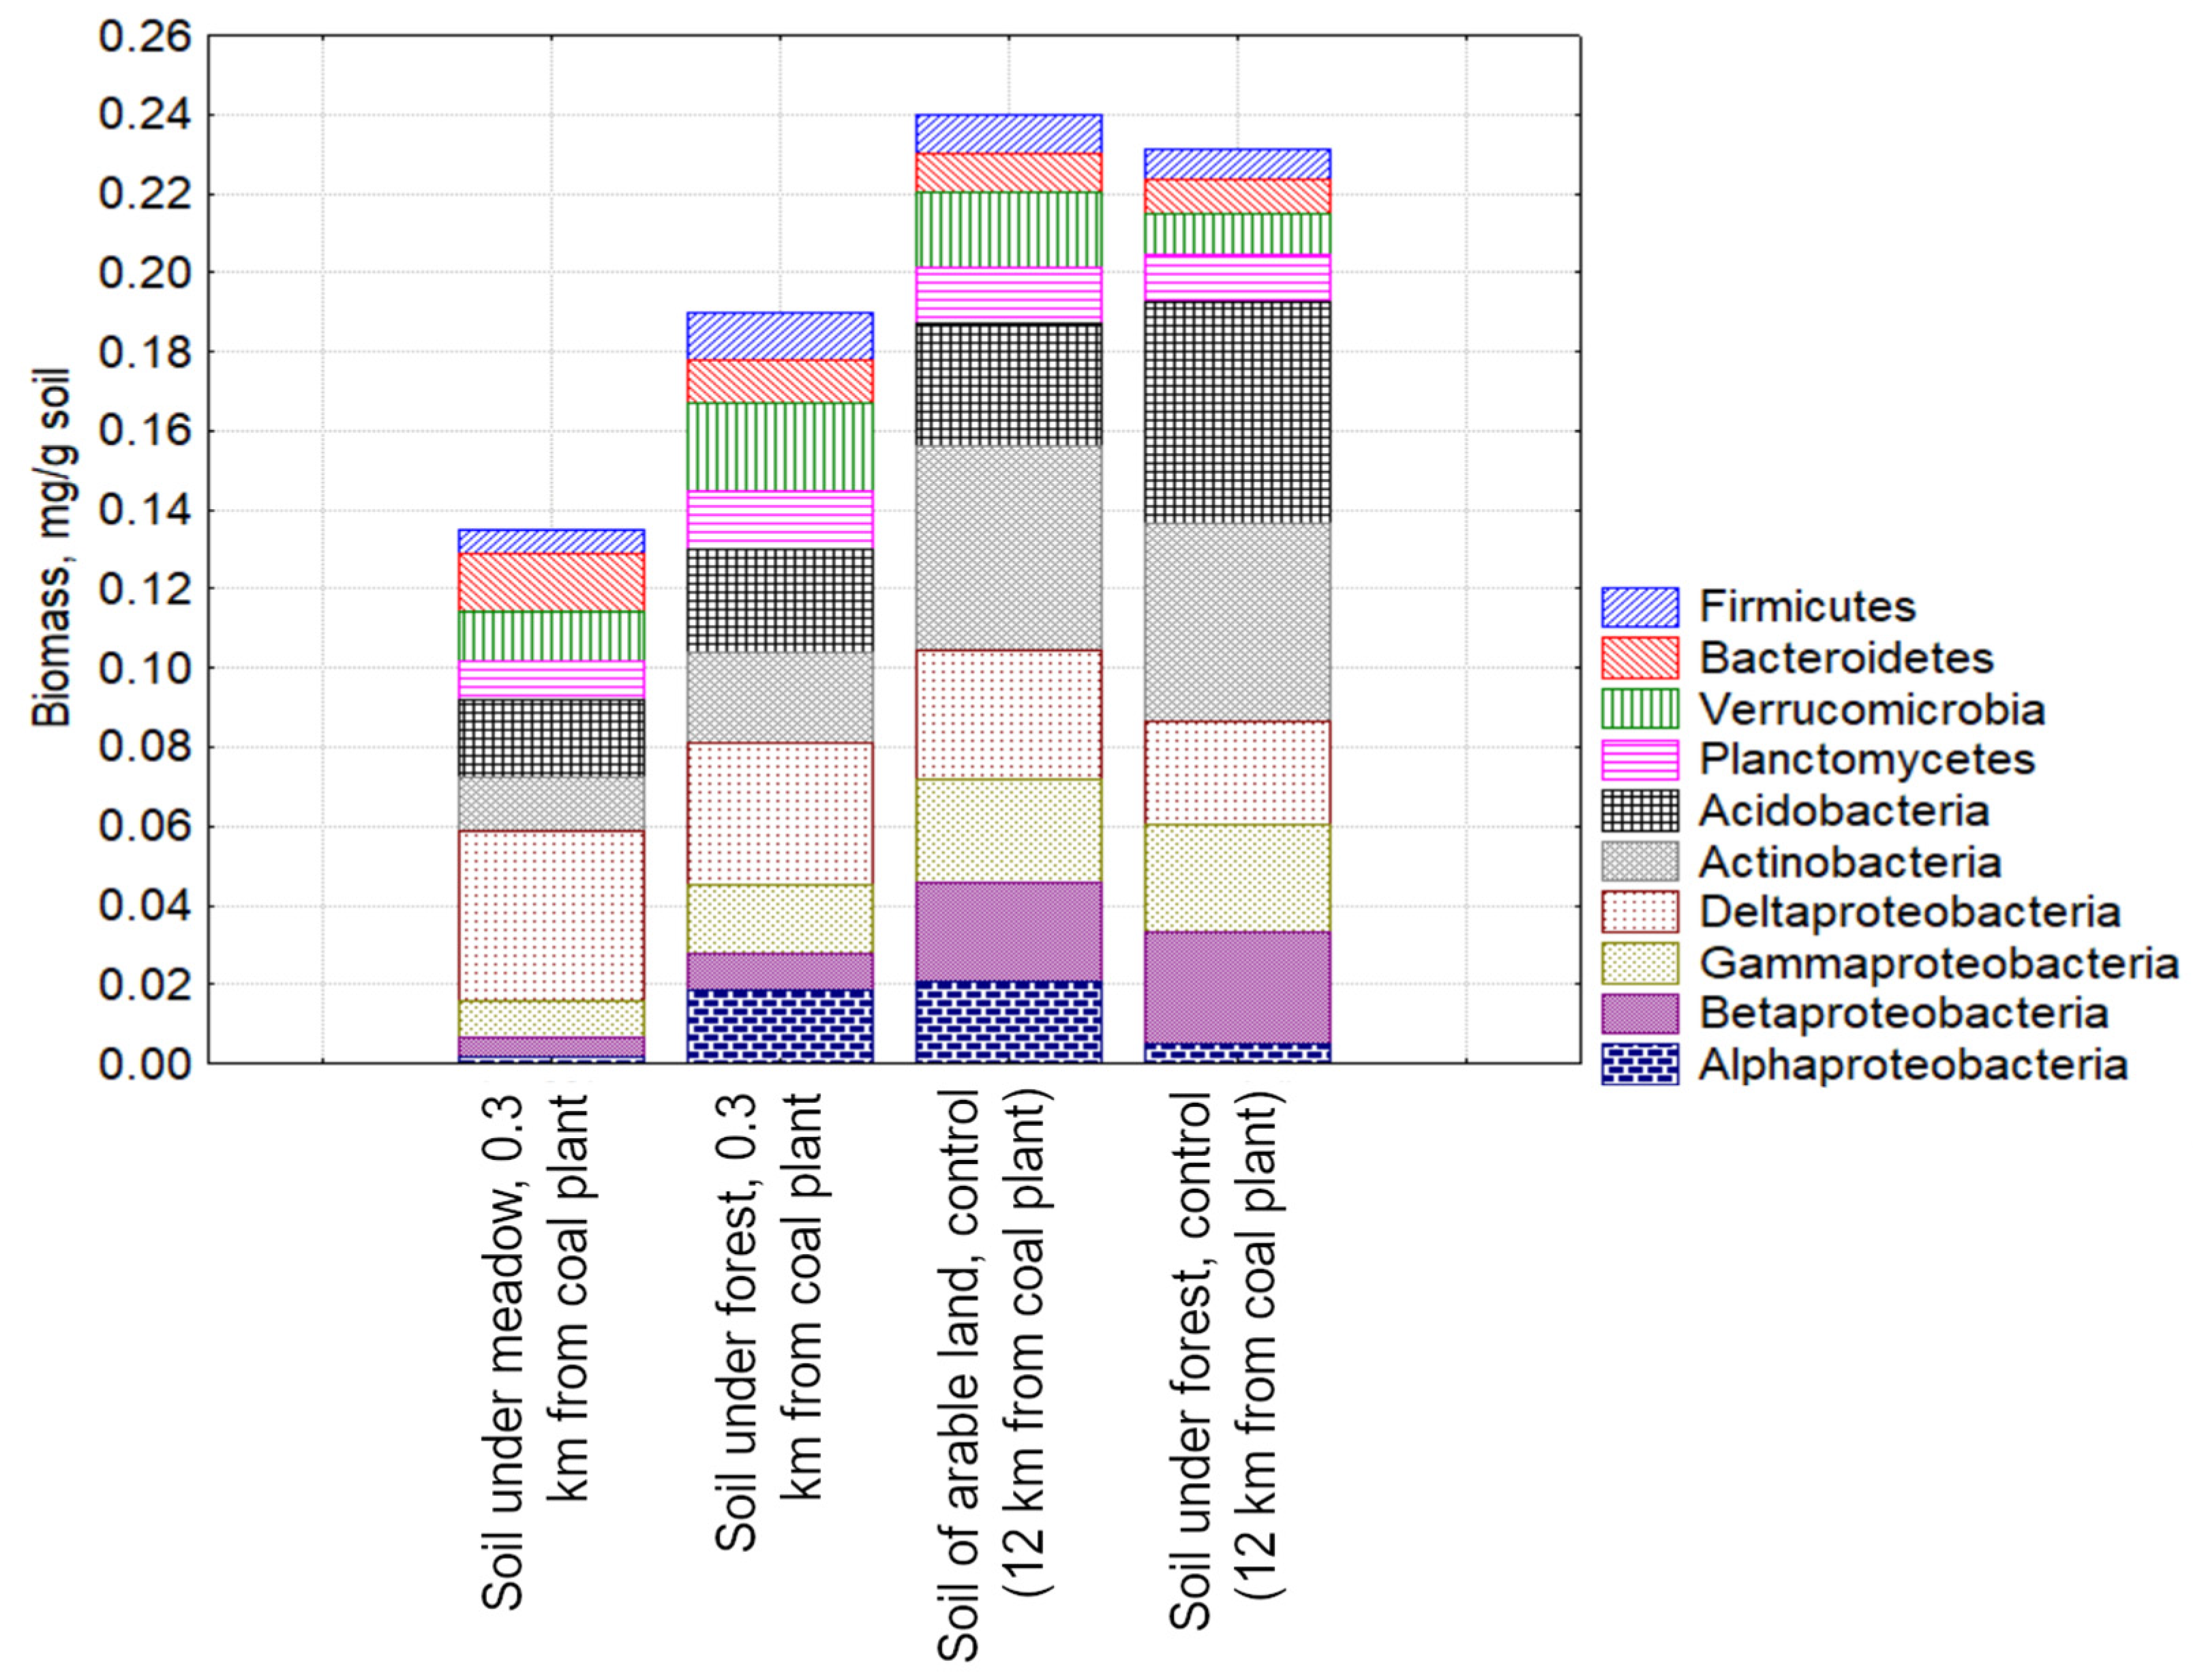
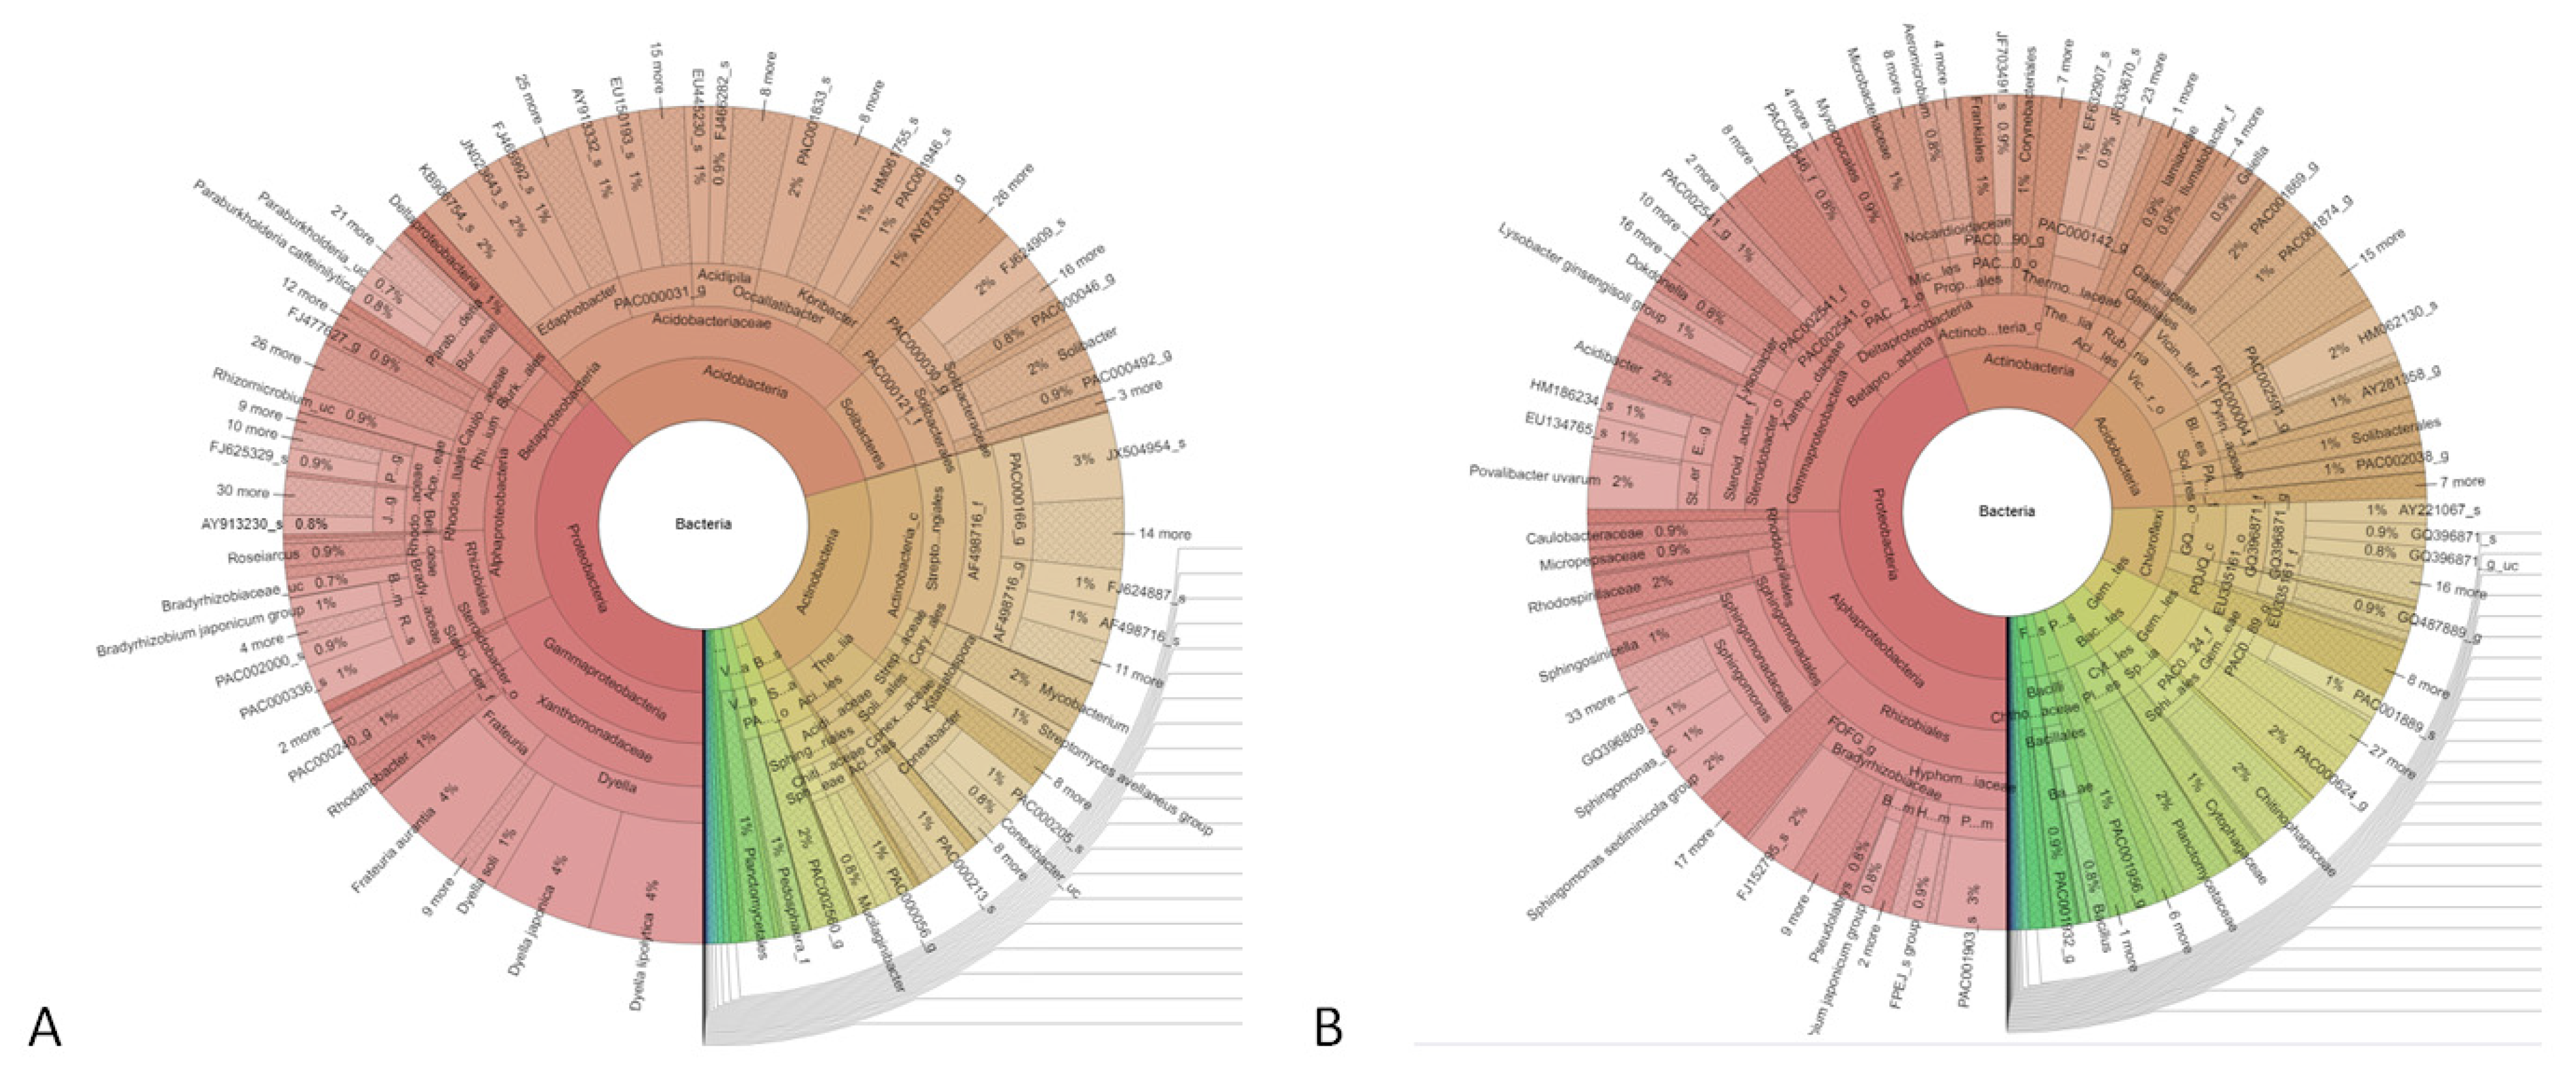
3.3. Study of the Structure of the Metabolically Active Prokaryotic Complex

The next stage of the research focused on studying the structure of the metabolically active prokaryotic community in the studied soils.
According to the results of metagenomic analysis and FISH, metabolically active members of the bacteria domain dominated (90%) all the investigated soil samples and the proportion of Archaea was about 10% in both the experimental and control samples.
The bacterial component of the uncontaminated sod-podzolic soil was characterized by the predominance of several phyla with Proteobacteria, Acidobacteria, and Actinobacteria being the dominant groups (Figure 4). Moreover, Proteobacteria and Acidobacteria constituted approximately equal shares of the total detected bacterial communityin the soil under the forest vegetation (38% and 32%, respectively), while in the soil under the meadow vegetation, the share of Actinobacteria increased to 25% and the share of Acidobacteria decreased to 15%. Representatives of gamma proteobacteria belonging to the Xanthomonadaceae family of genus Dyella dominated among proteobacteria in the soil under the forest vegetation; representatives of the Acidobacteriaceae (Edaphobacter) family dominated among Acidobacteria; and representatives of order Streptosporangiales and Corynebacterales dominated among Actinobacteria.
The metabolically active component of the prokaryotic complex was restructured in contaminated samples at the plant site.
An increase in the biomass of metabolically active representatives of phylogenetic groups such as Proteobacteria, Bacteroidetes, Firmicutes, and Chloroflexi was observed in the plant territory soil. The share of alpha proteobacteria increased due to members of Sphingomonas and Bradyrhizobiaceae. Representatives of the Cytophagaceae and Chitinophagaceae families were detected from phylum Bacteroidetes.
In contrast, there were changes in the structure of the complex, leading to a decrease in the biomass of some phylogenetic groups whose representatives can be classified as sensitive forms. The share of acidobacteria and actinobacteria decreased. The structure of the actinobacteria complex significantly changed. Representatives of the Streptosporangiales order were practically not detected and they can be classified as PAH-sensitive. The share of Micrococcales (Arthrobacter) and Nocardiodaceae (Nocardioides and Aeromicrobium) increased. The share of representatives of the genus Gaiella belonging to Rubrobacteria increased significantly.
There is information in the literature regarding the resistance of some bacterial representatives to oil contamination. Wefound the followingrepresentatives of the Bacteria domain that are resistant to oil contamination: Nocardiodes, Rhodococcus, Gaiella, Kribella, Conexibacter, Solirubrobacter, Pseudomocardis, and Rhodopseudomonas [7]. Taking into account the heterogeneity of the soil system, one should certainly not forget about other parameters affecting changes in the structure of the microbial complex, such as, for example, the physicochemical properties of the objects under study.
Considering the structure of the archaeal metabolically active complex, we noted some increase in the abundance of metabolically active forms as compared to the control (Figure 5). We also noted changes in the structure of polluted samples as compared to the control and identified stable and sensitive phylogenetic forms. More profound restructuring of the archaeal complex occurs in polluted territories under meadow vegetation as compared to control. Contamination with PAH leads to an increase of Thaumarchaea’s share. The biomass of Euryarchaeota increased by two-folds as compared to the control and reached 29 µg/g of soil. Modern literature indicates the presence of archaea belonging to the phylum Euryarchaeota (methanogens of the genera Methanolobus and Methanoplanus), growing on oil with methane formation in hydrocarbon-contaminated substrates [2]. Representatives of the Crenarchaeota phylogenetic group can be considered sensitive to PAHs; their biomass decreased in contaminated soils by three-folds in comparison to the background and was 8 µg/g of soil (Figure 5, Table 9a–c).
In soils under forest vegetation, some changes in the structure can also be noted but the observed differences will have a smoother character, which can be attributed to the greater resilience of forest ecosystems.

3.4. Detection of the Presence of the Functional Alkane Monooxygenase (alkB) Geneby RT-PCR and Both the Abundance and Biomass of Metabolically Active Prokaryotes Carrying Functional Alkane Monooxygenase by FISH

Results of RT-PCRpoint out the highest expression of the alkane monooxygenase gene in the soil samples from the territory of the plant, in which the concentration values reached 2500 to 3100 copies/g soil, while in the background territories, the values were an order of magnitude lower and ranged from 35 to 830 copies/g soil.
The copy analysis of the functional alkan-monooxygenase (alkB) in the samples studied using the FISH method revealed that metabolically active cells with this gene were found in all samples and the closer the sample was located to the source of pollution, the higher the content of cells with the functional gene in it. Thus, the values of the biomass of metabolically active cells containing the functional gene of alkan-monooxygenase on the territories immediately adjacent to the plant were 14–18 µg/g soil, while at the background sites, the values were two times lower and did not exceed 7 µg/g soil. In soils under forest plants, the biomass of metabolically active cells containing the functional gene of alkan-monooxygenase was higher than in soils under meadow plants and the was amount 18 and 14 µg/g soil, respectively.
Thus, the molecular-biological methods (FISH and RT-PCR) revealed an order of magnitude increase in the number of copies of alkan-monooxygenase (alkB) genes in the soil samples contaminated with PAH and a two-fold increase in the biomass of metabolically active prokaryotes possessing the functional alkB gene compared to the uncontaminated territories. The copy number index of the alkan monooxygenase (alkB) gene can be used as one of the parameters when characterizing an ecosystem for the presence of PAH pollutants.

4. Discussion

The quantitative and qualitative detection of key enzymes responsible for the oxidation of one or another oil component and their genes is a direct proof of the use of PAH components and the metabolic activity of the microorganism [25,26,27,28]. In studies of the degradation of polycyclic 28 aromatic hydrocarbons (PAHs), oil is a marker use key enzyme of the dioxygenase class. When studying destructors of n-alkanes of PAH, the alkane monooxygenases, key enzymes in the alkane hydroxylase system, oxidizes the substrate. Regarding genes for di and monooxygenases, similar to other genes responsible for metabolism, alternative sources of carbon and energy are under catabolic repression and are only induced under certain conditions. The main requirement of such conditions is the lack of energy sources quickly used by the cell, primarily glucose and other sugars, as they are able to suppress the synthesis of enzymes of other pathways of catabolism involved in the metabolism of relatively slowly used energy sources [29]. From here it follows that the detection of the gene expression of additional metabolic pathways is direct evidence of the use of a particular substrate by the cell as the only source of carbon and energy. This approach is used to study metabolic activity and the identification of destructors in the community. Thus, based on the analysis of the matrix RNA (mRNA) of alkane hydroxylase genes alkB and the assessment of the 16S rRNA gene profile in the community, it was possible to estimate the rate of oil degradation by the microbial community in five applied methods of bioremediation of contaminated soils [30]. The alkane hydroxylases of eubacteria are of great interest for biocatalytic and environmental studies. The key enzyme of alkane hydroxylases is alkane monooxygenase (alkB). The alkane hydroxylasescatalyze the hydroxylation of linear and branched aliphatic, alicyclic, and alkylaromatic compounds [31]. The detection of the expression of alkB genes contributes to the identification of the metabolically active part of the microbiological community, capable of degrading n-alkanes by the enzyme alkane-monooxygenase [32]. The presence of protein-coding genes of alkane monooxygenase, in other words “keeping house genes”, has been shown in the corresponding bacteria; however, the question of gene expression directly in in situ environmental systems remains open [33].
Experimental material of the data concerning microorganisms capable of destructing polycyclic aromatic hydrocarbons has been accumulated on the processes of biodegradation of naphthalene to metabolites of the main metabolism or its partial transformation for representatives of bacteria of the following genera: Arthrobacter, Alcaligenes, Bacillus, Comamonas, Cycloclasticus, Lutibacterium, Marinobacter, Micrococcus, Neptunomonas, Nocardia, Paenibacillus, Polaromonas, Pseudomonas, Ralstonia, Rhodococcus, Sphingomonas, and Streptomyces [34].The ability to degrade higher molecular weight aromatic compounds containing three or more benzene rings in their composition (anthracene, phenanthrene, pyrene, chrysene, etc.) was found in representatives of the following genera: Alteromonas, Arthrobacter, Brevibacterium, Pseudomonas, Nocardioides, Sphingomonas, Rhodococcus, Alcaligenes, Mycobacterium, Pseudomonas, and Bacillus [35].A number of these bacteria are part of naphthalene metabolizing complexes.
Thus, the composition and structure of microbiological communities, in addition to soil and climatic conditions, will be influenced by the nature of the pollutant and its dose, which will determine the number of individual groups of soil microorganisms and the intensity of processes occurring in the soil. Recently, the development of technologies for bioremediation of soils subjected to man-made stress using bacteria capable of degradingtarget toxicants or their transformation to less toxic forms has become more and more relevant. The isolation of target strains–destructors of polycyclic aromatic hydrocarbons and other petroleum products in soils is promising. According to the literature, they already include proteobacteria (Pseudomonas, Alcaligenes, and Flavobacterium), actinobacteria (Arthrobacter, Brevibacterium, Cellulomonas, Microbacterium, Rhodococcus, Dietzia, Janibacter, Kocuria, and Streptomyces), and spore-forming bacteria of the family Bacillaceae (Bacillus and Paenibacillus) [34].

5. Conclusions

An increase in the PAH concentration in sod-podzolic soil from 70 to 25,000 ng/g soil showed a decrease in the metabolic activity of the microbial community in terms of both catabolic (respiration) and anabolic (biomass) processes by the fourteenth day of the succession. The values of CO2 emission ranged from 480 to 360 µg(C-CO2)/g soil per day and prokaryotic biomass from 400 to 225 µg/g soil for control and contaminated samples, respectively.
It was demonstrated that the biomass of the metabolically active soil prokaryotic component decreased by one and a half-folds in the meadow soil by the fourteenth day of succession and was 265 µg/g of soil in the samples compared to the control. The suppression of the metabolic activity of prokaryote cells under the influence of PAHs in sod-podzolic soil under meadow vegetation was more pronounced compared to the soils under forest vegetation, for which the microbial complex is characterized by greater tolerance and buffering to the contaminant.
The structure of the metabolically active prokaryotic component was found to change in the contaminated variants as compared to the background. The representatives of prokaryotes that were sensitive and resistant to the studied PAHs were identified. The representatives of the phylogenetic groups from the bacterial complex resistant to PAH pollution were Proteobacteria (Alphaproteobacteria), Bacteroidetes, Firmicutes, and Chloroflexi, and Thaumarchaeota in the archaeal complex.
The presence and expression of the functional gene alkan-monooxygenase (alkB) was detected in all the experimental variants studied. The concentration of gene copies exceeded the concentration in the background areas by an order of magnitude in the variants from the plant area. The values of the biomass of metabolically active cells containing the functional alkan-monooxygenase gene in the contaminated territories differed from the control variants by a factor of two.

Author Contributions

Conceptualization, N.A.M., L.A.P., P.Y.S., and A.L.S.; data curation, A.P.V.; formal analysis, A.S.Y., N.A.K., M.A.K., and A.V.G.; investigation, N.A.M. and A.V.G.; methodology, N.A.M., A.N.G., and L.A.P.; supervision, N.A.M., and A.L.S.; visualization, A.P.V. and N.A.M.; writing—original draft preparation, N.A.M. and P.Y.S.; writing—review and editing, N.A.M., P.Y.S., and A.L.S. AAll authors have read and agreed to the published version of the manuscript.

Funding

The APC was funded by the Russian Science Foundation (RSF), grant number 21-14-00076.

Data Availability Statement

Data are contained within the article.

Acknowledgments

This study was performed according to the Development Program of the Interdisciplinary Scientific and Educational School of M.V. Lomonosov Moscow State University titled “Future Planet and Global Environmental Change”.

Conflicts of Interest

The authors declare that they have no conflict of interest.

References

  1. Gennadiev, A.N.; Pikovskii, Y.I.; Zhidkin, A.P.; Kovach, R.G.; Koshovskii, T.S.; Smirnova, M.A.; Khlynina, N.I.; Tsibart, A.S. Factors and features of the hydrocarbon status of soils. Eurasian Soil Sci. 2015, 48, 1193–1206. [Google Scholar] [CrossRef]
  2. Nazina, T.N.; Sokolova, D.S.; Babich, T.L.; Semenova, E.M.; Ershov, A.P.; Bidzhieva, S.K.; Borzenkov, I.A.; Tourova, T.P.; Poltaraus, A.B.; Khisametdinov, M.R. Microorganisms of low-temperature heavy oil reservoirs (Russia) and their possible application for enhanced oil recovery. Microbiology 2017, 86, 773–785. [Google Scholar] [CrossRef]
  3. Ivshina, I.B.; Kostina, L.V.; Kamenskikh, T.N.; Zhuikova, V.A.; Zhuikova, T.V.; Bezel, V.S. Soil microbiocenosis as an indicator of stability of meadow communities in the environment polluted with heavy metals. Russ. J. Ecol. 2014, 45, 83–89. [Google Scholar] [CrossRef]
  4. IUSS Working Group WRB. World Reference Base for Soil Resources 2014: International Soil Classification System for Naming Soils and Creating Legends for Soil Maps; World Soil Resources Reports; FAO: Rome, Italy, 2014; Volume 106, pp. 212–213. [Google Scholar]
  5. Gennadiev, A.N.; Zhidkin, A.P.; Koshovskii, T.S.; Lobanov, A.A. Polyarenes and bitumoids from analogous technogenic hydrocarbon sources with different parameters in soils. Eurasian Soil Sci. 2018, 51, 1369–1380. [Google Scholar] [CrossRef]
  6. Wilcke, W. Polycyclic aromatic hydrocarbons (PAHs) in soil, A review. J. Plant Nutr. Soil Sci. 2000, 163, 229–248. [Google Scholar] [CrossRef]
  7. Manucharova, N.A.; Ksenofontova, N.A.; Karimov, T.D.; Vlasova, A.P.; Zenova, G.M.; Stepanov, A.L. Changes in the phylogenetic structure of the metabolically active prokaryotic soil complex induced by oil pollution. Microbiology 2020, 89, 219–230. [Google Scholar] [CrossRef]
  8. Whyte, L.G.; Schultz, A.; van Beiden, J.B.; Luz, A.P.; Pellizari, V.; Labbé, D.; Greer, C.W. Prevalence of alkane monooxygenase genes in Arctic and Antarctic hydrocarbon-contaminated and pristine soils. FEMS Microbiol. Ecol. 2002, 41, 141–150. [Google Scholar] [CrossRef] [Green Version]
  9. Amann, R.I.; Krunholz, L.; Stahl, D.A. Fluorescent oligonucleotide probing of whole cells for determinative, phylogenetic, and environmental studies in microbiology. J. Bacteriol. 1990, 172, 762–770. [Google Scholar] [CrossRef] [PubMed] [Green Version]
  10. Stahl, D.A.; Amann, R. Development and application of nucleic acid probes in bacterial systematics. In Nucleic Acid Techniques in Bacterial Systematics; Stackebrandt, E., Goodfellow, M., Eds.; John Wiley & Sons Ltd.: New York, NY, USA, 1991; pp. 205–248. [Google Scholar]
  11. Raskin, L.; Stromley, J.; Rittmann, B.; Stahl, D. Group-specific 16S rRNA hybridization probes to describe natural communities of methanogens. Appl. Environ. Microbiol. 1994, 60, 1232–1240. [Google Scholar] [CrossRef] [Green Version]
  12. Teira, E.; Reinthaler, T.; Pernthaler, A.; Pernthaler, J.; Herndl, G.J. Combining catalyzed reporter deposition-fluorescence in situ hybridization and microautoradiography to detect substrate utilization by bacteria and archaea in the deep ocean. Appl. Environ. Microbiol. 2004, 70, 4411–4414. [Google Scholar] [CrossRef] [Green Version]
  13. Timonen, S.; Bomberg, M. Archaea in dry soil environments. Phytochem. Rev. 2009, 8, 505–518. [Google Scholar] [CrossRef]
  14. Manz, W.; Amann, R.; Ludwig, W.; Wagner, M.; Schleifer, K. Phylogenetic oligodeoxynucleotide probes for the major subclasses of proteobacteria: Problems and solutions. Syst. Appl. Microbiol. 1992, 15, 593–600. [Google Scholar] [CrossRef]
  15. Dedysh, S.N.; Panikov, N.S.; Liesack, W.; Großkopf, R.; Zhou, J.; Tiedje, J.M. Isolation of acidophilic methane-oxidizing bacteria from northern peat wetlands. Science 1998, 282, 281–284. [Google Scholar] [CrossRef] [PubMed]
  16. Rabus, R.; Wilkes, H.; Schramm, A.; Harms, G.; Behrends, A.; Amann, R.; Widdel, F. Anaerobic utilization of alkylbenzenes and n-alkanes from crude oil in an enrichment culture of denitrifying bacteria affiliating with the beta-subclass of Proteobacteria. Environ. Microbiol. 1999, 1, 145–157. [Google Scholar] [CrossRef] [PubMed]
  17. Manz, W.; Amann, R.; Ludwig, W.; Vancanneyt, M.; Schleifer, K.-H. Application of a suite of 16S rRNA- specific oligonucleotide probes designed to investigate bacteria of the phylum cytophaga-flavobacter-bacteroides in the natural environment. Microbiology 1996, 142, 1097–1106. [Google Scholar] [CrossRef] [Green Version]
  18. Roller, C.; Wagner, M.; Amann, R.; Ludwig, W.; Schleifer, K.-H. In situ probing of Gram-positive bacteria with high DNA G + C content using 23s rRNA-targeted oligonucleotides. Microbiology 1995, 140, 2849–2858. [Google Scholar] [CrossRef] [Green Version]
  19. Meier, H.; Amann, R.; Ludwig, W.; Schleifer, K.H. Specific oligonucleotide probes for in situ detection of a major group of Gram-positive bacteria with low DNA G+C content. Syst. Appl. Microbiol. 1999, 22, 186–196. [Google Scholar] [CrossRef]
  20. Juretschko, S.; Loy, A.; Lehner, A.; Wagner, M. The microbial community composition of a nitrifying-denitrifying activated sludge from an industrial sewage treatment plant analyzed by the full-cycle rRNA approach. Syst. Appl. Microbiol. 2002, 25, 84–99. [Google Scholar] [CrossRef]
  21. Dedysh, S.N.; Pankratov, T.A.; Belova, S.E.; Kulichevskaya, I.S.; Liesack, W. Phylogenetic analysis and in situ identification of bacteria community composition in an acidic sphagnum peat bog. Appl. Environ. Microbiol. 2006, 72, 2110–2117. [Google Scholar] [CrossRef] [Green Version]
  22. Neef, A.; Amann, R.; Schlesner, H.; Schleifer, K.H. Monitoring a widespread bacterial group: In situ detection of planctomycetes with 16S rRNA-targeted probes. Microbiology 1998, 144, 3257–3266. [Google Scholar] [CrossRef] [PubMed] [Green Version]
  23. Zhili, H.; Liyou, W.; Xingyuan, L.; Matthew, W.F.; Jizhong, Z. Empirical establishment of oligonucleotide probe design criteria. Appl. Environ. Microbiol. 2005, 71, 3753–3760. [Google Scholar] [CrossRef] [Green Version]
  24. Chen, Y. Application of Hydrocarbon Degrading Microorganism Enumeration and Catabolic Genes Detection for Soil Assessment. Master’s Thesis, University of Helsinki, Helsinki, Finland, September 2013. [Google Scholar]
  25. Manucharova, N.A.; Kuteinikova, Y.V.; Ivanov, P.V.; Nikolaeva, S.K.; Trofimov, V.T.; Stepanov, P.Y.; Tyapkina, E.V.; Lipatov, D.N.; Stepanov, A.L. Molecular analysis of the hydrolytic component of petroleum contaminated soils and of soils remediated with chitin. Microbiology 2017, 86, 395–402. [Google Scholar] [CrossRef]
  26. Kohno, T.; Sugimoto, Y.; Sei, K.; Mori, K. Design of PCR primers and gene probes for general detection of alkane-degrading bacteria. Microbes Environ. 2002, 17, 114–121. [Google Scholar] [CrossRef]
  27. Sei, K.; Sugimoto, Y.; Mori, K.; Maki, H.; Kohno, T. Monitoring of alkane-degrading bacteria in a sea-water microcosm during crude oil degradation by polymerase chain reaction based on alkanecatabolic genes. Environ. Microbiol. 2003, 5, 517–522. [Google Scholar] [CrossRef] [PubMed]
  28. Moharikar, A.; Kapley, A.; Purohit, H.J. Detection of dioxygenase genes present in various activated sludge. Environ. Sci. Pollut. Res. Int. 2003, 10, 373–378. [Google Scholar] [CrossRef] [PubMed]
  29. Teske, A.; Durbin, A.; Ziervogel, K.; Cox, C.; Arnosti, C. Microbial community composition and function in permanently cold seawater and sediments from an arctic fjord of Svalbard. Appl. Environ. Microbiol. 2011, 77, 2008–2018. [Google Scholar] [CrossRef] [PubMed] [Green Version]
  30. Marín, M.M.; Smits, T.H.; van Beilen, J.B.; Rojo, F. The alkane hydroxylase gene of Burkholderiacepacia RR10 is under catabolite repression control. J. Bacteriol. 2001, 183, 4202–4209. [Google Scholar] [CrossRef] [Green Version]
  31. Baek, K.H.; Yoon, B.D.; Kim, B.H.; Cho, D.H.; Lee, I.S.; Oh, H.M.; Kim, H.S. Monitoring of microbial diversity and activity during bioremediation of crude oil-contaminated soil with different treatments. J. Microbiol. Biotechnol. 2007, 17, 67–73. [Google Scholar]
  32. van Beilen, J.B.; Smits, T.H.M.; Roos, F.F.; Brunner, T.; Balada, S.B.; Röthlisberger, M.; Witholt, B. Identification of an amino acid position that determines the substrate range of integral membrane alkane hydroxylases. J. Bacteriol. 2005, 187, 85–91. [Google Scholar] [CrossRef] [Green Version]
  33. Korshunova, A.V.; Tourova, T.P.; Shestakova, N.M.; Mikhailova, E.M.; Poltaraus, A.B.; Nazina, T.N. Detection and transcription of n-alkane biodegradation genes (alkB) in the genome of a hydrocarbon-oxidizing bacterium Geobacillus subterraneus K. Microbiology 2011, 80, 682–691. [Google Scholar] [CrossRef]
  34. Shapiro, T.; Chekanov, K.; Alexandrova, A.; Dolnikova, G.; Ivanova, E.; Lobakova, E. Revealing of non-cultivable bacteria associated with the mycelium of fungi in the kerosene-degrading community isolated from the contaminated jet fuel. J. Fungi 2021, 7, 43. [Google Scholar] [CrossRef]
  35. Karlapudi, A.P.; Venkateswarulu, T.C.; Tammineedi, J.; Kanumuri, L.; Ravuru, B.K.; ramu Dirisala, V.; Kodali, V.P. Role of biosurfactants in bioremediation of oil pollution—A review. Petroleum 2018, 4, 241–249. [Google Scholar] [CrossRef]
Figure 1. Total carbon dioxide CO2 emission [µg C-CO2/g] from soil samples depending on the distance from the source of pollution.
Forests 12 01103 g001
Figure 2. Total prokaryotic biomass [mg/g soil] in soil samples depending on the distance from the source of pollution.
Forests 12 01103 g002
Figure 3. The biomass of the metabolically active prokaryotic microbial community in soil samples depending on the distance from the source of pollution.
Forests 12 01103 g003
Figure 4. Phylogenetic map of the structure of the bacterial components of sod-podzolic soil under forest vegetation in the control 12 km from the plant (A) and experimental (oil-contaminated, 0.3 km from the plant) (B) samples.
Forests 12 01103 g004
Figure 5. The biomass and structure of the Archaeal metabolically active community in soil samples depending onthe distance from the source of pollution.
Forests 12 01103 g005
Table 1. Characteristics of the tested samples.
SampleSoilSampling LocationSampling Depth, cm
1Sod-podzolic post-agrogenic podzolized clayey-illuviatedCity, meadow, 0.3 km from the plant
(55.728016, 38.217825)
5–10
2Sod-podzolic peated artistratified clayey-illuviatedCity, forest, 0.3 km from the plant
(55.728355, 38.220142)
5–10
3Sod-podzolic gley ultra-deeply lightenedForest, 12 km from the plant
(55.724166, 38.389851)
5–10
4Sod-podzolic gley ultra-deeply lightenedArable land, 12 km
(55.724371, 38.387340)
5–10
Table 2. PAH content in soil samples.
SamplePhenanthrene, ng/g SoilChrysene,
ng/g Soil
Anthracene, ng/g SoilBenz(a)pyrene, ng/g SoilPAH content, ng/g of SoilCorg, %
119,289.51937.51033.0514.626,818.14.6
29416.96344.0677.11518.729,128.310.8
3133.740.914.52.0443.13.3
444.14.60.00.174.32.9
Table 3. rRNA-specific oligonucleotide probes used in this study. Y=C or T; W=A or T; R=A or G.
ProbeTarget Group
of Organisms
16S rRNA Target SiteNucleotide Sequence
of the Probe (5’-3’)
Formamide, % aNaCl, mM bReference
EUB338 IBacteria338–355GCTGCC TCC20225[9]
EUB338 IIBacteria
(Planctomycetales)
CGTAGGAGTGCAGCCACCC
EUB338 IIIBacteria (Verrucomicrobiales)GTAGGTGTGCTGCCACCCGTAGGTGT
ARCH915Archaea915–934GTG CTC CCC CGC CAA TTC CT30112[9,10]
ARC344344–363TCGCGCCTGCTGCIC CCC GT
EURY806Euryarchaeota806–824CAC AGC GTT TAC ACC TAG30112[11,12]
CREN537Cren + Thaumarchaeota537–555TGA CCA CTT GAG GTG CTG30112[11]
THAUM-494Thaumarchaeota494–513GAA TAA GGG GTG GGC AAGT30112[11]
ALFlbAlphaproteobacteria19–35CGTTCGYTCTGAGCCAG cG20225[13,14]
ALF968968–986GTAAGGTTCTGCGCGTT
BET42aBetaproteobacteria1027–1043 dGCC TTC CCA CTT CGT TT3580[13]
GAM42aGammaproteobacteria1027–1043 dGCC TTC CCA CAT CGT TT3580[13]
SRB385DbDeltaproteobacteria385–402CGG CGT TGC TGC GTC AGG20225[15]
CF319aBacteroidetes560–593TGG TCC GTG TCT CAG TAC WCC CTT3580[16]
CFB560TAA ACC CART
HGC69aActinobacteria1901–1918 dTAT AGT TAC CAC CGC CGT e25159[17]
LGC354AFirmicutes354–371TGGGAAGATTCCCTACTGC3580[18]
LGC354BCGGGAAGATTCCCTACTGC
LGC354C fCCGGAAGATTCCCTACTGC
HoAc1402Acidobacteria1402–1420CTT TCG TGA TGT GAC GGG10450[19]
Ver138Verrucomicrobia138–155CGA GCT ATT CCC CTC TTG10450[20]
Ver14551455–1472CCA TCC ATA CCT TCG GCA
PLA46Planctomycetes46–64GAC TTG CAT GCC TAA TCC30112[21,22]
PLA886886–905GCC TTG CGA CCA TAC TCC C
a indicates formamide concentration in the hybridization buffer. b indicates NaCl concentration in the washing buffer. c indicates Y=C or T; W=A or T; R=A or G. d indicates target molecule is 23S rRNA. e indicates that the labeled probe was mixed with unlabeled oligonucleotide 5’-TATAGTTACGGCCGCCGT-3’. f indicates equimolar mixture of three labeled oligonucleotides.
Table 4. rRNA-specific oligonucleotide probes used in this study.
ProbeNucleotide Sequence of the Probe (5′-3′)Formamide, % aNaCl, mM b
alkB(F)Cy3-tgg-ccg-gct-act-ccg-atg-atc-gga-atc-tgg50500
alkB(R)Cy3-cgc-gtg-gtg-atc-cga-gtg-ccg-ctg-aag-gtg
a indicates the formamide concentration in the hybridization buffer. b indicates the NaCl concentration in the washing buffer.
Table 5. Primer sequences for the functional alkB gene.
ProbeEnzymeNucleotide Sequence of the Probe (5′-3′)Size of the Target Area (bp)Reference
alkBalkanemonooxygenaseF
TGGCCGGCTACTCCGATGATCGGAATCTGG
870[8]
Re
CGCGTGGTGATCCGAGTGCCGCTGAAGGTG
Table 6. Statistical analysis of total carbon dioxide CO2 emission data from the soil (LSD test; probabilities for post-hoc tests; and error: between MS = 85,765, df = 16,000).
Soil1234
Soil under forest vegetation, 0.3 km from coal plant 0.3614770.000000.000005
Soil under meadow vegetation, 0.3 km from coal plant0.361477 0.0000550.000031
Soil of arable land, control (12 km from coal plant)0.0000090.000055 0.766284
Soil under forest vegetation, control (12 km from coal plant)0.0000050.0000310.766284
Table 7. Statistical analysis of total prokaryotic biomass data in the soil (LSD test; probabilities for post-hoc tests; and error: between MS = 0.01465, df = 99.000).
Soil1234
Soil under forest vegetation, 0.3 km from coal plant 0.0535270.0000020.000000
Soil under meadow vegetation, 0.3 km from coal plant0.053527 0.0008680.000056
Soil of arable land, control (12 km from coal plant)0.0000020.000868 0.676425
Soil under forest vegetation, control (12 km from coal plant)0.0000000.0000560.674225
Table 8. (a) Statistical analysis of Actinobacteria biomass data (LSD test; variable Var2 (spread sheet 25); probabilities for post-hoc Tests; and error: between MS = 0.00008, df = 8.000). (b) Statistical analysis of Acidobacteria biomass data (LSD test; variable Var2 (spread sheet 25); probabilities for post-hoc tests; and error: between MS = 0.00008, df = 8.000). (c) Statistical analysis of Proteobacteria biomass data (LSD test; variable Var2 (spread sheet 25); probabilities for post-hoc tests; and error: between MS =0.00146, df = 10.000).
Soil1234MeanSt. Err
Soil under forest vegetation, 0.3 km from coal plant 0.21680.00390.00550.0230.005
Soil under meadow vegetation, 0.3 km from coal plant0.2168 0.00070.00090.0140.003
Soil of arable land, control (12 km from coal plant)0.00390.0007 0.81770.0520.007
Soil under forest vegetation, control (12 km from coal plant)0.00550.00090.8177 0.0500.004
Soil under forest vegetation, 0.3 km from coal plant 0.36390.54760.00330.0260.003
Soil under meadow vegetation, 0.3 km from coal plant0.3639 0.15040.00090.0190.004
Soil of arable land, control (12 km from coal plant)0.54760.1504 0.00810.0310.004
Soil under forest vegetation, control (12 km from coal plant)0.00330.00090.0081 0.0560.008
Soil under forest vegetation, 0.3 km from coal plant 0.47040.24540.00710.0260.003
Soil under meadow vegetation, 0.3 km from coal plant0.4704 0.63890.02010.0190.004
Soil of arable land, control (12 km from coal plant)0.24540.6389 0.03960.0310.004
Soil under forest vegetation, control (12 km from coal plant)0.00710.02010.0396 0.0560.008
Table 9. (a) Statistical analysis of Archaeal Thaumarchaeota biomass data (LSD test; variable Var2 (spread sheet 25); probabilities for post-hoc tests; and error: between MS = 0.00008, df = 8.000). (b) Statistical analysis of Archaeal Euryarchaeota biomass data (LSD test; variable Var2 (spread sheet 25); probabilities for post-hoc tests; and error: between MS = 0.00008, df = 8.000). (c) Statistical analysis of Archaeal Crenarchaeota biomass data (LSD test; variable Var2 (spread sheet 25); probabilities for post-hoc tests; and error: between MS = 0.00146, df = 10.000).
Soil1234MeanSt.Err
Soil under forest vegetation, 0.3 km from coal plant 0.2294210.0553470.4109600.0318590.005774
Soil under meadow vegetation, 0.3 km from coal plant0.229421 0.00075970.0619510.0428870.00866
Soil of arable land, control (12 km from coal plant)0.0553470.007597 0.2068660.0128660.002887
Soil under forest vegetation, control (12 km from coal plant)0.4109600.0619510.206866 0.0245070.005196
Soil under forest vegetation, 0.3 km from coal plant 1.000000.0006360.0036360.0085770.000751
Soil under meadow vegetation, 0.3 km from coal plant1.00000 0.0006360.0036360.0085770.000635
Soil of arable land, control (12 km from coal plant)0.0006360.003636 0.2129990.0036760.000520
Soil under forest vegetation, control (12 km from coal plant)0.0006360.0036360.212999 0.0049010.000635
Soil under forest vegetation, 0.3 km from coal plant 0.0023880.6929360.0169990.0238940.005196
Soil under meadow vegetation, 0.3 km from coal plant0.002388 0.0013960.02094280.0042890.000577
Soil of arable land, control (12 km from coal plant)0.6929360.001396 0.0091920.0257320.000981
Soil under forest vegetation, control (12 km from coal plant)0.0169990.02094280.009192 0.0104150.003464
Publisher’s Note: MDPI stays neutral with regard to jurisdictional claims in published maps and institutional affiliations.

