Article

Ready for Screening: Fast Assessable Hydraulic and Anatomical Proxies for Vulnerability to Cavitation of Young Conifer Sapwood

Institute of Botany, BOKU University Vienna, Gregor Mendel Str. 33, A-1180 Vienna, Austria
*
Author to whom correspondence should be addressed.
Forests 2021, 12(8), 1104; https://doi.org/10.3390/f12081104
Submission received: 5 July 2021 / Revised: 14 August 2021 / Accepted: 16 August 2021 / Published: 18 August 2021
(This article belongs to the Special Issue Ecological and Physiological Aspects of Xylem Formation in Trees)

Abstract

:
Research Highlights: novel fast and easily assessable proxies for vulnerability to cavitation of conifer sapwood are proposed that allow reliable estimation at the species level. Background and Objectives: global warming calls for fast and easily applicable methods to measure hydraulic vulnerability in conifers since they are one of the most sensitive plant groups regarding drought stress. Classical methods to determine P12, P50 and P88, i.e., the water potentials resulting in 12, 50 and 88% conductivity loss, respectively, are labour intensive, prone to errors and/or restricted to special facilities. Vulnerability proxies were established based on empirical relationships between hydraulic traits, basic density and sapwood anatomy. Materials and Methods: reference values for hydraulic traits were obtained by means of the air injection method on six conifer species. Datasets for potential P50 proxies comprised relative water loss (RWL), basic density, saturated water content as well as anatomical traits such as double wall thickness, tracheid lumen diameter and wall/lumen ratio. Results: our novel proxy P25W, defined as 25% RWL induced by air injection, was the most reliable estimate for P50 (r = 0.95) and P88 (r = 0.96). Basic wood density (r = −0.92), tangential lumen diameters in earlywood (r = 0.88), wall/lumen ratios measured in the tangential direction (r = −0.86) and the number of radial cell files/mm circumference (CF/mm, r = −0.85) were also strongly related to P50. Moreover, CF/mm was a very good predictor for P12 (r = −0.93). Conclusions: the proxy P25W is regarded a strong phenotyping tool for screening conifer species for vulnerability to cavitation assuming that the relationship between RWL and conductivity loss is robust in conifer sapwood. We also see a high potential for the fast and easily applicable proxy CF/mm as a screening tool for drought sensitivity and for application in dendroecological studies that investigate forest dieback.

1. Introduction

Current models predict widespread forest mortality due to global warming [1,2,3]. Conifers are amongst the most endangered plant groups regarding tree mortality [4,5] and forest dieback [6] induced by drought and heat waves. As a first step in drought response, trees close stomata in order to limit both water loss and further decrease in (secondary) xylem water potential. Water loss via needles proceeds thereafter at a much lower rate, depending on the cuticular resistance, which itself is influenced by temperature [7]. When the water potential becomes more negative, the water columns in the tracheids can break (cavitation) more easily followed by further development and spread of embolisms. As the number of emboli increases, conductivity loss in the (secondary) xylem also increases [8,9]. This dynamic process can be simulated by vulnerability curves, where the percentage loss of conductivity is plotted against the water potential. In conifers, P50, i.e., the water potential resulting in 50% conductivity loss derived from the vulnerability curves, is regarded as the “point of no return” for recovery from drought, as it represents the minimum recoverable water potential in many species [9]; exceptions e.g., [10]. The hydraulic safety margin of a species is calculated from the difference between the minimum water potential measured in the field and P50 [9,11,12,13]. Information on P50 can thus be helpful to screen for more drought susceptible conifer species or provenances. The correct determination of P50 by means of classical flow experiments is, however, labour intensive and difficult because measurement errors can occur during repeated flow experiments; resin can clog the conducting system or native embolism might obscure the results [14,15]. In our study we aimed at developing fast and easily applicable alternatives for estimating the species’ specific hydraulic vulnerability of young sapwood.
In conifers, capacitive water loss [16,17] is strongly related to hydraulic conductivity loss due to their quite homogenous and “simple” wood structure [18]. The P50 of sapwood corresponds to 25.18% of relative water loss (RWL) across conifer species (“conifer-curve”) [19]. A hydraulic alternative to P50 could thus be the water potential resulting in ~25% relative water loss (P25W), whereby RWL can be obtained by simple gravimetric measurements. Anatomical proxies for P50 are based on the assumption that the resistance against implosion, which should depend on the wall (t) to lumen (b) ratio (t/b), is strongly linked to vulnerability to cavitation [20,21]. In other words, sapwood that can withstand lower water potentials before cavitation occurs must be constructed more safely and should thus have a higher t/b or (t/b)2, which is termed “conduit wall reinforcement”. The relationship between t/b and P50 is tighter across conifer species than the relationships between pit anatomical traits and P50 [22]. Several approaches to estimate proxies for P50 based on tracheid dimensions can be found in the literature; measurements are either performed in the initially formed tracheid rows [23], in the entire earlywood [22,24], or in several radial files across the whole annual ring, where (t/b)2 is thereafter assessed on tracheids that are in the range of defined hydraulic diameters e.g., [20,25,26,27]. Refs. [24,27] detangled tangential and radial lumen diameters when calculating (t/b)2 as a proxy for P50, because of the much tighter relationships between tangential lumen dimensions and P50. Anatomical proxies for P50 offer the advantage that samples do not need to be fresh and that hydraulic vulnerability can be determined retrospectively for selected annual rings. The approach of relating drought response of trees to “constitutive wood anatomy” is based on works by [27,28] who found that the wood formed (often several years) before drought stress impacts the sensitivity to drought in sapwood of Picea abies and different Larix species. Drought induced dieback [27] or growth decreases [28] are more strongly related to (t/b)2 measured in the tangential rather than in the radial direction. Wood density is a very good proxy for hydraulic vulnerability in conifers [20,29] and is easy to measure; however, when the intention is a retrospective analysis at the annual ring level, techniques such as X-ray or high-frequency densitometry need to be applied [30,31]. Since such equipment is not readily available, the use of reliable anatomical proxies could offer a viable alternative in dendroecological research.
The aim of this study is to establish fast, easily applicable and reliable methods to estimate the hydraulic vulnerability of sapwood. We tested both hydraulic (P25W) and anatomical proxies such as lumen diameters, (t/b)2 and the number of radial cell files/mm circumference, as well as basic wood density, for their predictive quality of P12, P50 and P88, i.e., the water potentials resulting in 12, 50 and 88% conductivity loss, respectively. We included P12 and P88 in our analyses because recent studies show that conductivity losses higher than 12% occur after stomata are already closed [8,9], but there are also hints that some conifer species are able to survive high conductivity losses [10]. Regarding anatomical traits, our intention was to find proxies for hydraulic vulnerability of wood that can be applied in dendroecological research in order to relate them to the drought stress response of trees.

2. Materials and Methods

2.1. Plant Material and Harvest

Juvenile stems and branches of six different conifer species, comprising Abies nordmanniana (Stev.) Spach, Larix decidua Mill., Picea abies (L.) Karst., Pinus nigra ssp. nigricans Host. (“Austrian Pine”), Pseudotsuga menziesii (Mirbel) Franco and Taxodium distichum (L.) Rich., were investigated (Table 1). All sampled trees were grown in botanical gardens near BOKU University, Vienna, Austria, with transport times to the laboratory of less than 30 min. Branches (0.5–1.5 m) or whole saplings (<1 m) were harvested early in the morning and put in black plastic bags containing wet paper towels.

2.2. Reference Values of Hydraulic Vulnerability to Cavitation (P50, P12, P88)

Reference values for P50 were obtained by the air injection method, where the application of positive pressure in a double ended pressure sleeve mimics the water potential [32,33] and eventually induces cavitation and moisture loss [18]. The air injection method is suitable for conifer branches, trunks and roots [34].
Stem segments with a length of 200 mm were debarked under water and re-saturated under low vacuum for 24 h at 4 °C in filtered (0.22 µm), distilled water [35] with 0.005% Micropur (Katadyn Products, Wallisellen, Switzerland). Specimens were shortened to 130 mm and re-cut several times with razor blades, resulting in a final length of about 120 mm. Hydraulic conductivity was measured under a pressure head of 5.4 kPa with distilled and filtered water containing 0.005% Micropur. Air injection (Ψ) was applied in a double-ended pressure chamber (PMS Instruments, Corvallis, OR, USA) for one minute [18]. Samples were allowed to equilibrate for 30 min under water. Thereafter, the hydraulic conductivity was measured again and the percent loss of conductivity was calculated. The pressure applied in each air injection was gradually increased by steps of 0.5 or 1.0 MPa.
In a hydraulic vulnerability curve, the percent loss of conductivity (PLC) is plotted against the water potential (Ψ). The application of positive pressure (air injection) mimics a decrease in water potential, and, therefore, Ψ is hereafter used to refer to both water potential and pressure application. Hydraulic vulnerability curves were established separately for each sample in order to calculate P12, P50 and P88 values [36], corresponding to the pressure application at which 12, 50 or 88% of conductivity loss occurred. The trait Ψ12 is termed the “air entry point” and is an estimate of the water potential at which the resistance to air entry of the pit membranes is overcome and cavitation and embolism is likely to start. Based on the latter, Ψ88 is termed the “full embolism point”, which is the water potential close to the state when the sapwood becomes non-conductive [36]. Calculation of P12, P50 and P88 values was done by means of the exponential sigmoidal Equation (1) [37].
PLC (%) = 100/(1 + exp(a (Ψ − b)))
In Equation (1), “a” corresponds to the slope of the linear part of the function and “b” is the P50.

2.3. Relative Water Loss and Calculation of P25W

After full saturation and before the first hydraulic flow measurement, the saturated weight (SW) of the specimen was determined on a lab balance (resolution of 0.0001 g, Mettler Toledo International Inc., Greifensee, Switzerland). The fresh weight (FW) was subsequently determined after each pressure application. In order to assess the dry weight (DW), specimens were dried for 48 h at 103 °C [29]. The relative water loss (RWL) was calculated with Equation (2).
RWL (%) = 100 (1 − ((FW − DW)/(SW − DW)))
Relative water loss curves, i.e., the RWL plotted against Ψ were fitted by the “curve estimation” and “non-linear regression” functions in SPSSTM 21.0. The fittings with the highest predictive quality (r2) and the most reliable shape were chosen, comprising quadratic, cubic and Weibull functions [19,38] in order to calculate P25W, defined as the pressure application, i.e., water potential, resulting in 25% of RWL.

2.4. Basic Wood Density
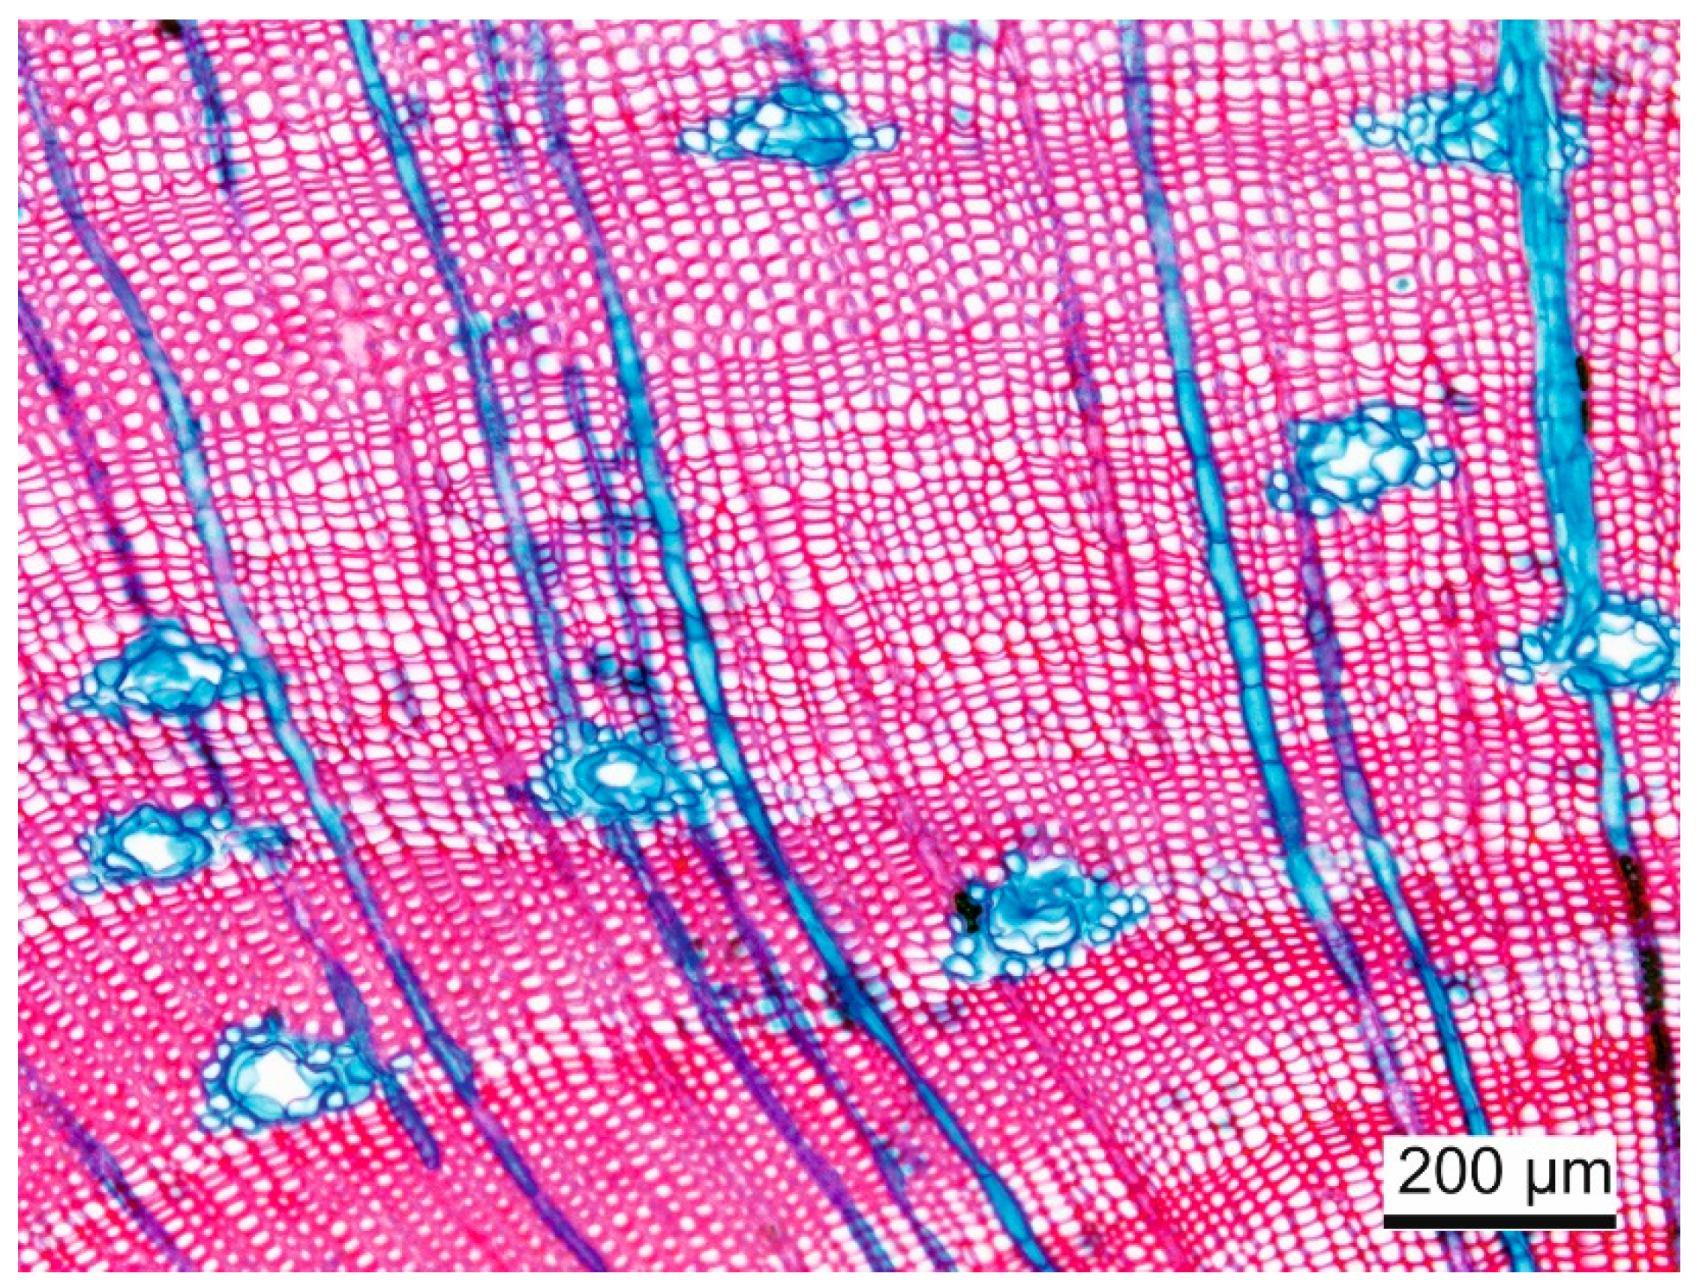
Basic wood density (BD) is the mass in the oven dry state divided by the sample volume in the fully saturated, never dried, green state [kg/m3]. Directly after the first hydraulic flow measurement, dimensions in the fully saturated state were measured with a caliper (resolution of 0.1 mm). The mass in the oven dry state was assessed after specimens were dried for 48 h at 103 °C [29].

2.5. Wood Anatomy

Segments with a length of 3 cm were sawn from the specimens on which the hydraulic reference data were measured. Wood samples were softened in a mixture of water, alcohol and glycerol (1:1:1) for at least two weeks. Transverse sections with a thickness of 20 µm were produced on a sliding microtome (Jung Reichert, Vienna, Austria). Sections were stained with Methylene blue, dehydrated with alcohol and mounted in Euparal (Merck, Darmstadt, Germany). Microphotography was achieved with a Leica DM4000 M microscope equipped with a Leica DFC320 R2 digital camera and Leica IM 500 Image Manager image analyzing software (Leica, Wetzlar, Germany). Cell wall thickness and tracheid dimensions were measured by means of Image J software [39] in the first ten radial earlywood cell files [28] of the latest annual ring in four different locations around the stem. Lumen diameters (b) and double cell wall thickness (t) in the radial (br, tr) and tangential (bt, tt) directions of 20 tracheids (Figure 1a,b) were measured. From these traits, the conduit wall reinforcements [20] in the radial ((tr/br)2) and in the tangential ((tt/bt)2) direction were calculated. In addition, the number of radial cell files/mm circumference (CF/mm) was determined for each location. Care was taken, that in the regions investigated (a) no ray cells were present and that (b) tracheids were not cut transversally at their tips (Figure 1c,d). A suitable approach was to select a tangential row of 5–10 radial tracheid files and measure the distance from the middle lamellae of the first to the middle lamellae of the last tracheid in this row. The number of radial tracheid files was then related to 1 mm of circumference.

2.6. Sample Numbers, Data Processing and Statistical Analyses

Hydraulic and anatomical traits (Table 2) of six different conifer species with 3–8 replicates/species were investigated (Table 1). Except for P. nigra, raw datasets for hydraulic traits (Ψ, PLC, RWL) were available [18]. However, for the present work, vulnerability curves and relative water loss curves were not calculated for pooled datasets but separately for each sample. Statistical analysis was carried out with SPSSTM 21.0. Normal distribution was tested with the Kolmogorov–Smirnov test. Species mean values of all traits were normally distributed, whereas some sample specific trait datasets were not (lumen diameters and conduit wall reinforcements). In order to meet the requirement for normality, data of these traits were transformed into normal scores by calculating their logarithmic values. Relationships between all traits were tested by Pearson correlation and selected traits by linear regressions. Relationships were accepted as significant if the p-value was <0.05.

3. Results

3.1. Range of Hydraulic Vulnerabilities

Conifer samples varied widely in their hydraulic vulnerabilities (P12, P50, P88), whereby the lowest values were found in A. nordmanniana stems, intermediate in L. decidua and P. nigra branches and the highest in T. distichum branches (Table 3).

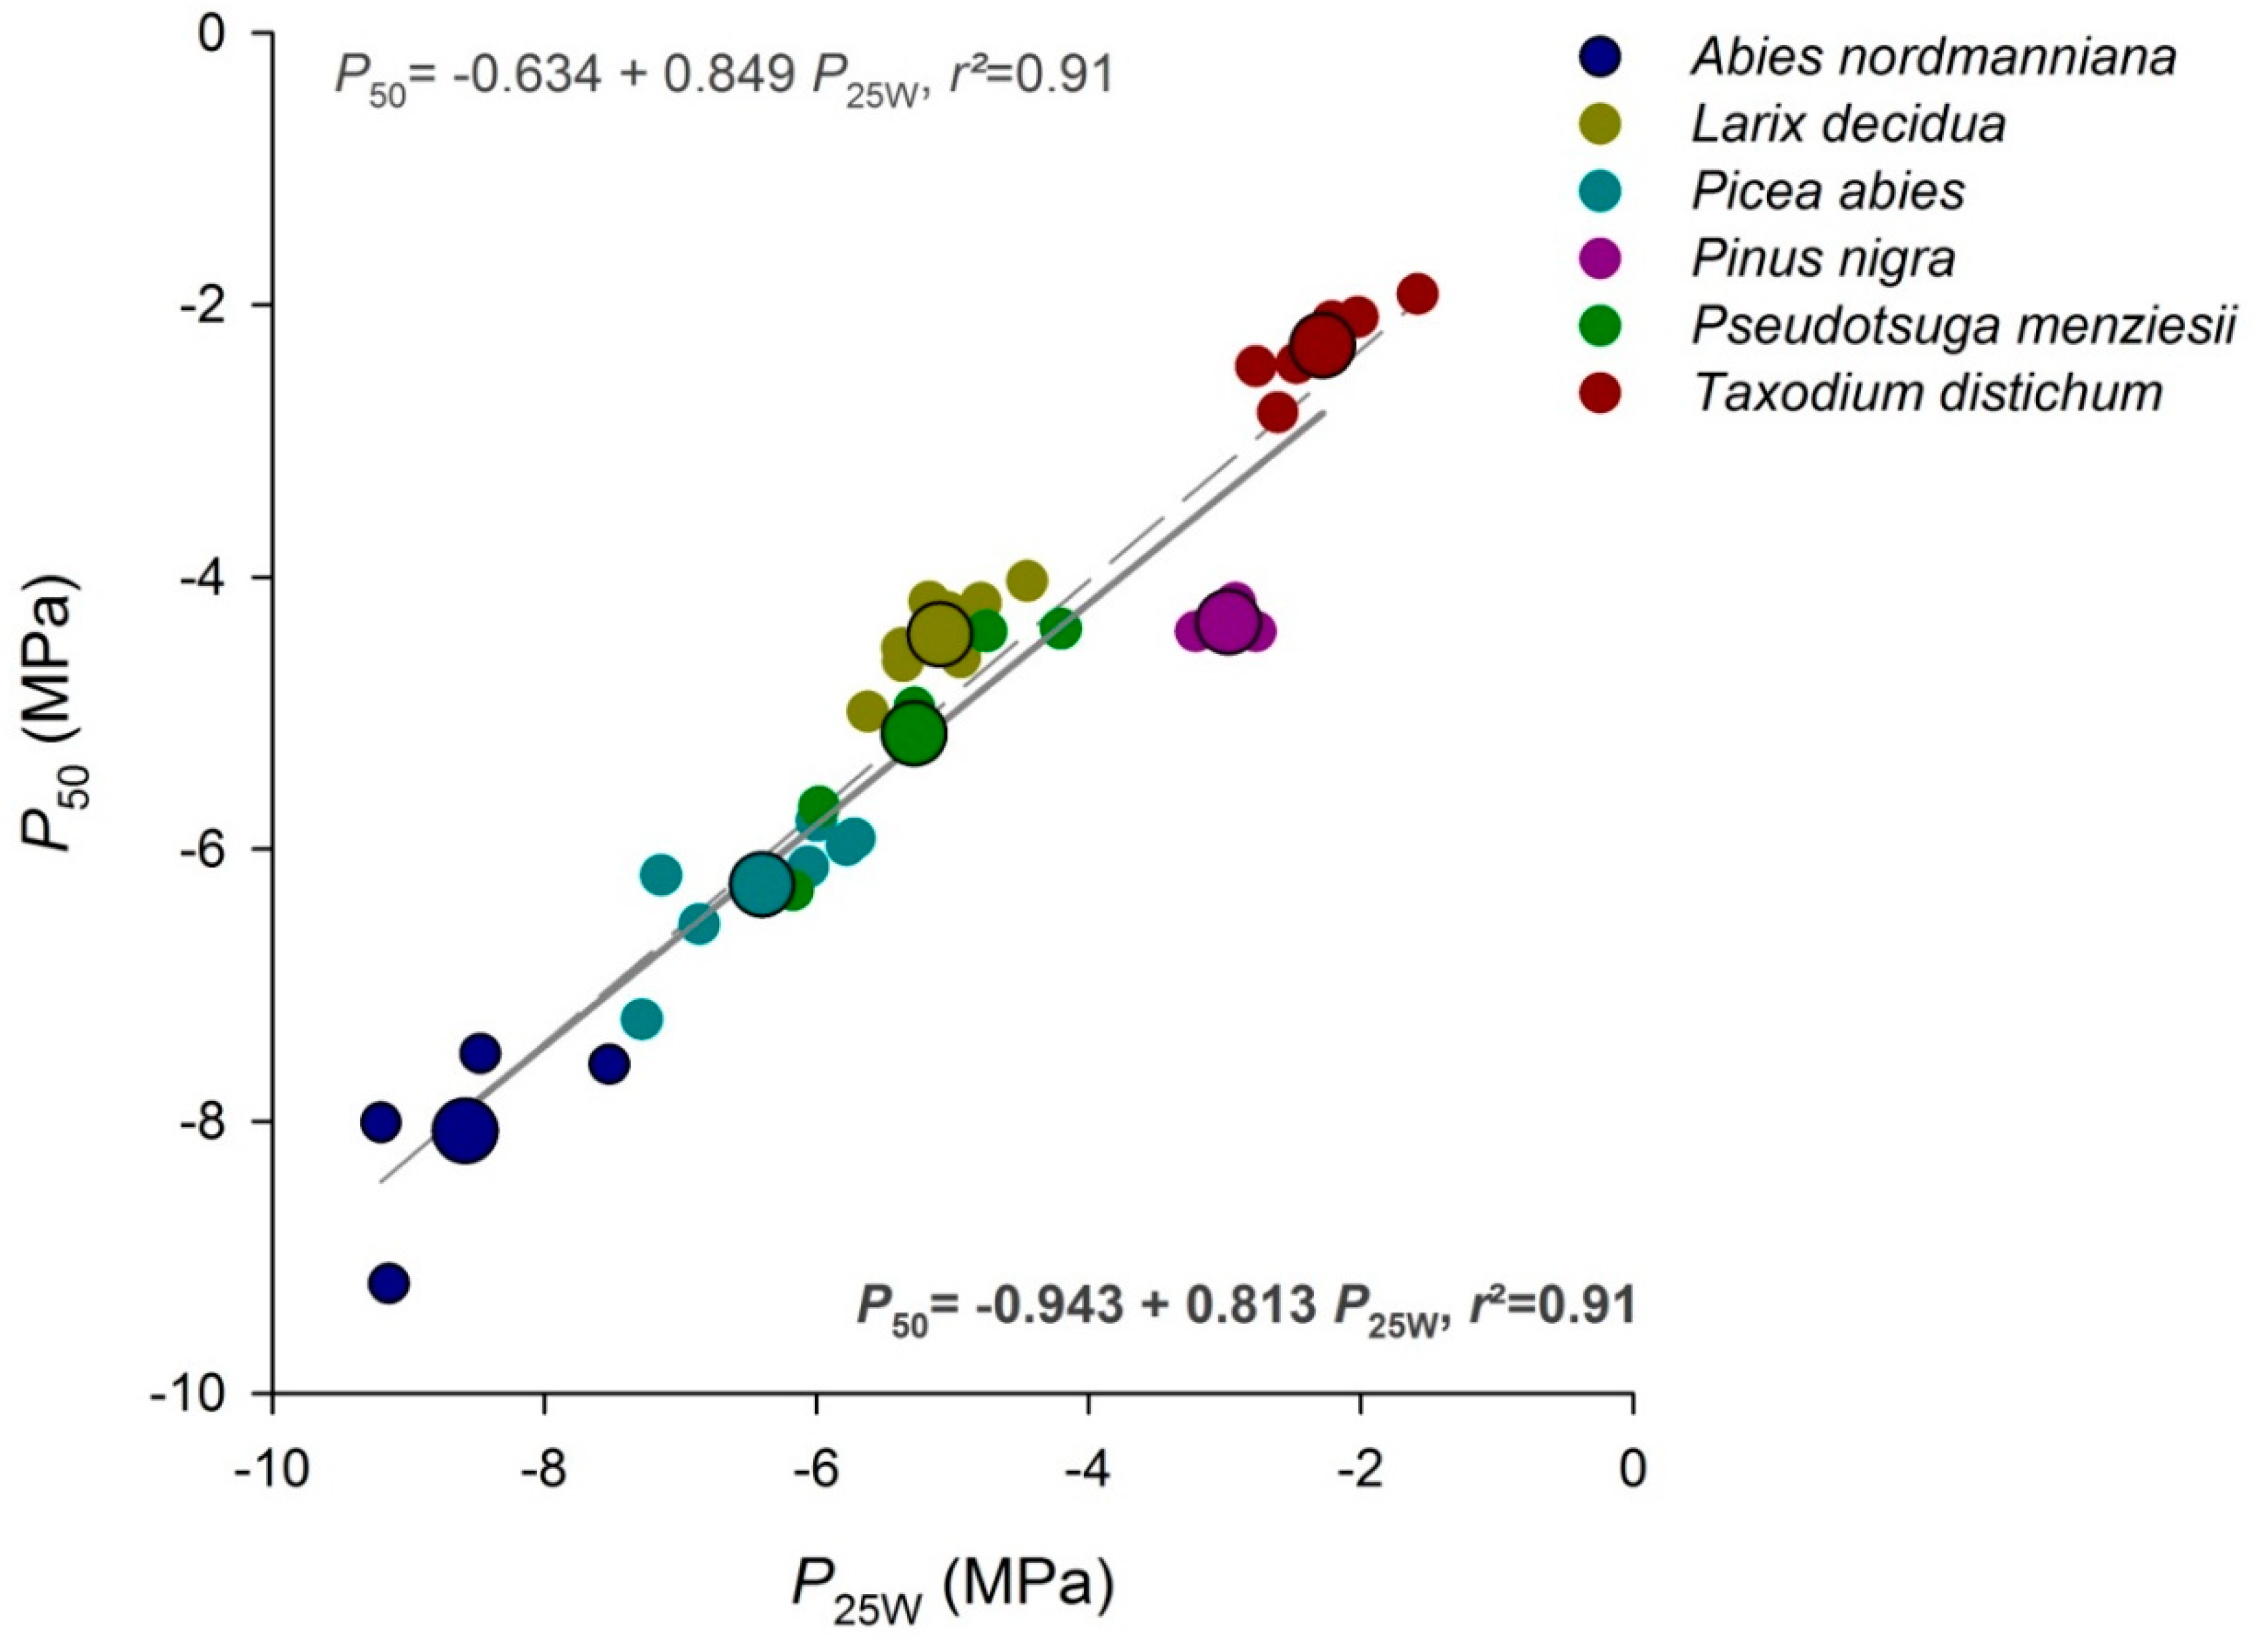
3.2. Relationships between Hydraulic Traits

Species-specific relative water loss curves (Figure 2a) showed the same species ranking as hydraulic vulnerability curves (Figure 2b); T. distichum had both the steepest decline in relative water loss (RWL) as well as in hydraulic conductivity loss (PLC), whereas A. nordmanniana had the lowest decline in RWL and PLC with decreasing Ψ. Mean P25W, i.e., the Ψ resulting in 25% relative water loss, was strongly related to mean P50 across species (r = 0.95, Figure 3). By excluding, P. nigra, which had either a higher P25W (underestimated) or a lower P50 (overestimated) than expected, the relationship would have become even tighter (r = 0.99, p ≤ 0.001). Tight relationships were also found between mean P25W and P88 (r = 0.96), since P88 was strongly related to P50 (r = 0.98) across species (Table 4).

3.3. Structure–Function Relationships

Basic wood density was the best proxy for P50 (r = −0.92, Figure 4a) and was also strongly related to P88 (Figure 4c) and P25W (Table 4). The species-specific vulnerability to cavitation increased with decreasing wood density. Mean values of radial lumen diameters were not significantly related to empirical hydraulic traits (Table 4), whereas mean tangential lumen diameters were significantly related to P50 (Figure 4d) and P12 (Figure 4e) but not to P88 (Figure 4f). For P12, the tangential tracheid lumen diameter was the best proxy (r = 0.996, Figure 4e); species with a higher hydraulic vulnerability had higher tangential tracheid lumen diameters in earlywood. Mean wall thickness traits were not significantly related to empirical hydraulic traits (Table 4). Mean tangential conduit wall reinforcement was significantly related to P50 (Figure 4g) and P88, (Figure 4i) but not to P12 (Figure 4h). The best proxy for P88 was the tangential conduit wall reinforcement (r = −0.94); the latter was also significantly related to P25W (r = −0.86) (Table 4). Vulnerability to cavitation increased with decreasing tangential conduit wall reinforcement. Species with a higher number of radial cell files/mm had a lower P50 (Figure 4j), P12 (Figure 4k) and P88 (Figure 4l), whereby for the latter the relationship was not statistically significant.

4. Discussion

4.1. The Hydraulic Capacitance Parameter P25W Is the Best Proxy for Vulnerability to Cavitation

The novel trait P25W had the highest predictive quality for P50 (r2 = 0.91) and the relationship between these parameters was linear across species. Data for P. nigra shifted most from the linear relationship (Figure 3). Either the P25W values were underestimated (too high, i.e. less negative), suggesting artificially high water loss (of oversaturated tissue) at a given water potential or the P50 values were overestimated (too negative). Existing emboli in the sapwood can result in “shifting” of the vulnerability curve towards more negative water potentials resulting in more negative P50 values [15,40]. If trees have already been subjected to water potentials low enough to cause embolism, refilling of these conduits is necessary to obtain standardized species-specific vulnerability curves [19]. In our study, refilling was done under partial vacuum [35], because night-time branch rehydration is often not sufficient to refill emptied tracheids [40]. We estimated P50 at −4.3 MPa and P25W at −3.0 MPa. In previous works, P50 values of −3.8 MPa and −3.6/−3.2 MPa were reported for young P. nigra stems [41] and branches [40], respectively. As mentioned above, oversaturation through refilling of wood that did not contribute to sap flow initially would result in an underestimation rather than an overestimation of P50 [15] and can thus be excluded for our P. nigra samples. However, repeated air injection might lead to artificial outflow of resin and emptied canals might refill with water during the repeated flow measurements, resulting in an overestimation of the hydraulic conductivity at a given Ψ and thus an underestimation of the conductivity loss (PLC). Such a “cut open resin canal effect” occurring at later dehydration stages would eventually result in an overestimation (more negative values) of P50. P. nigra wood is known for its big resin canals and its high amount of resin produced (Figure 5). Because of the latter, P. nigra has been commercially used and very likely been selected for resin production [42]. Axial resin canals in Pinus species can reach maximum lengths of up to 1 m and mean lengths up to 0.5 m reviewed in [43], thus, most of the resin canals were probably much longer than the sample length used for the flow experiments (120 mm). If some resin was already replaced by water from cut open canals during the re-saturation process under partial vacuum, an artificial oversaturation with water would result in an underestimation (higher values) of P25W (Figure 3) and, if water flow was affected as well, also of P50. The construction of hydraulic vulnerability curves of resinous conifer species remains challenging and the relationship between P25W and P50 across conifer species might be useful for finding the most reliable method to estimate P50.

4.2. Tangentially Measured Anatomical Traits Have a Higher Predictive Quality for Hydraulic Failure

Basic wood density was the best proxy for P50 as shown in earlier studies [20,29,44]. Wood density is, however, not that easily determined at the tree ring level, whereby techniques such as X-ray micro-density or high-frequency densitometry must be applied [24,30,31]. Differences in wood density result from changes in lumen diameter and cell wall thickness. The strongest anatomical predictive trait for P50 was the tangential lumen diameter of earlywood (r2 = 0.77). The relationship of P12 with the latter was even stronger (r2 = 0.99). In a previous work, [27] showed that top dieback in Norway spruce was more strongly related to the tangential rather than radial tracheid lumen diameters and that (t/b)2 calculated from tangential lumen diameters had a higher predictive quality for P50 than when calculated from the mean or the radial lumen diameters. Our results for the relationship of (t/b)2 traits with P50 among conifer species are in agreement with the latter. More recently, [45] showed that for Norway spruce at breast height, the tangential lumen diameters increase more with tree height than the radial diameters; as a consequence, the number of radial tracheid files/mm circumference is negatively related to tree height. Accordingly, lower hydraulic safety is found with higher distance from the treetop [44]. Tip-to-base xylem conduit widening of vessel and tracheid diameters has been reported for many species [46,47] and detangling radial and tangential lumen diameters could provide further insights in within-tree differences in hydraulic vulnerability.
Tangential lumen diameters are less influenced by annual differences in climate, because the rate of periclinal (radial: inside and outside) division is much higher than that of anticlinal (circumference: side) division [48]. The number of radial tracheid files/mm circumference (CF/mm) in earlywood depends on the tangential lumen diameters rather than on the cell wall thickness. As the tangential lumen diameters of earlywood tracheids and the CF/mm showed a similar or even stronger predictive quality for P50 than the best (t/b)2 trait (Table 4), we suggest that it is not necessary to calculate conduit wall reinforcement traits in order to predict vulnerability to cavitation across conifer species. According to our knowledge about conduit widening [46,47,49], anatomical proxies (tangential lumen diameters, CF/mm) may be as well suitable to predict vulnerability to cavitation along tree trunks and branches. We did not investigate different provenances of a given species, so we do not know if a high variability in P50 exists among them. Basic wood density and anatomical proxies are reliable on the inter-specific level, but we found no relationships at the intra-specific level for a given provenance of a species (Figure 4). A further step would thus be to test different provenances of a given species, with e.g., different growth characteristics, for relationships between hydraulics and wood anatomy. For such investigations, P25W could be used instead of P50 because their intra-specific relationships followed the same trend as the inter-specific ones (Figure 3)

5. Conclusions

The novel proxy P25W, i.e., the pressure application that is necessary to result in 25% relative water loss, is regarded as a reliable phenotyping tool for screening conifer species for vulnerability to cavitation, as the relationship between RWL and conductivity loss is assumed to be robust across conifer species. Recently, [34] reported that it was possible to construct 10–25 vulnerability curves/week/person with the air injection method. To determine P25W, it is not necessary to measure the hydraulic conductance; therefore, 40–100 relative water loss curves/week/person can be produced, whereby the equivalent of one working day (8 h) is dedicated to sample preparation and determination of the dry weights. We also see a high potential for the proxy CF/mm, i.e., the number of radial tracheid files/mm circumference, (a) as a screening tool for drought sensitivity of wood where samples can be taken “non-destructively” by wood coring and (b) for application in dendroecological studies that retrospectively investigate tree mortality and forest dieback. Determination of the anatomical proxy CF/mm demands only moderate skills in histology and image analysis.

Author Contributions

Conceptualization, S.R.; methodology, S.R., S.N. and K.V.; validation, S.R., S.N. and K.V.; formal analysis, S.R., S.N. and K.V.; investigation, S.R., S.N. and K.V.; data curation, S.R.; writing—original draft preparation, S.R.; writing—review and editing, S.R. and K.V.; visualization, S.R.; supervision, S.R.; project administration, S.R.; funding acquisition, S.R. All authors have read and agreed to the published version of the manuscript.

Funding

“This research was partly funded by the Norwegian Research Council (project “Dieback in Norway spruce”, No. 199403), by the Norwegian Forest Owners’ Research Fund “Skogtiltaksfondet”, six regional funds in Norway (Fylkesmannen).

Data Availability Statement

The dataset is available from the corresponding author on reasonable request.

Acknowledgments

Susi Scheffknecht is acknowledged for valuable assistance in the histology laboratory at BOKU University. We thank Helga Amreiter (Pötzleinsdorfer Schlosspark, Vienna, MA 42) for providing plant material of Taxodium distichum. We also thank Hugh Morris for critical reading of the manuscript and for linguistic corrections.

Conflicts of Interest

The authors declare no conflict of interest. The funders had no role in the design of the study; in the collection, analyses, or interpretation of data; in the writing of the manuscript, or in the decision to publish the results.

References

  1. McDowell, N.G.; Allen, C.D. Darcy’s law predicts widespread forest mortality under climate warming. Nat. Clim. Chang. 2015, 5, 669. [Google Scholar] [CrossRef]
  2. Brodribb, T.; Powers, J.; Cochard, H.; Choat, B. Hanging by a thread? Forests and drought. Science 2020, 368, 261–266. [Google Scholar] [CrossRef] [PubMed]
  3. Breshears, D.D.; Fontaine, J.B.; Ruthrof, K.X.; Field, J.P.; Feng, X.; Burger, J.R.; Law, D.J.; Kala, J.; Hardy, G.E.S.J. Underappreciated plant vulnerabilities to heat waves. New Phytol. 2021, 231, 32–39. [Google Scholar] [CrossRef] [PubMed]
  4. Klein, T.; Cahanovitc, R.; Sprintsin, M.; Herr, N.; Schiller, G. A nation-wide analysis of tree mortality under climate change: Forest loss and its causes in Israel 1948–2017. For. Ecol. Managem. 2019, 432, 840–849. [Google Scholar] [CrossRef]
  5. Mencuccini, M.; Binks, O. Tall, leafy conifers lose out. Nat. Clim. Chang. 2015, 5, 625–626. [Google Scholar] [CrossRef]
  6. Allen, C.D.; Breshears, D.D.; McDowell, N.G. On underestimation of global vulnerability to tree mortality and forest die-off from hotter drought in the Anthropocene. Ecosphere 2015, 6, 129. [Google Scholar] [CrossRef]
  7. Cochard, H. A new mechanism for tree mortality due to drought and heatwaves. Wood Sci. 2020, 1, 1–17. [Google Scholar] [CrossRef] [Green Version]
  8. Cochard, H.; Delzon, S. Hydraulic failure and repair are not routine in trees. Ann. For. Sci. 2013, 70, 659–661. [Google Scholar] [CrossRef] [Green Version]
  9. Choat, B.; Brodribb, T.J.; Brodersen, C.R.; Duursma, R.A.; Lopez, R.; Medlyn, B.E. Triggers of tree mortality under drought. Nature 2018, 558, 531–539. [Google Scholar] [CrossRef]
  10. Hammond, W.M.; Yu, K.L.; Wilson, L.A.; Will, R.E.; Anderegg, W.R.; Adams, H.D. Dead or dying? Quantifying the point of no return from hydraulic failure in drought-induced tree mortality. New Phytol. 2019, 223, 1834–1843. [Google Scholar] [CrossRef] [Green Version]
  11. Tyree, M.T.; Sperry, J.S. Do woody plants operate near the point of catastrophic xylem dysfunction caused by dynamic water stress? Answers from a model. Plant Physiol. 1988, 88, 574–580. [Google Scholar] [CrossRef] [PubMed] [Green Version]
  12. Choat, B.; Jansen, S.; Brodribb, T.J.; Cochard, H.; Delzon, S.; Bhaskar, R.; Bucci, S.J.; Field, T.S.; Gleason, S.M.; Hacke, U.G.; et al. Global convergence in the vulnerability of forests to drought. Nature 2012, 491, 752–755. [Google Scholar] [CrossRef] [Green Version]
  13. Delzon, S.; Cochard, H. Recent advances in tree hydraulics highlight the ecological significance of the hydraulic safety margin. New Phytol. 2014, 203, 355–358. [Google Scholar] [CrossRef] [PubMed]
  14. Cochard, H.; Badel, E.; Herbette, S.; Delzon, S.; Choat, B.; Jansen, S. Methods for measuring plant vulnerability to cavitation: A critical review. J. Exp. Bot. 2013, 64, 4779–4791. [Google Scholar] [CrossRef] [PubMed] [Green Version]
  15. Hacke, U.G.; Venturas, M.D.; MacKinnon, E.D.; Jacobsen, A.L.; Sperry, J.S.; Pratt, R.B. The standard centrifuge method accurately measures vulnerability curves of long-vesselled olive stems. New Phytol. 2015, 205, 116–127. [Google Scholar] [CrossRef] [PubMed]
  16. Johnson, D.M.; McCulloh, K.A.; Woodruff, D.R.; Meinzer, F.C. Hydraulic safety margins and embolism reversal in stems and leaves: Why are conifers and angiosperms so different? Plant Sci. 2012, 135, 4–53. [Google Scholar] [CrossRef]
  17. McCulloh, K.A.; Johnson, D.M.; Meinzer, F.C.; Woodruff, D.R. The dynamic pipeline: Hydraulic capacitance and xylem hydraulic safety in four tall conifer species. Plant Cell Environ. 2014, 37, 1171–1183. [Google Scholar] [CrossRef] [Green Version]
  18. Rosner, S.; Heinze, B.; Savi, T.; Dalla-Salda, G. Prediction of hydraulic conductivity loss from relative water loss: New insights into water storage of tree stems and branches. Physiol. Plant 2019, 165, 843–854. [Google Scholar] [CrossRef] [Green Version]
  19. Rosner, S.; Johnson, D.M.; Voggeneder, K.; Domec, J.-C. The conifer-curve: Fast prediction of hydraulic conductivity loss and vulnerability to cavitation. Ann. For. Sci. 2019, 76, 82. [Google Scholar] [CrossRef] [Green Version]
  20. Hacke, U.G.; Sperry, J.S.; Pockman, W.T.; Davis, S.D.; McCulloh, K.A. Trends in wood density and structure are linked to prevention of xylem implosion by negative pressure. Oecologia 2001, 126, 457–461. [Google Scholar] [CrossRef]
  21. Hacke, U.G.; Lachenbruch, B.; Pitterman, J.; Mayr, S.; Domec, J.-C.; Schulte, P.J. The Hydraulic Architecture of Conifers. In Functional and Ecological Xylem Anatomy; Hacke, U.G., Ed.; Springer International Publishing: Basel, Switzerland, 2015; pp. 39–75. [Google Scholar]
  22. Bouche, P.S.; Larter, M.; Domec, J.-C.; Burlett, R.; Gasson, P.; Jansen, S.; Delzon, S. A broad survey of hydraulic and mechanical safety in the xylem of conifers. J. Exp. Bot. 2014, 65, 4419–4431. [Google Scholar] [CrossRef] [Green Version]
  23. Rosner, S.; Karlsson, B.; Konnerth, J.; Hansmann, C. Shrinkage processes in standard-size Norway spruce wood specimens with different vulnerability to cavitation. Tree Physiol. 2009, 29, 1419–1431. [Google Scholar] [CrossRef]
  24. Luss, S.; Lundqvist, S.-O.; Evans, R.; Grahn, T.; Olsson, L.; Petit, G.; Rosner, S. Within-ring variability of wood structure and its relationship to drought sensitivity in Norway spruce trunks. IAWA J. 2019, 40, 288–310. [Google Scholar] [CrossRef]
  25. Domec, J.-C.; Warren, J.M.; Meinzer, F.C.; Lachenbruch, B. Safety for xylem failure by implosion and air-seeding within roots, trunks and branches of young and old conifer trees. IAWA J. 2009, 30, 101–120. [Google Scholar] [CrossRef] [Green Version]
  26. Hereş, A.-M.; Camarero, J.J.; López, B.C.; Martínez-Vilalta, J. Declining hydraulic performances and low carbon investments in tree rings predate Scots pine drought-induced mortality. Trees 2014, 28, 1737–1750. [Google Scholar] [CrossRef]
  27. Rosner, S.; Světlík, J.; Andreassen, K.; Børja, I.; Dalsgaard, L.; Evans, R.; Luss, S.; Tveito, O.E.; Solberg, S. Novel hydraulic vulnerability proxies for a boreal conifer species reveal that opportunists may have lower survival prospects under extreme climatic events. Front. Plant Sci. 2016, 7, 831. [Google Scholar] [CrossRef] [PubMed] [Green Version]
  28. Sasani, N.; Pâques, L.E.; Boulanger, G.; Singh, A.P.; Gierlinger, N.; Rosner, S.; Brendel, O. Physiological and anatomical responses to drought stress differ between two larch species and their hybrid. Trees 2021, in press. [Google Scholar] [CrossRef]
  29. Rosner, S. Wood density as a proxy for vulnerability to cavitation: Size matters. J. Plant Hydraul. 2017, 4, e001. [Google Scholar] [CrossRef]
  30. Boden, S.; Schinker, M.G.; Duncker, P.; Spiecker, H. Resolution abilities and measuring depth of high-frequency densitometry on wood samples. Measurement 2012, 45, 1913–1921. [Google Scholar] [CrossRef]
  31. Björklund, J.; von Arx, G.; Nievergelt, D.; Wilson, R.; Van den Bulcke, J.; Günther, B.; Loader, N.J.; Rydval, M.; Fonti, P.; Scharnweber, T.; et al. Scientific Merits and Analytical Challenges of Tree-Ring Densitometry. Rev. Geophys. 2019, 57, 1224–1264. [Google Scholar] [CrossRef] [Green Version]
  32. Cochard, H.; Cruizat, P.; Tyree, M.T. Use of positive pressures to establish vulnerability curves. Further support for the air-seeding hypothesis and implications for pressure-volume analysis. Plant Physiol. 1992, 100, 205–209. [Google Scholar] [CrossRef] [Green Version]
  33. Salleo, S.; Hinckley, T.M.; Kikuta, S.B.; Lo Gullo, M.A.; Weilgony, P.; Yoon, T.M.; Richter, H. A method for inducing xylem emboli in situ: Experiments with a field-grown tree. Plant Cell Environ. 1992, 15, 491–497. [Google Scholar] [CrossRef]
  34. Sergent, A.-S.; Varela, S.A.; Barigah, T.S.; Badel, E.; Cochard, H.; Dalla-Salda, G.; Delzon, S.; Fernández, M.E.; Guillemot, J.; Gyenge, J.; et al. A comparison of five methods to assess embolism resistance in trees. For. Ecol. Manag. 2020, 468, 118175. [Google Scholar] [CrossRef]
  35. Hietz, P.; Rosner, S.; Sorz, J.; Mayr, S. Comparison of methods to quantify loss of hydraulic conductivity in Norway spruce. Ann. For. Sci. 2008, 65, 502. [Google Scholar] [CrossRef]
  36. Domec, J.-C.; Gartner, B.L. Age- and position-related changes in hydraulic versus mechanical dysfunction of xylem: Inferring the design criteria for Douglas-fir wood structure. Tree Physiol. 2002, 22, 91–104. [Google Scholar] [CrossRef] [PubMed] [Green Version]
  37. Pammenter, N.W.; VanderWilligen, C. A mathematical and statistical analysis of the curves illustrating vulnerability of xylem to cavitation. Tree Physiol. 1998, 18, 589–593. [Google Scholar] [CrossRef] [PubMed] [Green Version]
  38. Lopez, O.R.; Kursar, T.A.; Cochard, H.; Tyree, M.T. Interspecific variation in xylem vulnerability to cavitation among tropical tree and shrub species. Tree Physiol. 2005, 25, 1553–1562. [Google Scholar] [CrossRef] [Green Version]
  39. Schneider, C.A.; Rasband, W.S.; Eliceiri, K.W. NIH Image to ImageJ: 25 years of image analysis. Nat. Meth. 2012, 9, 671–675. [Google Scholar] [CrossRef] [PubMed]
  40. Savi, T.; Casolo, V.; Borgo, A.; Rosner, S.; Torboli, V.; Stenni, B.; Bertoncin, P.; Martellos, S.; Pallavicini, A.; Nardini, A. Drought-induced dieback of Pinus nigra: A tale of hydraulic failure and carbon starvation. Conserv. Physiol. 2019, 7, coz012. [Google Scholar] [CrossRef]
  41. Hacke, U.G.; Sperry, J.S.; Pitterman, J. Analysis of circular bordered pit function II. Gymnosperm tracheids with torus-margo pit membranes. Am. J. Bot. 2004, 91, 386–400. [Google Scholar] [CrossRef] [Green Version]
  42. Grossoni, P. Pinus nigra. Enzyklopädie der Holzgewächse 2006, 19, 1–14. [Google Scholar]
  43. LaPasha, C.A.; Wheeler, E.A. Resin canals in Pinus taeda-longitudinal canal lengths and interconnections between longitudinal and radial canals. IAWA J. 1990, 11, 227–238. [Google Scholar] [CrossRef]
  44. Rosner, S. Hydraulic and biomechanical optimization in Norway spruce trunkwood: A review. IAWA J. 2013, 34, 365–390. [Google Scholar] [CrossRef] [Green Version]
  45. Piermattei, A.; von Arx, G.; Avanzi, C.; Fonti, P.; Gärtner, H.; Piotti, A.; Urbinati, C.; Vendramin, G.G.; Büntgen, U.; Crivellaro, A. Functional relationships of wood anatomical traits in Norway spruce. Front. Plant Sci. 2020, 11, 683. [Google Scholar] [CrossRef] [PubMed]
  46. Anfodillo, T.; Petit, G.; Crivellaro, A. Axial conduit widening in woody species: A still neglected anatomical pattern. IAWA J. 2013, 34, 352–364. [Google Scholar] [CrossRef] [Green Version]
  47. Olson, M.E.; Anfodillo, T.; Gleason, S.M.; McCulloh, K.A. Tip-to-base xylem conduit widening as an adaptation: Causes, consequences, and empirical priorities. New Phytol. 2021, 229, 1877–1893. [Google Scholar] [CrossRef]
  48. Larson, P.R. The Vascular Cambium—Development and Structure; Springer: Berlin/Heidelberg, Germany, 1994. [Google Scholar]
  49. Petit, G.; Crivellaro, A. Comparative axial widening of phloem and xylem conduits in small woody plants. Trees 2014, 28, 915–921. [Google Scholar] [CrossRef]
Figure 1. Description of anatomical traits; (a) one annual ring of Picea abies stem wood; (b) anatomical traits measured in earlywood; (c) Abies nordmanniana stem wood; (d) Taxodium distichum branch wood; the pink bars in (c,d) indicate regions of interest for counting of radial cell files in earlywood; br radial tracheid lumen diameter; bt tangential tracheid lumen diameter; tr radial tracheid double cell wall thickness, tt tangential tracheid double cell wall thickness.
Forests 12 01104 g001
Figure 2. Empirical hydraulic traits; (a) relative water loss (RWL) and (b) percent loss of hydraulic conductivity (PLC) plotted against the negative of the air pressure applied in a pressure collar (water potential) for six different conifer species. Error bars indicate one standard error. Curves for mean values were fitted by a Weibull equation [38].
Forests 12 01104 g002
Figure 3. Relationships between P50 (water potential resulting in 50% conductivity loss) and P25W (water potential resulting in 25% relative water loss) of six different conifer species. Small dots indicate single tree or branch samples; big dots species mean values. Hatched lines are linear regression lines for single tree or branch samples, solid lines are linear regression lines for species mean values.
Forests 12 01104 g003
Figure 4. Structure–function relationships of sapwood across conifer species. P50, P12 and P88 are plotted against (ac) basic wood density, (df) tangential lumen diameter of earlywood tracheids, (gi) tangential conduit wall reinforcement of earlywood and (jl) to the number of radial cell files/mm of six conifer species, indicated by different colors. Small dots indicate single samples (vulnerability curves), big dots species mean values. Solid lines denote significant linear relationships for species mean values and hatched lines represent linear regression lines that are not significant.
Forests 12 01104 g004
Figure 5. Branch wood of Pinus nigra stained with astablue/safranin.
Forests 12 01104 g005
Table 1. Information on the age of the sampled trees (age), the amount of tree individuals investigated (trees), the sample numbers (samples) as well as the dataset numbers (dataset, single hydraulic measurements before and after repeated air injection). All specimens came from botanical gardens in Vienna, Austria, latitude 48°14′12″ N–48°14′33″ N and longitude 16°18′21″ E–16°20′15″ E.
SpeciesAgeTreesOrganSamplesDataset
Abies nordmanniana43stem427
Larix decidua202branch852
Picea abies48stem854
Pinus nigra203branch320
Pseudotsuga menziesii45stem537
Taxodium distichum203branch636
Table 2. List of traits and their abbreviations.
AbbreviationTraitUnit
P12Water potential resulting in 12% conductivity lossMPa
P50Water potential resulting in 50% conductivity lossMPa
P88Water potential resulting in 88% conductivity lossMPa
P25WWater potential resulting in 25% relative water lossMPa
BDBasic wood densitykg m−3
brRadial lumen diameter of earlywood tracheidsµm
trThickness of the radial double cell
wall of earlywood tracheids
µm
(tr/br)2Radial conduit wall reinforcement
(tangential force direction)
dimensionless
btTangential lumen diameter of earlywood tracheidsµm
ttThickness of the tangential double cell
wall of earlywood tracheids
µm
(tt/bt)2Tangential conduit wall reinforcement
(radial force direction)
dimensionless
bMean lumen diameter (br + bt)/2µm
tMean double cell wall thickness (tr + tt)/2µm
(t/b)2Mean conduit wall reinforcement (((tr/br)2 + (tt/bt)2)/2)Dimensionless
CF/mmNumber of radial cell files per tangential distance of 1 mmn/mm
Table 3. Information on the hydraulic reference parameters P50, P88 and P12 as well as the proxy P25W and their standard deviations; sample numbers (i.e., the number of hydraulic vulnerability curves) can be found in Table 1.
SpeciesP50
[MPa]
P12
[MPa]
P88
[MPa]
P25W
[MPa]
Abies nordmanniana−8.07 ± 0.78−4.11 ± 1.62−12.24 ± 0.62−8.58 ± 0.78
Larix decidua−4.42 ± 0.31−2.70 ± 0.26−6.14 ± 0.55−5.09 ± 0.37
Picea abies−6.26 ± 0.46−3.70 ± 0.50−8.82 ± 0.73−6.40 ± 0.62
Pinus nigra−4.33 ± 0.12−3.06 ± 0.35−5.60 ± 0.22−2.97 ± 0.22
Pseudotsuga menziesii−5.14 ± 0.84−3.47 ± 0.53−6.82 ± 1.43−5.28 ± 0.83
Taxodium distichum−2.30 ± 0.31−0.71 ± 0.58−4.19 ± 0.55−2.28 ± 0.44
Table 4. Correlation matrix for hydraulic and wood anatomical traits. Numbers in the upper right are the Pearson correlation coefficients of species mean values (n = 6), numbers in the lower left of the sample values (vulnerability curves, n = 34). The significance level is indicated with “*” if p < 0.05, “**” if p ≤ 0.01 and “***” if p ≤ 0.001.
P50P12P88P25WBDbrtr(tr/br)2bttt(tt/bt)2bt(t/b)2CF/mm
P50   0.91 **  0.98 ***  0.95 **−0.92 *  0.53−0.54−0.74  0.88 *−0.44−0.86 *  0.71−0.50−0.81 *−0.85 *
P12 0.86 ***   0.80  0.81 *−0.78  0.66−0.21−0.57 1.00 ***−0.05−0.58  0.84 *−0.13−0.60−0.93 **
P88 0.95 ***  0.68 ***   0.96 **−0.92 **  0.44−0.69−0.79  0.76−0.62−0.94 **  0.60−0.66−0.88 *−0.75
P25W  0.95 ***  0.78 ***  0.93 *** −0.83 *  0.29−0.59−0.64  0.76−0.54−0.86 *  0.50−0.57−0.76−0.78
BD−0.67 ***−0.41 *−0.74 ***−0.63 *** −0.50  0.50  0.74−0.77  0.44  0.83 *−0.65  0.47  0.80  0.74
br  0.47 **  0.38 *  0.47 **  0.31−0.47 ** −0.25−0.72  0.68  0.00−0.38  0.96 *−0.13−0.60−0.66
tr−0.38 *−0.15−0.49 **−0.38 *  0.30−0.28   0.82 *−0.14  0.96 **  0.88 *−0.23  0.99 **  0.87 **  0.26
(tr/br)2−0.51 ***−0.32−0.58 ***−0.39 **  0.48 ***−0.82 ***  0.76 *** −0.54  0.66  0.87 *−0.71  0.75  0.98 **  0.65
bt  0.64 ***  0.59 ***  0.59 ***  0.60 ***−0.48 **  0.52 **−0.01−0.33   0.02−0.53  0.86 *−0.06−0.55−0.93 **
tt−0.22  0.07−0.38−0.27  0.21−0.08  0.89 ***  0.57 ***  0.04   0.83 *  0.01  0.99 **  0.75  0.09
(tt/bt)2−0.54 ***−0.29−0.63 ***−0.55 ***  0.44 **−0.34 *  0.69 ***  0.63 ***−0.60 ***  0.76 *** −0.47  0.87 *  0.95 *  0.59
b  0.61 ***  0.52 ***  0.59 ***  0.49 **−0.54 ***  0.92 ***−0.20−0.72 ***  0.80 ***−0.05−0.51 ** −0.12−0.63−0.82 **
t−0.31−0.04−0.45−0.33  0.26−0.19  0.97 ***  0.69 ***  0.01  0.97 ***  0.75 ***−0.13   0.82 **  0.18
(t/b)2−0.59 ***−0.35 *−0.67 ***−0.52 ***  0.53 **−0.69 ***  0.79 ***  0.92 ***−0.52 **  0.71 ***  0.87 ***−0.71 ***  0.77 ***   0.64
CF/mm−0.46 **−0.42 *−0.44 **−0.48 ** 0.33 *−0.46 **−0.06 0.23−0.84 ***−0.03 0.46 ***−0.69 ***−0.05 0.38 *
Publisher’s Note: MDPI stays neutral with regard to jurisdictional claims in published maps and institutional affiliations.

