Article

Vegetation Determines Lake Sediment Carbon Accumulation during Holocene in the Forest–Steppe Ecotone in Northern China

1
School of Earth System Science, Institute of Surface-Earth System Science, Tianjin University, Tianjin 300072, China
2
School of Geography and Planning, Sun Yat-Sen University, Guangzhou 510275, China
3
Department of Biology and Environmental Science, Linnaeus University, SE-39182 Kalmar, Sweden
4
School of Environmental and Chemical Engineering, Foshan University, Foshan 528000, China
5
School of Environmental and Resource Sciences, Zhejiang A&F University, Hangzhou 311300, China
*
Author to whom correspondence should be addressed.
Forests 2021, 12(6), 696; https://doi.org/10.3390/f12060696
Submission received: 16 April 2021 / Revised: 20 May 2021 / Accepted: 27 May 2021 / Published: 28 May 2021

Abstract

:
To understand the past carbon accumulation of forest–steppe ecotone and to identify the main drivers of the long-term carbon dynamics, we selected Huangqihai Lake and analyzed the sediment records. We measured the organic carbon content (TOC; %) of sedimentary samples and quantified the carbon accumulation rate (CAR; g C m−2 yr−1). Furthermore, the climate, soil erosion, and vegetation development of the past 6800 years were reconstructed using physicochemical parameters and pollen records. Human activities were also obtained from a 2200-year history record. Our results showed that the CAR was high during 5800~4100 cal yr BP (40~60 g C m−2 yr−1), which is mainly attributed to the high sediment accumulation rate (SAR) during this period. Pearson’s correlation, redundancy analysis and hierarchical variation partitioning analyses suggested that the CAR was influenced by the SAR and TOC, while vegetation dynamics (broadleaved tree percentage and vegetation coverage) and local soil erosion were the main drivers of the TOC and SAR. Especially when the vegetation was dominated by broadleaved forests, the CAR was significantly high due to the high gross primary productivity and carbon density of forest compared with steppe. Our study highlights the direct influence of local vegetation and soil erosion on the CAR, whereas climate might influence indirectly by changing local vegetation and soil conditions. Moreover, our results showed that human activities had positive influences on the carbon accumulation dynamics in this region since 2200 cal yr BP by influencing the SAR.

1. Introduction

Global climate change caused by the rapid emission of carbon dioxide (CO2) and other greenhouse gases since the Industrial Revolution has attracted increasing public attention [1]. Although lakes cover only 2% of the Earth’s surface, they act as an important sink for carbonaceous matter, which is only partly mineralized in the water column [2,3,4], and thus play a significant role in regulating the global carbon cycle [5,6,7]. For instance, it is estimated that during the Holocene, lakes annually buried 42 Tg organic carbon (OC), which is more than two-fifths of the amount of organic carbon buried in the ocean (100 Tg OC yr−1) [8]. Furthermore, Dong et al. [9] suggested that lakes are 3.4 times more effective than terrestrial ecosystems in C burial. The lakes in China show high carbon sequestration potential (1.98 Tg OC yr−1) [10] and have buried in total about 8.0 ± 1.0 Pg OC since 12,000 cal yr BP, with an average carbon accumulation rate (CAR) of 7.7 ± 1.4 g OC m−2 yr−1 [11]. Especially during the mid-Holocene and late Holocene, the carbon storage was relatively high because of the changes of CARs and lake sizes [12,13]. Although many studies investigated carbon burial in different Holocene lakes in China [14,15,16,17], few of them attempted to provide detailed information on carbon deposition as well as its potential environmental and anthropogenic factors, such as the climate, vegetation dynamics and human activities [9,11].
The carbon dynamics in the forest–steppe ecotone of northern China could well provide a reference for the study of the influences of environmental changes, especially vegetation change. The vegetation in this region is sensitive to climate change because of its location at the margin of the Asian monsoon region [18,19,20]. Previous studies on lake sediments have demonstrated that the climate of eastern Inner Mongolia was relatively wet before 5000 cal yr BP, while climate drying afterwards first led to the replacement of broadleaved forest by pine forest [21,22]. The replacement of pine forest by steppe was primarily driven by climate drying during the late Holocene [19,23]. However, it is still not clear how these vegetation changes (boreal forest–broadleaved forest–steppe) influenced the CAR. Thus, we intend to understand the correlation between vegetation succession and carbon accumulation. Besides, global temperatures during the mid-Holocene were at least as warm as today [24], and it is critical to illustrate how climate affects burial efficiency in the context of anthropogenic global warming [3]. Therefore, understanding the processes of carbon accumulation and its drivers in these lakes may provide useful insights into the carbon dynamics of forest–steppe ecotone in the future [4,25,26].
This study focuses on carbon dynamics in the sediments of the Huangqihai Lake in forest–steppe ecotone of northern China and investigates their possible influencing factors, especially the vegetation change during the Holocene. This information will help us better predict how carbon dynamics in lake sediments will respond to future climate change, vegetation succession and human activities.

2. Study Areas and Methods

2.1. Study Site

Huangqihai Lake (40°47′–40°54′ N, 113°05′–113°23′ E) lies at the forest–steppe ecotone of southeastern Inner Mongolian Plateau (Figure 1a,b). The lake has a maximum length of 20 km, and a maximum width of 9 km, with a maximum surface area of about 110 km2 [20]. It has a drainage area of 4510 km2, with an average altitude of 1268 m [27]. The lake is mainly supplied by surface runoff, with 19 rivers flowing into the lake [20,27].
The study region, located between the semi-humid and semi-arid areas, is very sensitive to the variation of East Asian summer monsoon (EASM) [20]. The mean annual temperature (MAT) in this area is about 4.5 °C. The mean annual precipitation (MAP) and evaporation (MAE) are 372.2 mm and 1930 mm, respectively. About two-thirds of annual rainfall occurs during June to August [20,25,29]. The lake water area has greatly varied due to climate change and human activities in recent decades. It had even totally desiccated in 2008 [30].

2.2. Methods

2.2.1. Sampling

In January 2012, an 820 cm continuous sediment column (location 40°50′ N, 113°17′ E) was collected from the central part of the lake using a piston corer (UWITEC) [20]. The lithology and grain size compositions of the overlap layers showed that the two sections matched very well although cored by different sampling methods.

2.2.2. Chronological Model and Sediment Accumulation Rate (SAR)

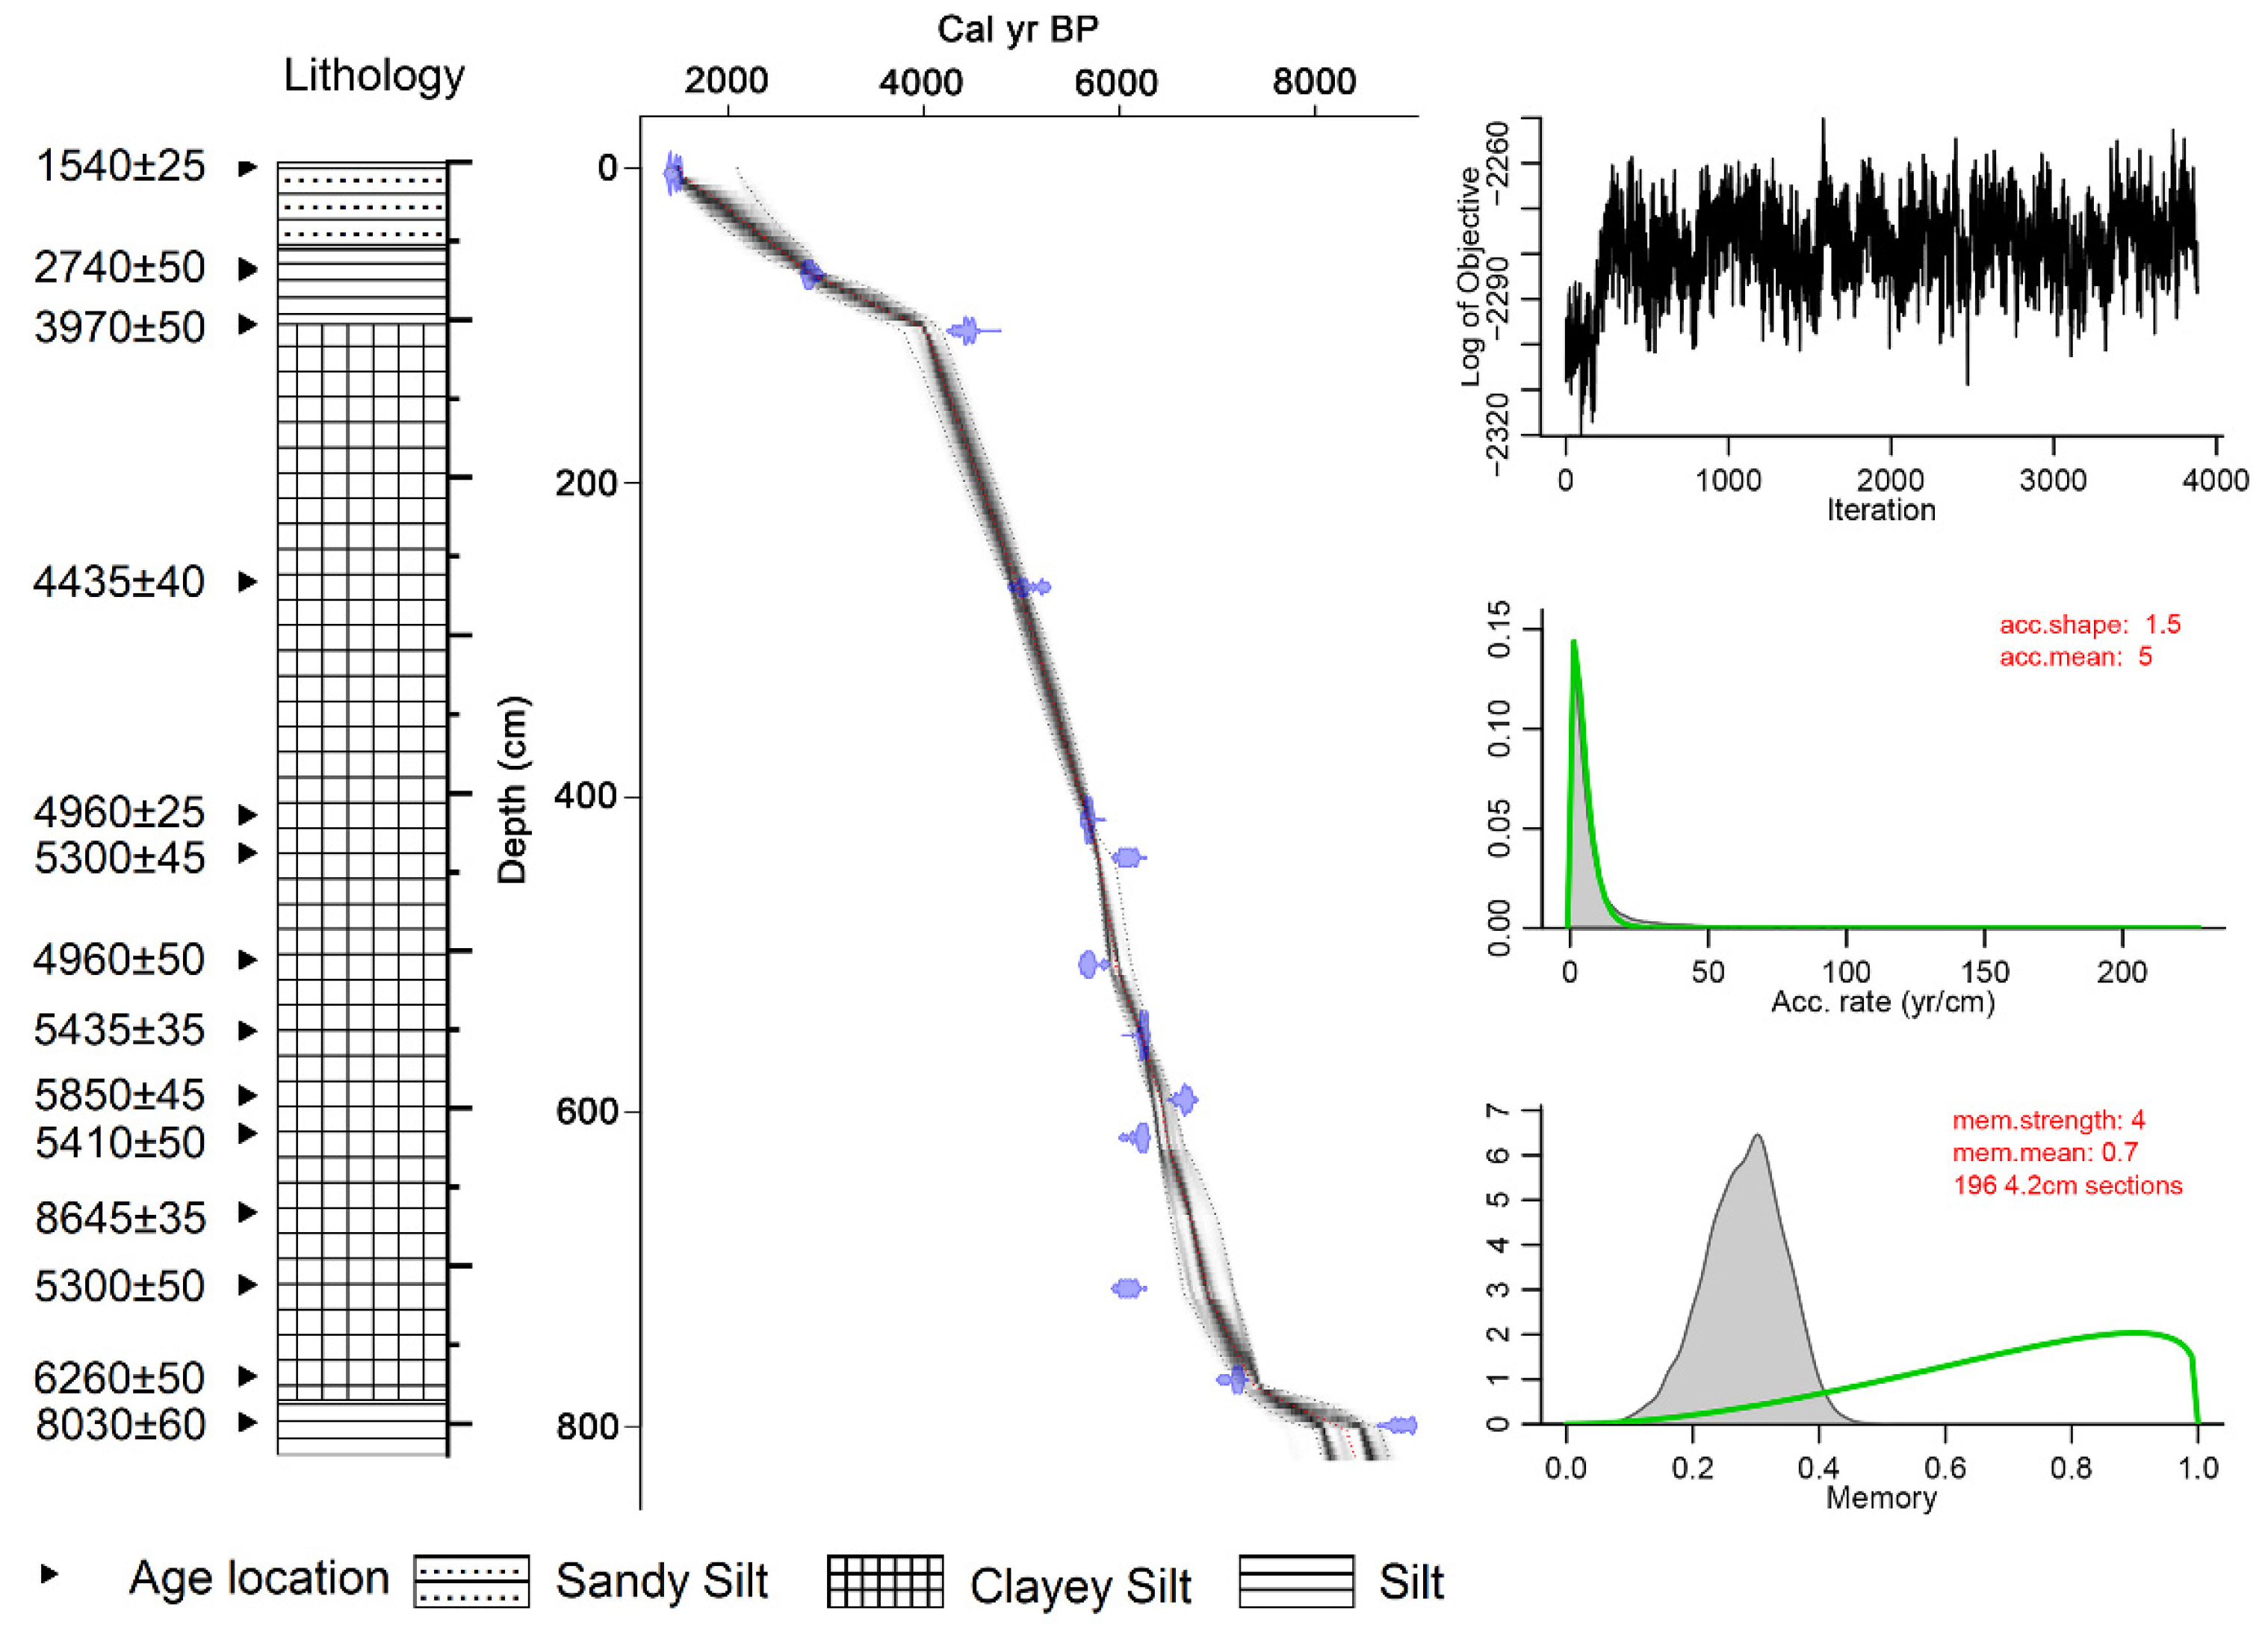
According to lithological characteristics, 15 bulk sediment samples were collected throughout the sediment column and dated by accelerated mass spectrometry (AMS) in the AMS Laboratory of Peking University [20]. We reconstructed a Bayesian depth–age model with Bacon (Figure 2) [31,32]. As the measured age of the 0 cm for the core was 1511 cal yr BP (before 1950), we suggested 1573 years as a possible reservoir effect (sum of 1511 years and the difference between 2012 and 1950) assuming that the lake surface was the drilling age (2012 AD). 137Cs and 210Pb were measured in the Chinese Academy of Agricultural Sciences. Though the results of 137Cs and 210Pb did not illustrate the accurate year because of limited sample numbers (Table S1), the results suggested that the 0~10 cm was deposited during the last 100 years and the lake surface did not have obvious denudation.
Based on the depth–age model, sediment accumulation rate (SAR; mm yr−1) for the sediment column was calculated (Equation (1)):
SAR = Depth range/Age range.

2.2.3. Carbon Accumulation Rate (CAR)

Total carbon (TC) and total nitrogen (TN) were measured using an Elementar Vario EL (Elementar Analysensysteme GmbH, Hanau, Germany). To obtain TOC (total organic carbon), total inorganic carbon (TIC) was derived from the change of sample weight after adding sufficient 2 M HCl. The TOC was calculated by subtracting TIC from TC [20]. The organic carbon accumulation rate (CAR; g C m−2 yr−1) was calculated using TOC (%), dry bulk density (DBD; g cm−3) and SAR (mm yr−1) (Equation (2)) [11]:
CAR = (SAR × TOC × DBD) × 10.
The DBD was calculated with TOC based on the following formula (Equations (3) and (4)) [33]:
When TOC > 6%, DBD = 1.665 × (TOC)−0.887;
When TOC ≤ 6%, DBD = 1.776 − 0.363 × ln(10 × TOC).
Since TOC contents in the sediment of Huangqihai Lake are all below 6%, the DBD was calculated using Equation (4).

2.2.4. Proxies of Climate, Vegetation and Soil Changes

Lakes not only bury OC but also mineralize considerable amounts of OC [6,34]. Thus, the OC burial efficiency in lakes and the CAR in lake sediments are controlled by the balance between OC input and decay loss that can be influenced by many factors, including environmental variables (e.g., precipitation, temperature, and soil), vegetation (aquatic plant and surrounding terrestrial vegetation), and lake properties (e.g., lake size, lake shape, and hydrological changes) [3,35,36]. To illustrate the main factors influencing the carbon dynamics, we collected parameters to denote the climate change, soil erosion, vegetation dynamics and human activities as described below.
We used the δ18O of Dongge Cave, Hulu Cave, and Sanbao Cave to indicate the climate change, especially the precipitation change (Figure 1a) [37,38,39]. Liu et al. [40] found that the rainfall in northern China and the δ18O in Dongge Cave were significantly correlated. At the same time, we collected the temperature data, which was synthetically reconstructed based on 45 previous references and records, including pollen, archaeology and plant fossils [41]. The history records, such as human population and grain yield grade, were used to denote human activities [42].
The vegetation dynamics during the past 6833 years were revealed by pollen assembly. Here, we report the pollen percentages of total arboreal plants (AP), including coniferous trees and broadleaved trees. The ratio of AP to NAP (AP/NAP) was used to represent the changes between forest and steppe [20,43,44]. The pollen percentage of coniferous and broadleaved trees could be used to indicate the dominating forest type. The vegetation coverage was displayed by pollen concentration assuming pollen has not been lost due to decay because the pollen grains did not show obvious corrosion.
The grain size and magnetic susceptibility of sediment samples could be used as indicators of soil erosion [45,46]. The grain size of sediment samples was measured by a previous study using a Malvern Master-size 2000 (Malvern Instruments Ltd., Worcestershire, United Kingdom) [20]. Grain size distribution (mass%) is presented as the cumulative percentages of three size fractions: clay (<2 μm), silt (2~63 μm) and sand (>63 μm). We used the sand/non-sand ratio and mean grain size (D (3, 2)) to indicate the soil erosion intensity. Low- and high-frequency magnetic susceptibility (χlf and χhf) were measured at 0.47 kHz and 4.7 kHz using a Bartington MS2 Meter and a MS2B Dual Frequency Sensor (Wang et al., unpublished data). Although the interpretation about magnetic susceptibility was not consistent, we used it as an indicator of soil erosion, mainly caused by the high precipitation (surface runoff) in our study region [47,48].
Besides, we also measured the element contents of sediment from Huangqihai Lake, by X-ray fluorescence spectroscopy (ADVANT XP+), including K2O, Na2O, CaO, MgO, Fe2O3, MnO, TiO2 and Al2O3 (Figure S1). The element ratios were calculated to indicate the chemical weathering [49,50], such as (CaO + MgO + Na2O)/TiO2, (CaO + MgO + Na2O)/Al2O3, Na/Al, Ca/Al and Mn/Al (Figure S2). Because of the close relationships of these ratios, we just used (CaO + MgO + Na2O)/TiO2 and Na/Al as indicators.
To compare with other lakes in this region, we also collected the chronological model, TOC and pollen records of the other four lakes from published papers (Anguli Nuur, Daihai, Qigai Nuur and Yanhaizi Lake; Figure 1a). As other environmental parameters, such as grain size or magnetic susceptibility, were not tested or shown in these papers, we only collected their pollen records for a comparison [21,51,52,53]. The depth–age models of these lakes were also reconstructed by Bacon [32].

2.2.5. Data Analysis

The means of all these parameters mentioned above and CAR were calculated at 200-year intervals. The correlations among possible influencing factors (precipitation, temperature, vegetation, soil erosion and human activities) were examined using Pearson’s correlation coefficients, which made clear the relationships among these influencing factors. The correlations between these possible influencing factors and CAR were also calculated using Pearson’s correlation coefficients. Then, we removed the factors with no significant relationships with CAR and performed redundancy analysis (RDA) and hierarchical variation partitioning (HP) in R with the data of 200-year intervals to find the main driving factors. These methods could determine the independent contribution of each factor and partly effectively solve the problem of multicollinearity. Besides, all these original data were calculated in R with the BINCOR package to ignore time series autocorrelation [54]. This method is also available for such uneven time series as our original data. For the other four lakes, SAR, CAR and vegetation parameters were calculated at 1000-year intervals since the dating and sampling resolutions were relatively low compared with those of Huangqihai Lake (Figure 1b).

3. Results

3.1. Temporal Variations of the SAR and CAR

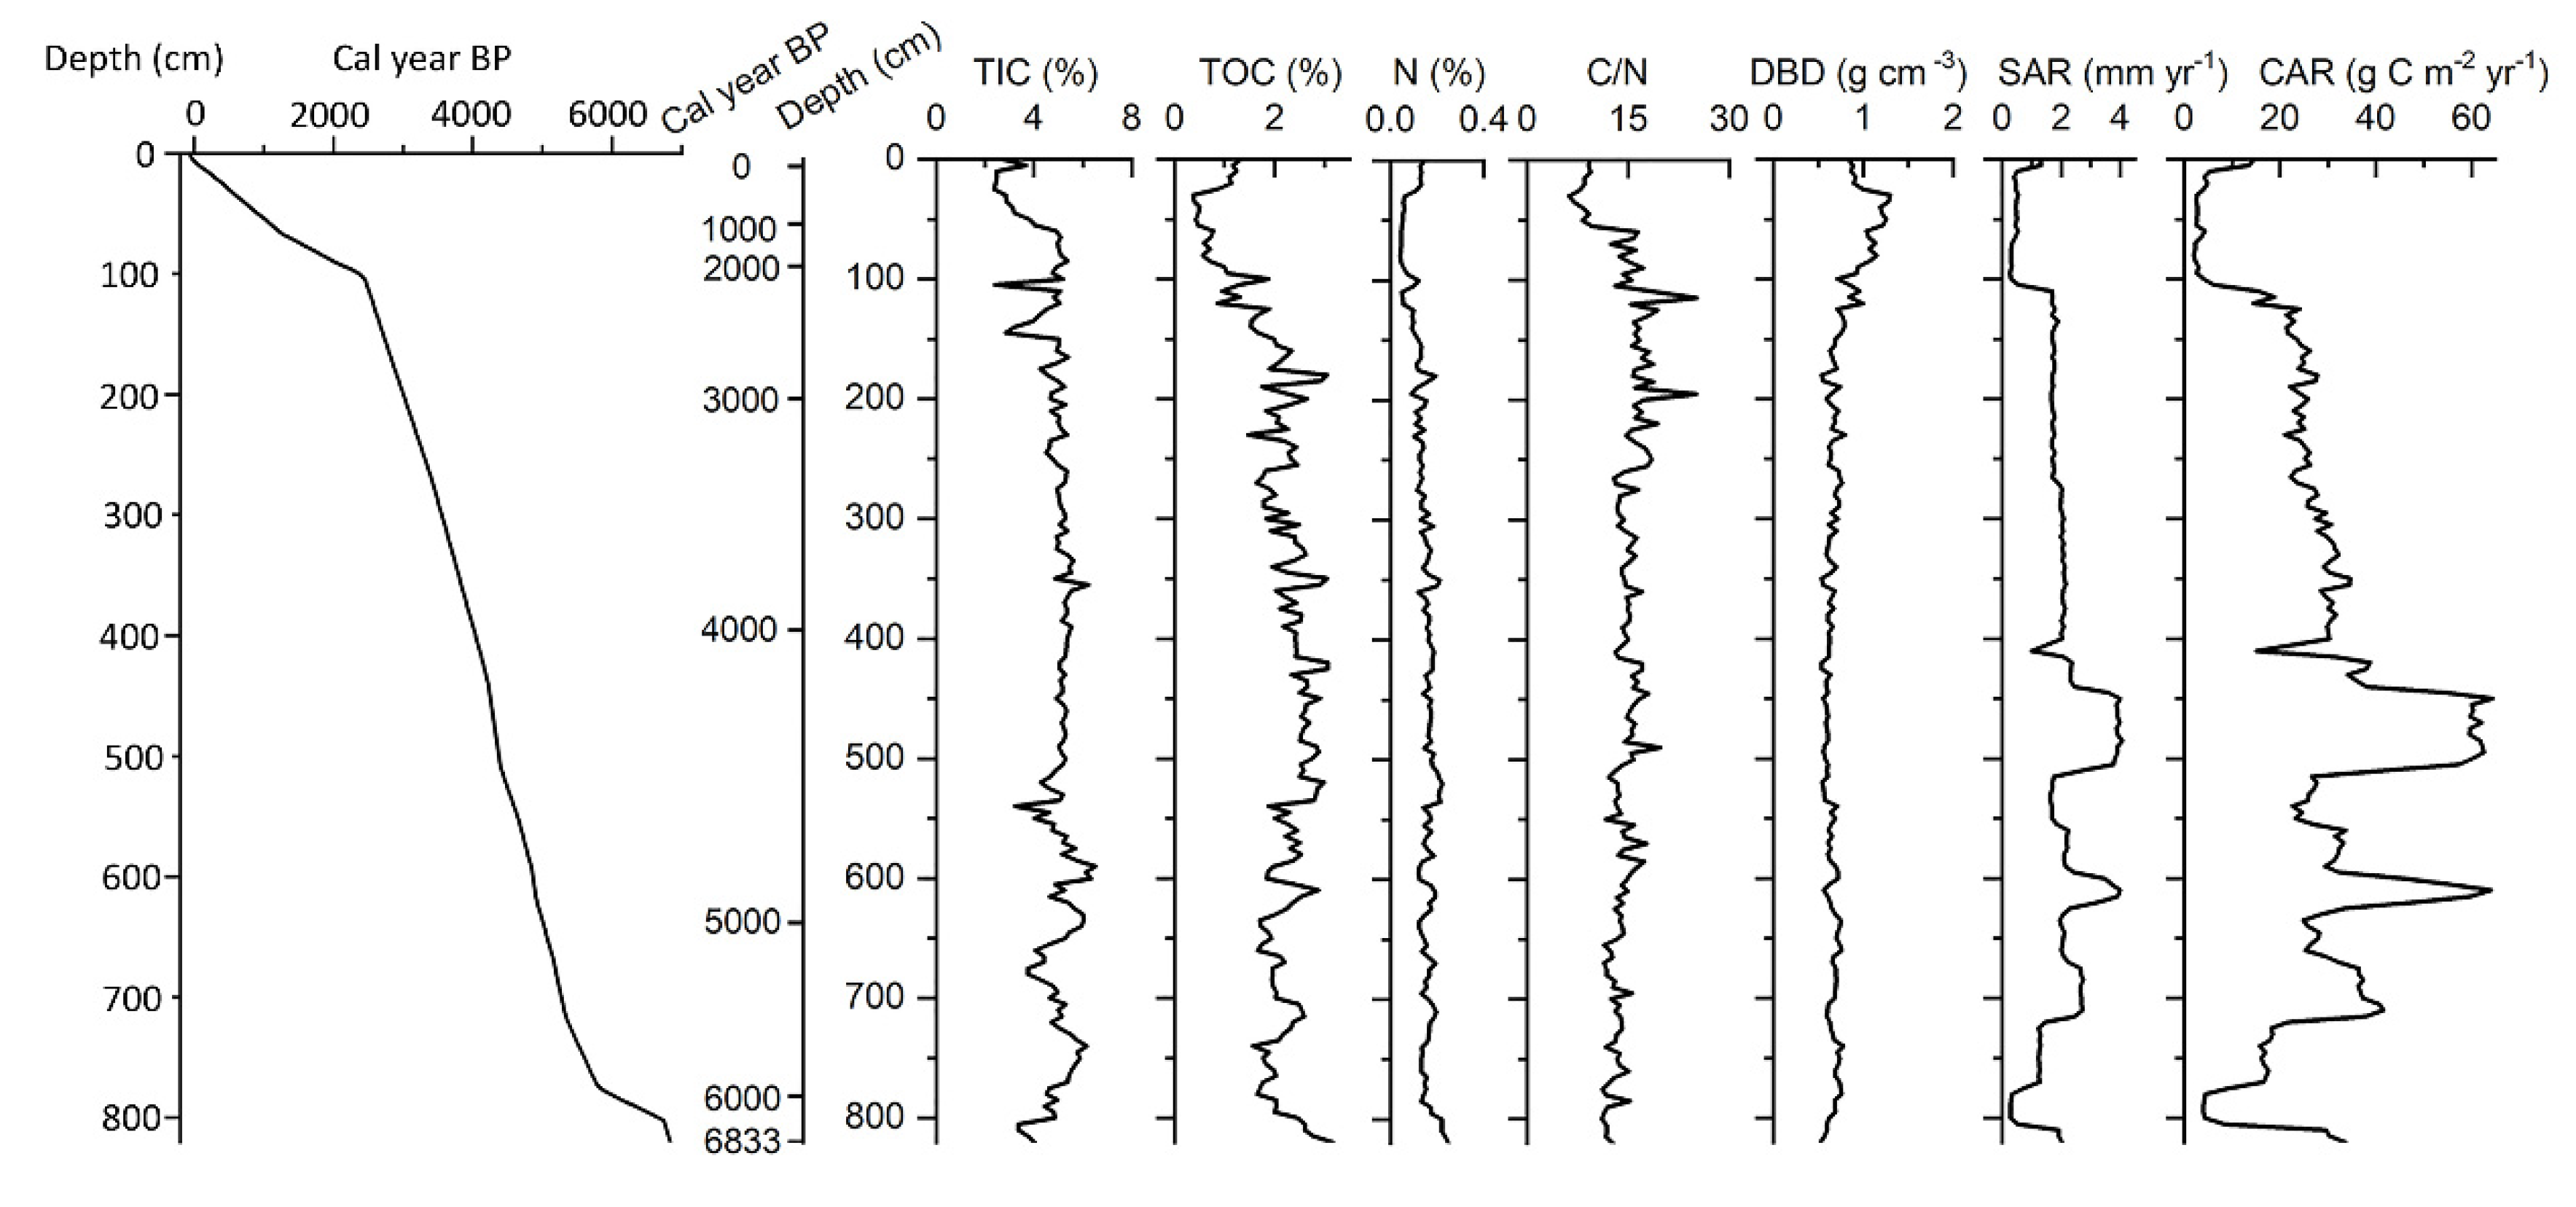
Generally, CAR has displayed a significant temporal variability during the past 6833 years (Figure 3). Since SAR varied more significantly than TOC, the temporal variation of CAR overall followed that of SAR. The values of CAR and SAR were low from 6833 to about 5800 cal yr BP, and thereafter increased greatly (>1.2 mm yr−1 and >15 g C m−2 yr−1, respectively) and remained at high levels until 4100 cal yr BP with great variations, after which the values decreased sharply from 4.07 to 1.00 mm yr−1 and from about 64.3 to 30.3 g C m−2 yr−1, respectively. During the period from 4100 to 3100 cal yr BP, the CAR still kept relatively high at about 30 g C m−2 yr−1. During the period from 2100 cal yr BP to the present, the TIC, TOC, and TN contents decreased compared with those of the previous period, but these drops were smaller compared with SAR and CAR, which showed a sharp decline. After 400 cal yr BP, the CAR increased a little due to the increase of TOC.

3.2. Contributions of the Abiotic and Biotic Factors to CAR Dynamics

Among these selected climate/environmental variables (Table 1), temperature anomaly and precipitation indicated by δ18O of caves had a close relationship (p < 0.01), and these two climate factors were both related with broadleaved tree percentage and element ratios. Pollen concentration, as another vegetation indicator, was also correlated with broadleaved tree percentage. These two vegetation indicators showed significant relationships with AP/NAP and coniferous tree percentage (p < 0.01), but the correlation was negative. Although the three soil erosion proxies (grain size, magnetic susceptibility and element ratio) had some relevance, they did not show similar correlations with climate or vegetation proxies. For example, temperature had negative relationships with sand/non-sand, but positive relationships with element ratios. The δ18O only showed positive relationships with element ratios, but not with grain size and magnetic susceptibility.
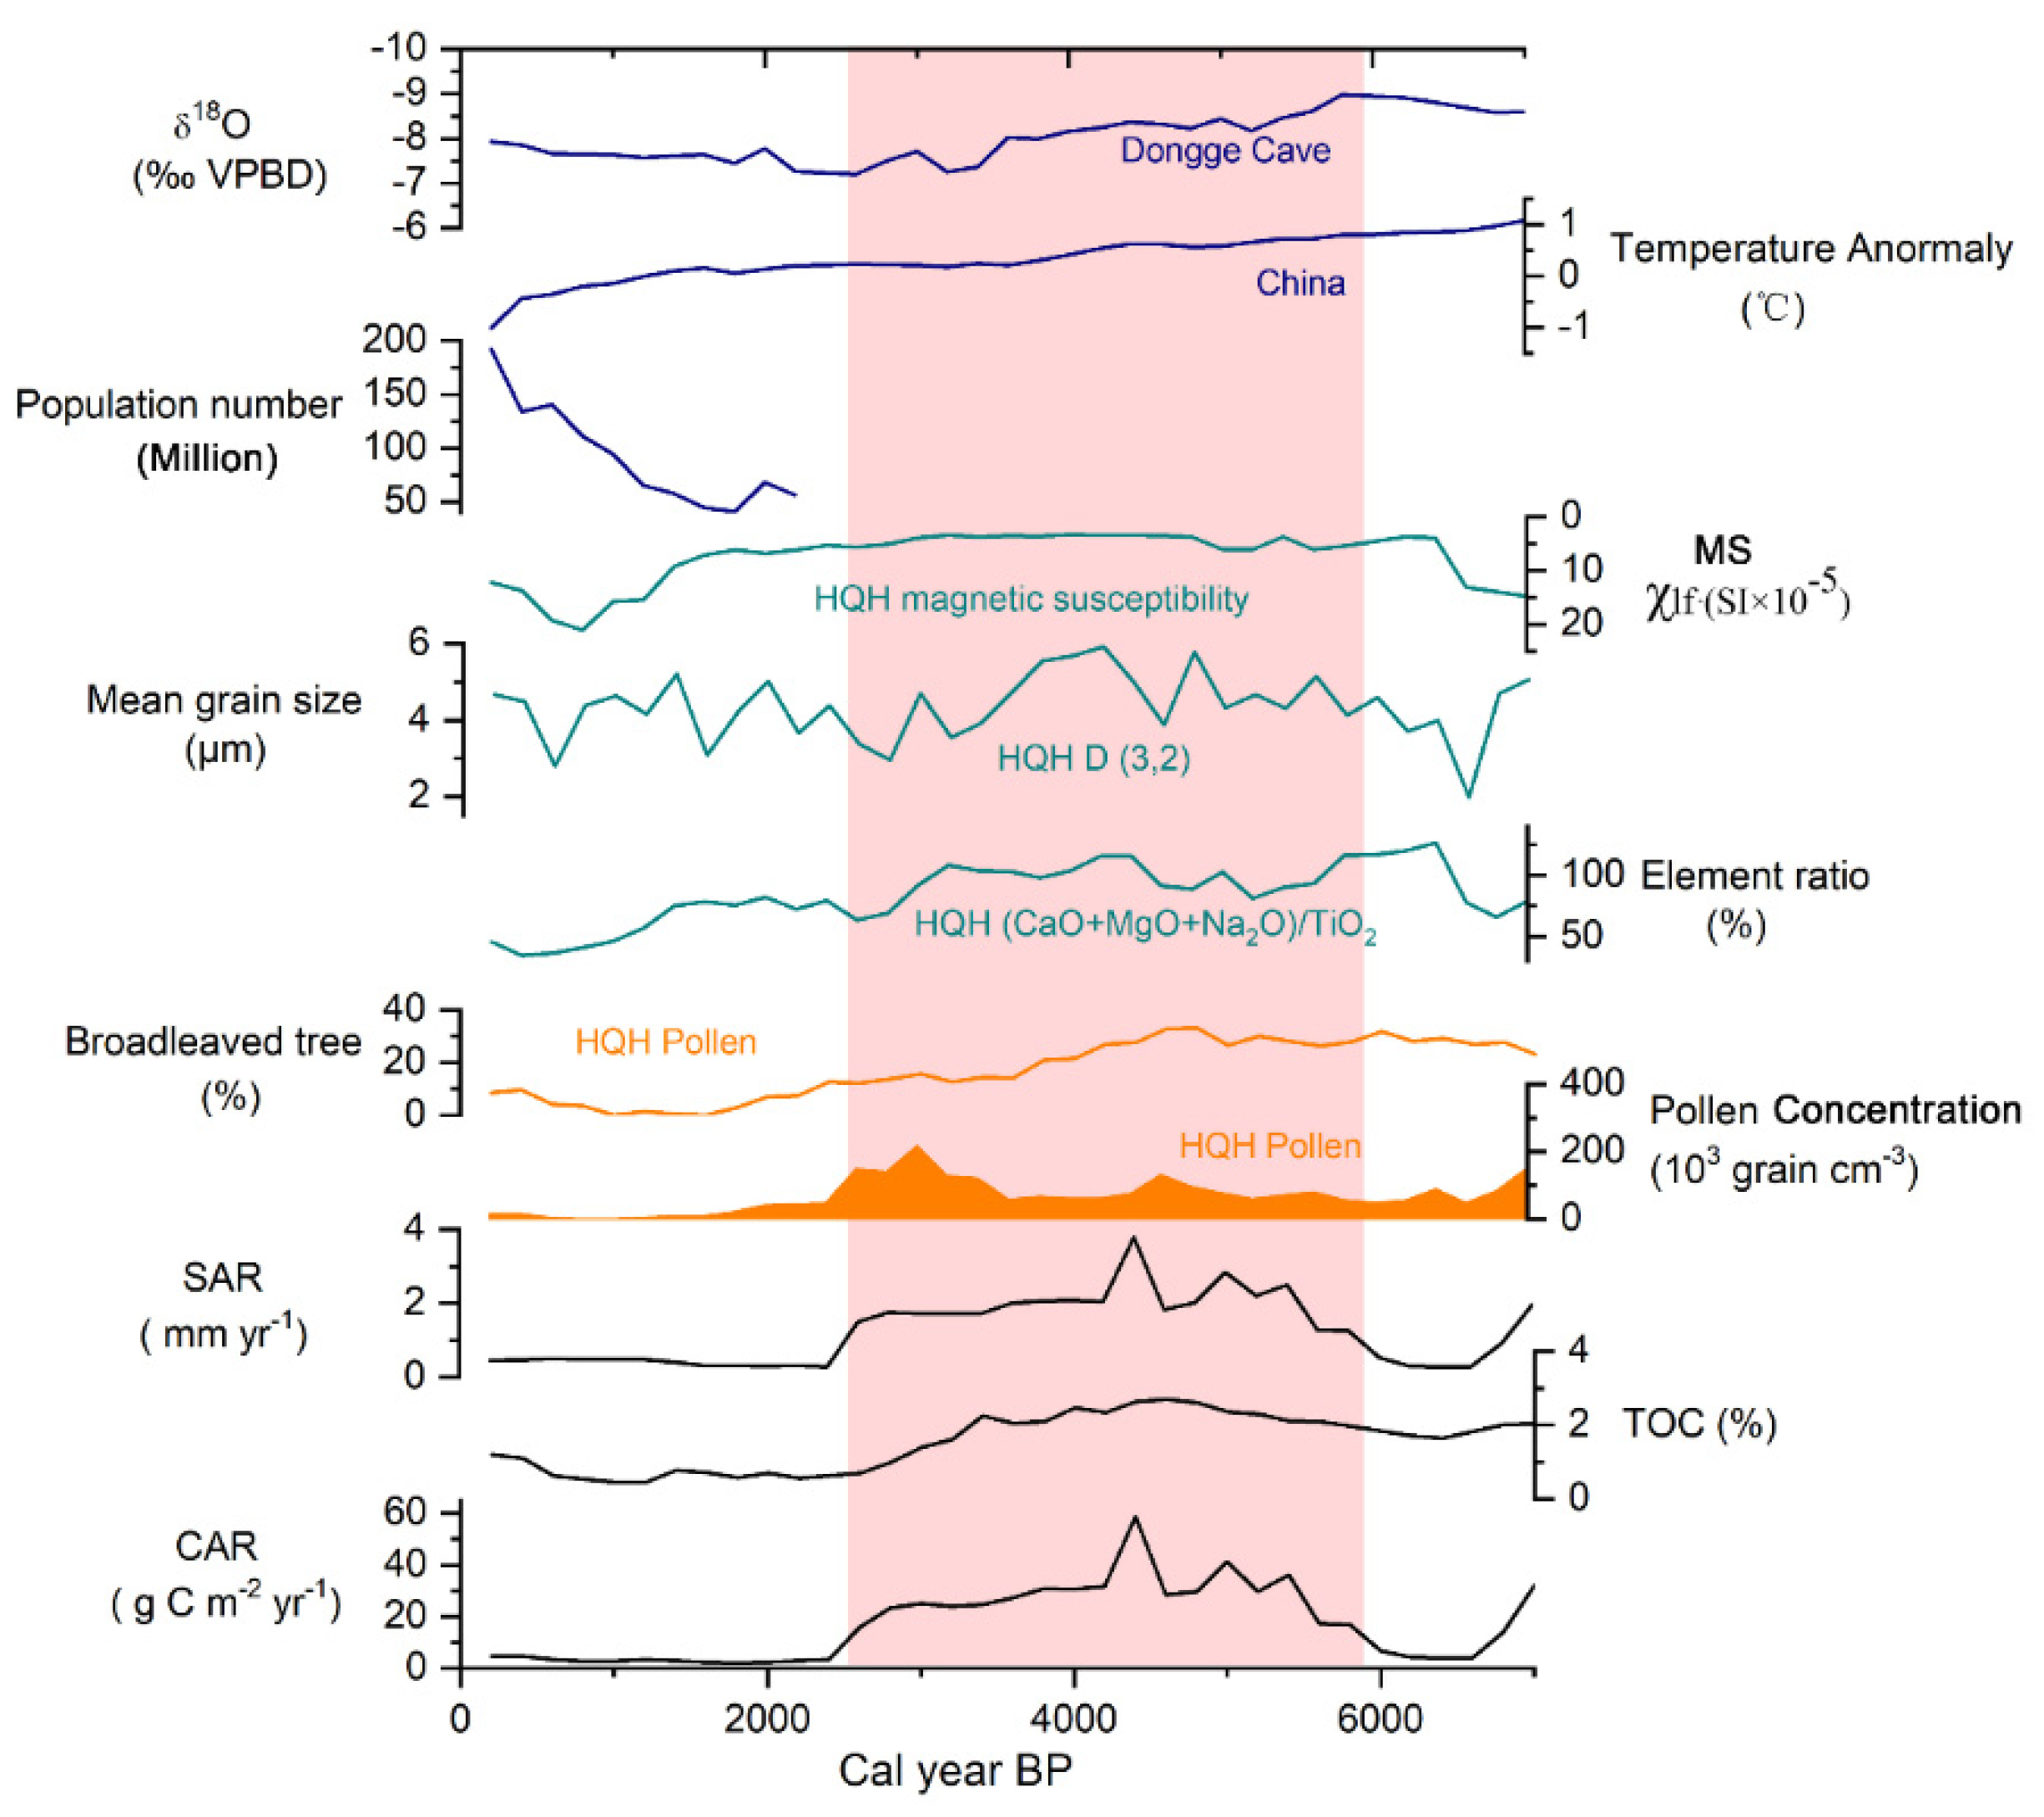
Based on Pearson’s relationships (Table 2), climate, soil erosion, and vegetation all had significant relationships with TOC, SAR, and CAR, especially the pollen concentration, broadleaved tree percentages, element ratio ((CaO + MgO + Na2O)/TiO2) and magnetic susceptibility (p < 0.01; Table 2; Figure 4). However, the RDA indicated that the broadleaved tree percentages, pollen concentration and mean grain size all had significant influences on TOC, SAR and CAR (Figure 5a,b), which contributed 9%, 10.8%, and 7.4%, respectively. According to the HP results, the major influencing factors for TOC, SAR, and CAR were mainly pollen concentration, broadleaved tree percentage, and mean grain size, too, in which the independent effects were all beyond 15%, except the mean grain size to TOC (Figure 5c). Generally, the climate and vegetation parameters had highly independent effects on TOC, while soil erosion parameters had highly independent effects on SAR. Besides, the BINCOR results indicated that only the pollen concentration had a significant relationship with CAR (p < 0.01; Figure S3).

4. Discussion

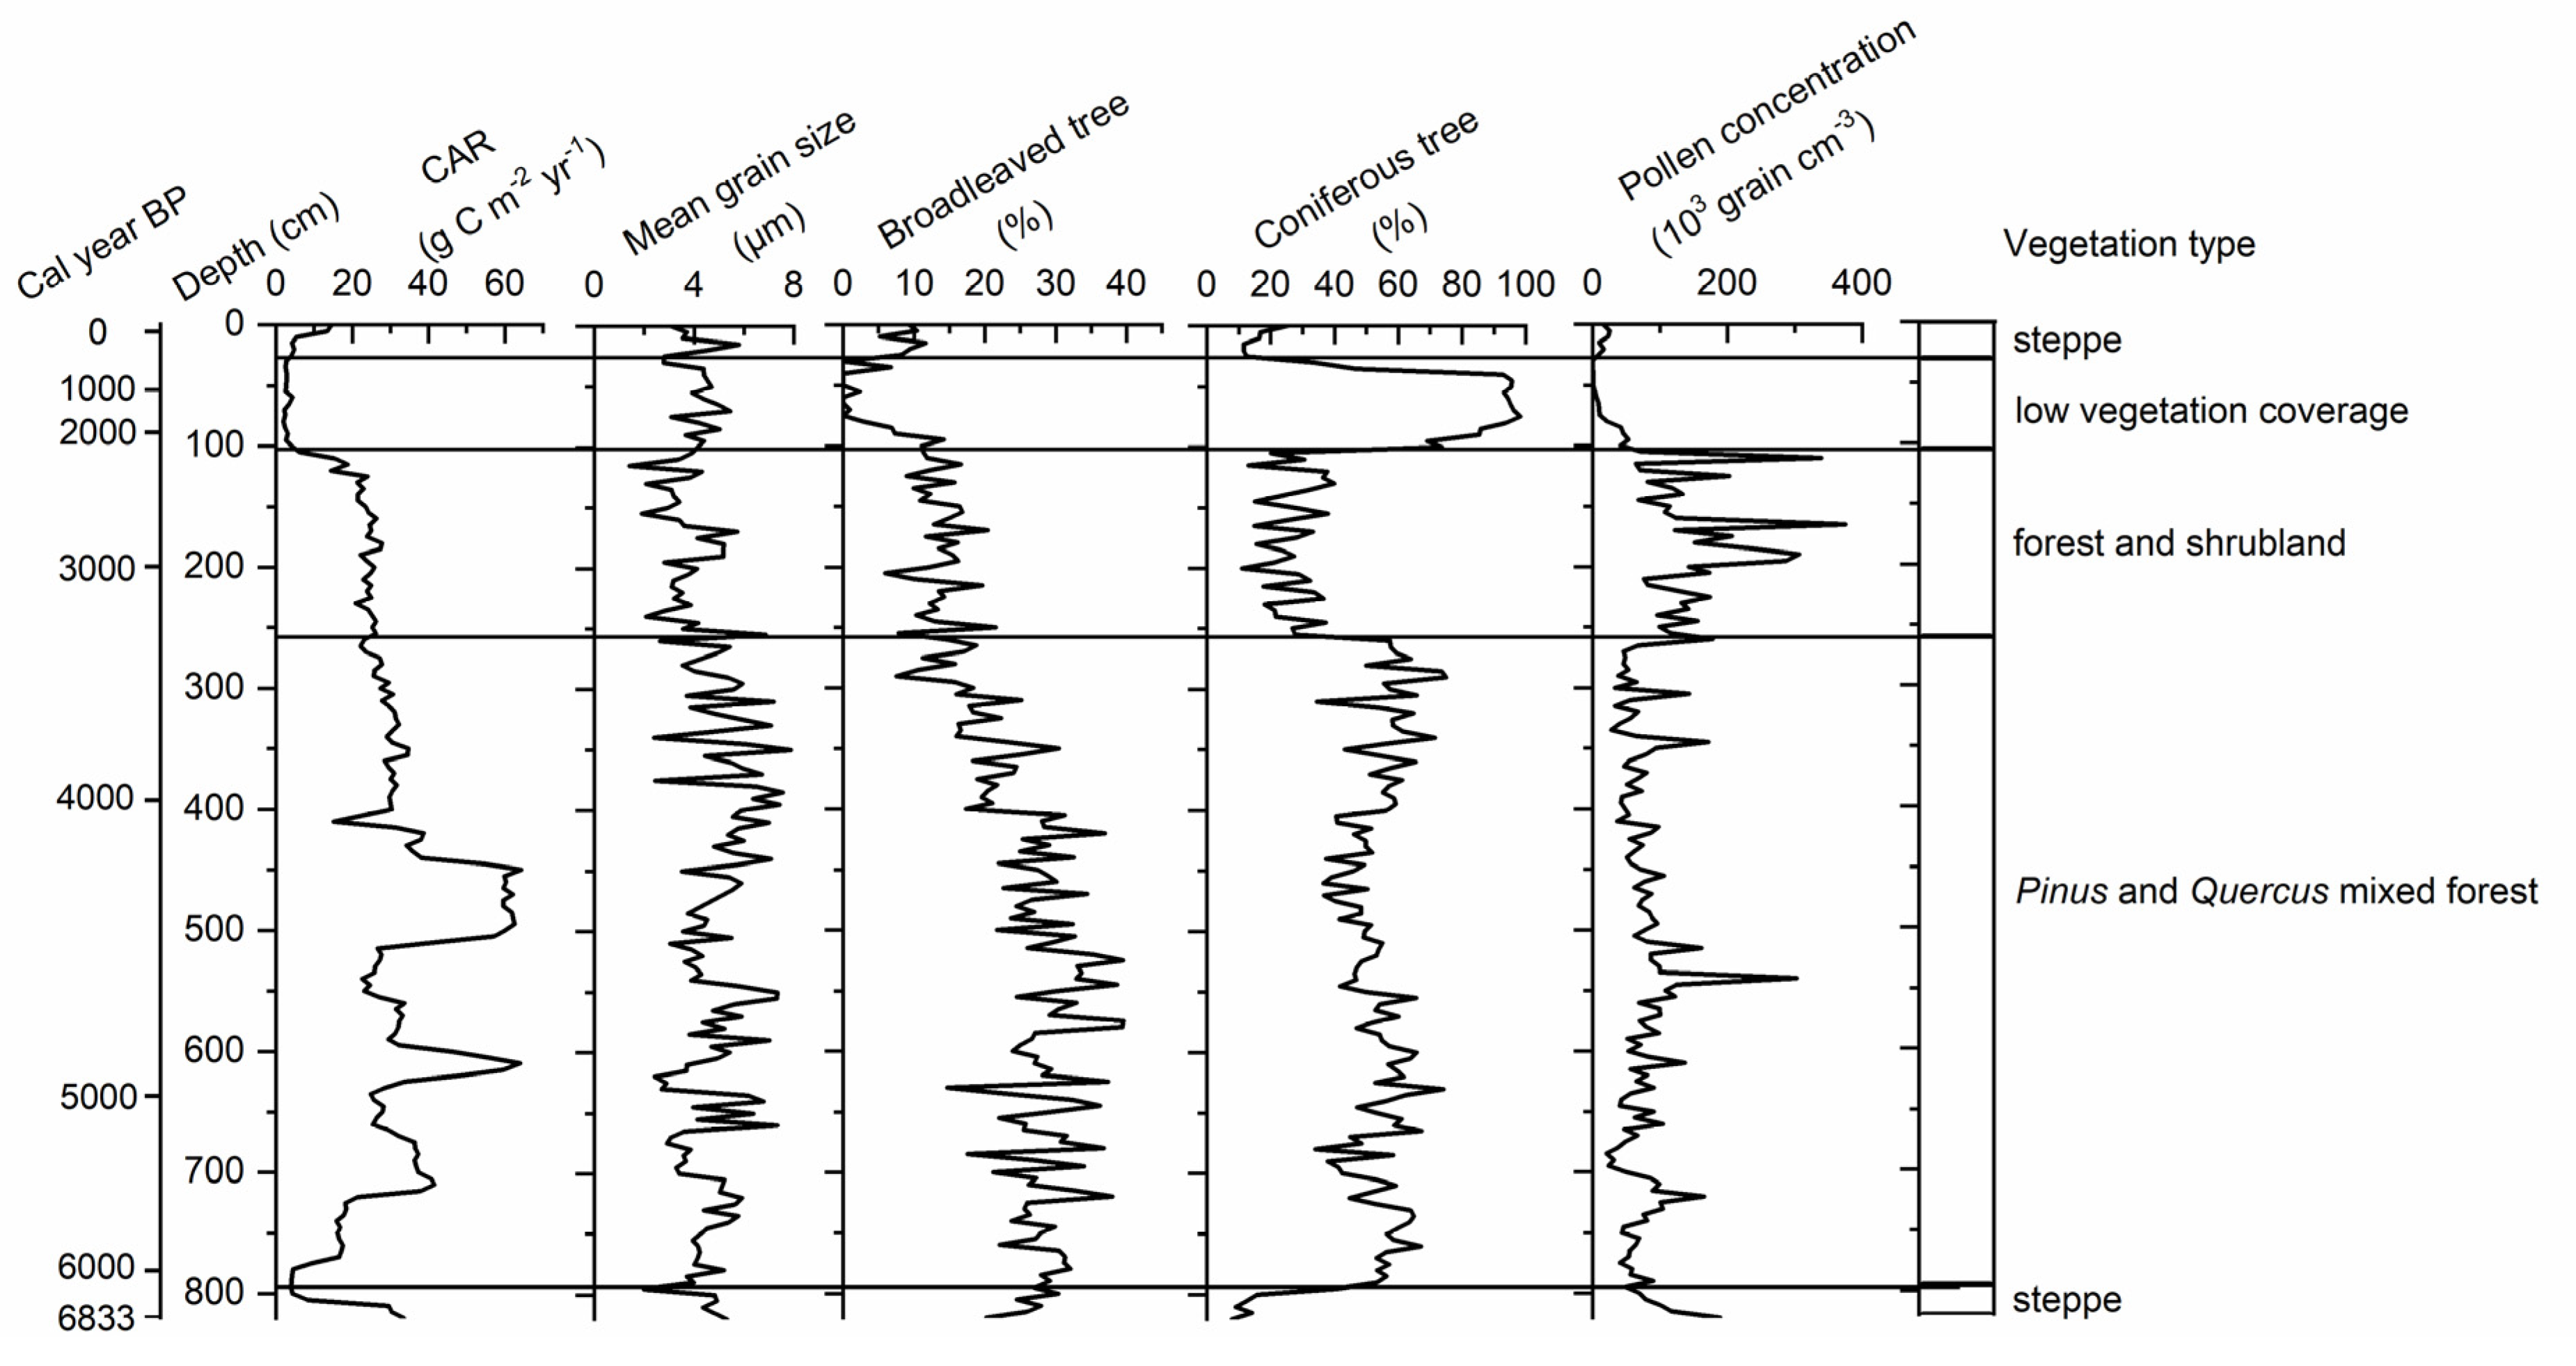
This study showed that local vegetation and soil erosion were important determinants for burial carbon accumulation, as reflected by the significant relationships of vegetation parameters and soil mean grain size with TOC, CAR, and SAR (Table 2; Figure 4 and Figure 5). In addition, SAR was the most significant factor in determining the CAR trends compared with TOC (Figure 3 and Figure 5a). The SAR is mainly influenced by the mass of input matter. When the surrounding vegetation has high primary productivity, the input of matter and OC would be high [6]. The significant increment in CAR from about 6000 to 5000 cal yr BP was consistent with the increased arboreal ratios and grain size (Figure 6). When the forest dominated during about 5800~2700 cal yr BP, the CAR was high because of significantly higher soil organic carbon densities and gross primary productivity (GPP) in the forest, especially the broadleaved forest, than those in the steppe [15,28,55] (Figure 1c), which were closely related with TOC and SAR. The CAR dynamics was consistent with the broadleaved tree and vegetation coverage (Figure 4 and Figure 6), though it did not display significant correlation with AP/NAP or coniferous tree percentage (Table 2), which was caused by the sudden increase of Pinus pollen percentage during 2400–600 cal yr BP [20] (Figure 6). The AP was high during this period, but the tree cover was extremely low with low input TOC. At the same time, enhanced soil erosion caused by high precipitation could lead to high SAR values during 5800~2700 cal yr BP (Figure 4). During the high vegetation coverage and tree percentage period, the river and lake levels are relatively high (always referred from pollen records; [56,57]), which means that the river could bring more TOC into the lake. This kind of hydrological effect should not be overlooked. For example, the Quistococha Lake under the strong influence of the Amazon River had the highest sedimentation rates (mean 0.5 cm yr−1) between about 6100 and 4900 cal yr BP [58]. The sharp decline in CAR since about 2100 cal yr BP was also consistent with the decreased broadleaved tree ratio and vegetation coverage (Figure 6). Therefore, vegetation and soil erosion are the direct factors in determining sediment carbon dynamics in Huangqihai Lake.
Similar to other lakes in the forest–-steppe ecotone, such as Daihai and Anguli Nuur (Figure 1b), the high CAR in Huangqihai Lake appeared in the mid-Holocene characterized by relatively flourishing vegetation (dominated by forest) as indicated by the high pollen densities and percentage of trees [19,20,21,23,52]. However, sediment accumulation is not uniform in space [6] and there still exist some lakes with relatively low CAR in the mid-Holocene compared with the early and late Holocene (e.g., Qigai Nuur, Yanhaizi; [51,53]; Figure 1). These lakes are all distributed in the west of Huangqihai Lake with high evaporation in the mid-Holocene, leading to relatively low vegetation coverage [53,59,60,61]. This also suggests that vegetation is the direct factor influencing CAR, and productivity might be more important than decomposition in long-term carbon accumulation [2]. Compared with the forest–steppe ecotone of the other regions, the TOC is also high during 6000~4000 cal yr BP along with high AP percentages in southern Siberia, while the CAR reached a peak during the early Holocene for the melting permafrost and retreating glaciers [4], which did not happen in our study region. In Europe, the CAR also increased between 5000 and 2000 cal yr BP [5].
The results of this study suggested that CAR in the forest–steppe ecotone had low correlation with climate change as indicated by the RDA and HP (Figure 5). The changing trends of climate parameters also did not show similar trends with CAR (Figure 4). As mentioned above, the surrounding vegetation was the direct factor influencing the CAR (Figure 5). At the same time, the vegetation change of Huangqihai did not respond to climate change timely because of the resistance of vegetation [20]. From the typical sedimentary core of Huangqihai, although the overall forest was replaced by steppe with climate drying, previous research found two other response patterns: increasing shrubs (3300~2300 cal yr BP) and low forest coverage (2300~600 cal yr BP) (Figure 6), implying that the climate determines the CAR, mainly through affecting vegetation type and coverage. In the future, the expansion of drylands [62] might lead to vegetation change and this would reduce carbon sequestration in the study area.
Human activities, such as lake eutrophication, land-use change and agriculture, enhance OC burial in lakes [7,63]. Human activities show close positive relationships with CAR in our study by Pearson’s correlation (Table 2), demonstrating that human activities have positive effects on CAR in lake sediments. The BINCOR result did not show the same correlation, which might be caused by the low data resolution of our records. Besides, previous studies suggested that agriculture has enhanced CAR only since about 200 years ago in our study area [19,64,65]. In summary, we conclude that vegetation and soil erosion are the most important drivers of carbon accumulation rates over millennial timescales.
However, it is still hard to distinguish the carbon sources totally based on our data. The TOC in the lake sediments is a mixture of terrestrial and aquatic sources. Though many works try to distinguish these two sources by measuring C, N, and δ13C and constructing models [66,67,68], we are unable to estimate the relative contribution of terrestrial and aquatic sources in our study by C/N. However, the main source might change from arboreal plants to non-arboreal plants or aquatic plants because of the sharp decrease of C/N since about 1000 cal yr BP (Figure 3). The C/N of non-arboreal plants and aquatic plants was relatively lower than that of terrestrial plants [67]. This shift also suggested that the vegetation type is important for carbon dynamics of lake sediments.

5. Conclusions

The TOC, SAR, and CAR values were all high during 5800~2700 cal yr BP at Huangqihai located in the forest–steppe ecotone in northern China. The vegetation and soil erosion exerted a direct impact on carbon accumulation in the sediment, especially the vegetation coverage and broadleaved forest. The vegetation dynamics influenced the CAR significantly because of various carbon density and GPP for different vegetation types. Our study implies that the replacement of forest by steppe along with future climate drying and accelerated dryland expansion in the study area might reduce carbon accumulation.

Supplementary Materials

The following are available online at https://www.mdpi.com/article/10.3390/f12060696/s1: Figure S1: Chemical element composition (%) change in the sediment of the Huangqihai Lake profile; Figure S2: Chemical element ratios change in the sediment of the Huangqihai Lake profile; Figure S3: Binned correlation of Huangqihai Lake pollen density and CAR by BINCOR; Table S1: 210Pb and 137Cs of Huangqihai Lake.

Author Contributions

Methodology, Q.H. and S.Y.; software, Q.H.; validation, Z.S., Z.W., C.Y. and H.W.; data curation, Q.H. and S.Y.; writing—original draft preparation, Q.H.; writing—review and editing, Q.H., S.Y., Z.W., C.Y. and H.W.; supervision, Z.S. All authors have read and agreed to the published version of the manuscript.

Funding

This research was funded by the National Natural Science Foundation of China, grant numbers 41701049, 41930862, and 41571130042; and the State’s Key Project of Research and Development Plan of China, grant numbers 2016YFA0601002 and 2017YFC0212700.

Conflicts of Interest

The authors declare no conflict of interest.

References

  1. IPCC. Climate Change 2014: Impacts, Adaptation, and Vulnerability. Part A: Global and Sectoral Aspects. Contribution of Working Group II to the Fifth Assessment Report of the Intergovernmental Panel on Climate Change; Cambridge University Press: Cambridge, UK; New York, NY, USA, 2014. [Google Scholar]
  2. Charman, D.J.; Amesbury, M.J.; Hinchliffe, W.; Hughes, P.D.M.; Mallon, G.; Blake, W.H.; Daley, T.J.; Gallego-Sala, A.V.; Mauquoy, D. Drivers of Holocene peatland carbon accumulation across a climate gradient in northeastern North America. Quat. Sci. Rev. 2015, 121, 110–119. [Google Scholar] [CrossRef] [Green Version]
  3. Heathcote, A.J.; Anderson, N.J.; Prairie, Y.T.; Engstrom, D.R.; del Giorgio, P.A. Large increases in carbon burial in northern lakes during the Anthropocene. Nat. Commun. 2015, 6, 10016. [Google Scholar] [CrossRef] [Green Version]
  4. Mackay, A.W.; Seddon, A.W.; Leng, M.J.; Heumann, G.; Morley, D.W.; Piotrowska, N.; Rioual, P.; Roberts, S.; Swann, G.E.A. Holocene carbon dynamics at the forest-steppe ecotone of southern Siberia. Glob. Chang. Biol. 2017, 23, 1942–1960. [Google Scholar] [CrossRef] [PubMed] [Green Version]
  5. Kastowski, M.; Hinderer, M.; Vecsei, A. Long-term carbon burial in European lakes: Analysis and estimate. Glob. Biogeochem. Cycles 2011, 25, GB3019. [Google Scholar] [CrossRef]
  6. Anderson, N.J.; D’Andrea, W.; Fritz, S.C. Holocene carbon burial by lakes in SW Greenland. Glob. Chang. Biol. 2009, 15, 2590–2598. [Google Scholar] [CrossRef]
  7. Anderson, N.J.; Bennion, H.; Lotter, A.F. Lake eutrophication and its implications for organic carbon sequestration in Europe. Glob. Chang. Biol. 2014, 20, 2741–2751. [Google Scholar] [CrossRef] [PubMed] [Green Version]
  8. Dean, W.E.; Gorham, E. Magnitude and significance of carbon burial in lakes, reservoirs and peatlands. Geology 1998, 26, 535–538. [Google Scholar] [CrossRef] [Green Version]
  9. Dong, X.; Anderson, N.J.; Yang, X.; Xu, C.; Ji, S. Carbon burial by shallow lakes on the Yangtze floodplain and its relevance to regional carbon sequestration. Glob. Chang. Biol. 2012, 18, 2205–2217. [Google Scholar] [CrossRef]
  10. Duan, X.N.; Wang, X.K.; Lu, F. Carbon sequestration and its potential by wetland ecosystems in China. Acta Ecol. Sin. 2008, 28, 463–469, (In Chinese with English Abstract). [Google Scholar]
  11. Xu, L.M.; Li, Y.; Ye, W.T.; Zhang, X.Z.; Li, Y.C.; Zhang, Y.X. Holocene lake carbon sequestration, hydrological status and vegetation change, China. Sci. Cold Arid Reg. 2019, 11, 295–326. [Google Scholar]
  12. Zhang, F.J.; Xue, B.; Yao, S.C. The organic carbon burial rate in Chinese lake sediments during Holocene megathermal. Quat. Sci. 2013, 33, 401–402, (In Chinese with English Abstract). [Google Scholar]
  13. Wang, M.; Chen, H.; Yu, Z.; Wu, J.; Zhu, Q.; Peng, C.; Wang, Y.; Qin, B. Carbon accumulation and sequestration of lakes in China during the Holocene. Glob. Chang. Biol. 2015, 21, 4436–4448. [Google Scholar] [CrossRef]
  14. Peng, Y.; Xiao, J.; Nakamura, T.; Liu, B.; Inouchi, Y. Holocene East Asian monsoonal precipitation pattern revealed by grain-size distribution of core sediments of Daihai Lake in Inner Mongolia of north-central China. Earth Planet. Sci. Lett. 2005, 233, 467–479. [Google Scholar] [CrossRef]
  15. Zhao, M.; Heinsch, F.A.; Nemani, R.R.; Running, S.W. Improvements of the MODIS terrestrial gross and net primary production global data set. Remote Sens. Environ. 2005, 95, 164–176. [Google Scholar] [CrossRef]
  16. Jiang, Q.F.; Ji, J.F.; Shen, J.; Matsumoto, R.; Tong, G.B.; Qian, P.; Ren, X.M.; Yan, D.Z. Holocene vegetational and climatic variation in westerly-dominated areas of Central Asia inferred from the Sayram Lake in northern Xinjiang, China. Sci. China Earth Sci. 2013, 56, 339–353. [Google Scholar] [CrossRef]
  17. Xie, Z.; He, J.; Lü, C.; Zhang, R.; Zhou, B.; Mao, H.; Song, W.; Zhao, W.; Hou, D.; Wang, J. Organic carbon fractions and estimation of organic carbon storage in the lake sediments in Inner Mongolia Plateau, China. Environ. Earth Sci. 2014, 73, 2169–2178. [Google Scholar] [CrossRef]
  18. Liu, H.; Cui, H.; Huang, Y. Detecting Holocene movements of the woodland-steppe ecotone in northern China using discriminant analysis. J. Quat. Sci. 2001, 16, 237–244. [Google Scholar] [CrossRef]
  19. Liu, H.; Yin, Y.; Zhu, J.; Zhao, F.; Wang, H. How did the forest respond to Holocene climate drying at the forest–steppe ecotone in northern China? Quat. Int. 2010, 227, 46–52. [Google Scholar] [CrossRef]
  20. Hao, Q.; Liu, H.; Yin, Y.; Wang, H.; Feng, M. Varied responses of forest at its distribution margin to Holocene monsoon development in northern China. Palaeogeogr. Palaeocl. 2014, 409, 239–248. [Google Scholar] [CrossRef]
  21. Xiao, J.; Xu, Q.; Nakamura, T.; Yang, X.; Liang, W.; Inouchi, Y. Holocene vegetation variation in the Daihai Lake region of north-central China: A direct indication of the Asian monsoon climatic history. Quat. Sci. Rev. 2004, 23, 1669–1679. [Google Scholar] [CrossRef]
  22. Jiang, W.; Guo, Z.; Sun, X.; Wu, H.; Chu, G.; Yuan, B.; Hatté, C.; Guiot, J. Reconstruction of climate and vegetation changes of Lake Bayanchagan (Inner Mongolia): Holocene variability of the East Asian monsoon. Quat. Res. 2006, 65, 411–420. [Google Scholar] [CrossRef]
  23. Zhao, Y.; Yu, Z.; Chen, F. Spatial and temporal patterns of Holocene vegetation and climate changes in arid and semi-arid China. Quat. Int. 2009, 194, 6–18. [Google Scholar] [CrossRef]
  24. Marcott, S.A.; Mix, A.C. A reconstruction of regional and global temperature for the past 11,300 years. Science 2013, 339, 1198. [Google Scholar] [CrossRef] [Green Version]
  25. Feng, M.; Wang, Q.; Hao, Q.; Yin, Y.; Song, Z.; Wang, H.; Liu, H. Determinants of soil erosion during the last 1600 years in the forest–steppe ecotone in Northern China reconstructed from lacustrine sediments. Palaeogeogr. Palaeocl. 2016, 449, 79–84. [Google Scholar] [CrossRef]
  26. Yu, K.; Xu, H.; Lan, J.; Sheng, E.; Liu, B. Climate change and soil erosion in a small alpine lake basin on the Loess Plateau, China. Earth Surf. Process. Landforms 2017, 42, 1238–1247. [Google Scholar] [CrossRef]
  27. Zhang, J.; Jia, Y.; Lai, Z.; Long, H.; Yang, L. Holocene evolution of Huangqihai Lake in semi-arid northern China based on sedimentology and luminescence dating. Holocene 2011, 21, 1261–1268. [Google Scholar] [CrossRef]
  28. Zhang, Y.; Liu, H. How did climate drying reduce ecosystem carbon storage in the forest–steppe ecotone? A case study in Inner Mongolia, China. J. Plant Res. 2010, 123, 543–549. [Google Scholar] [CrossRef]
  29. Li, H.; Liu, Q.S.; Wang, J.X. Study of evolution of Huangqihai and Daihai Lakes in Holocene in Inner Mongolia Plateau. J. Lake Sci. 1992, 4, 31–39, (In Chinese with English Abstract). [Google Scholar]
  30. Chen, M.M.; Liu, J.G. Landscape dynamics in the Huangqihai Lake basin from 1976 to 2010. J. Northwest For. Univ. 2014, 29, 165–170, (In Chinese with English Abstract). [Google Scholar]
  31. Blaauw, M.; Christen, J.A. Flexible paleoclimate age-depth models using an autoregressive gamma process. Bayesian Anal. 2011, 3, 457–474. [Google Scholar] [CrossRef]
  32. Blaauw, M.; Christen, J.A.; Bennett, K.D.; Reimer, P.J. Double the dates and go for Bayes—Impacts of model choice, dating density and quality on chronologies. Quat. Sci. Rev. 2018, 188, 58–66. [Google Scholar] [CrossRef] [Green Version]
  33. Avnimelech, Y.; Ritvo, G.; Meijer, L.E.; Kochba, M. Water content, organic carbon and dry bulk density in flooded sediments. Aquacult. Eng. 2001, 25, 25–33. [Google Scholar] [CrossRef]
  34. Egger, M.; Hagens, M.; Sapart, C.J.; Dijkstra, N.; Slomp, C.P. Iron oxide reduction in methane-rich deep Baltic Sea sediments. Geochim. Cosmochim. Acta 2017, 207, 256–276. [Google Scholar] [CrossRef]
  35. Campbell, I.D.; Campbell, C.; Vitt, D.H.; Kelker, D.; Laird, L.D.; Trew, D.; Kotak, B.; Leclair, D.; Bayley, S. A first estimate of organic carbon storage in Holocene lake sediments in Alberta, Canada. J. Paleolimnol. 2000, 24, 395–400. [Google Scholar] [CrossRef]
  36. Turcq, B.; Albuquerque, A.L.S.; Cordeiro, R.C.; Sifeddine, A.; Capitâneo, J. Accumulation of organic carbon in five Brazilian lakes during the Holocene. Sediment Geol. 2002, 148, 319–342. [Google Scholar] [CrossRef]
  37. Wang, Y.J.; Cheng, H.; Edwards, R.L.; An, Z.S.; Wu, J.Y.; Shen, C.C.; Dorale, J.A. A High-Resolution Absolute-Dated Late Pleistocene Monsoon Record from Hulu Cave, China. Science 2001, 294, 2345–2348. [Google Scholar] [CrossRef] [Green Version]
  38. Dykoski, C.; Edwards, R.; Cheng, H.; Yuan, D.; Cai, Y.; Zhang, M.; Lin, Y.; Qing, J.; An, Z.; Revenaugh, J. A high-resolution, absolute-dated Holocene and deglacial Asian monsoon record from Dongge Cave, China. Earth Planet. Sci. Lett. 2005, 233, 71–86. [Google Scholar] [CrossRef]
  39. Wang, Y.; Cheng, H.; Edwards, R.L.; Kong, X.; Shao, X.; Chen, S.; Wu, J.; Jiang, X.; Wang, X.; An, Z. Millennial- and orbital-scale changes in the East Asian monsoon over the past 224,000 years. Nature 2008, 451, 1090. [Google Scholar] [CrossRef] [Green Version]
  40. Liu, J.; Chen, J.; Zhang, X.; Li, Y.; Rao, Z.; Chen, F. Holocene East Asian summer monsoon records in northern China and their inconsistency with Chinese stalagmite δ18O records. Earth Sci. Rev. 2015, 148, 194–208. [Google Scholar] [CrossRef]
  41. Fang, X.Q.; Hou, G.L. Synthetically reconstructed Holocene temperature change in China. Sci. Geogr. Sin. 2011, 31, 385–393, (In Chinese with English Abstract). [Google Scholar]
  42. Li, J.; Dodson, J.; Yan, H.; Zhang, D.D.; Zhang, X.J.; Xu, Q.H.; Lee, H.F.; Pei, Q.; Cheng, B.; Li, C.H.; et al. Quantifying climatic variability in monsoonal northern China over the last 2200 years and its role in driving Chinese dynastic changes. Quat. Sci. Rev. 2017, 159, 35–46. [Google Scholar] [CrossRef] [Green Version]
  43. Herzschuh, U. Reliability of pollen ratios for environmental reconstructions on the Tibetan Plateau. J. Biogeogr. 2010, 34, 1265–1273. [Google Scholar] [CrossRef]
  44. Zhao, Y.; Yu, Z. Vegetation response to Holocene climate change in East Asian monsoon-margin region. Earth Sci. Rev. 2012, 113, 1–10. [Google Scholar] [CrossRef]
  45. Wu, Y.; Lücke, A.; Jin, Z.; Wang, S.; Schleser, G.H.; Battarbee, R.W.; Xia, W. Holocene climate development on the central Tibetan Plateau: A sedimentary record from Cuoe Lake. Palaeogeogr. Palaeocl. 2006, 234, 328–340. [Google Scholar]
  46. Zhang, C.; Wang, H.; Liu, H.; Cheng, Y.; Song, Y.; Luo, Y.; Deng, L. Climatic and environmental changes occurring during the last 5520 years on Alpine Belt of Taibai Mountain: The records of a few proxies of sediments from Foye Chi and their interpretations. Acta Sci. Nat. Univ. Pekin. 2015, 51, 1091–1101, (In Chinese with English Abstract). [Google Scholar]
  47. Wang, H.; Liu, H.; Zhu, J.; Yin, Y. Holocene environmental changes as recorded by mineral magnetism of sediments from Anguli-nuur Lake, southeastern Inner Mongolia Plateau, China. Palaeogeogr. Palaeocl. 2010, 285, 30–49. [Google Scholar] [CrossRef]
  48. Wang, H.; Liu, H.; Zhao, F.; Yin, Y.; Zhu, J.L.; Snowball, I. Early-and mid-Holocene palaeoenvironments as revealed by mineral magnetic, geochemical and palynological data of sediments from Bai Nuur and Ulan Nuur, southeastern inner Mongolia Plateau, China. Quat. Int. 2012, 250, 100–118. [Google Scholar] [CrossRef]
  49. Yang, S.; Ding, F.; Ding, Z. Pleistocene chemical weathering history of Asian arid and semi-arid regions recorded in loess deposits of China and Tajikistan. Geochim. Cosmochim. Acta 2006, 70, 1695–1709. [Google Scholar] [CrossRef]
  50. Sun, Q.; Wang, S.; Zhou, J.; Chen, Z.; Shen, J.; Xie, X.; Wu, F.; Chen, P. Sediment geochemistry of Lake Daihai, north-central China: Implications for catchment weathering and climate change during the Holocene. J. Paleolimnol. 2010, 43, 75–87. [Google Scholar] [CrossRef]
  51. Chen, C.; Lan, H.; Lou, J.; Lou, J.-Y.; Chen, Y. The Dry Holocene Megathermal in Inner Mongolia. Palaeogeogr. Palaeocl. 2003, 193, 181–200. [Google Scholar] [CrossRef]
  52. Xiao, J.; Wu, J.; Si, B.; Liang, W.; Nakamura, T.; Liu, B.; Inouchi, Y. Holocene climate changes in the monsoon/arid transition reflected by carbon concentration in Daihai Lake of Inner Mongolia. Holocene 2006, 16, 551–560. [Google Scholar] [CrossRef]
  53. Sun, A.; Feng, Z. Holocene climatic reconstructions from the fossil pollen record at Qigai Nuur in the southern Mongolian Plateau. Holocene 2013, 23, 1391–1402. [Google Scholar] [CrossRef]
  54. Polanco-Martínez, J.; Medina-Elizalde, M.; Sanchez Goñi, M.; Mudelsee, M. BINCOR: An R package for estimating the correlation between two unevenly Spaced Time Series. R J. 2019, 11, 170–184. [Google Scholar] [CrossRef] [Green Version]
  55. Jung, M.; Reichstein, M.; Margolis, H.A.; Cescatti, A.; Richardson, A.D.; Altaf Arain, M.; Arneth, A.; Bernhofer, C.; Bonal, D.; Chen, J.; et al. Global patterns of land-atmosphere fluxes of carbon dioxide, latent heat, and sensible heat derived from eddy covariance, satellite, and meteorological observations. J. Geophys. Res. 2011, 116, 245–255. [Google Scholar] [CrossRef] [Green Version]
  56. Gałka, M.; Tobolski, K.; Bubak, I. Late Glacial and Early Holocene lake level fluctuations in NE Poland tracked by macro-fossil, pollen and diatom records. Quat. Int. 2015, 388, 23–38. [Google Scholar] [CrossRef]
  57. Talebi, T.; Ramezani, E.; Djamali, M.; Lahijani, H.A.K.; Naqinezhad, A.; Alizadeh, K.; Valerie, A.-P. The Late-Holocene climate change, vegetation dynamics, lake-level changes and anthropogenic impacts in the Lake Urmia region, NW Iran. Quat. Int. 2016, 408, 40–51. [Google Scholar] [CrossRef]
  58. Aniceto, K.; Moreira-Turcq, P.; Cordeiro, R.C.; Fraizy, P.; Turcq, B. Holocene paleohydrology of Quistococha Lake (Peru) in the upper Amazon Basin: Influence on carbon accumulation. Palaeogeogr. Palaeocl. 2014, 415, 165–174. [Google Scholar] [CrossRef]
  59. Guo, L.L.; Feng, Z.D.; Li, X.Q.; Liu, L.Y.; Wang, L.X. Holocene climatic and environmental changes recorded in Baahar nuur lake core in the ordos plateau, Inner Mongolia of China. Chin. Sci. Bull. 2007, 52, 959–966. [Google Scholar] [CrossRef]
  60. Zhao, Y.; Yu, Z.; Chen, F.H.; An, C. Holocene vegetation and climate changes from fossil pollen records in arid and semi-arid China. Dev. Quat. Sci. 2007, 9, 51–65. [Google Scholar]
  61. Chen, F.; Yu, Z.; Yang, M.; Ito, E.; Wang, S.; Madsen, D.B.; Huang, X.; Zhao, Y.; Sato, T.; Birks, H.J.B. Holocene moisture evolution in arid central Asia and its out-of-phase relationship with Asian monsoon history. Quat. Sci. Rev. 2008, 27, 351–364. [Google Scholar] [CrossRef]
  62. Huang, J.; Yu, H.; Guan, X.; Wang, G.; Guo, R. Accelerated dryland expansion under climate change. Nat. Clim. Chang. 2015, 6, 166. [Google Scholar] [CrossRef]
  63. Han, D.; Wiesmeier, M.; Conant, R.T.; Kühnel, A.; Sun, Z.; Kgel-Knabner, I.; Hou, R.; Cong, P.; Liang, R.; Zhu, O. Large soil organic carbon increase due to improved agronomic management in the North China Plain from 1980s to 2010s. Glob. Chang. Biol. 2017, 24, 987–1000. [Google Scholar] [CrossRef]
  64. Yi, B. Northeast grassland development and the ecological cost since the Qing Dynasty. Agric. Hist. China 2003, 4, 116. (In Chinese) [Google Scholar]
  65. Zhang, M.A.; Borjigin, E.; Zhang, H. Mongolian nomadic culture and ecological culture: On the ecological reconstruction in the agro-pastoral mosaic zone in Northern China. Ecol. Econ. 2007, 62, 19–26. [Google Scholar] [CrossRef]
  66. Gordon, E.S.; Goñi, M.A. Sources and distribution of terrigenous organic matter delivered by the Atchafalaya River to sediments in the northern Gulf of Mexico. Geochim. Cosmochim. Acta 2003, 67, 2359–2375. [Google Scholar] [CrossRef]
  67. Perdue, E.M.; Koprivnjak, J.-F. Using the C/N ratio to estimate terrigenous inputs of organic matter to aquatic environments. Estuarine Coast. Shelf Sci. 2007, 73, 65–72. [Google Scholar] [CrossRef]
  68. Brodie, C.R.; Leng, M.J.; Casford, J.S.L.; Kendrick, C.P.; Lloyd, J.M.; Zong, Y.; Bird, M.I. Evidence for bias in C and N concentrations and δ13C composition of terrestrial and aquatic organic materials due to pre-analysis acid preparation methods. Chem. Geol. 2011, 282, 67–83. [Google Scholar] [CrossRef]
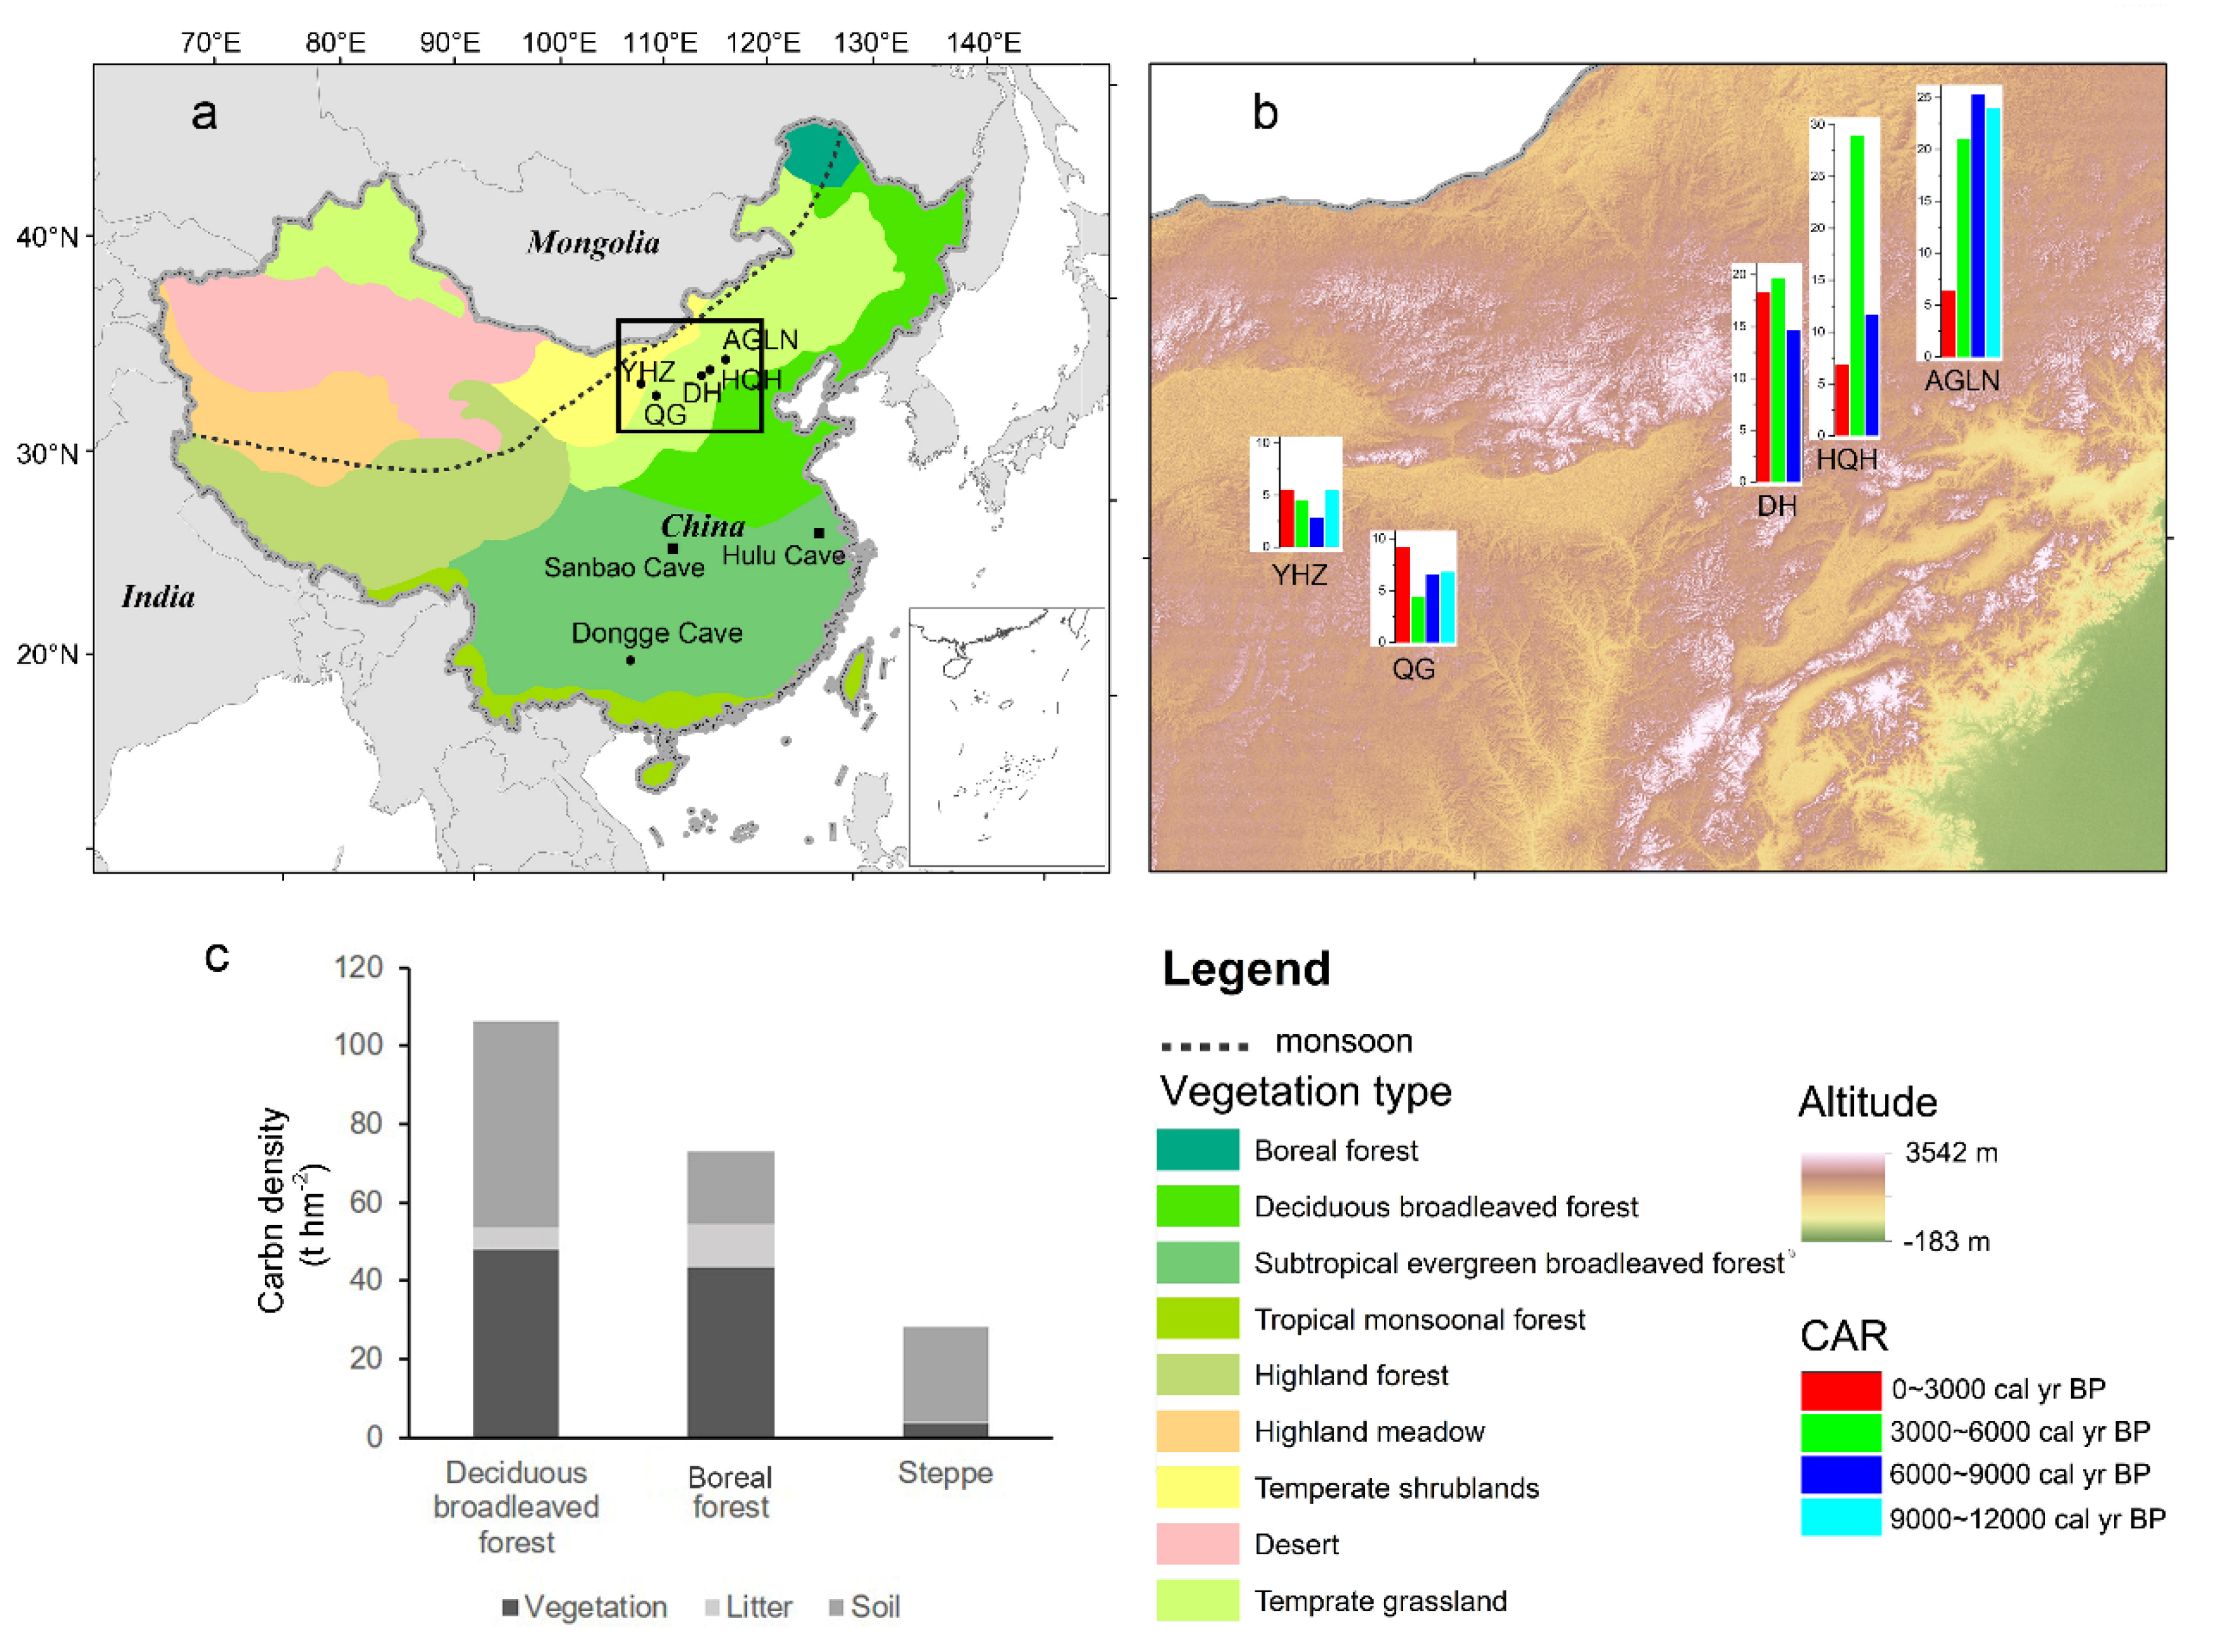
Figure 1. Location of Huangqihai Lake at the regional and local scales. (a) Map of China showing the location of the study region, the East Asian Monsoon margin and the location of Huangqihai Lake (HQH), other lakes mentioned (Anguli Nuur, AGLN; Daihai, DH; Qigai Nuur, QG; Yanhaizi Lake, YHZ) and Dongge, Sanbao and Hulu Cave (rectangle area as shown in detail in b); (b) DEM image of the study area showing the Huangqihai Lake and other lakes. The CAR dynamics for these five lakes during the Holocene are shown as a bar chart (g C m−2 yr−1); (c) carbon density of three ecosystem types in the study region [28]. All the legends are shown at the bottom right.
Forests 12 00696 g001
Figure 2. The Bayesian depth–age model of Huangqihai Lake with lithologic change.
Forests 12 00696 g002
Figure 3. Temporal variation patterns of the sediment’s total inorganic carbon content (TIC), total organic carbon (TOC), total nitrogen (TN), the ratio of TOC and TN (C/N), the calculated dry bulk density (DBD), sediment accumulation rate (SAR), and carbon accumulation rate (CAR) in Huangqihai Lake. The TOC and TN values were obtained from [20].
Forests 12 00696 g003
Figure 4. Temporal variation patterns of TOC, SAR, and CAR according to climate (δ18O of caves and temperature anomaly of China), human activities (human populations of northern China), soil erosion (magnetic susceptibility, mean grain size, and element ratio of Huangqihai Lake), and vegetation parameters (broadleaved tree and pollen concentration of Huangqihai Lake). These data references could refer to Table 2.
Forests 12 00696 g004
Figure 5. RDA (a) and HP (c) results for TOC, SAR, and CAR with the main drivers having significant effects on CAR (p < 0.05 or 0.01) listed in Table 2. A total of three parameters (broadleaved tree pollen percentages, pollen concentration, and mean grain size of Huangqihai Lake) made the most contributions to TOC, SAR, and CAR. The contributions (%) are shown beside the parameter names in (b).
Forests 12 00696 g005
Figure 6. Temporal variation patterns of CAR according to vegetation change and the corresponding mean grain size (D (3, 2)), which were the most important factors by RDA and HP analysis. The vegetation change includes the broadleaved tree percentage, coniferous tree percentage, the pollen concentration and vegetation types.
Forests 12 00696 g006
Table 1. Correlation coefficients (R) among selected climate/environmental variables. These original data were obtained from the reference list in Table 2.
VariablesTemperatureδ18O of CavesSand/Non-SandMean Grain SizeMagnetic SusceptibilityElement RatioNa/AlAP/NAPPollen ConcentrationBroadleaved Tree Pollen Percentage
δ18O of caves−0.67 **
Sand/non-sand−0.72 **0.16
Mean grain size0.10−0.220.07
Magnetic susceptibility−0.39 *0.070.50 **−0.23
Element ratio0.66 **−0.45 **−0.58 **0.27−0.80 **
Na/Al0.29−0.14−0.38 *0.28−0.78 **0.82 **
AP/NAP−0.160.25−0.07−0.090.07−0.12−0.13
Pollen concentration0.44 **−0.03−0.38 *−0.00−0.49 **0.42 *0.44 *−0.48 **
Broadleaved tree pollen percentage0.79 **−0.78 **−0.38 *0.24−0.47 **0.64 **0.41 *−0.51 **0.46 **
Coniferous tree pollen percentage−0.070.19−0.180.11−0.060.050.010.77 **−0.55 **−0.39 *
* p < 0.05; ** p < 0.01.
Table 2. Correlation coefficients (R) of Huangqihai Lake sediment TOC, SAR, and CAR with climate/environmental variables.
VariablesTOCSARCARReference
Temperature (China)0.69 **0.40 *0.45 **[41]
Precipitation (δ18O of caves)−0.54 **−0.21−0.27[37,38,39]
Sand/non-sand (Huangqihai)−0.38 *−0.3−0.31[20]
Mean grain size (Huangqihai)0.290.34 *0.37 *This study
Magnetic susceptibility (Huangqihai)−0.52 **−0.50 **−0.51 **Wang et al. unpublished
Element ratio (Huangqihai)0.65 **0.50 **0.54 **This study
Na/Al (Huangqihai)0.46 **0.42 *0.44 **This study
AP/NAP (Huangqihai)−0.56 **−0.40 *−0.40 *[20]
Pollen concentration (Huangqihai)0.69 **0.52 **0.54 **[20]
Broadleaved tree pollen percentage (Huangqihai)0.84 **0.57 **0.61 **[20]
Coniferous tree pollen percentage (Huangqihai)−0.54 **−0.32−0.34[20]
Human activity (Population number)0.450.67 *0.79 **[42]
* p < 0.05; ** p < 0.01.
Publisher’s Note: MDPI stays neutral with regard to jurisdictional claims in published maps and institutional affiliations.