
Spatial Optimization and Tradeoffs of Alternative Forest Management Scenarios in Macedonia, Greece

 ,
,  ,
,  , and
, and
Abstract

1. Introduction
2. Materials and Methods
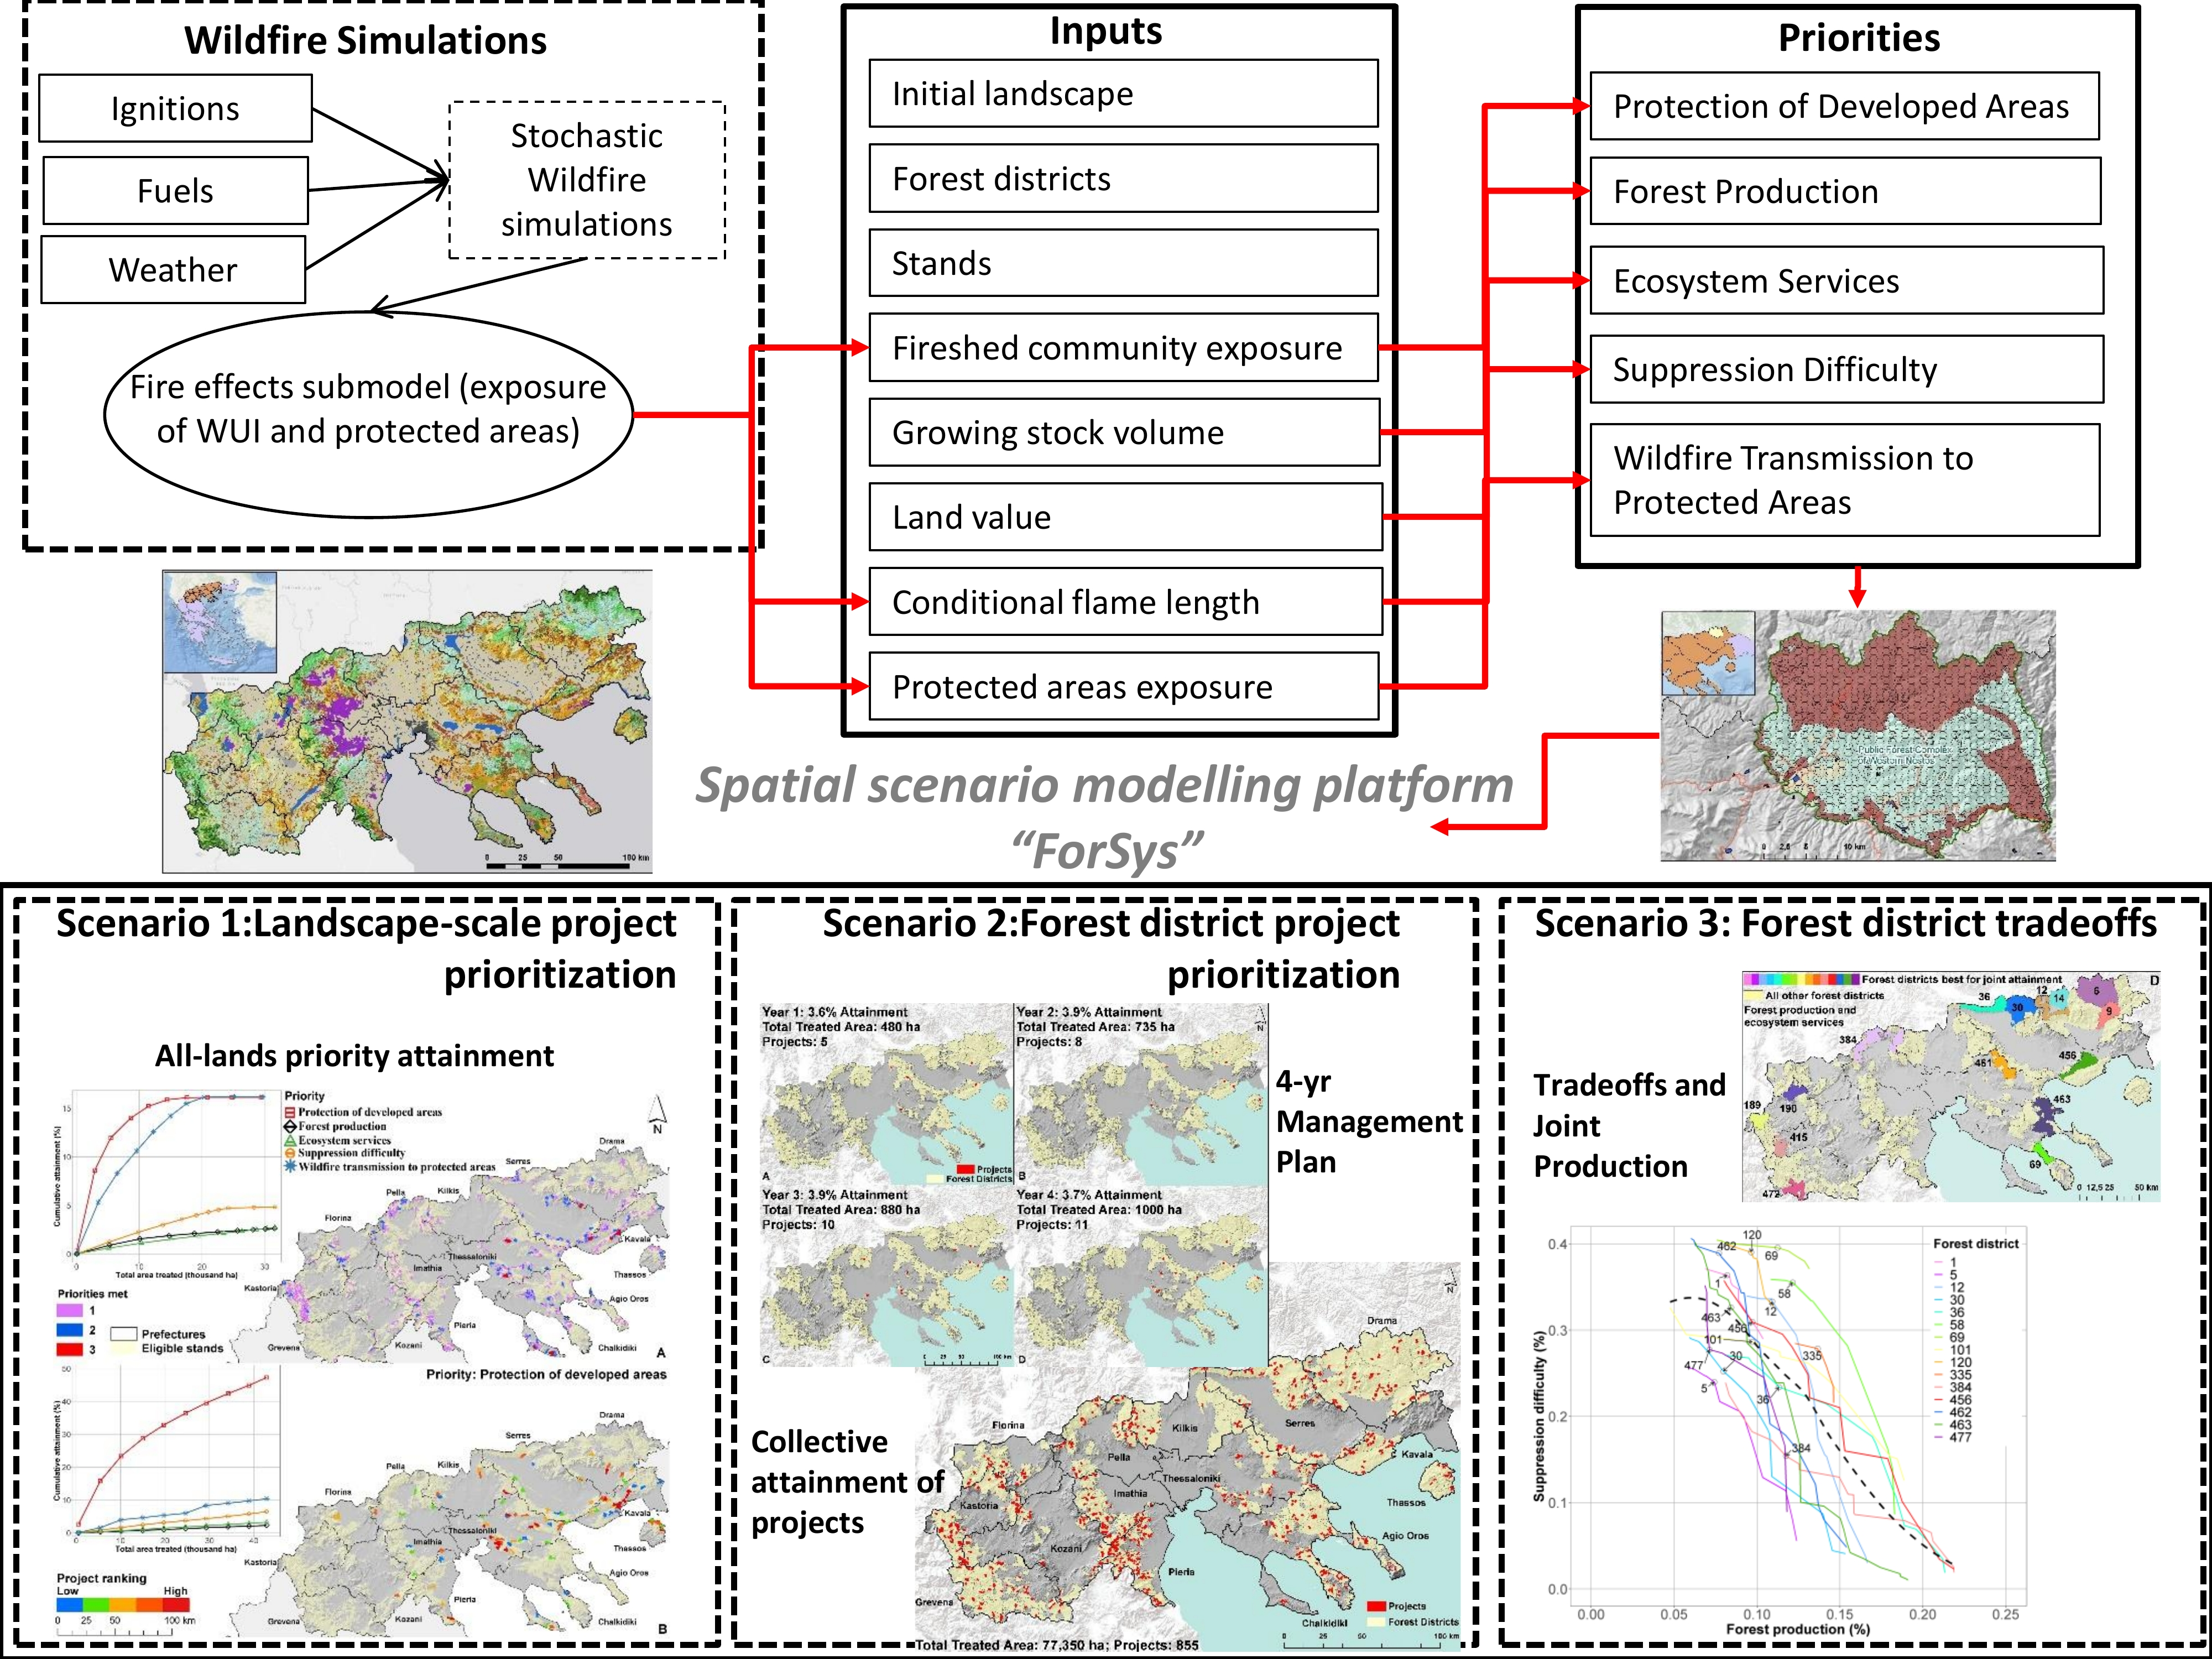
2.1. Overview
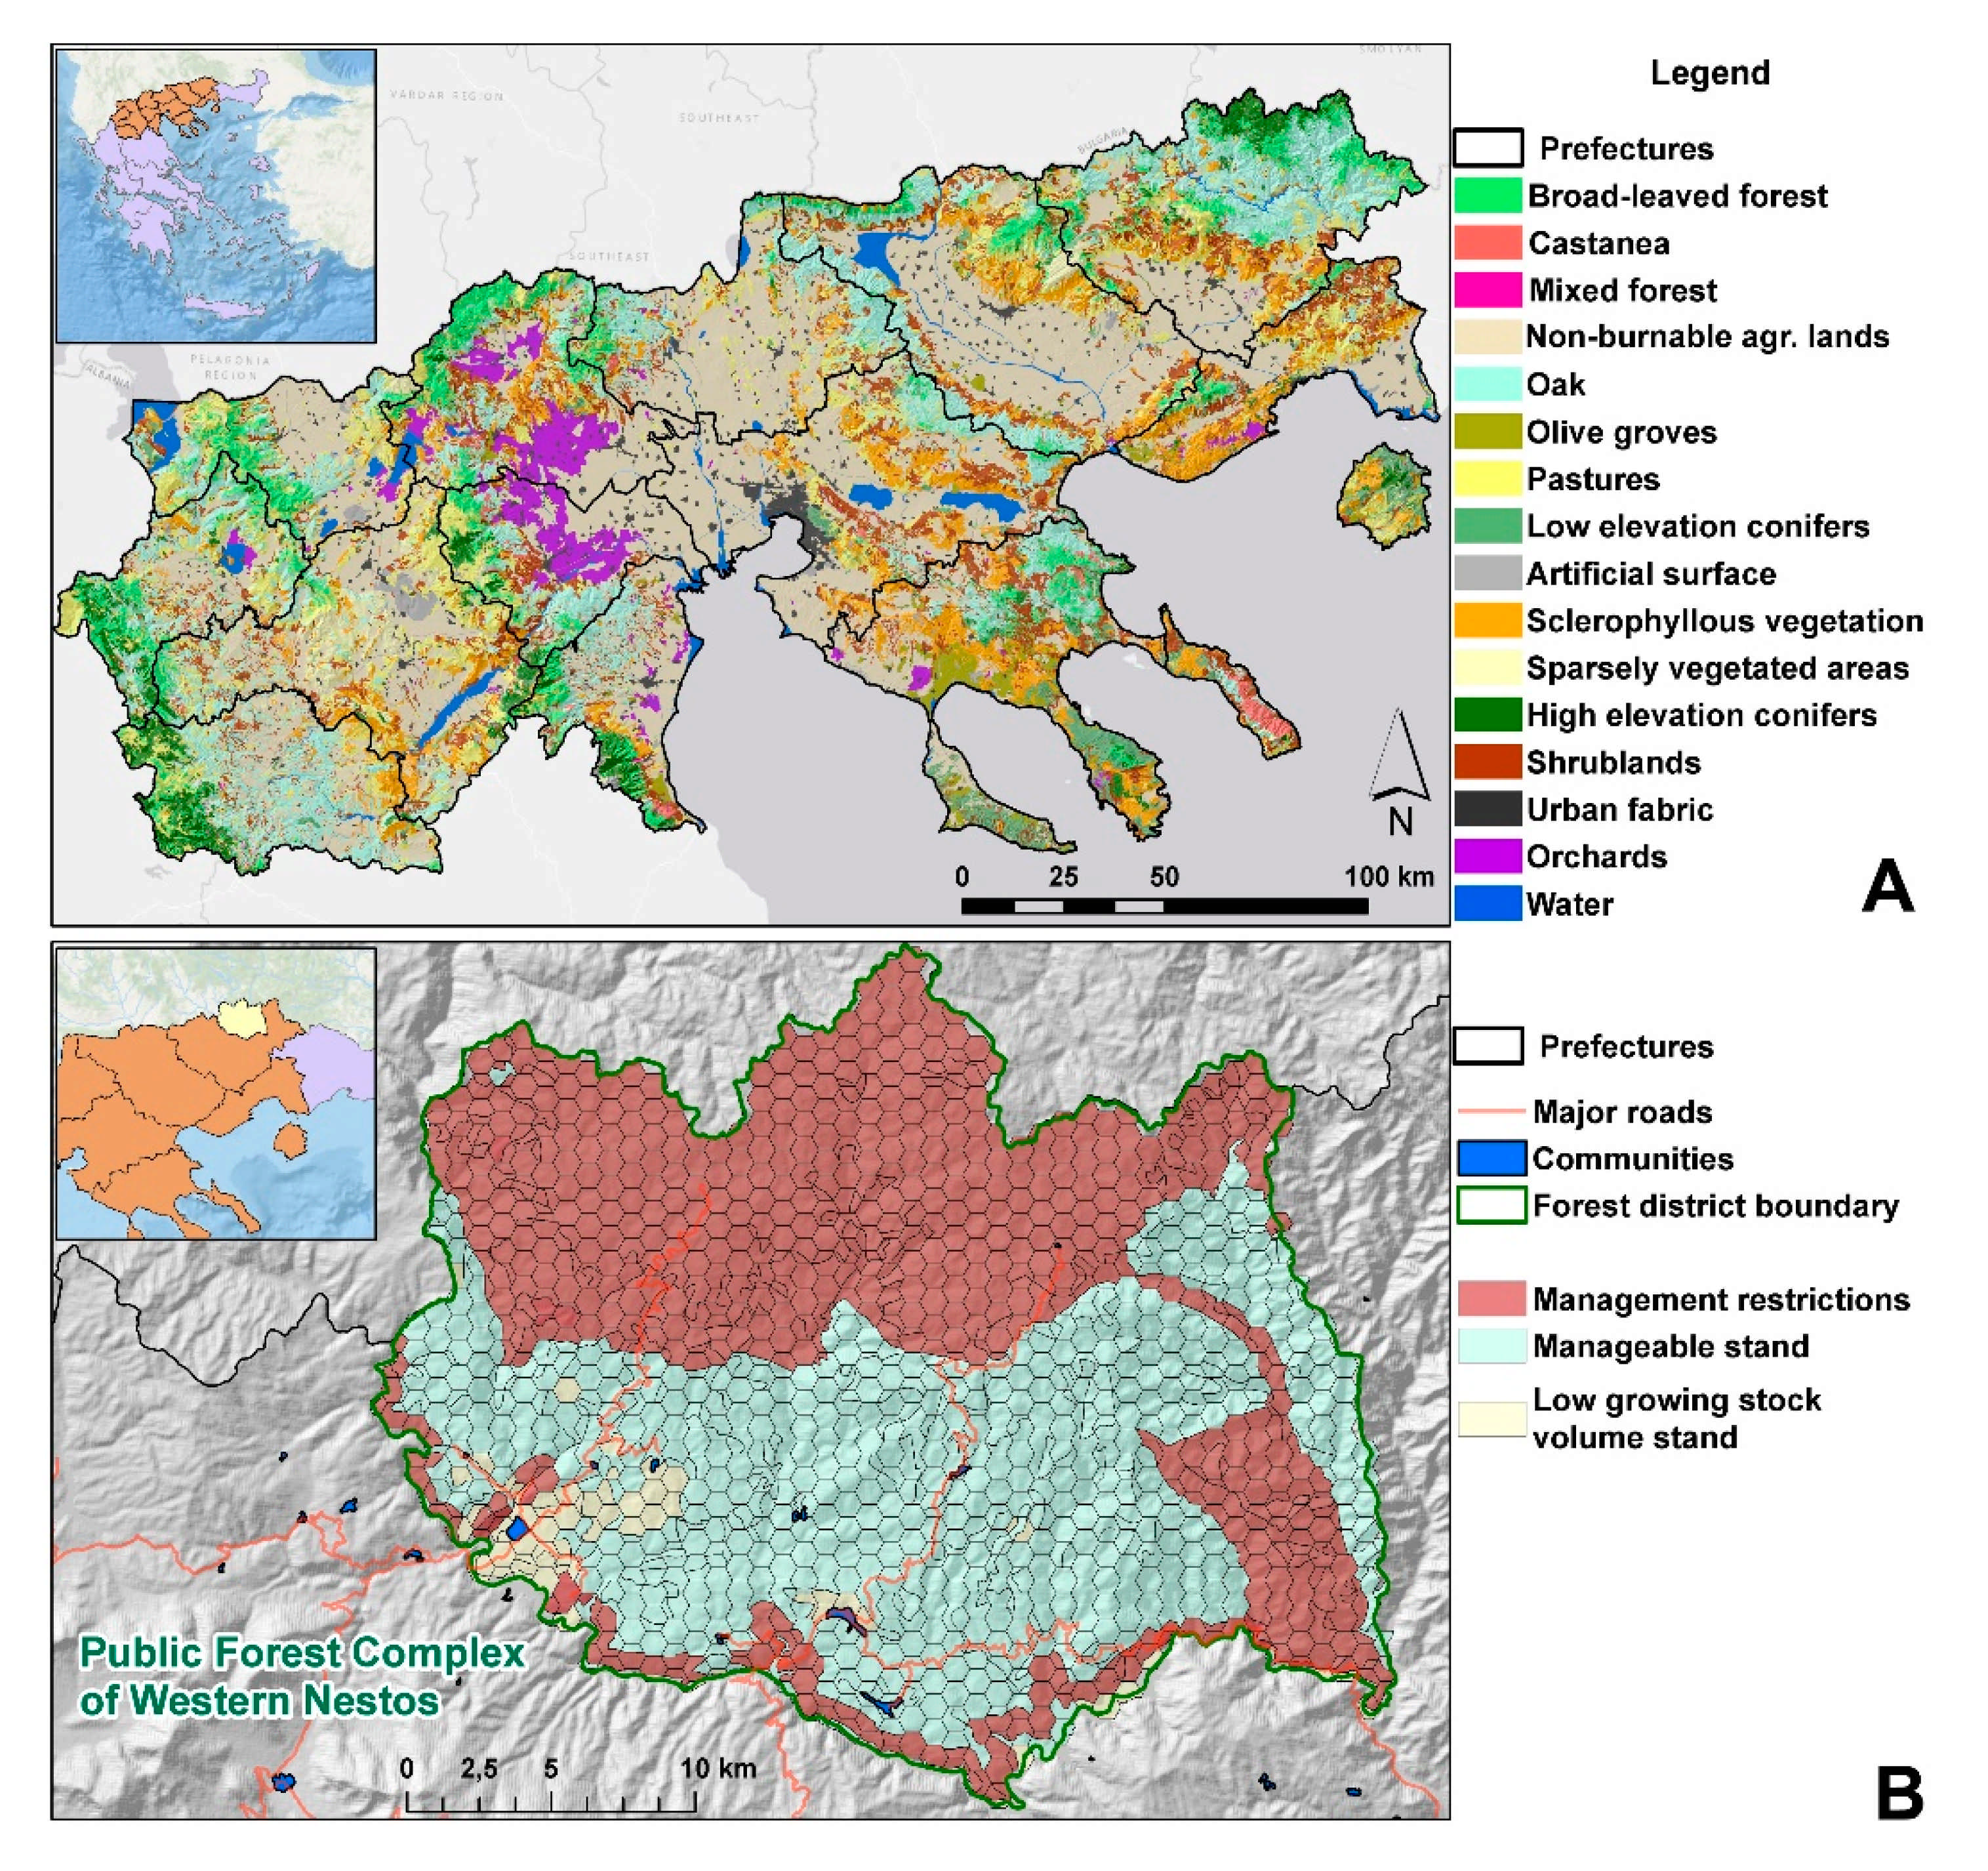
2.2. Study Area
2.3. Forest Districts and Stands
2.4. Stochastic Fire Behaviour Modelling
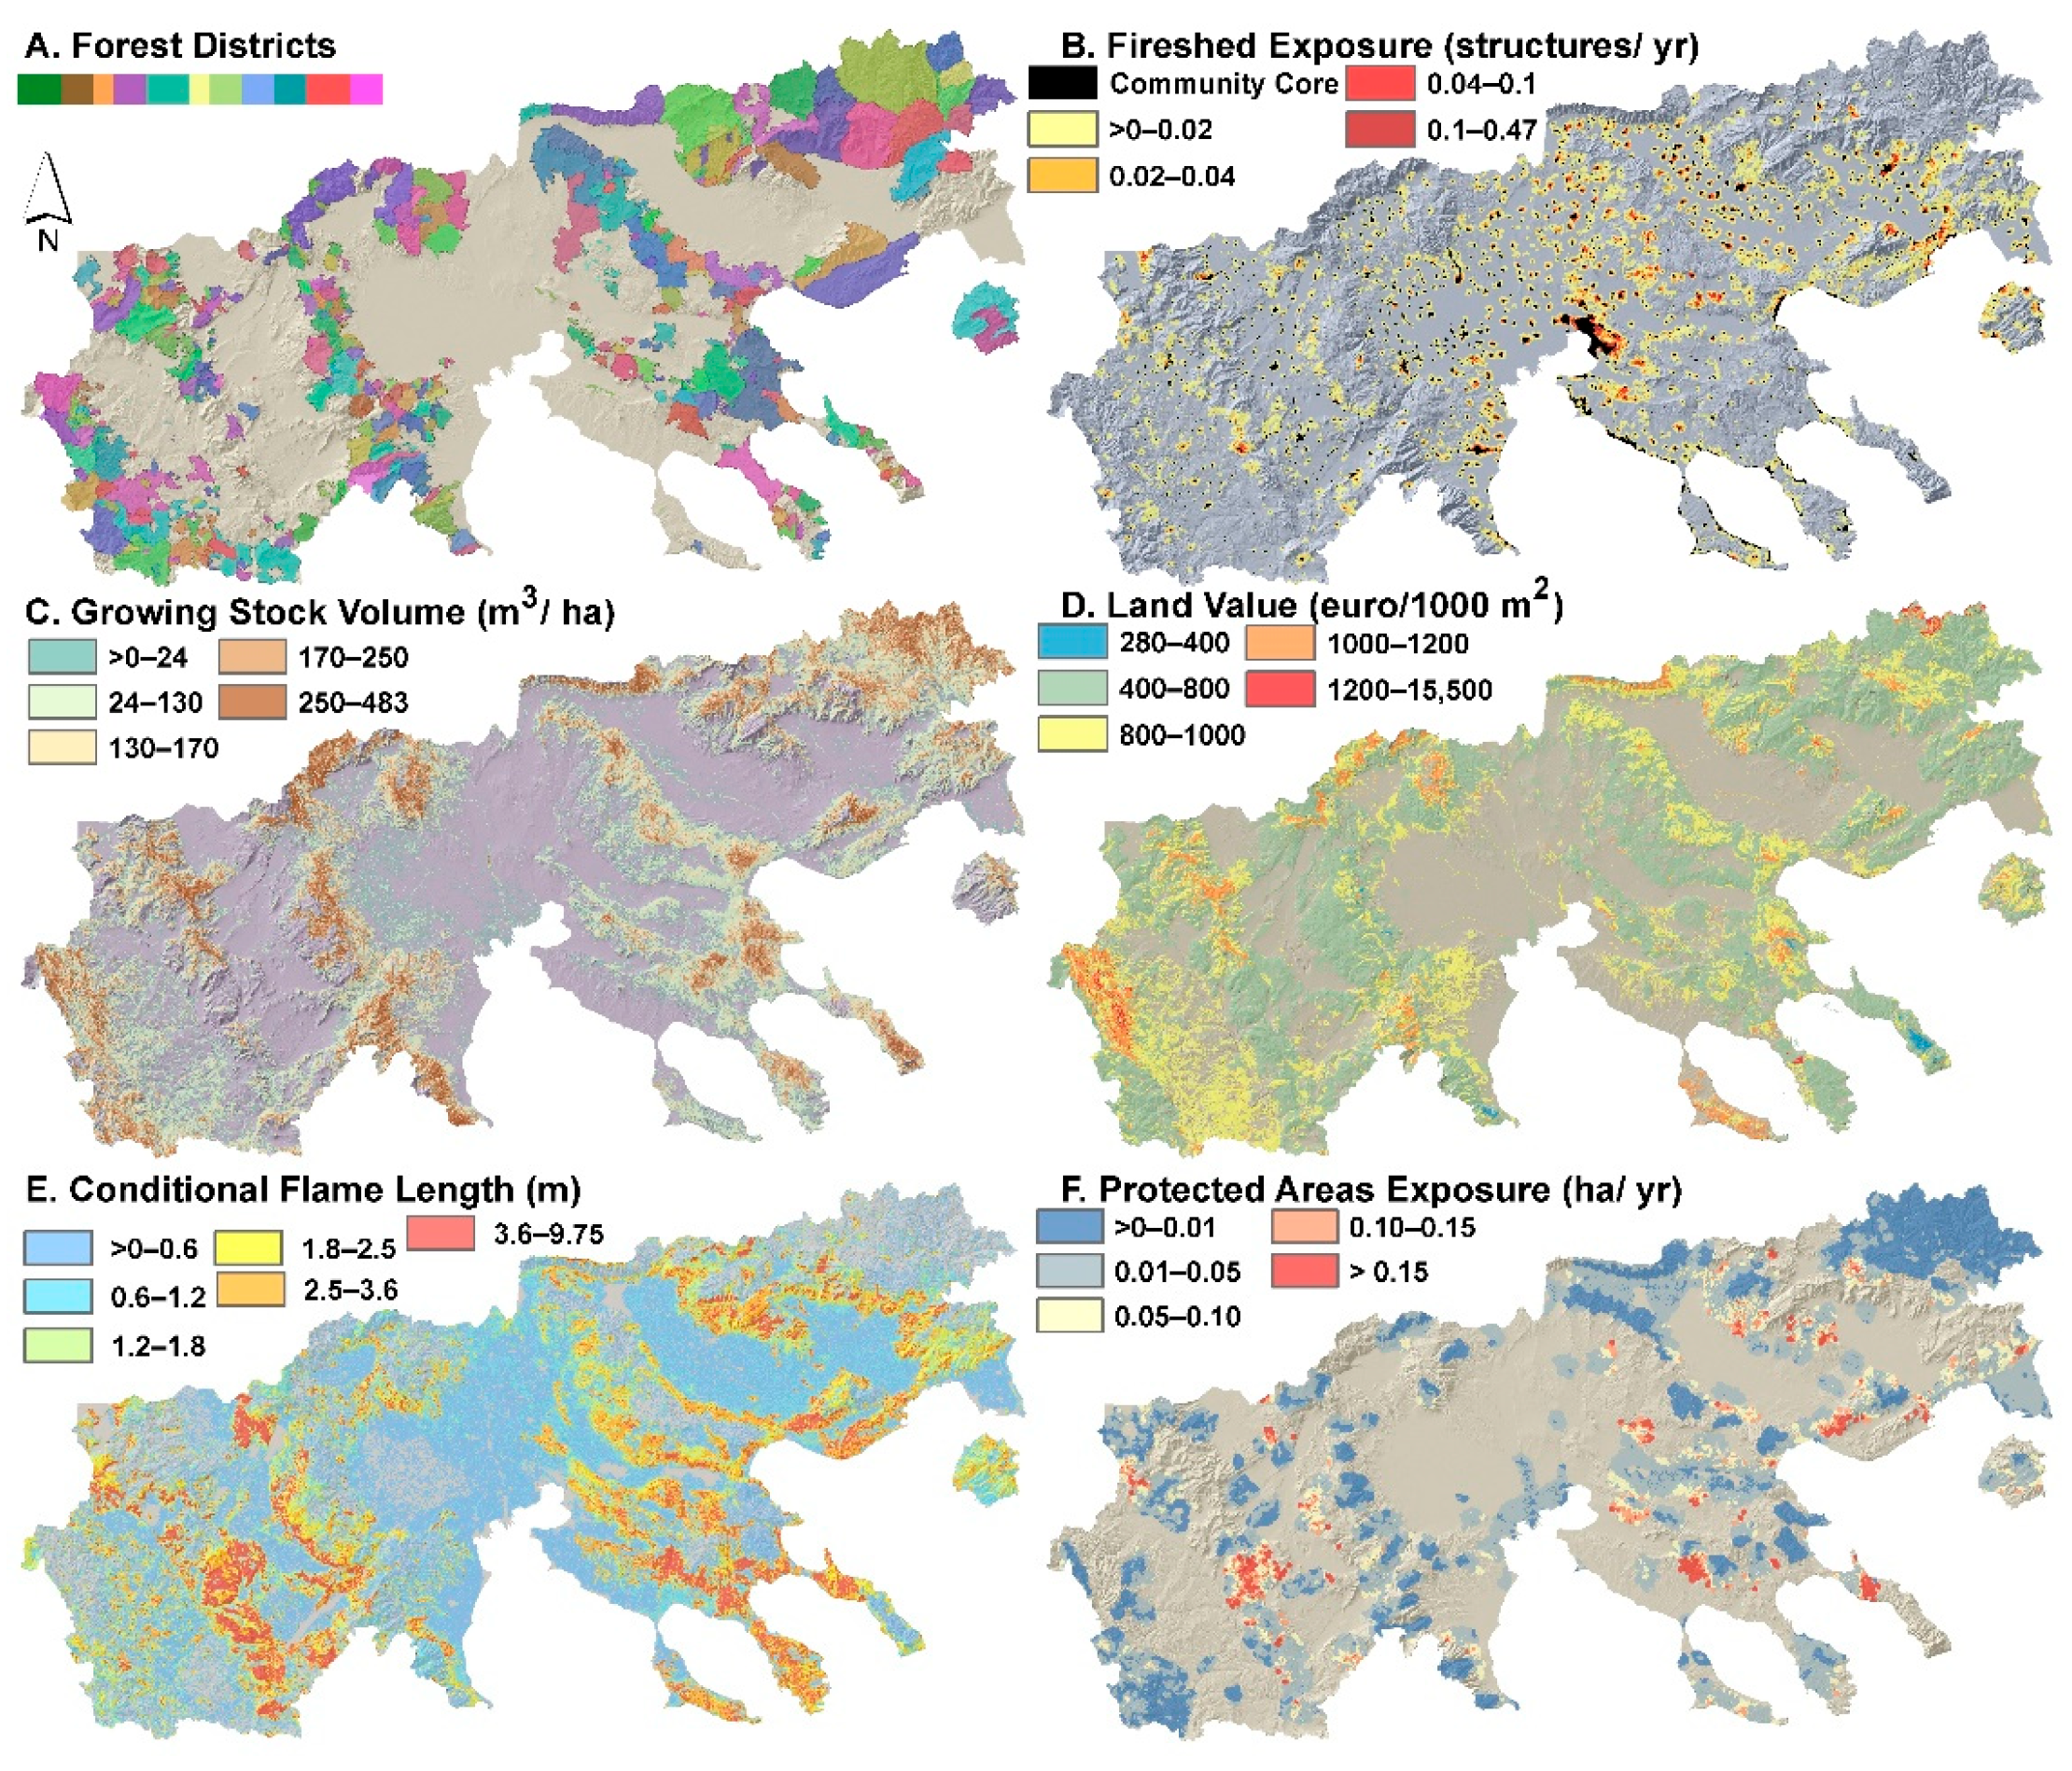
2.5. Forest Management Priorities
2.5.1. Protection of Developed Areas
2.5.2. Forest Production
2.5.3. Ecosystem Services
2.5.4. Suppression Difficulty
2.5.5. Wildfire Transmission to Protected Areas
2.6. Multicriteria Spatial Prioritization and Optimization
2.7. Linking Stands with Fire Behavior Modelling Outputs and Other Forestry Metrics
2.8. Modelled Treatment Scenarios for Each Management Priority
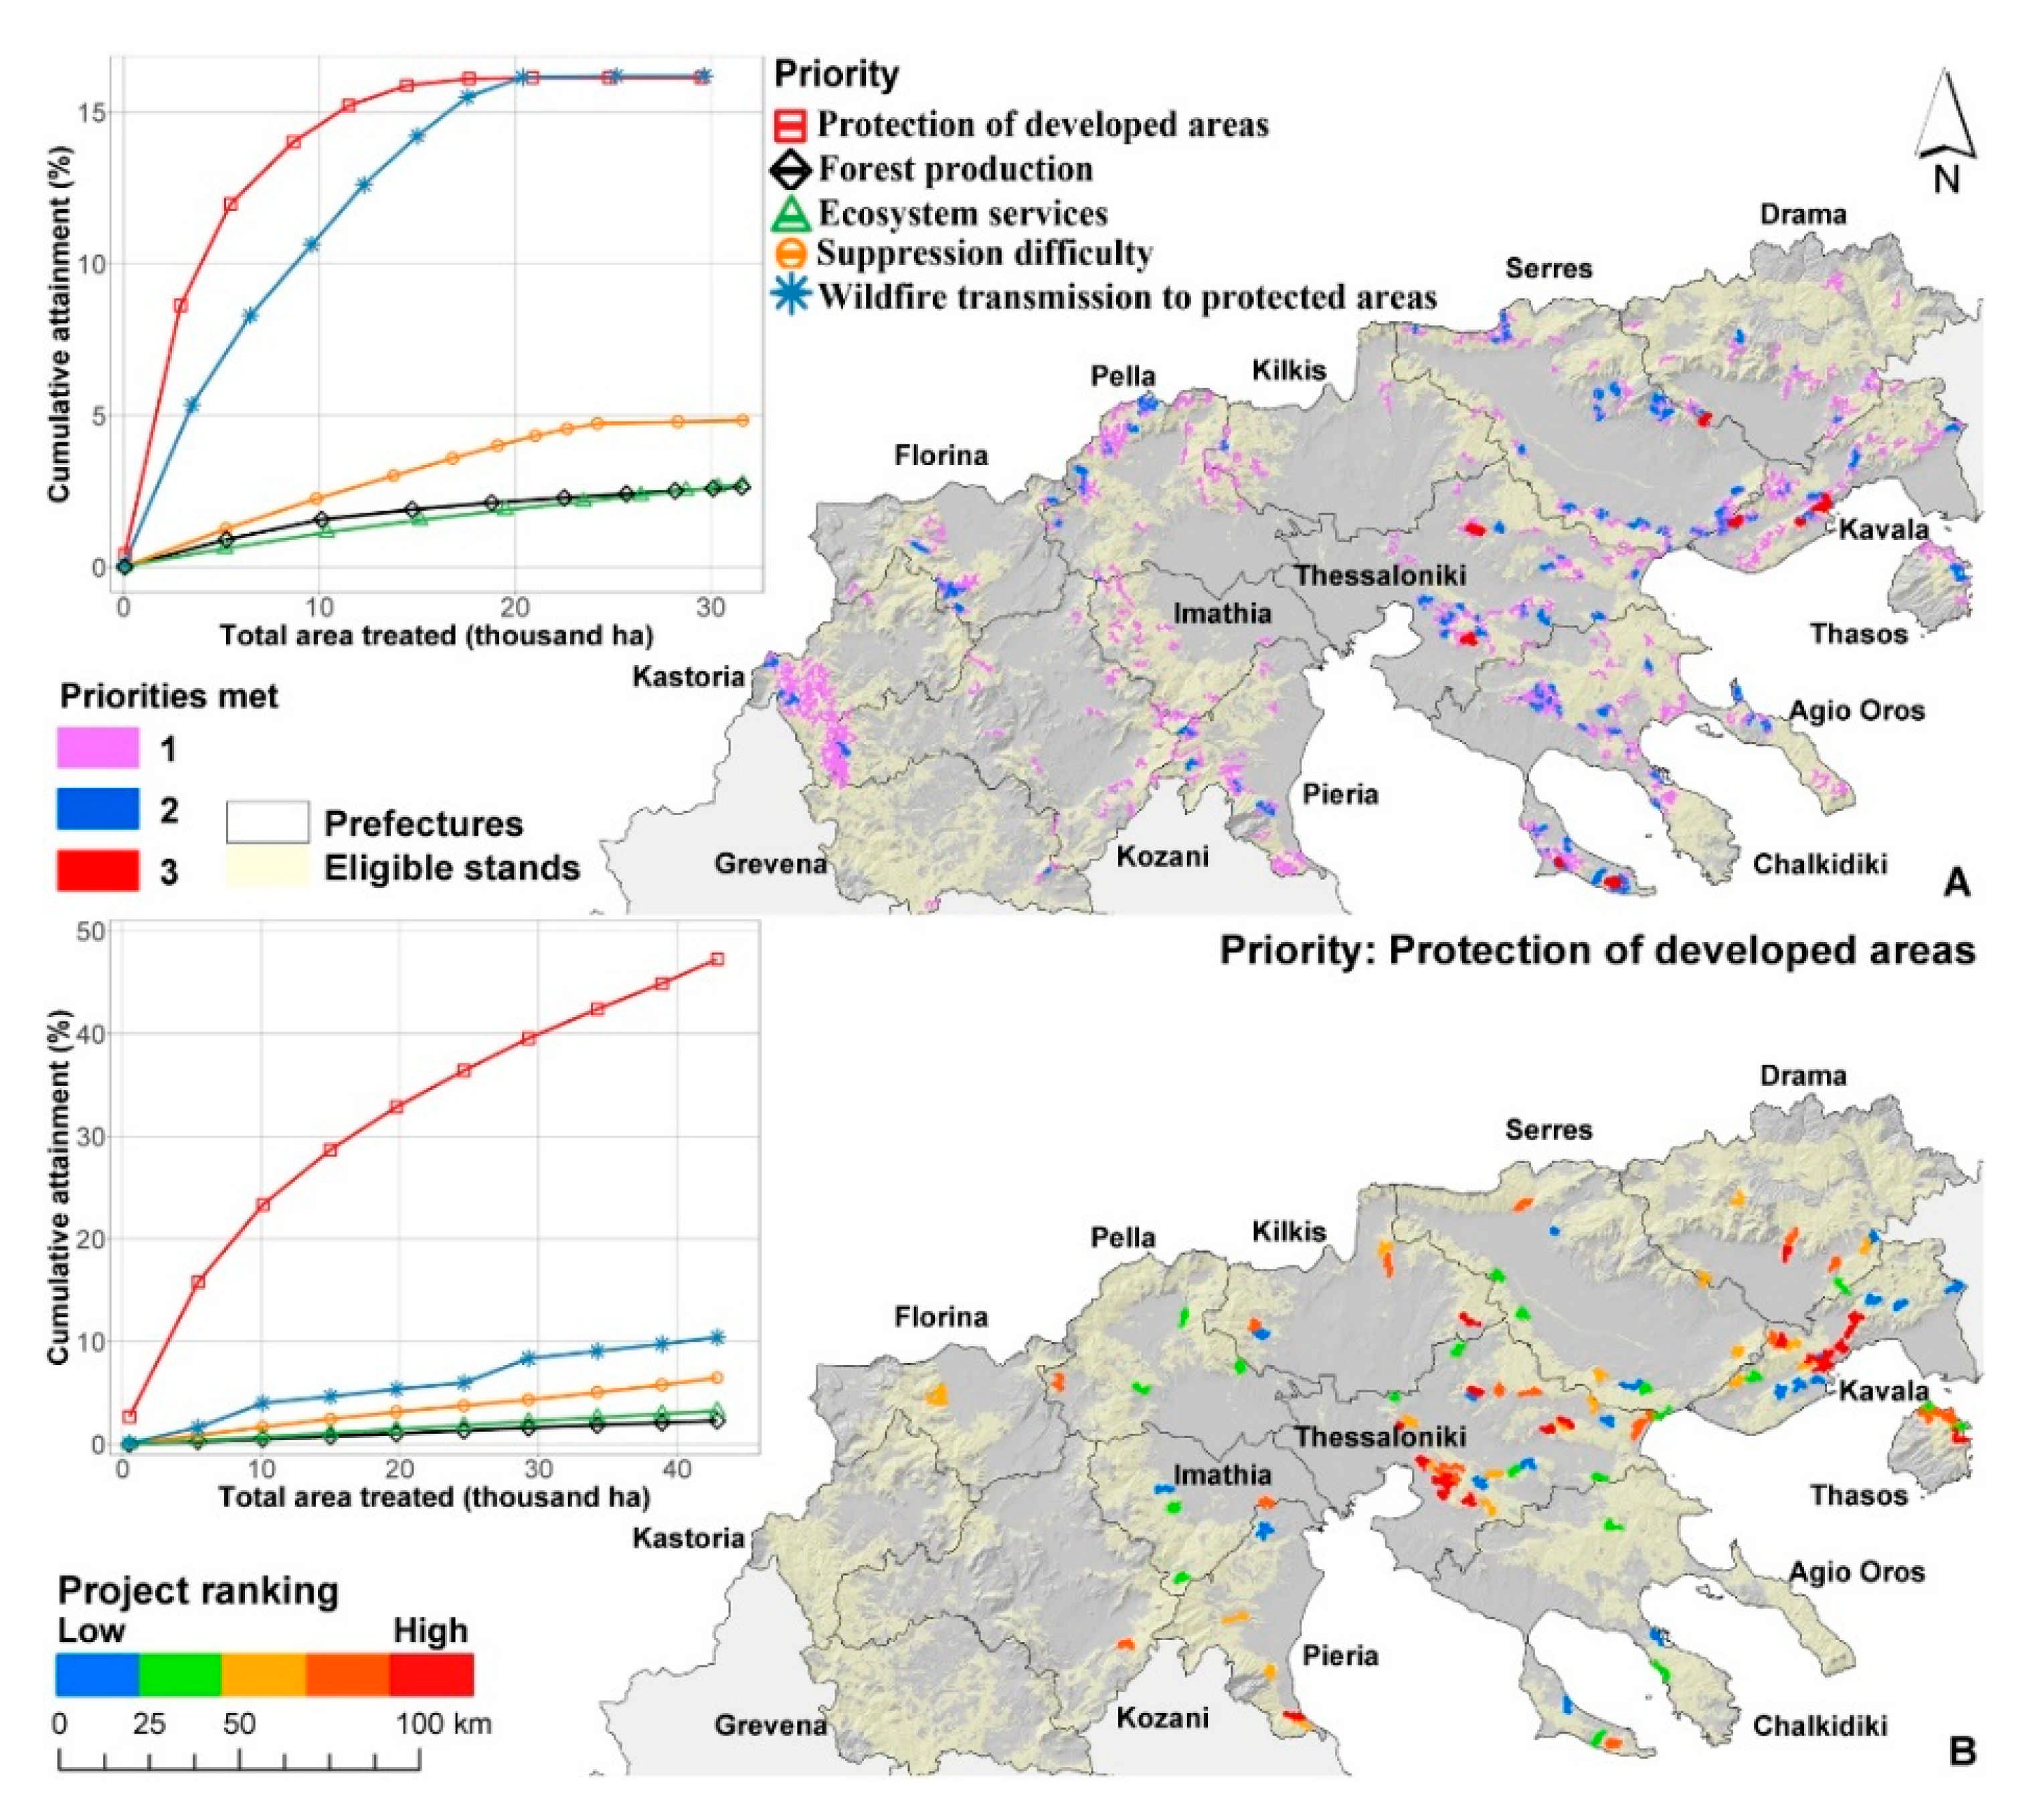
2.8.1. Landscape-Scale Project Prioritization (Scenario 1: All Lands)
2.8.2. Forest District Project Prioritization (Scenario 2: Annual Treatments)
2.8.3. Forest District Tradeoffs (Scenario 3: Tradeoffs)
3. Results
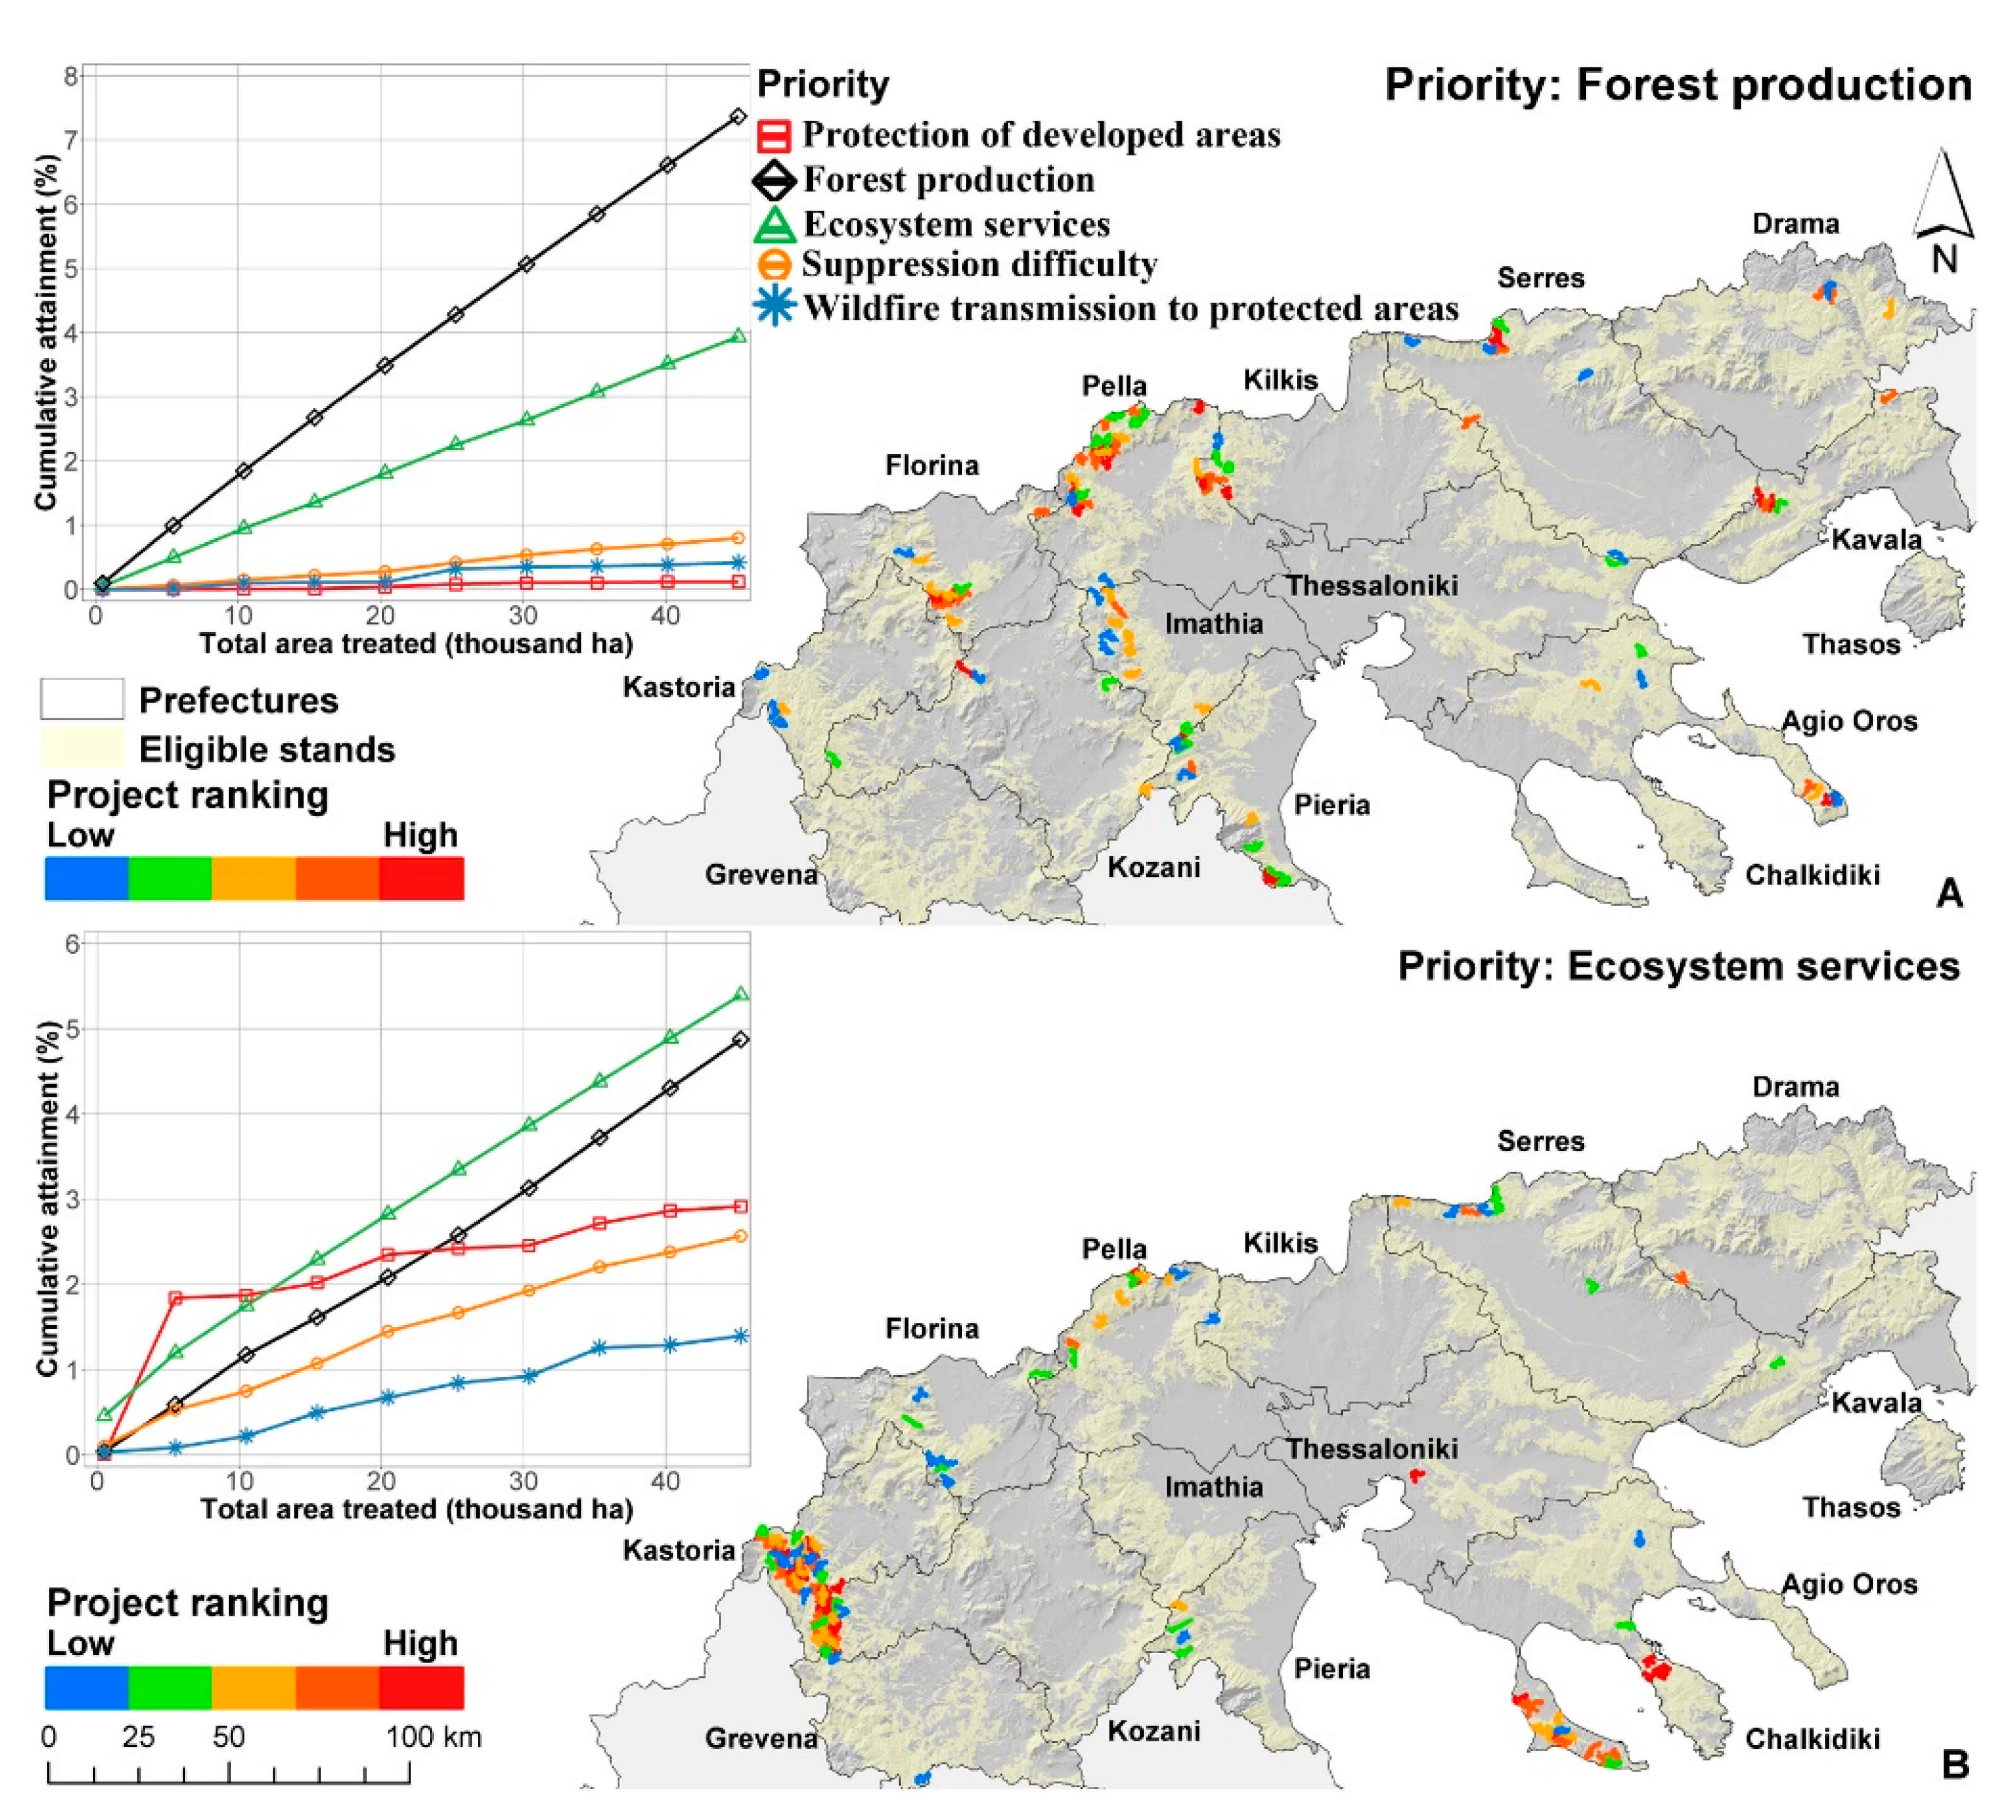
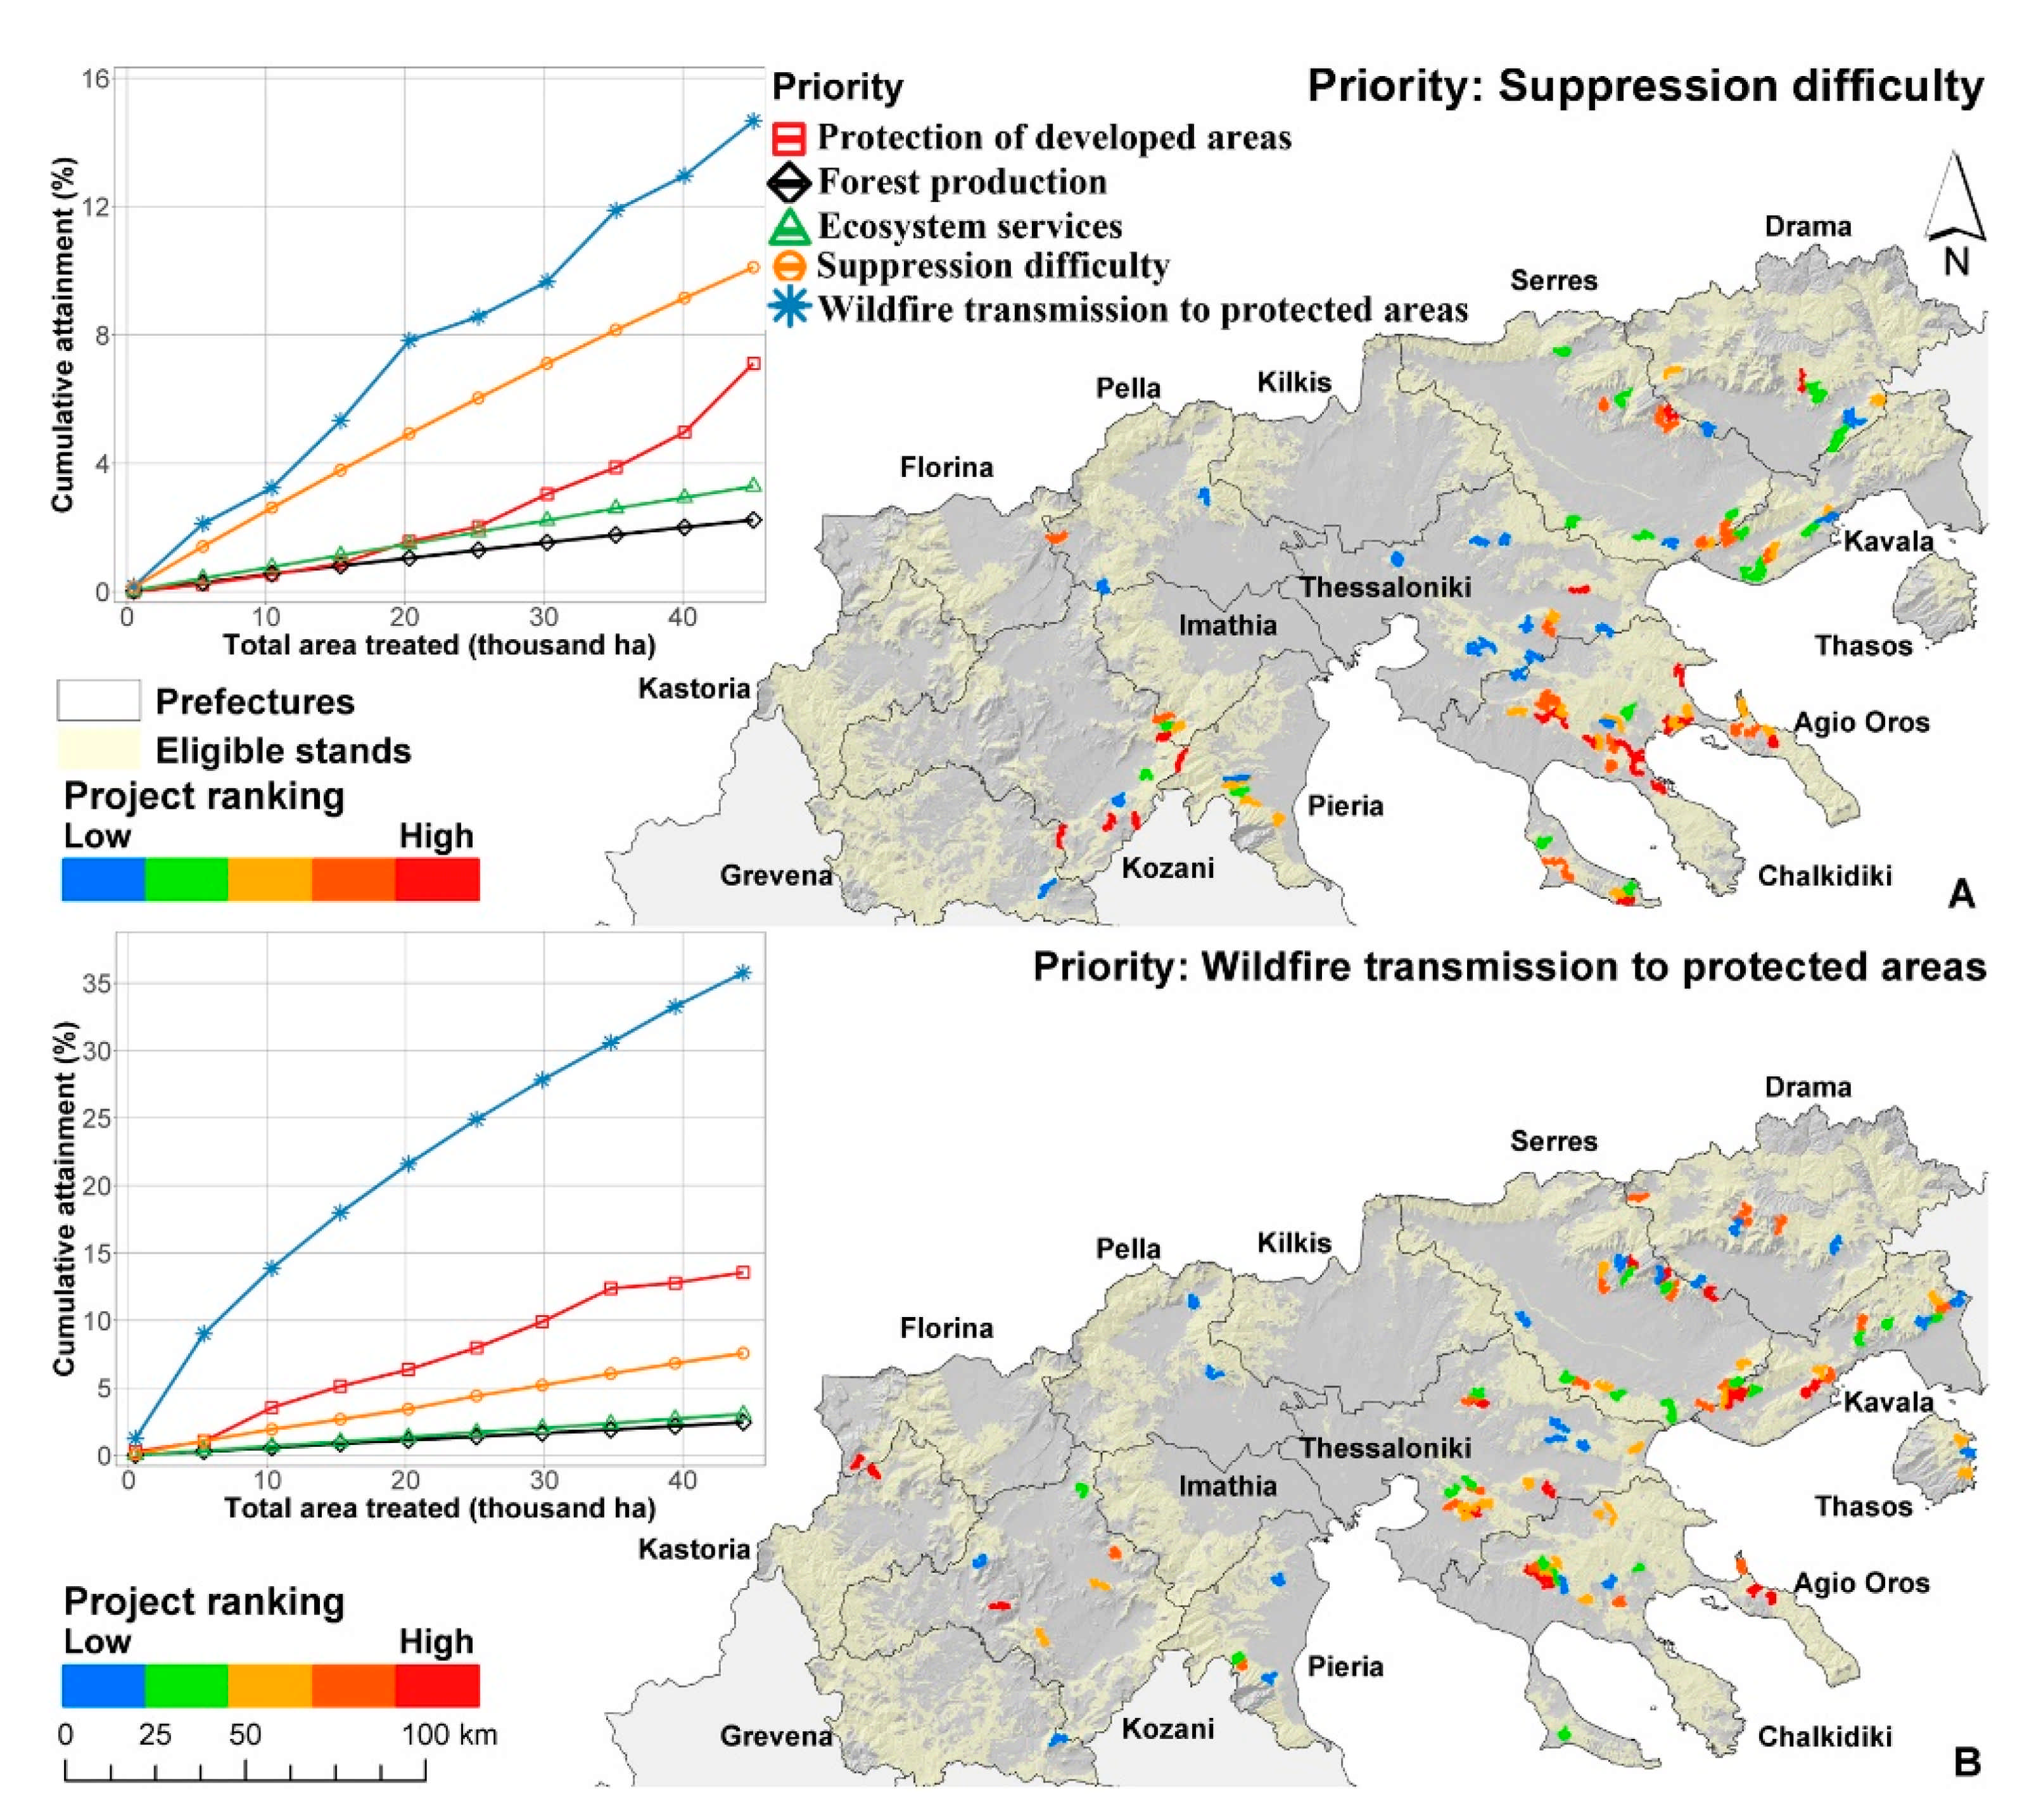
3.1. Scenario 1: All Lands
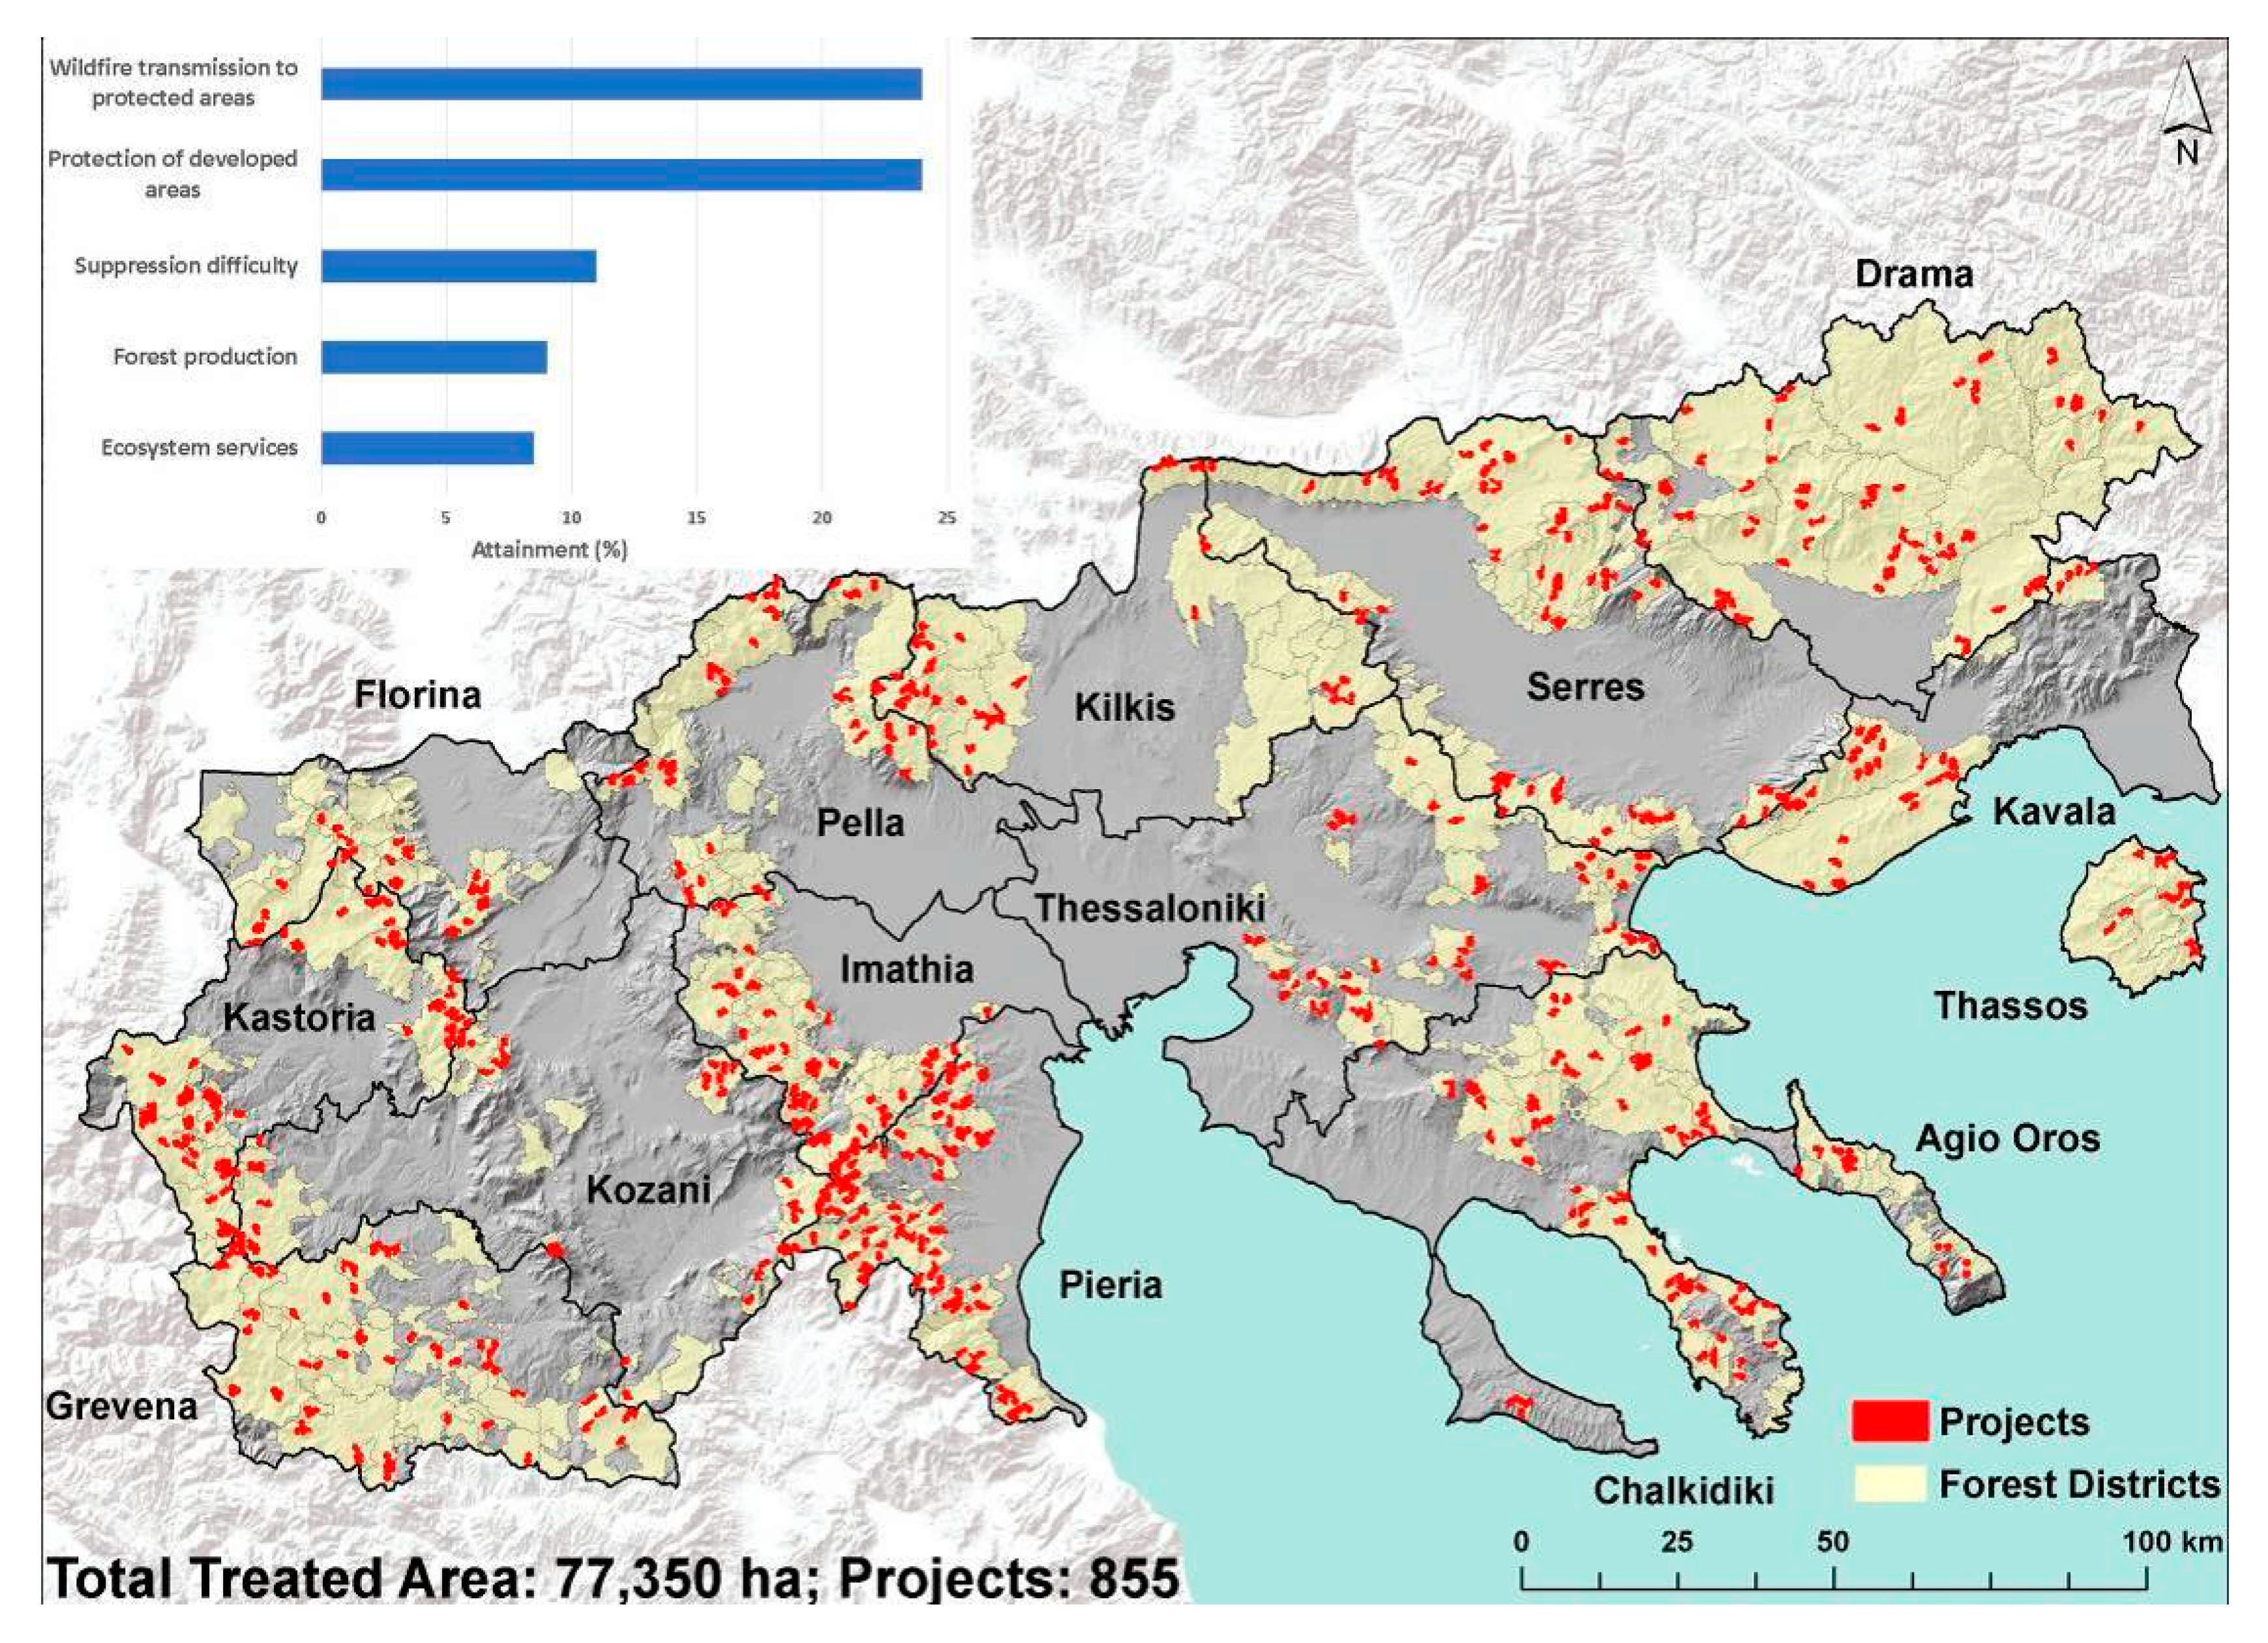
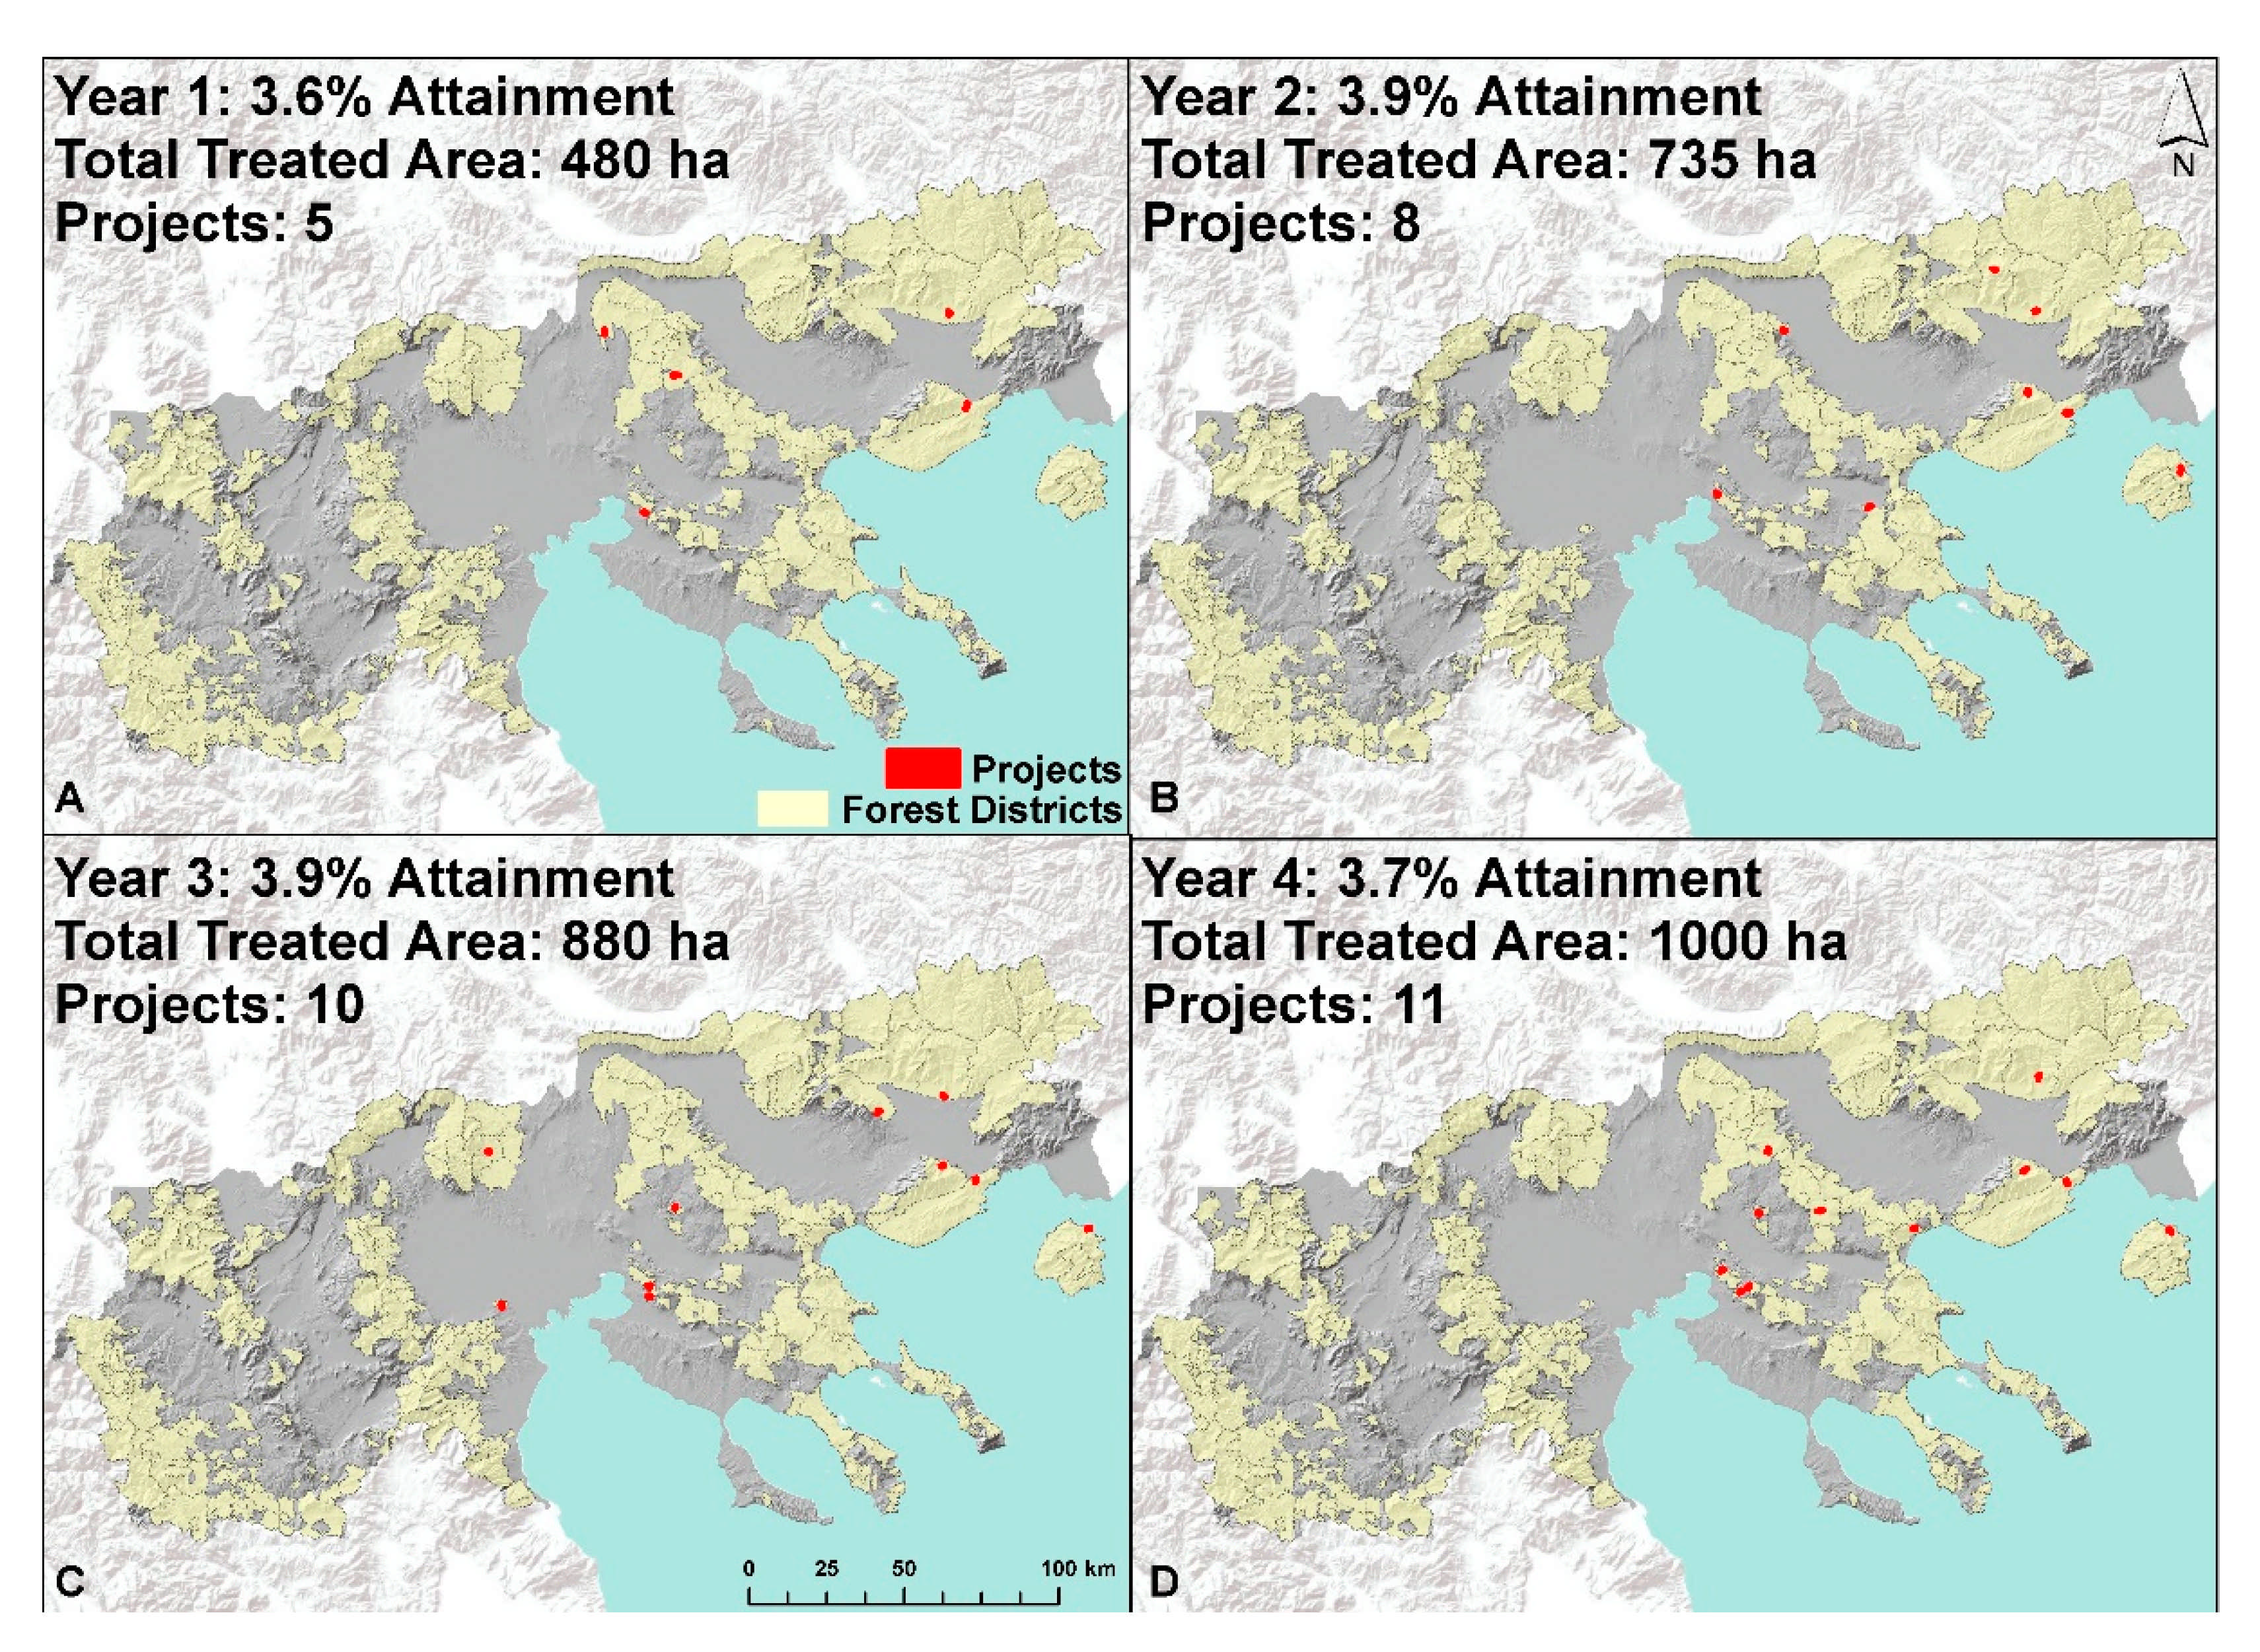
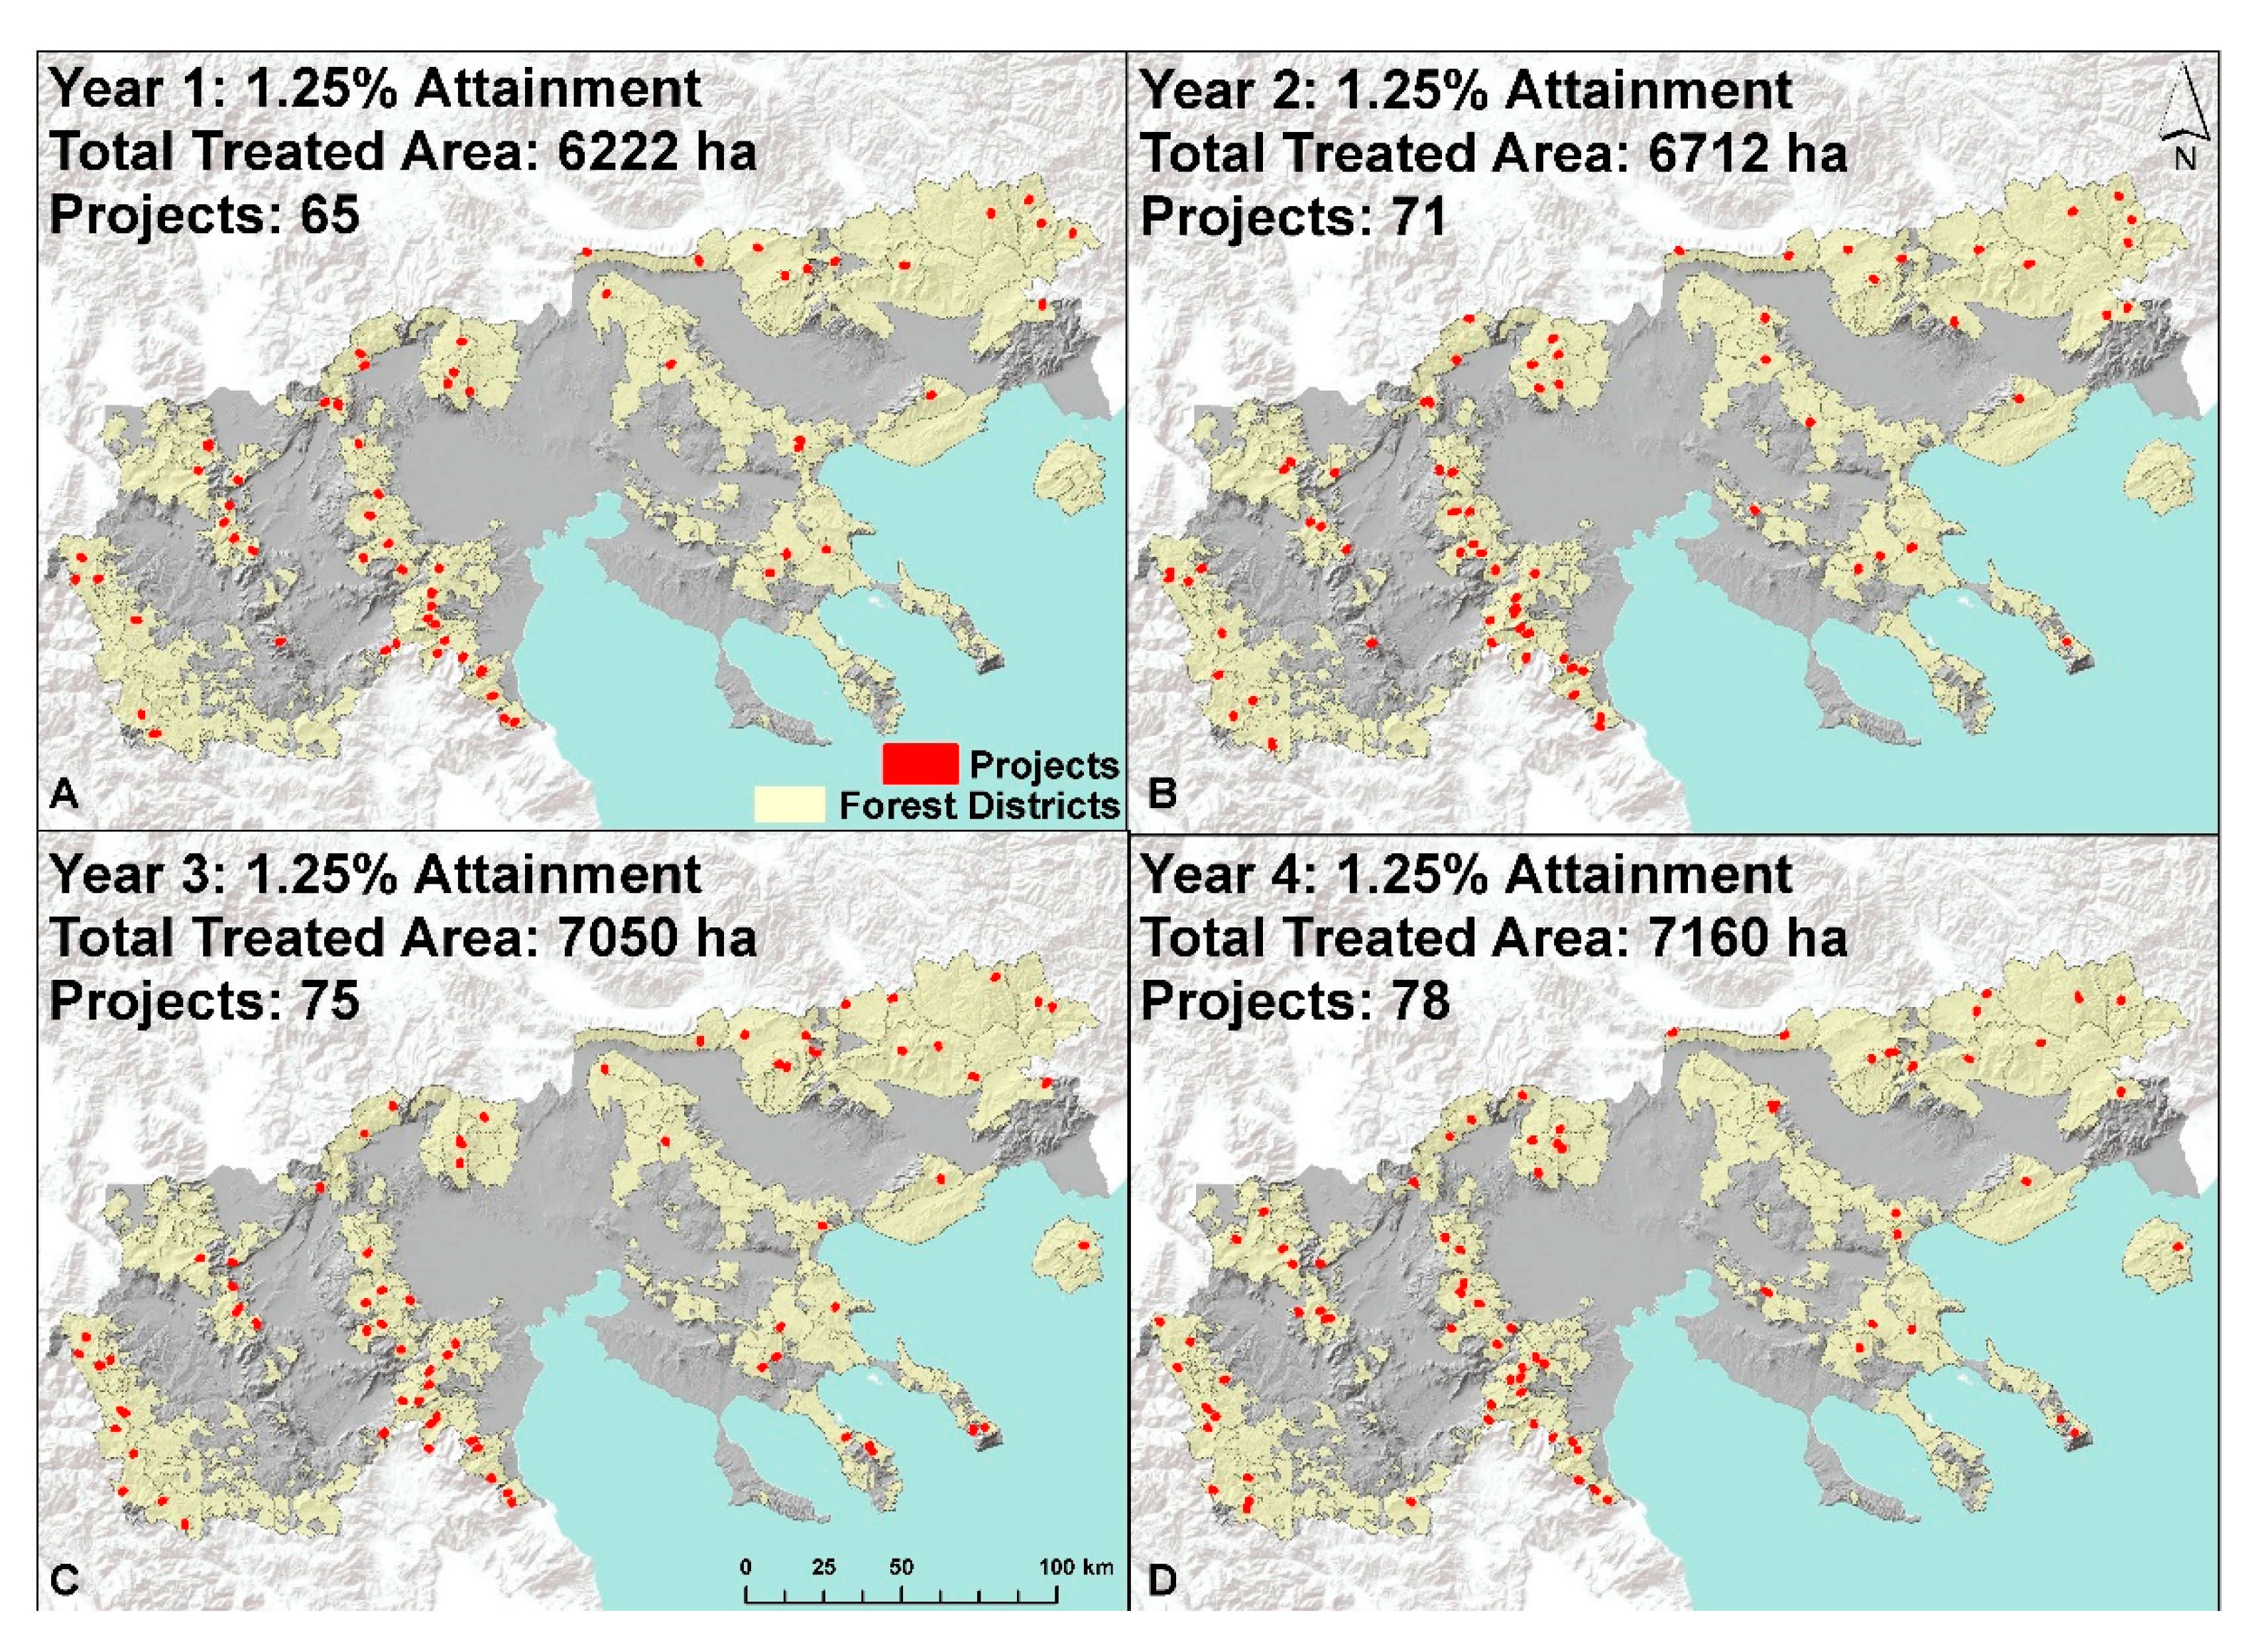
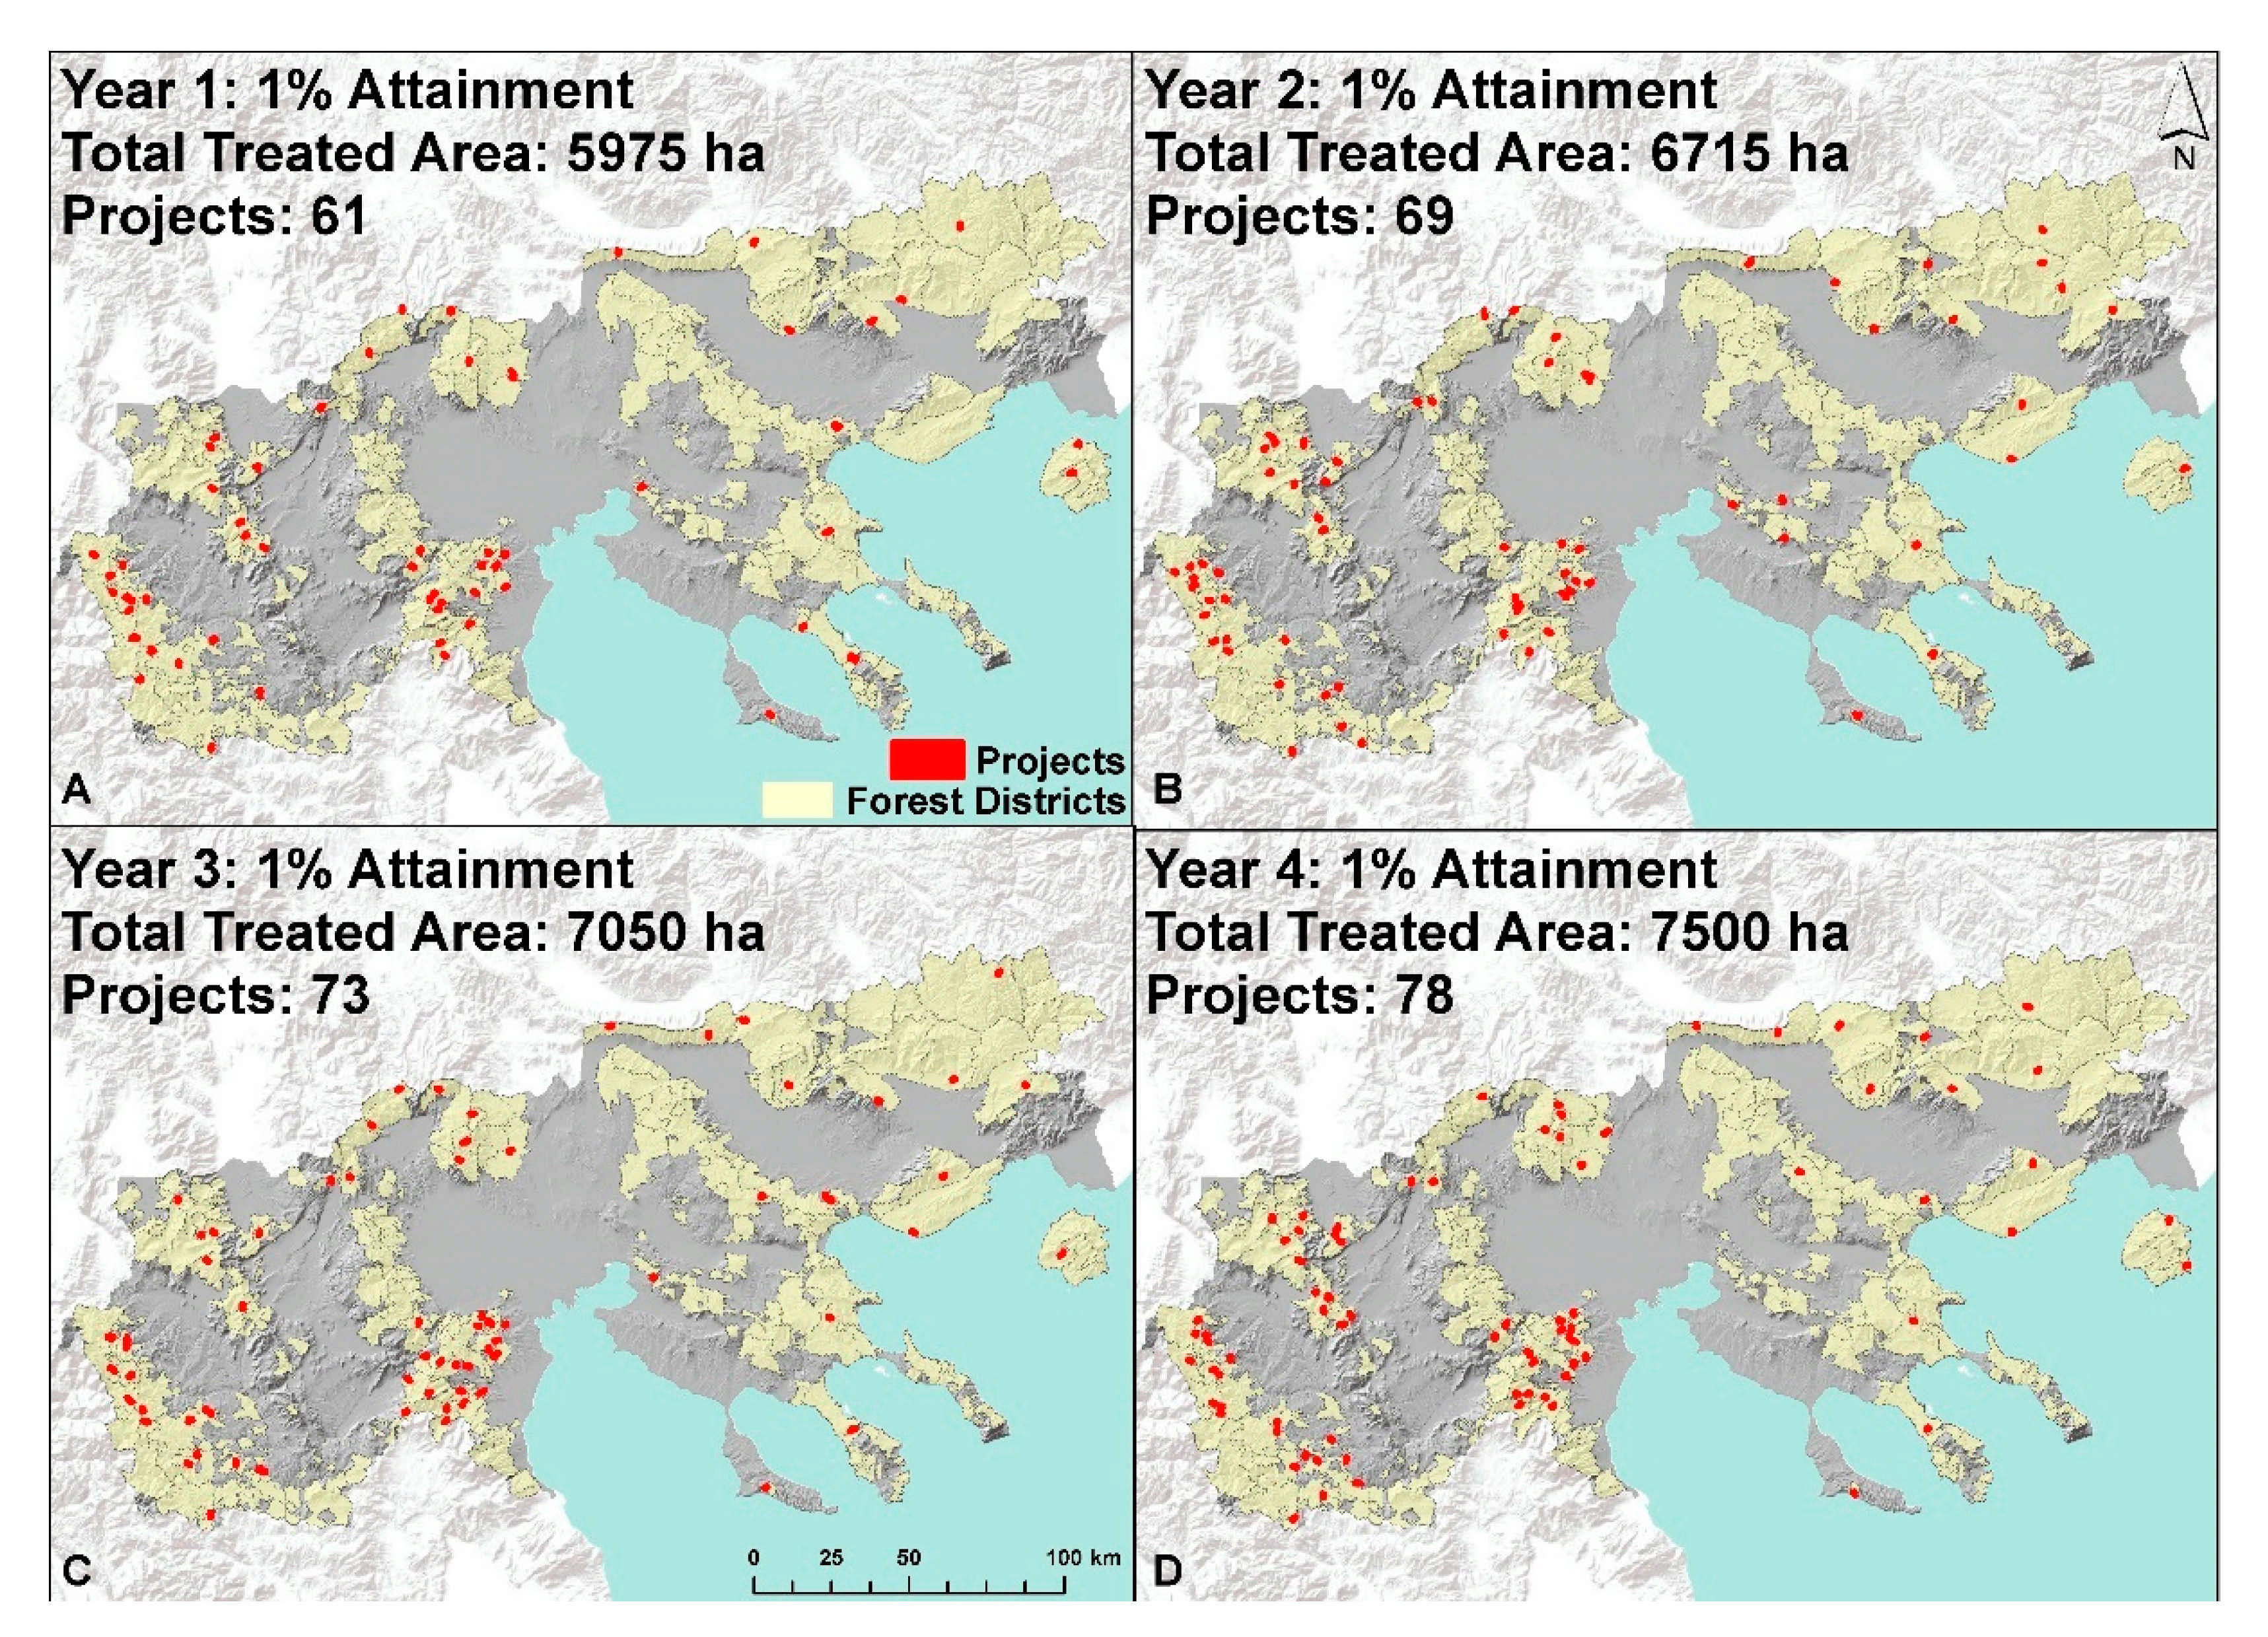
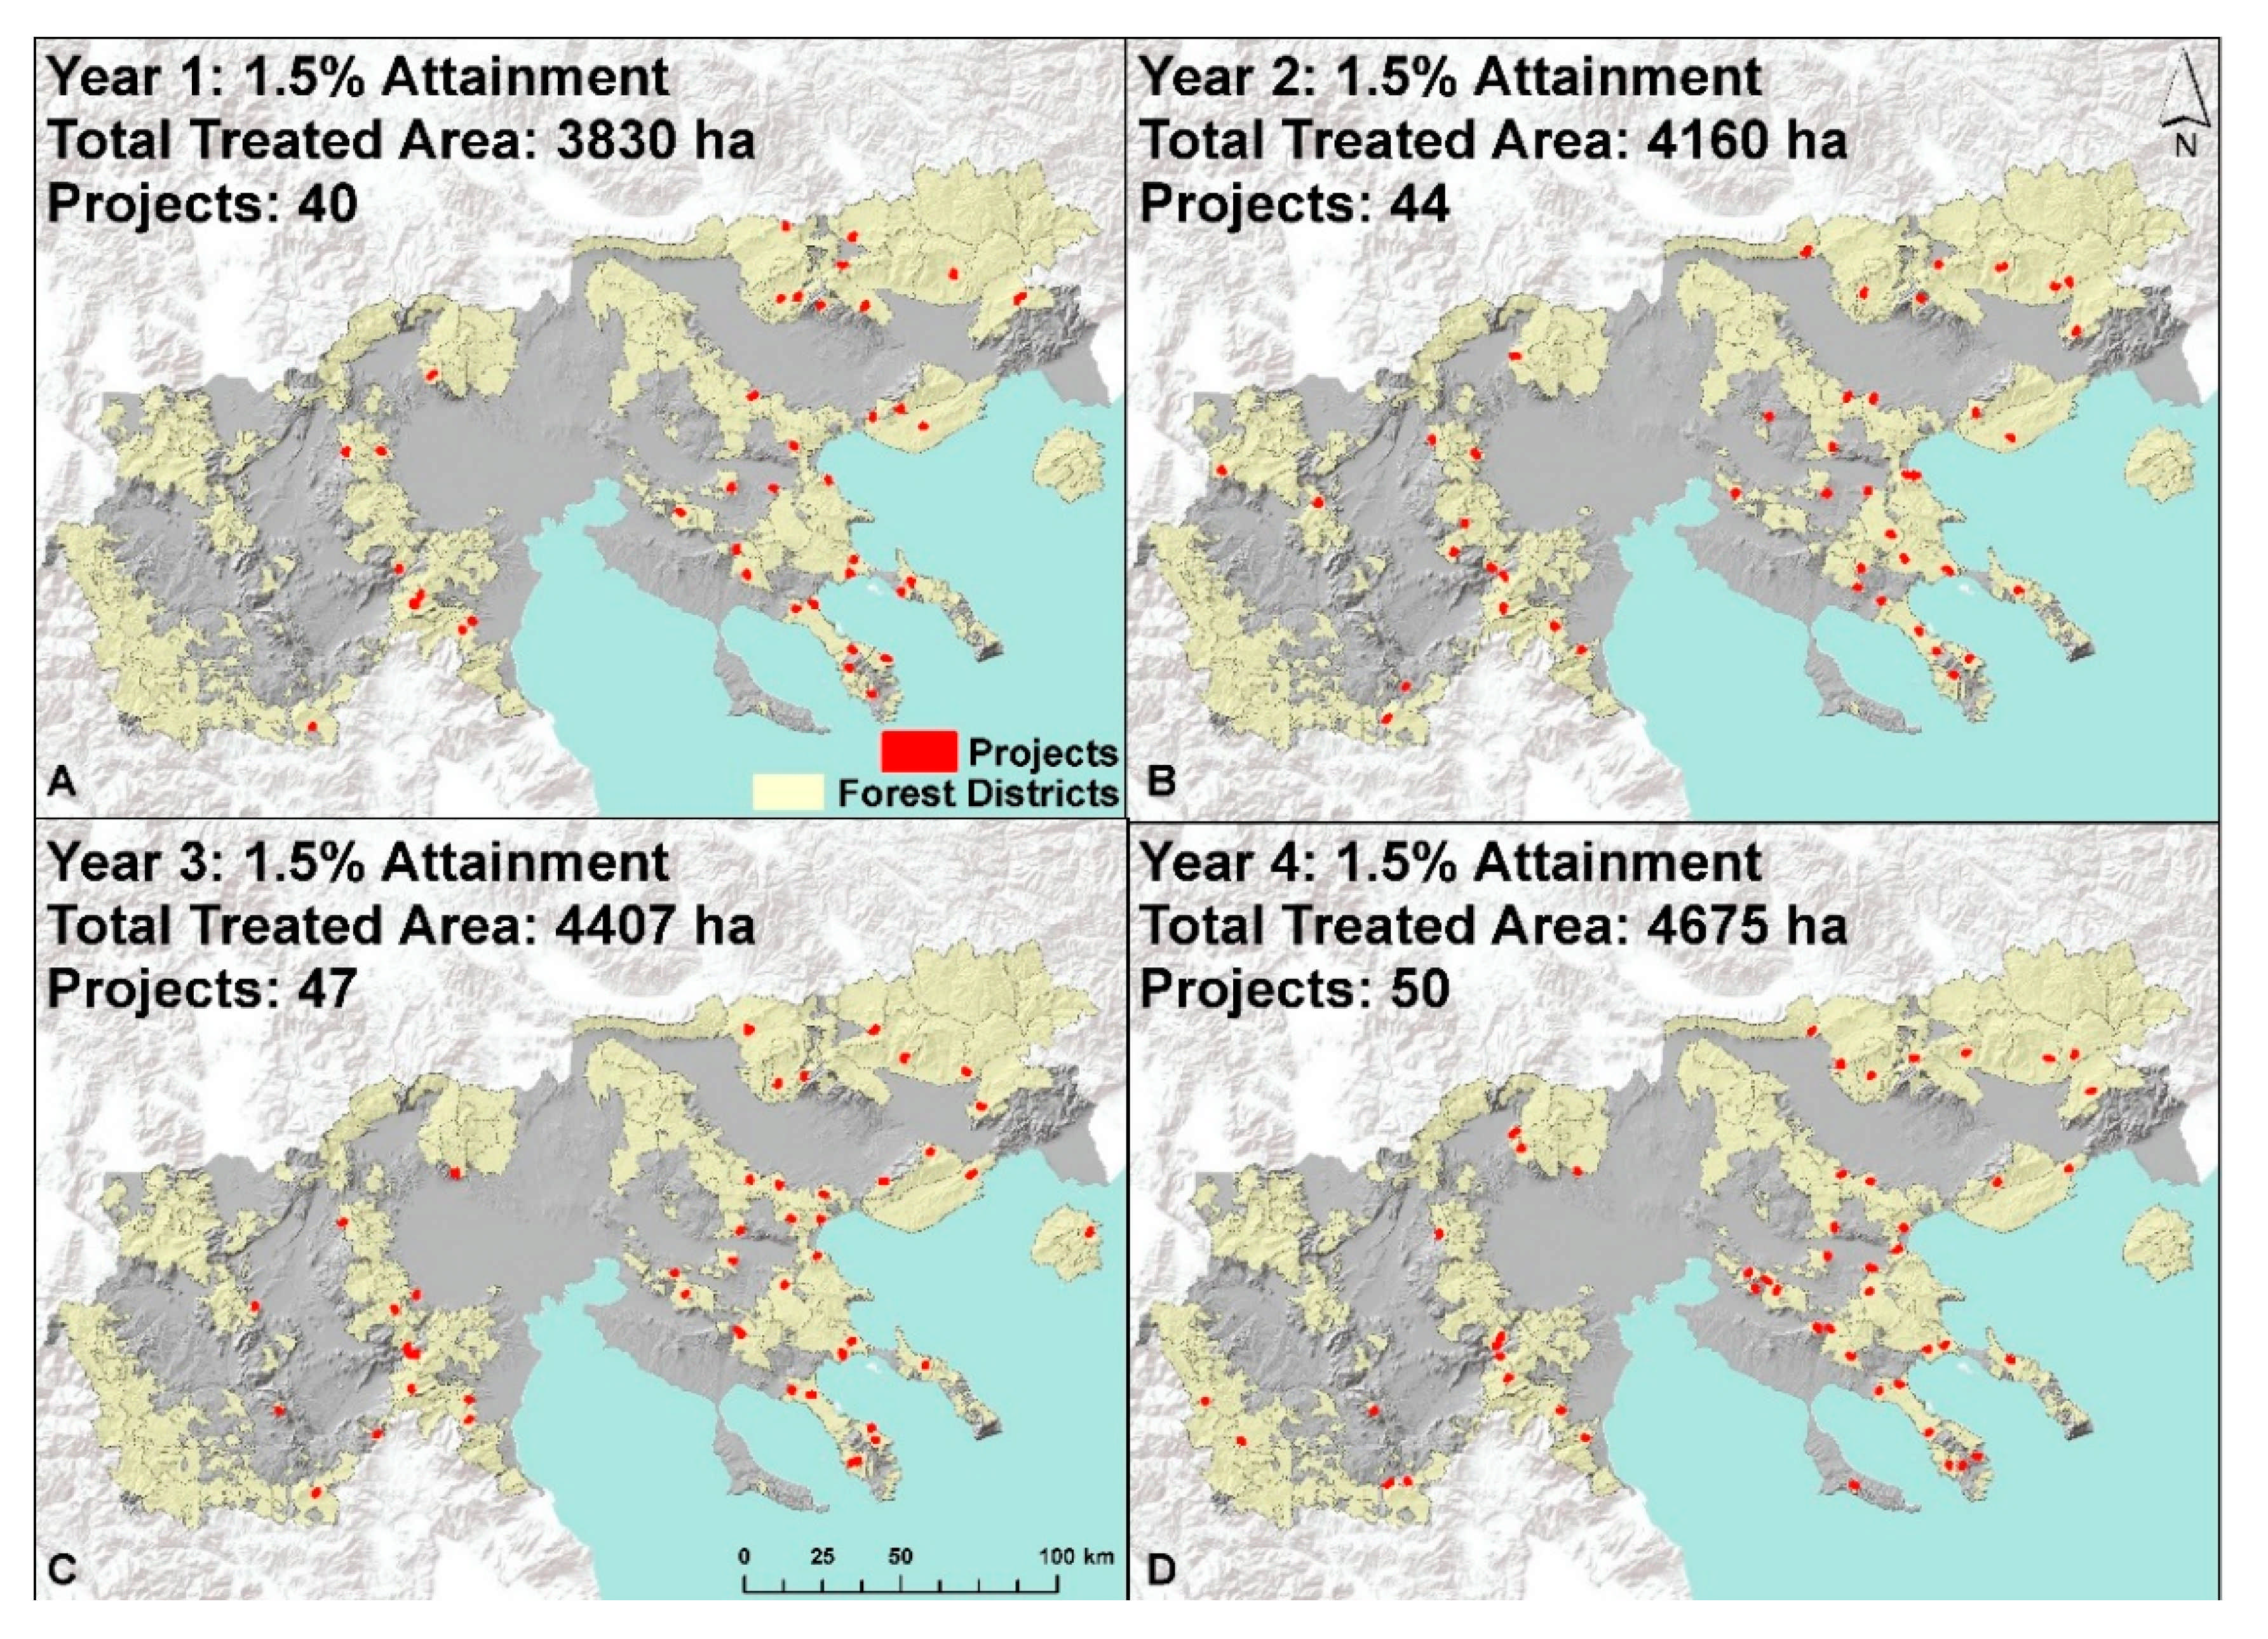
3.2. Scenario 2: Annual Treatments
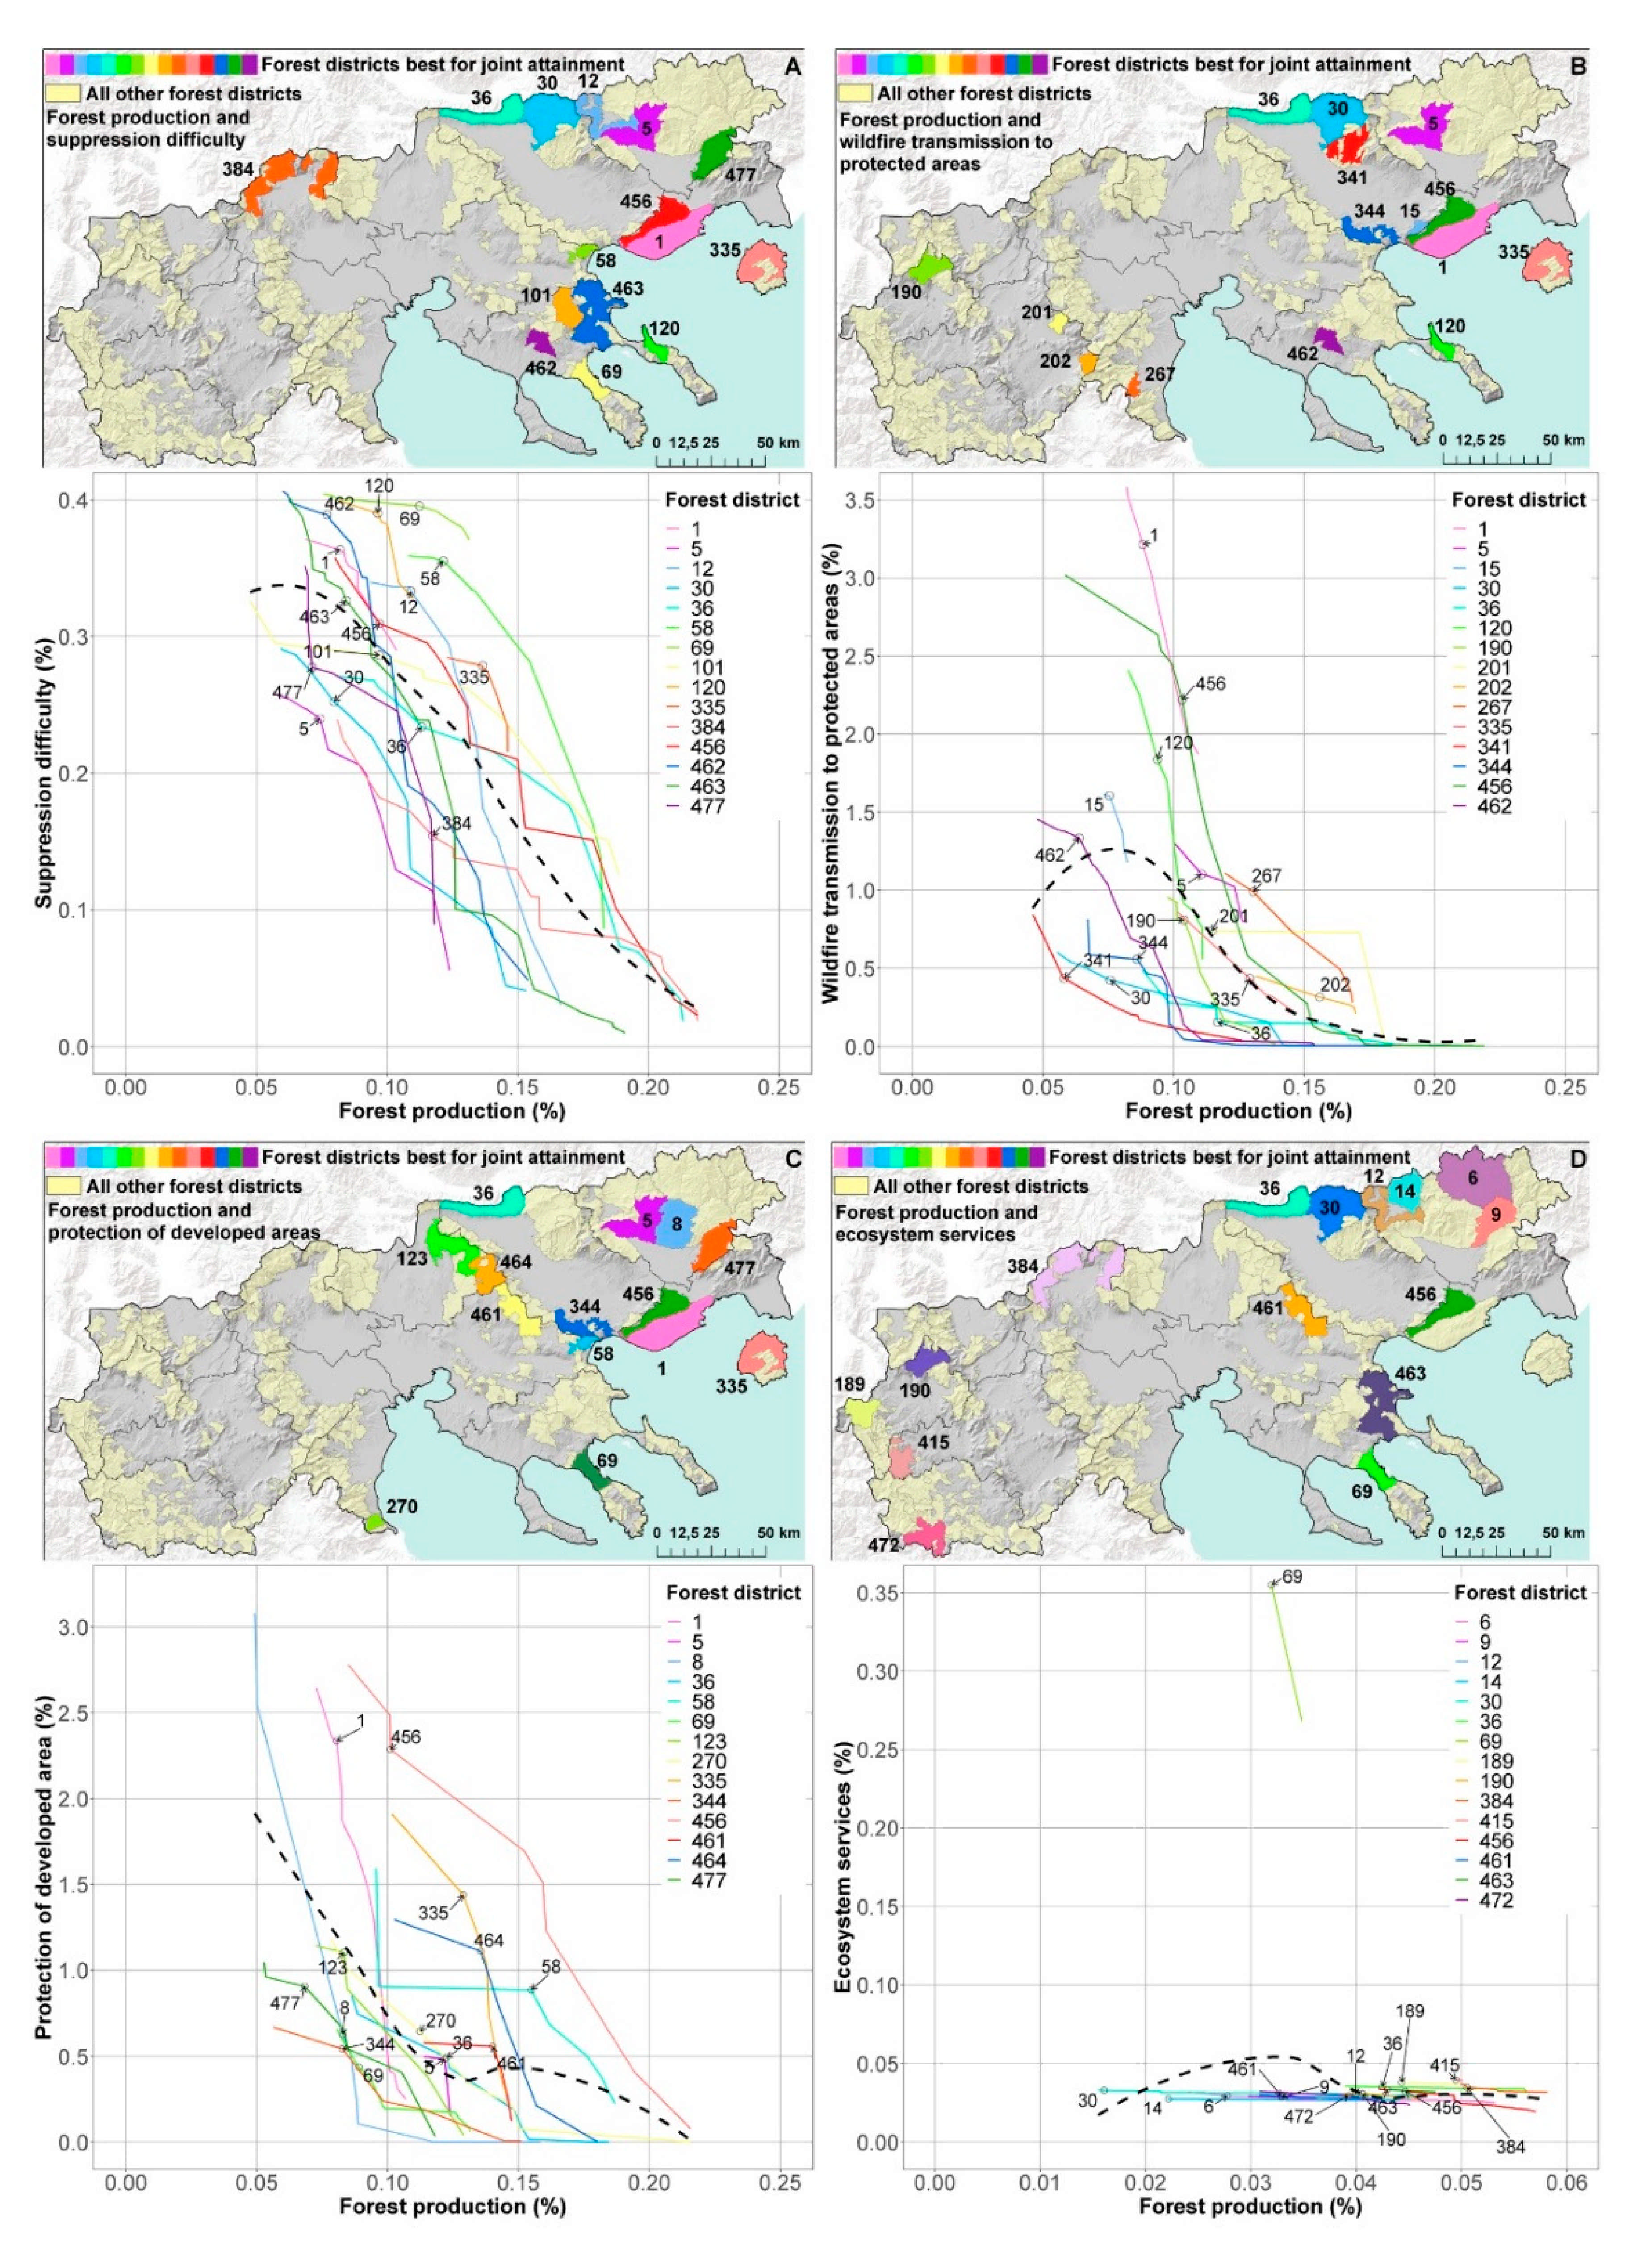
3.3. Scenario 3: Tradeoffs
4. Discussion
5. Conclusions
Author Contributions
Funding
Data Availability Statement
Acknowledgments
Conflicts of Interest
Appendix A


Appendix B

| Scenario | Priorities | Treatment Threshold and Restrictions | Number of Projects Per Priority | Area Treated Per Project | Admin. Unit | Postprocessing | Cumulative Attainment and Area Treated by Priority | Results for (2) in Postprocessing |
|---|---|---|---|---|---|---|---|---|
| Landscape prioritization | All 5 prioritized individually | >35 m3/ha growing stock volume; nontreated or disturbed; not protected | 100 | Up to 500 ha | None | (1) Ranked projects from lowest to highest attainment and mapped them (see Figure 2B–F). (2) Identified which stands were selected within each priority and examined how many priorities were met by each stand (see Figure 3A); for all stands with ≥2 priorities, we estimated the cumulative attainment for each priority. | P1: 47%, 43,000 ha; P2: 7.4%, 45,000 ha; P3: 5.4%, 45,300 ha; P4: 10%, 45,000 ha; P5: 36%, 44,300 ha | 722 stands: 2 priorities, 30,200 ha; 72 stands: 3 priorities, 2350 ha; P1: 16%, 15,800 ha; P2: 2.5%, 32,550 ha; P3: 3%, 32,550 ha; P4: 4.5%, 22,200 ha; P5: 16%, 19,000 ha |
| Forest district prioritization | All 5 prioritized individually | >35 m3/ha growing stock volume; nontreated or disturbed; not protected | 5 for each forest district | Up to 100 ha | Forest district (n = 290) | (1) Find projects until one-third of the attainment achieved by all simulated projects is treated; equal attainment treated for each of the four years; projects can be selected in any forest district, i.e., they do not need to be equally distributed across districts (Figure A1, Figure A2, Figure A3, Figure A4 and Figure A5). (2) Identified which stands were selected within each priority and after removing duplicates, and examined attainment achieved for each priority if all stands were treated (see Figure 6). | P1: 15%, 2195 ha, 34 projects; P2: 5%, 27,144 ha, 289 projects; P3: 4%, 27,250 ha, 281 projects; P4: 6%, 17,000 ha, 181 projects; P5: 16%, 6500 ha, 70 projects | Total area treated during the four-year treatment plan for all priorities is 77,350 ha. P1: 24%, 77,350 ha; P2: 9%, 77,350 ha; P3: 8.5%, 77,350 ha; P4: 11%, 77,350 ha; P5: 24%, 77,350 ha; |
| Forest district tradeoffs | Pairwise between volume and other four priorities (weights 0–4; step 1) | >35 m3/ha growing stock volume; nontreated or disturbed; not protected | Until forest district was fully treated | Up to 250 ha | Forest district (n = 290) | Selected the best 15 forest districts for each pairwise comparison; showed tradeoffs at forest district level; all points on each curve represent projects (see Figure 7). | Attainment was estimated at project level. P1: up to 3% P2: up to 0.25% P3: up to 0.35% P4: up to 0.4% P5: up to 3.5% | n/a |
Appendix C
| 2011 | 2012 | 2013 | 2014 | 2015 | 2016 | 2017 | 2018 | 2019 | 2020 | Sum | |
|---|---|---|---|---|---|---|---|---|---|---|---|
| Drama | 7744 | 8592 | 8592 | 10,412 | 13,951 | 15,289 | 10,269 | 11,694 | 13,845 | 13,557 | 113,944 |
| Serres | 5667 | 7641 | 7641 | 7641 | 3014 | 2917 | 3331 | 3223 | 3223 | 2902 | 47,199 |
| Imathia | 1133 | 1713 | 3262 | 3422 | 3853 | 4024 | 4332 | 4477 | 4712 | 4177 | 35,104 |
| Kastoria | 2602 | 2602 | 2629 | 2629 | 3527 | 4463 | 4577 | 4560 | 4596 | 2561 | 34,747 |
| Pella | 1935 | 2420 | 2711 | 2889 | 3590 | 3510 | 3407 | 3319 | 2667 | 2630 | 29,077 |
| Chalkidiki | 2787 | 2787 | 2787 | 2787 | 2668 | 2360 | 3130 | 2676 | 2984 | 2901 | 27,867 |
| Pieria | 816 | 998 | 1548 | 2622 | 2989 | 3268 | 3295 | 3592 | 4170 | 3877 | 27,176 |
| Kilkis | 2256 | 1846 | 1297 | 1297 | 2693 | 2514 | 2514 | 3409 | 3409 | 3409 | 24,644 |
| Grevena | 1068 | 1292 | 1325 | 1339 | 2608 | 3581 | 3636 | 3603 | 2841 | 2787 | 24,079 |
| Florina | 1187 | 1187 | 1461 | 1508 | 1946 | 2632 | 3313 | 3314 | 3354 | 2419 | 22,320 |
| Thessaloniki | 1585 | 1585 | 1718 | 1718 | 1718 | 397 | 397 | 242 | 242 | 242 | 9844 |
| Kavala | 426 | 426 | 483 | 483 | 483 | 483 | 779 | 971 | 1217 | 1217 | 6967 |
| Kozani | 149 | 149 | 440 | 440 | 786 | 786 | 786 | 826 | 949 | 920 | 6231 |
| Sum | 29,355 | 33,238 | 35,894 | 39,187 | 43,826 | 46,224 | 43,766 | 45,906 | 46,398 | 43,599 | 407,393 |
| 2011 | 2012 | 2013 | 2014 | 2015 | 2016 | 2017 | 2018 | 2019 | 2020 | Sum | |
|---|---|---|---|---|---|---|---|---|---|---|---|
| Drama | 83,807 | 87,634 | 87,634 | 96,649 | 114,099 | 125,715 | 80,930 | 76,678 | 105,180 | 100,969 | 959,295 |
| Serres | 57,577 | 90,406 | 90,406 | 90,406 | 50,041 | 48,901 | 50,885 | 49,728 | 49,728 | 43,155 | 621,233 |
| Kastoria | 50,980 | 50,980 | 51,699 | 51,699 | 66,425 | 77,187 | 77,902 | 68,781 | 69,413 | 37,002 | 602,068 |
| Imathia | 16,642 | 24,571 | 47,455 | 49,295 | 57,262 | 60,485 | 62,458 | 62,110 | 65,086 | 56,191 | 501,555 |
| Chalkidiki | 46,951 | 46,951 | 46,951 | 46,951 | 32,486 | 39,723 | 53,416 | 38,870 | 61,743 | 55,465 | 469,507 |
| Pieria | 16,506 | 17,215 | 27,221 | 43,528 | 54,258 | 55,608 | 56,177 | 59,857 | 64,631 | 60,738 | 455,739 |
| Pella | 25,338 | 33,012 | 40,732 | 45,031 | 50,311 | 49,322 | 49,644 | 49,324 | 41,955 | 40,715 | 425,384 |
| Florina | 20,706 | 20,706 | 30,775 | 31,598 | 37,937 | 47,350 | 62,171 | 62,167 | 59,727 | 46,260 | 419,397 |
| Kilkis | 27,785 | 25,986 | 21,139 | 21,139 | 34,053 | 33,187 | 33,187 | 40,782 | 40,782 | 40,782 | 318,822 |
| Grevena | 10,747 | 11,101 | 11,187 | 11,202 | 21,696 | 24,163 | 24,258 | 24,172 | 14,875 | 14,661 | 168,062 |
| Kozani | 1719 | 1719 | 13,547 | 13,547 | 17,651 | 17,651 | 17,651 | 18,869 | 20,392 | 19,650 | 142,396 |
| Kavala | 8416 | 8416 | 8996 | 8996 | 8996 | 8996 | 11,251 | 17,092 | 20,238 | 20,238 | 121,635 |
| Thessaloniki | 15,236 | 15,236 | 17,630 | 17,630 | 17,630 | 3309 | 3309 | 2855 | 2855 | 2855 | 98,545 |
| Sum | 382,410 | 433,933 | 495,372 | 527,671 | 562,845 | 591,597 | 583,239 | 571,285 | 616,605 | 538,681 | 5,303,638 |
References
- Spanos, K.; Gaitanis, D.; Skouteri, A.; Petrakis, P.; Meliadis, I. Implementation of Forest Policy in Greece in Relation to Biodiversity and Climate Change. Open J. Ecol. 2018, 8, 174–191. [Google Scholar] [CrossRef][Green Version]
- Papanastasis, V.P.; Mantzanas, K.; Dini-Papanastasi, O.; Ispikoudis, I. Traditional Agroforestry Systems and Their Evolution in Greece. In Agroforestry in Europe: Current Status and Future Prospects; Rigueiro-Rodróguez, A., McAdam, J., Mosquera-Losada, M.R., Eds.; Springer: Dordrecht, The Netherlands, 2009; pp. 89–109. [Google Scholar]
- Papageorgiou, K.; Vakrou, A.; Trakolis, D.; Malamidis, G. GREECE: Sustainable Forest Management and the challenge ahead for Greek state forestry. In Forests for the Future: National Forest Programmes in Europe; Humphreys, D., Ed.; European Cooperation in the Field of Scientific and Technical Research (COST): Luxembourg, 2004; Volume EUR 21364 EN, pp. 127–142. [Google Scholar]
- Keane, R.E.; Agee, J.K.; Fulé, P.; Keeley, J.E.; Key, C.; Kitchen, S.G.; Miller, R.; Schulte, L.A. Ecological effects of large fires on US landscapes: Benefit or catastrophe? Int. J. Wildland Fire 2008, 17, 696–712. [Google Scholar] [CrossRef]
- Moritz, M.A.; Batllori, E.; Bradstock, R.A.; Gill, A.M.; Handmer, J.; Hessburg, P.F.; Leonard, J.; McCaffrey, S.; Odion, D.C.; Schoennagel, T.; et al. Learning to coexist with wildfire. Nat. Cell Biol. 2014, 515, 58–66. [Google Scholar] [CrossRef] [PubMed]
- Ager, A.A.; Vogler, K.C.; Day, M.A.; Bailey, J.D. Economic Opportunities and Trade-Offs in Collaborative Forest Landscape Restoration. Ecol. Econ. 2017, 136, 226–239. [Google Scholar] [CrossRef]
- USDA Forest Service. National Cohesive Wildland Fire Management Strategy. Available online: http://www.forestsandrangelands.gov/strategy/index.shtml (accessed on 21 April 2021).
- Forest Europe. State of Europe’s Forests 2020; Ministerial Conference on the Protection of Forests in Europe: Bratislava, Slovakia, 2020. [Google Scholar]
- Hellenic Parliament. The Constitution of Greece. Available online: https://www.hellenicparliament.gr/en/Vouli-ton-Ellinon/To-Politevma/Syntagma/ (accessed on 21 May 2021).
- Kingdom of Greece. Legislative Decree No 86/1969. Available online: https://www.kodiko.gr/nomothesia/document/524554/n.d.-86-1969 (accessed on 27 May 2021).
- Hellenic Republic. Law No 998/1979. Available online: https://www.kodiko.gr/nomothesia/document/302789 (accessed on 27 May 2021).
- Hellenic Republic. Law No 1734/1987. Available online: https://www.kodiko.gr/nomothesia/document/266094 (accessed on 27 May 2021).
- Kingdom of Greece. Administrative Regulation No 120094/499/1937, Regulation Order of the Ministry of Agriculture. Available online: https://www.e-nomothesia.gr/inner.php/kat-dasos-thera/upourgike-apophase-166780-1619-2018.html?print=1 (accessed on 27 May 2021).
- Kingdom of Greece. Administrative Regulation No 10223/958/1953, Regulation of the Creation of Management Plans for Public and Non-Public Forests. Available online: https://www.kodiko.gr/nomothesia/document/687049 (accessed on 27 May 2021).
- The Council of The European Communities. Council Directive 92/43/EEC. Available online: https://eur-lex.europa.eu/legal-content/EN/TXT/?uri=CELEX:31992L0043 (accessed on 21 May 2021).
- European Parliament. Directive 2009/147/EC. Available online: https://eur-lex.europa.eu/legal-content/EN/TXT/?uri=CELEX%3A32009L0147 (accessed on 21 May 2021).
- Hellenic Republic. Common Ministerial Decision No 8353/276/Ε103. Available online: https://ypen.gov.gr/wp-content/uploads/legacy/Files/Perivallon/Diaxeirisi%20Fysikoy%20Perivallontos/Nomothesia/Tropopoiisi.pdf (accessed on 21 May 2021).
- Hellenic Republic. Ministerial Decisions 170195/758/2018. Available online: https://www.e-nomothesia.gr/kat-dasos-thera/upourgike-apophase-170195-758-2018.html (accessed on 27 May 2021).
- Hellenic Republic. Ministerial Decisions 12030/109.1/19-5-1999. Available online: https://www.e-nomothesia.gr/inner.php/kat-pyrkagies-emprismoi-purosbestiko-soma/purosbestiko-soma/kya-12030-f-109-1-1999.html?print=1 (accessed on 27 May 2021).
- Palaiologou, P.; Kalabokidis, K.; Ager, A.A.; Day, M.A. Development of Comprehensive Fuel Management Strategies for Reducing Wildfire Risk in Greece. Forests 2020, 11, 789. [Google Scholar] [CrossRef]
- Ager, A.A.; Vaillant, N.; Owens, D.E.; Brittain, S.; Hamann, J. Overview and Example Application of the Landscape Treatment Designer; PNW-GTR-859; USDA Forest Service, Pacific Northwest Research Station: Portland, OR, USA, 2012; p. 11. [Google Scholar]
- Baltas, E. Spatial distribution of climatic indices in northern Greece. Meteorol. Appl. 2007, 14, 69–78. [Google Scholar] [CrossRef]
- EEA. Corine Land Cover (CLC) 2018, Version 2020_20u1. 2018. Available online: https://land.copernicus.eu/pan-european/corine-land-cover (accessed on 21 April 2021).
- Kalabokidis, K.; Palaiologos, P.; Xanthopoulos, G. Pyro-geography of the Greek landscape. In The Geography of Greece: Managing Crises and Building Resilience; Darques, R., Ed.; Springer: Dordrecht, The Netherlands, In Press.
- Christopoulou, O.G. Deforestation/Reforestation in Mediterranean Europe: The case of Greece. In Soil Erosion Studies; Godone, D., Ed.; InTech: Rijeka, Croatia, 2011; pp. 41–58. [Google Scholar]
- Koutsias, N.; Arianoutsou, M.; Kallimanis, A.S.; Mallinis, G.; Halley, J.M.; Dimopoulos, P. Where did the fires burn in Peloponnisos, Greece the summer of 2007? Evidence for a synergy of fuel and weather. Agric. For. Meteorol. 2012, 156, 41–53. [Google Scholar] [CrossRef]
- Kalabokidis, K.; Palaiologou, P.; Gerasopoulos, E.; Giannakopoulos, C.; Kostopoulou, E.; Zerefos, C. Effect of Climate Change Projections on Forest Fire Behavior and Values-at-Risk in Southwestern Greece. Forests 2015, 6, 2214–2240. [Google Scholar] [CrossRef]
- Kailidis, D.; Karanikola, P. Forest Fires 1900–2000; Giahoudi Publications: Thessaloniki, Greece, 2004; p. 434. (In Greek) [Google Scholar]
- Ager, A.A.; Evers, C.R.; Day, M.A.; Houtman, R.; Alcasena, F.J. Planning for future fire: Scenario analysis of an accelerated fuel reduction plan for the western United States. Landsc. Urban Plan. In review.
- Hansen, M.C.; Potapov, P.V.; Moore, R.; Hancher, M.; Turubanova, S.A.; Tyukavina, A.; Thau, D.; Stehman, S.V.; Goetz, S.J.; Loveland, T.R.; et al. High-resolution global maps of 21st-century forest cover change. Science 2013, 342, 850–853. [Google Scholar] [CrossRef]
- Santoro, M.; Cartus, O.; Carvalhais, N.; Rozendaal, D.; Avitabilie, V.; Araza, A.; de Bruin, S.; Herold, M.; Quegan, S.; Rodríguez Veiga, P. The global forest above-ground biomass pool for 2010 estimated from high-resolution satellite observations. Earth Syst. Sci. Data Discuss. 2020, 1–38. [Google Scholar] [CrossRef]
- Finney, M.A. Fire growth using minimum travel time methods. Can. J. For. Res. 2002, 32, 1420–1424. [Google Scholar] [CrossRef]
- Ager, A.A.; Evers, C.R.; Day, M.A.; Preisler, H.K.; Barros, A.M.G.; Nielsen-Pincus, M. Network analysis of wildfire transmission and implications for risk governance. PLoS ONE 2017, 12, e0172867. [Google Scholar] [CrossRef] [PubMed]
- Palaiologou, P.; Kalabokidis, K.; Papalampros, L.; Galatsidas, S. Simulating Large-Scale Wildfires and Community Exposure: A Framework and Application in Macedonia, Greece. In 20th International Scientific Conference on Earth and Planetary Sciences SGEM Vienna Green 2020; Surveying Geology & Mining Ecology Management (SGEM): Vienna, Austria, 2020; Volume 20, pp. 339–350. [Google Scholar] [CrossRef]
- Metzger, M.J.; Bunce, R.G.H.; Jongman, R.H.G.; Mücher, C.A.; Watkins, J.W. A climatic stratification of the environment of Europe. Glob. Ecol. Biogeogr. 2005, 14, 549–563. [Google Scholar] [CrossRef]
- Alcasena, F.J.; Ager, A.A.; Bailey, J.D.; Pineda, N.; Vega-García, C. Towards a comprehensive wildfire management strategy for Mediterranean areas: Framework development and implementation in Catalonia, Spain. J. Environ. Manag. 2019, 231, 303–320. [Google Scholar] [CrossRef]
- Abatzoglou, J.T.; Balch, J.K.; Bradley, B.A.; Kolden, C.A. Human-related ignitions concurrent with high winds promote large wildfires across the USA. Int. J. Wildland Fire 2018, 27, 377. [Google Scholar] [CrossRef]
- Palaiologou, P.; Ager, A.A.; Nielsen-Pincus, M.; Evers, C.R.; Kalabokidis, K. Using transboundary wildfire exposure assessments to improve fire management programs: A case study in Greece. Int. J. Wildland Fire 2018, 27, 501. [Google Scholar] [CrossRef]
- Kazana, V.; Kazaklis, A. Country Situations: Greece. In Valuing Mediterranean Forests-Towards total Economic Value; Merlo, M., Croitoru, L., Eds.; CABI Publishing: Cambridge, MA, USA, 2005; pp. 229–240. [Google Scholar]
- Santoro, M. GlobBiomass—Global datasets of forest biomass. PANGAEA 2018, 1594. [Google Scholar] [CrossRef]
- Palaskas, D.; Xanthopoulos, G.; Albanis, K.; Skouteri, A. Geographic variation of forested ecosystems value in Greece using geospatial data. In Proceedings of the Role of Modern Forestry and Protected Areas in Sustainable Development, Kefalonia, Greece, 4–7 October 2015. [Google Scholar]
- Albanis, K.; Xanthopoulos, G.; Skouteri, A.; Theodoridis, N.; Christodoulou, A.; Palaskas, D. A Methodology for the Estimation of Forested Land Value in Greece; Institute of Mediterranean Forested Ecosystems: Athens, Greece, 2018; p. 201. [Google Scholar]
- Alexander, M.E.; Cruz, M.G. Interdependencies between flame length and fireline intensity in predicting crown fire initiation and crown scorch height. Int. J. Wildland Fire 2012, 21, 95–113. [Google Scholar] [CrossRef]
- Murphy, P.J.; Woodard, P.M.; Quintilio, D.; Titus, S.J. Exploratory analysis of the variables affecting initial attack hot-spotting containment rate. Can. J. For. Res. 1991, 21, 540–544. [Google Scholar] [CrossRef]
- Ager, A.A.; Vaillant, N.M.; Mcmahan, A. Restoration of fire in managed forests: A model to prioritize landscapes and analyze tradeoffs. Ecosphere 2013, 4, 1–19. [Google Scholar] [CrossRef]
- Ager, A.A.; Day, M.A.; Vogler, K. Production possibility frontiers and socioecological tradeoffs for restoration of fire adapted forests. J. Environ. Manag. 2016, 176, 157–168. [Google Scholar] [CrossRef]
- Alcasena, F.J.; Ager, A.A.; Salis, M.; Day, M.A.; Vega-Garcia, C. Optimizing prescribed fire allocation for managing fire risk in central Catalonia. Sci. Total. Environ. 2018, 621, 872–885. [Google Scholar] [CrossRef]
- Salis, M.; Laconi, M.; Ager, A.A.; Alcasena, F.J.; Arca, B.; Lozano, O.; de Oliveira, A.F.; Spano, D. Evaluating alternative fuel treatment strategies to reduce wildfire losses in a Mediterranean area. For. Ecol. Manag. 2016, 368, 207–221. [Google Scholar] [CrossRef]
- Botequim, B.; Ager, A.; Pacheco, A.P.; Oliveira, T.; Claro, J.; Fernandes, P.M.; Borges, J.G. Addressing trade-offs among fuel management scenarios through a dynamic and spatial integrated approach for enhanced decision-making in eucalyptus forest. In Advances in Forest Fire Research; Viegas, D.X., Ed.; Coimbra University Press: Coimbra, Portugal, 2014; pp. 1623–1627. [Google Scholar]
- Vogler, K.C.; Ager, A.A.; Day, M.A.; Jennings, M.; Bailey, J.D. Prioritization of Forest Restoration Projects: Tradeoffs between Wildfire Protection, Ecological Restoration and Economic Objectives. Forests 2015, 6, 4403–4420. [Google Scholar] [CrossRef]
- Ager, A.A.; Houtman, R.M.; Day, M.A.; Ringo, C.; Palaiologou, P. Tradeoffs between US national forest harvest targets and fuel management to reduce wildfire transmission to the wildland urban interface. For. Ecol. Manag. 2019, 434, 99–109. [Google Scholar] [CrossRef]
- Finney, M.A. A computational method for optimizing fuel treatment location. Int. J. Wildland Fire 2007, 16, 702–711. [Google Scholar] [CrossRef]
- Pohjanmies, T.; Eyvindson, K.; Mönkkönen, M. Forest management optimization across spatial scales to reconcile economic and conservation objectives. PLoS ONE 2019, 14, e0218213. [Google Scholar] [CrossRef]
- Schroder, S.A.K.; Tóth, S.F.; Deal, R.L.; Ettl, G.J. Multi-objective optimization to evaluate tradeoffs among forest ecosystem services following fire hazard reduction in the Deschutes National Forest, USA. Ecosyst. Serv. 2016, 22, 328–347. [Google Scholar] [CrossRef]
- Triviño, M.; Pohjanmies, T.; Mazziotta, A.; Juutinen, A.; Podkopaev, D.; Le Tortorec, E.; Mönkkönen, M. Optimizing management to enhance multifunctionality in a boreal forest landscape. J. Appl. Ecol. 2016, 54, 61–70. [Google Scholar] [CrossRef]
- Barnett, K.; Parks, S.A.; Miller, C.; Naughton, H.T. Beyond Fuel Treatment Effectiveness: Characterizing Interactions between Fire and Treatments in the US. Forests 2016, 7, 237. [Google Scholar] [CrossRef]
- Graham, R.T.; Jain, T.B.; Matthews, S. Fuel management in forests of the Inland West. In Cumulative Watershed Effects of Fuel Management in the Western United States; Elliot, W.J., Miller, I.S., Audin, L., Eds.; USDA Forest Service, Rocky Mountain Research Station: Fort Collins, CO, USA, 2010; pp. 19–68. [Google Scholar]
- Jain, T.B.; Battaglia, M.A.; Han, H.-S.; Graham, R.T.; Keyes, C.R.; Fried, J.S.; Sandquist, J.E. A Comprehensive Guide to Fuel Management Practices for Dry Mixed Conifer Forests in the Northwestern United States; RMRS-GTR-292; U. S. Department of Agriculture, Forest Service: Fort Collins, CO, USA, 2012; p. 331. [Google Scholar]
- Kalies, E.L.; Kent, L.L.Y. Tamm Review: Are fuel treatments effective at achieving ecological and social objectives? A systematic review. For. Ecol. Manag. 2016, 375, 84–95. [Google Scholar] [CrossRef]
- Palaiologou, P.; Kalabokidis, K.; Troumbis, A.; Day, M.; Nielsen-Pincus, M.; Ager, A. Socio-Ecological Perceptions of Wildfire Management and Effects in Greece. Fire 2021, 4, 18. [Google Scholar] [CrossRef]
- Finney, M.A. Landscape Fire Simulation and Fuel Treatment Optimization. In Methods for Integrated Modeling of Landscape Change: Interior Northwest Landscape Analysis, System; Hayes, J.L., Ager, A.A., Barbour, J.R., Eds.; U.S. Department of Agriculture: Portland, OR, USA, 2004; Chapter 9; pp. 117–131. [Google Scholar]
- Salis, M.; Del Giudice, L.; Arca, B.; Ager, A.A.; Alcasena-Urdiroz, F.; Lozano, O.; Bacciu, V.; Spano, D.; Duce, P. Modeling the effects of different fuel treatment mosaics on wildfire spread and behavior in a Mediterranean agro-pastoral area. J. Environ. Manag. 2018, 212, 490–505. [Google Scholar] [CrossRef]
- Barros, A.M.G.; Ager, A.; Day, M.; Palaiologou, P. Improving long-term fuel treatment effectiveness in the National Forest System through quantitative prioritization. For. Ecol. Manag. 2019, 433, 514–527. [Google Scholar] [CrossRef]
- Oliveira, T.M.; Barros, A.M.G.; Ager, A.A.; Fernandes, P.M. Assessing the effect of a fuel break network to reduce burnt area and wildfire risk transmission. Int. J. Wildland Fire 2016, 25, 619–632. [Google Scholar] [CrossRef]
- Moriarti, K.; Okeson, L.; Pellant, M. Fuel Breaks That Work; BLM: Boise, ID, USA, 2015; Available online: https://www.sagegrouseinitiative.com/wp-content/uploads/2015/07/5_GBFS_Fuel-Breaks.pdf (accessed on 27 May 2021).
- Scheller, R.M.; Mladenoff, D.J. A forest growth and biomass module for a landscape simulation model, LANDIS: Design, validation, and application. Ecol. Model. 2004, 180, 211–229. [Google Scholar] [CrossRef]
- Keane, R.E.; Loehman, R.A.; Holsinger, L.M. The FireBGCv2 Landscape Fire and Succession Model: A Research Simulation Platform for Exploring Fire and Vegetation Dynamics; RMRS-GTR-255; USDA Forest Service, Rocky Mountain Research Station: Fort Collins, CO, USA, 2011. [Google Scholar]
- Olabarria, J.R.G.; Reynolds, K.M.; Larrañaga, A.; Garcia-Gonzalo, J.; Busquets, E.; Pique, M. Strategic and tactical planning to improve suppression efforts against large forest fires in the Catalonia region of Spain. For. Ecol. Manag. 2019, 432, 612–622. [Google Scholar] [CrossRef]
- Oliveira, S.; Gonçalves, A.; Benali, A.; Sá, A.; Zêzere, J.L.; Pereira, J.M. Assessing Risk and Prioritizing Safety Interventions in Human Settlements Affected by Large Wildfires. Forests 2020, 11, 859. [Google Scholar] [CrossRef]
- Quilez, R.; Valbuena, L.; Vendrell, J.; Uytewaal, K.; Ramirez, J. Establishing Propagation Nodes as a Basis for Preventing LargeWildfires: The Proposed Methodology. Front. For. Glob. Chang. 2020, 3, 548799. [Google Scholar] [CrossRef]
- Costa, P.; Castellnou, M.; Larrañaga, A.; Miralles, M.; Daniel, K. Prevention of Large Wildfires Using the Fire Types Concept; del Graf, U.T., Ed.; Cerdanyola del Vallès: Barcelona, Spain, 2011. [Google Scholar]


Publisher’s Note: MDPI stays neutral with regard to jurisdictional claims in published maps and institutional affiliations. |
© 2021 by the authors. Licensee MDPI, Basel, Switzerland. This article is an open access article distributed under the terms and conditions of the Creative Commons Attribution (CC BY) license (https://creativecommons.org/licenses/by/4.0/).
Share and Cite
Palaiologou, P.; Kalabokidis, K.; Ager, A.A.; Galatsidas, S.; Papalampros, L.; Day, M.A. Spatial Optimization and Tradeoffs of Alternative Forest Management Scenarios in Macedonia, Greece. Forests 2021, 12, 697. https://doi.org/10.3390/f12060697
Palaiologou P, Kalabokidis K, Ager AA, Galatsidas S, Papalampros L, Day MA. Spatial Optimization and Tradeoffs of Alternative Forest Management Scenarios in Macedonia, Greece. Forests. 2021; 12(6):697. https://doi.org/10.3390/f12060697
Chicago/Turabian StylePalaiologou, Palaiologos, Kostas Kalabokidis, Alan A. Ager, Spyros Galatsidas, Lampros Papalampros, and Michelle A. Day. 2021. "Spatial Optimization and Tradeoffs of Alternative Forest Management Scenarios in Macedonia, Greece" Forests 12, no. 6: 697. https://doi.org/10.3390/f12060697
APA StylePalaiologou, P., Kalabokidis, K., Ager, A. A., Galatsidas, S., Papalampros, L., & Day, M. A. (2021). Spatial Optimization and Tradeoffs of Alternative Forest Management Scenarios in Macedonia, Greece. Forests, 12(6), 697. https://doi.org/10.3390/f12060697