Article

Drought Affected Ecosystem Water Use Efficiency of a Natural Oak Forest in Central China

1
Institute of Forest Resource Information Techniques, Chinese Academy of Forestry, Beijing 100091, China
2
Key Laboratory of Forest Ecology and Environment of National Forestry and Grassland Administration, Research Institute of Forest Ecology, Environment and Protection, Chinese Academy of Forestry, No. 2 Dongxiaofu, Haidian District, Beijing 100091, China
*
Author to whom correspondence should be addressed.
Forests 2021, 12(7), 839; https://doi.org/10.3390/f12070839
Submission received: 9 May 2021 / Revised: 17 June 2021 / Accepted: 18 June 2021 / Published: 25 June 2021

Abstract

:
Global climate models project more frequent drought events in Central China. However, the effect of seasonal drought on ecosystem water use efficiency (WUE) and water regulation strategy in Central China’s natural forests is poorly understood. This study investigated variations in WUE associated with drought in a natural oak (Quercus aliena) forest in Central China from 2017 to 2020 at several timescales based on continuous CO2 and water vapor flux measurements. Results showed that the 4-year mean gross ecosystem production (GEP), evapotranspiration (ET) and WUE of the natural oak forest was 1613.2 ± 116 g Cm−2, 637.8 ± 163.3 mm and 2.6 ± 0.68 g Ckg−1 H2O, with a coefficient of variation (CV) of 7.2%, 25.6% and 26.4%, respectively. The inter-annual variation in WUE was large, primarily due to the variation in ET caused by seasonal drought. Drought increased WUE distinctly in summer and decreased it slightly in autumn. During summer drought, surface conductance (gs) usually decreased with an increase in VPD, but the ratios of stomatal sensitivity (m) and reference conductance (gsref) were 0.21 and 0.3 molm−2s−1ln(kPa)−1 in the summer of 2019 and 2020. Strong drought can also affect ecosystem WUE and water regulation strategy in the next year. Decrease in precipitation in spring increased annual WUE. These results suggested that drought in different seasons had different effects on ecosystem WUE. Overall, our findings suggest that the natural oak forest did not reduce GEP by increasing WUE (i.e., reducing ET) under spring and summer drought, which could be due to its typical anisohydric characteristics, although it can also reduce stomatal opening during long-term drought.

1. Introduction

Seasonal drought events are expected to occur more frequently over the next few decades in the mid and high latitudes because of global climate change [1]. A widespread summer drought affected ecosystems in 13 provinces in southern China in 2013 [2,3]. While not all droughts are extreme and extensive, a moderate drought event can also affect the structure and function of terrestrial ecosystems, even in areas that are not considered water-limited [4,5]. Water and carbon fluxes are important properties of ecosystem processes and functions [6]. Forests, with the largest biomass accumulation in terrestrial ecosystems, have the greatest effect on the exchange of carbon and water between the land and the atmosphere [7]. In addition, natural forests account for 93% (3.5 billion ha) of the forest area worldwide [8]. To abate climate change, efforts are being made around the world to protect natural forests, which can absorb more carbon with lower water consumption. Natural forests contribute to 64% of the total forest area [9], and the Natural Forest Conservation Program (NFCP) has been implemented since 1998 in China [10]. However, increased seasonal drought events can affect carbon sequestration and water consumption of these forests [11]. Consequently, the effect of seasonal drought on coupled processes between carbon and water fluxes in forest ecosystems has received more attention [12,13].
Ecosystem water use efficiency (WUE) is an important eco-physiological indicator that can be used to express the carbon–water coupling relationship [14,15]. It is commonly defined as the ratio of gross ecosystem productivity (GEP) to evapotranspiration (ET) [16]. Temporal variations of forest ecosystem WUE are regulated by many biological and environmental factors. These biophysical factors include surface conductance (gs) [17], enhanced vegetation index (EVI) [18], air temperature (Ta) [19], soil moisture [20], photosynthetically active radiation (PAR) [21], and vapor pressure deficit (VPD) [22]. Under frequent seasonal droughts in Central China, the response of forest ecosystem WUE to drought has aroused wide concern [23]. Nevertheless, the effect of seasonal drought on forest ecosystem WUE is still controversial. Some reports suggested that seasonal drought had a positive impact on forest ecosystem WUE [24,25], while others found it did not affect or reduce ecosystem WUE [20,26]. Furthermore, the effects of drought in different seasons on WUE are not uniform. Spring drought increased ecosystem WUE in a mixed deciduous forest and a subalpine evergreen forest [27]. However, spring drought did not have distinct effect on WUE, but summer drought reduced it in a Pinus tabuliformis plantation [28]. In addition, some studies also suggested that drought had legacy effects on ecosystem WUE ranging from a few months to several years [29,30]. Obviously, temporal variations of ecosystem WUE deserve further study in natural forests, especially when they are associated with drought.
Stomatal regulation is a common strategy for plant species to cope with drought stress [31]. Generally, the anisohydric species showed stronger stress resistance than the isohydric species to maintain stomatal opening under drought conditions [32]. Responses of stomata to atmospheric demand (VPD) can represent the hydraulic behavior of tree species at the ecosystem level [33]. Although hydraulic behaviors of the same species could vary in different environment [34], some tree species still have typical isohydric or anisohydric characteristics at ecosystem level. For example, poplar [35] is considered to be typical anisohydric species, and Pinus koraiensis is an isohydric species [36]. Natural oak forests have the most extensive area distribution and the highest vegetation C stock in China [37]. However, hydraulic behaviors of natural oak forest ecosystem have been rarely reported, especially in different years with contrasting soil water content.
In this study, the latent heat, CO2 fluxes and meteorological factors of a natural oak forest were continuously observed for 4 years (1 January 2017–31 December 2020) with eddy covariance (EC) system and micrometeorological equipment. The observed period included a dry year, 2019, with the lowest precipitation in recent decades. The 4-year observed period also included drought events in four seasons. It provides a good opportunity to study seasonal and inter-annual dynamics of ecosystem WUE and effects of droughts in different seasons on ecosystem WUE. The investigation aims to (1) identify the key environmental and biological factors that control WUE at seasonal and annual timescales; (2) understand the effects of drought on WUE; (3) understand the water-regulation strategies in the natural oak forest ecosystem in wet and dry year. It was hypothesized that drought in different seasons had different effects on ecosystem WUE. Second, we hypothesized that the natural oak forest had typical anisohydric characteristics at ecosystem level although it can also reduce stomatal opening during long-term drought.

2. Study Site and Methods
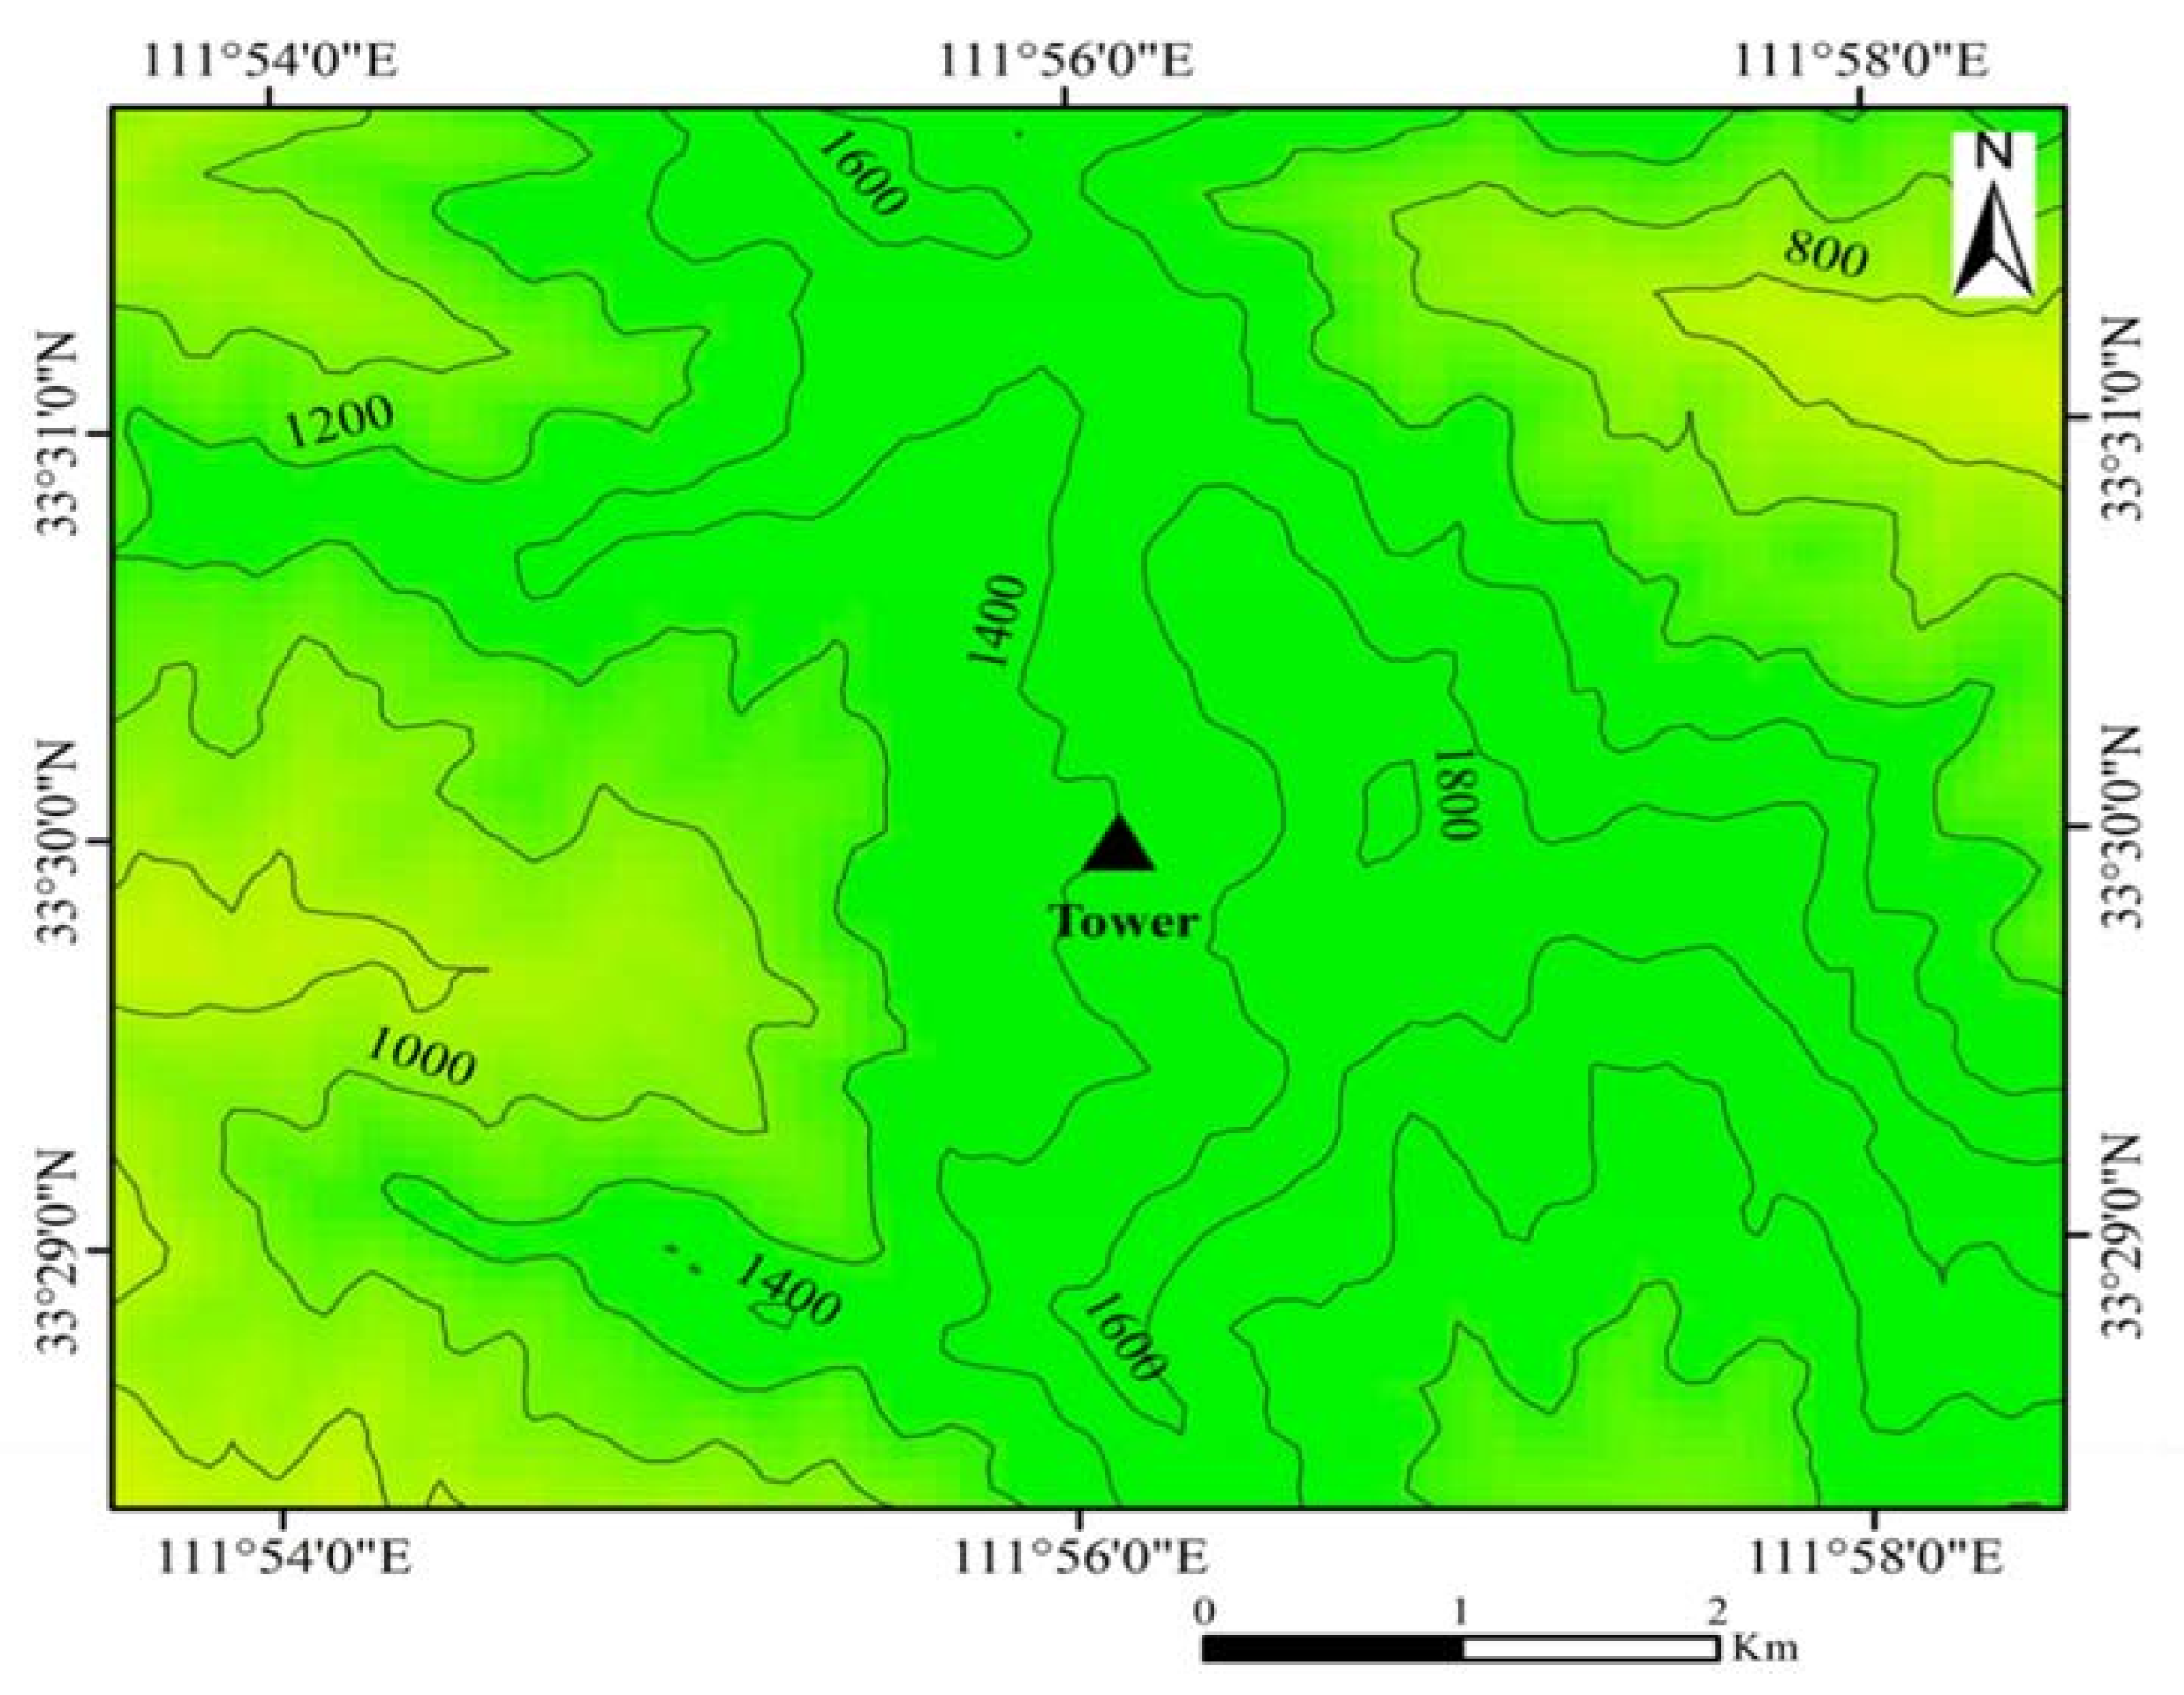
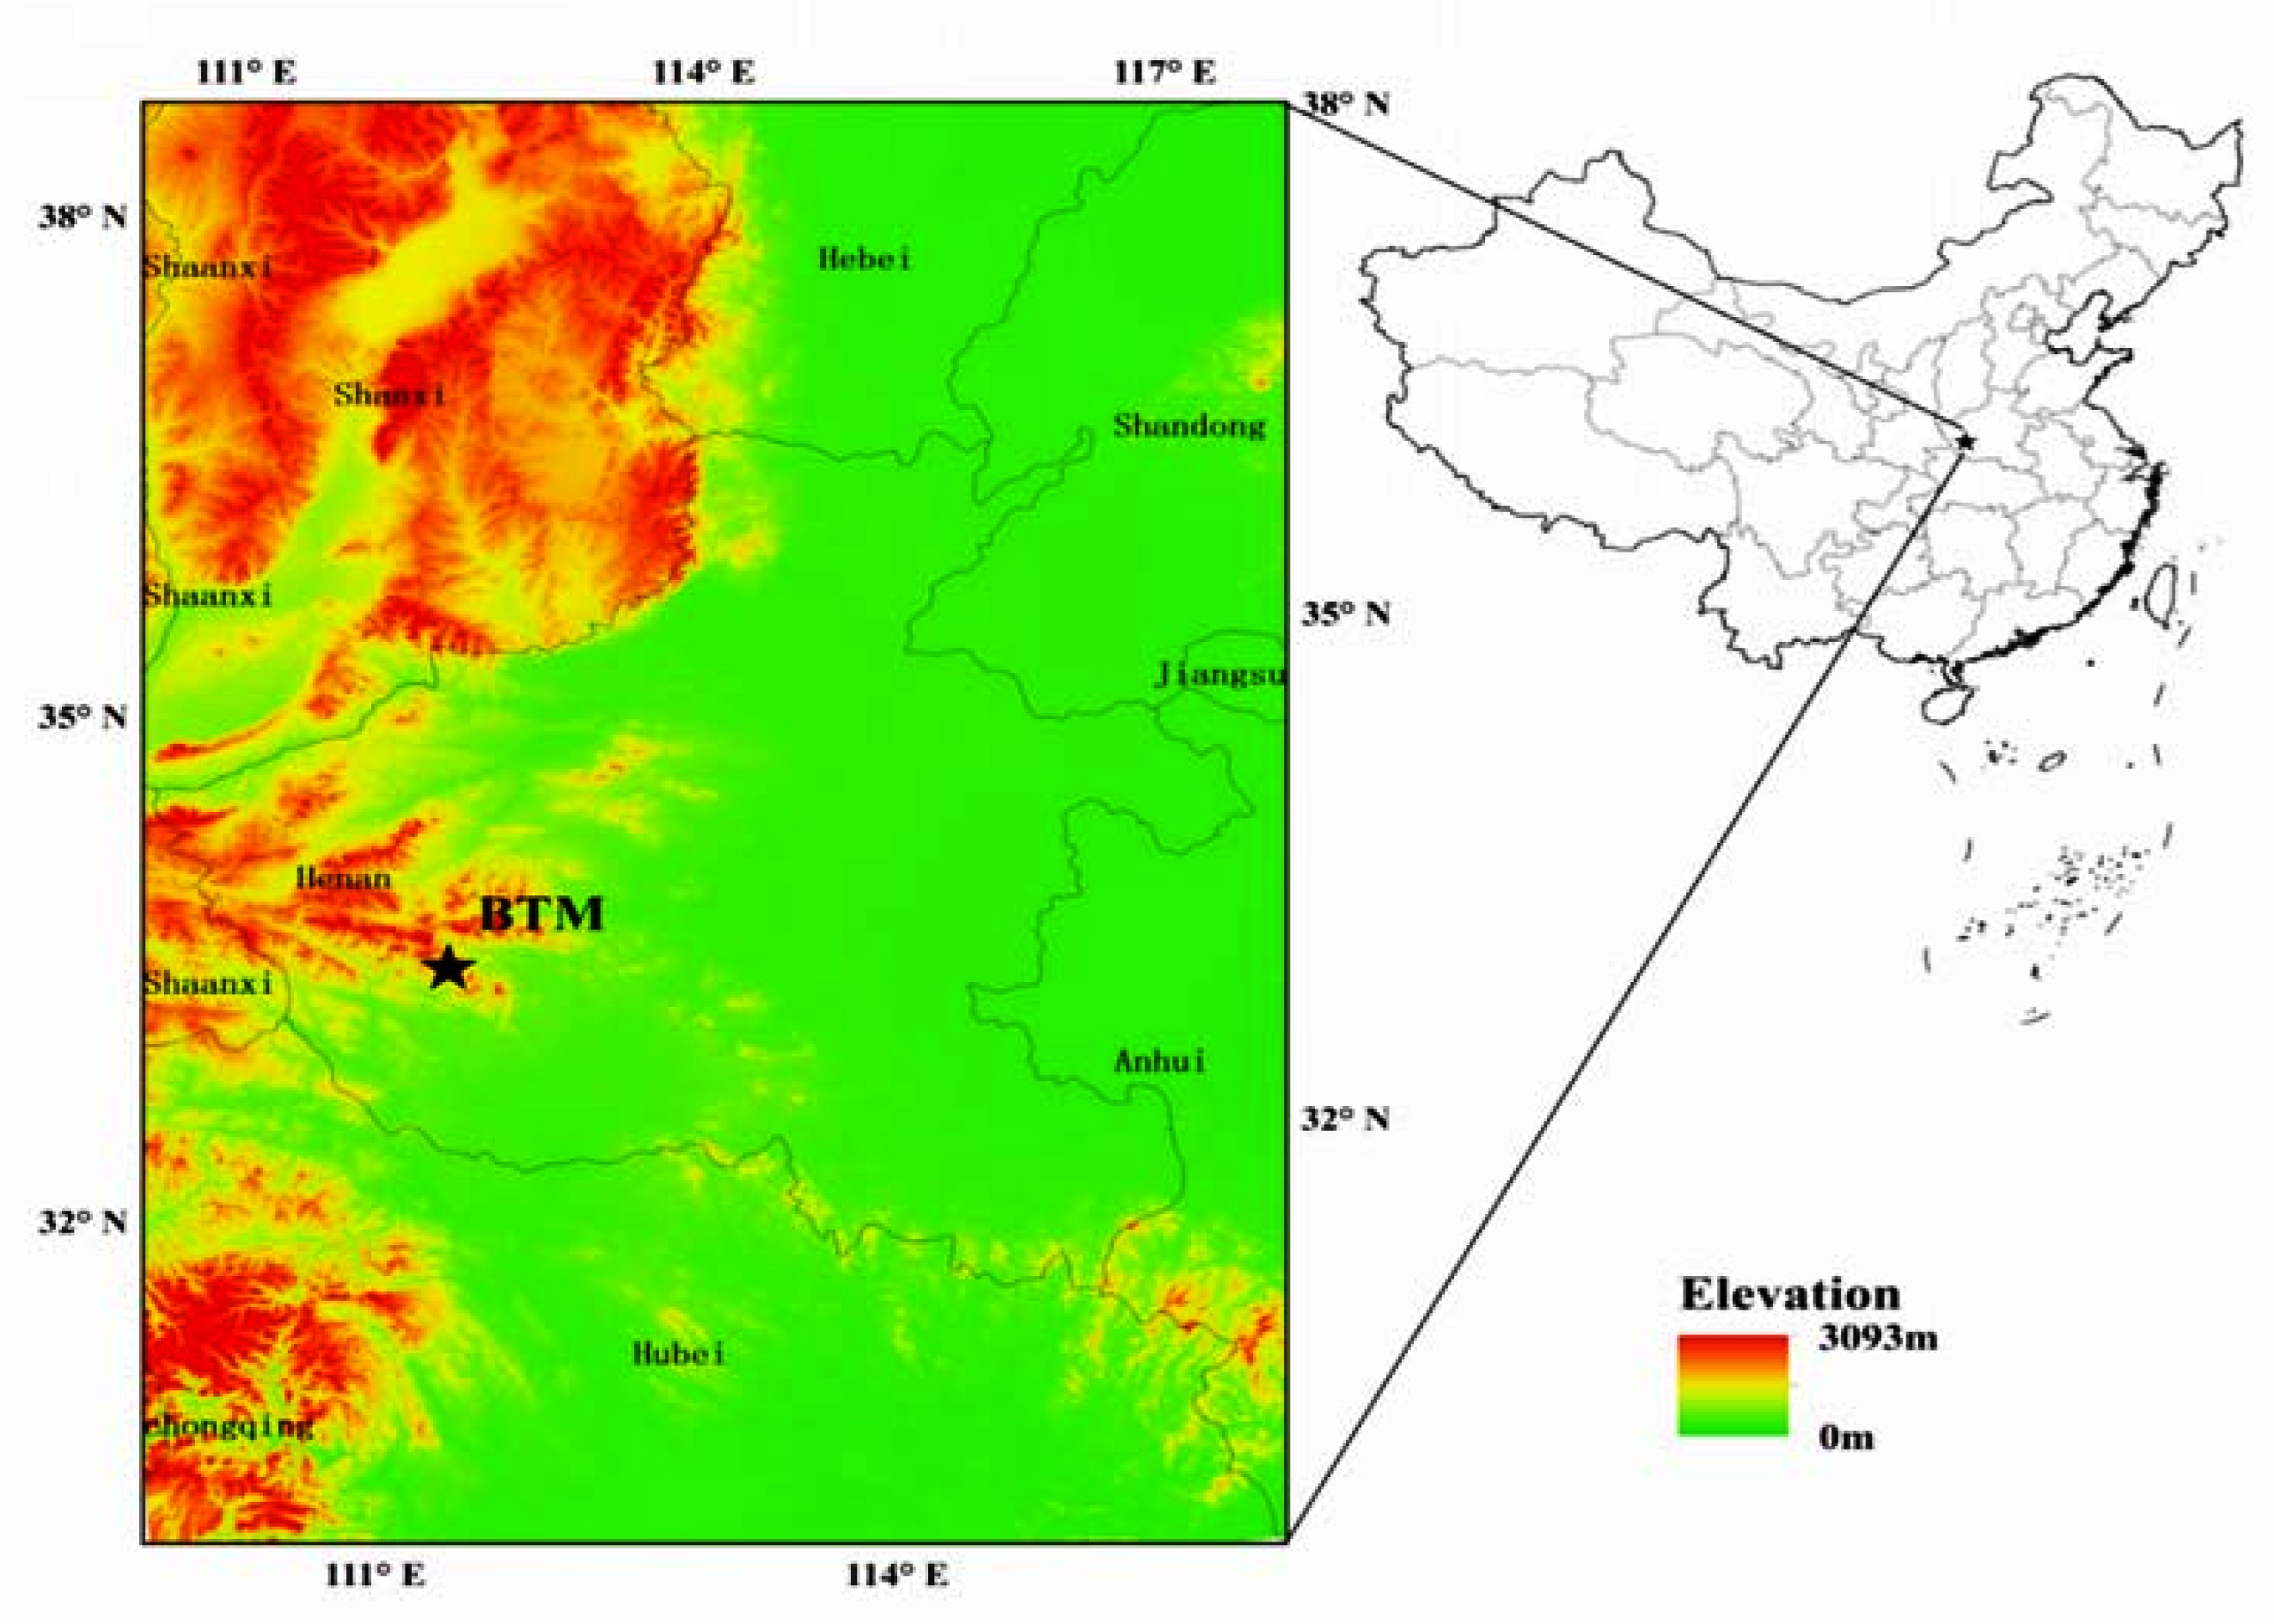
2.1. Study Site

Observation was carried out at the Baotianman Nature Reserve (33°20′–33°36′ N, 111°45′–112°04′ E) located in NanYang City, Henan Province, China (Figure 1). It lies in a transitional zone between the warm-temperate and northern subtropical regions. The average of annual air temperature of this site is 10 °C, and the daily mean air temperature ranges from −13 °C in January to 24.8 °C in July (at the altitude of 1400 m). The average annual rainfall is about 891 mm, and rainfall during the growing season (May–October) accounted for more than 60%. The average relative air humidity is more than 65% during the growing season [38,39].
Flux tower was installed at an altitude of 1410.7 m, with a slope of less than 15° (33°29′59″ N, 111°56′07″ E) (Figure 2). We set up a 1-hectare plot centered around the flux tower and conduct vegetation survey in 2014. Quercus aliena was the dominant species in the natural oak forest ecosystem. Lindera obtusiloba, Meliosma flexuosa, Tilia nobilis, Corylus chinensis, and Tilia tuan were also distributed in the stand. The average height of trees in the plot was 18 m, while the average diameter at breast height (DBH) was 19.8 ± 2.8 cm in 2014. Shrubs included Lonicera hispida, Viburnum betulifolium, Sambucus williamsii, Forsythia suspensa, Spiraea dasyantha, and Litsea tsinlingensis.

2.2. Microclimatic and Vegatation Observations

The flux tower (38 m) was surrounded in all directions by Quercus aliena-dominated forests, extending to approximately 1 km of homogeneous fetch.
HMP-45D sensors (Vaisala Oyj, Helsinki, Finland) were used to measure Ta and relative humidity (RH) at heights of 22, 14, 8, and 2 m. An optical quantum sensor (Model LI-190SB, Li-cor, Inc., Lincoln, NE, USA) and a four-component net radiometer (Model CNR-1, Kipp and Zonen Inc., Delft, The Netherlands) were used to measure radiation at 22 m. Soil heat flux (G) was measured using soil heat flux plates (AV-HFT3) at 10 and 30 cm depths separately below the surface. Soil temperature sensors (107, Campbell Inc., Logan, UT, USA) were installed at depths of 5, 10, 15, 20, and 40 cm. Water content reflectometers (Model, CS616, Campbell Scientific Inc., Logan, UT, USA) were used to measure the soil volumetric water content at 10, 20, and 50 cm depths. Data loggers (Model CR3000, Campbell Scientific Inc., Logan, UT, USA) were used to collect meteorological data.
The three-dimensional (3-D) ultrasonic anemometer (Wind Master) was used to measure 3-D wind speed and directions. CO2 and H2O concentrations were measured using Li-7500 (Li-cor Inc., Lincoln, NE, USA). Both instruments were mounted at a height of 29 m. Data were logged using CR3000 (Campbell Scientific Inc., Logan, UT, USA), and Li-7500 was calibrated once a year. MODIS EVI (MOD13Q1) products downloaded from the website (https://ladsweb.modaps.eosdis.nasa.gov, accessed on 25 February 2021) with temporal resolution of 16 days and spatial resolution of 250 m were used to characterize the density and greenness of vegetation.

2.3. Data Processing and Analysis

In this study, the logger-net software (version 4.3) was used to segment the original data of 10 Hz. Eddy-Pro software (version 6.0.0) developed by Li-Cor was used for further processing for the segmented data. The steps of data processing included: double coordinate rotation [40], detrend correction, data synchronization, statistical testing, Webb–Pearman–Leuning correction [41], ultrasonic virtual temperature correction, angle of attack correction, and data quality control marking [42]. After these procedures, abnormal data were filtered following the steps reported by Papale [43]. After all the elimination steps, the effective data recorded in 2017, 2018, 2019 and 2020 accounted for 65%, 69%, 71% and 51% in latent heat flux (LE), and 63%, 68%, 70% and 48% in CO2 flux, respectively.
An online program (www.bgc-jena.mpg.de/~MDIwork/eddyproc/index.php, accessed on 13 January 2021) was used to conduct the gap filling. Energy budget closure values [44] were 0.66, 0.71, 0.64 and 0.63 for 2017, 2018, 2019 and 2020, respectively, which fell within the scope (0.55–0.99) reported by Wilson [45]. The energy closure indicates that the data observed in this study were reliable. Heat storage in soil and vegetation, which may cause non-closure, was not considered in this analysis.
Half-hourly ET was computed from the LE using the following formula [46]:
E T = 0.43 L E ( 597 0.564 T )
where 0.43 is the unit conversion coefficient, and daily ET was obtained by adding the values of 0.5 h in 1 d. T is the air temperature at height of 22 m.

2.4. Calculation of WUE

GEP can be calculated as:
G E P = N E E + E R
where NEE is the net ecosystem CO2 exchange (g Cm−2time−1); ER is the ecosystem respiration (g Cm−2time−1). NEE can be measured through the instruments. Nocturnal NEE is often used to represent ER at night. The relationship between nocturnal NEE and the corresponding soil temperature could be expressed by an exponential model. Using this model and soil temperature in the daytime, we can calculate the ER in the daytime. Detailed calculation methods can be found in Niu et al. (2020) [47].
The ecosystem WUE can be expressed by different methods [48]. In this study, the ecosystem WUE was calculated according to the following formula:
W U E = G E P E T

2.5. Calculation of Surface Conductance (gs) and Relative Extractable Water Content (REW)

The parameter gs was computed by reserving the Penman–Monteith equation [49]:
g s = γ L E g a Δ ( R n G ) + ρ C p V P D g a L E ( Δ + γ )
Here, Δ is the slope of the function relating the saturation water vapor pressure to air temperature (kPaK−1), γ is the psychometric constant (kPaK−1), ρ is air density (kg m−3), VPD is atmospheric vapor pressure deficit (kPa), Cp is the specific heat of air (J kg−1K−1). Aerodynamic conductance (ga) was calculated using an expression by Monteith and Unsworth [50]:
g a = ( u u * 2 + 6.2 u * 0.67 ) 1
where u is the wind speed at height of canopy (ms−1), and u is the friction velocity (ms−1).
REW is an indicator used to quantify the degree of drought. When the REW drops below 0.1, a severe soil water deficit occurs [51]. The daily REW is calculated by the following formula:
R E W = S W C S W C min S W C max S W C min
where SWC is measured soil volumetric water content, and SWCmin and SWCmax are the daily minimum and maximum values of SWC across 4 years, respectively. In this study, short-term drought was defined whenever REW < 0.1 lasted for less than 20 days, and long-term drought was defined whenever REW < 0.1 lasted for more than 20 days, according to the previous research [52] and the actual situation of this site.

2.6. Statistical Analysis

The following formula was used to fit the curve between gs and VPD reported by Launiainen (2010) [53]:
g s = g s r e f m ln V P D
where gsref is the surface conductance when VPD is equal to 1 kPa and m is the stomatal sensitivity. The ratio between m and gsref can be used to distinguish isohydric and anisohydric behavior as an empirical hydraulic conductivity parameter [35].
The relationships between GEP, ET, WUE and environmental and biological factors were expressed using linear or quadratic polynomial regression formulas. Coefficient of determination was used to express the strength of the correlation between two variables. All the relationships shown were statistically significant (p < 0.01).

3. Results

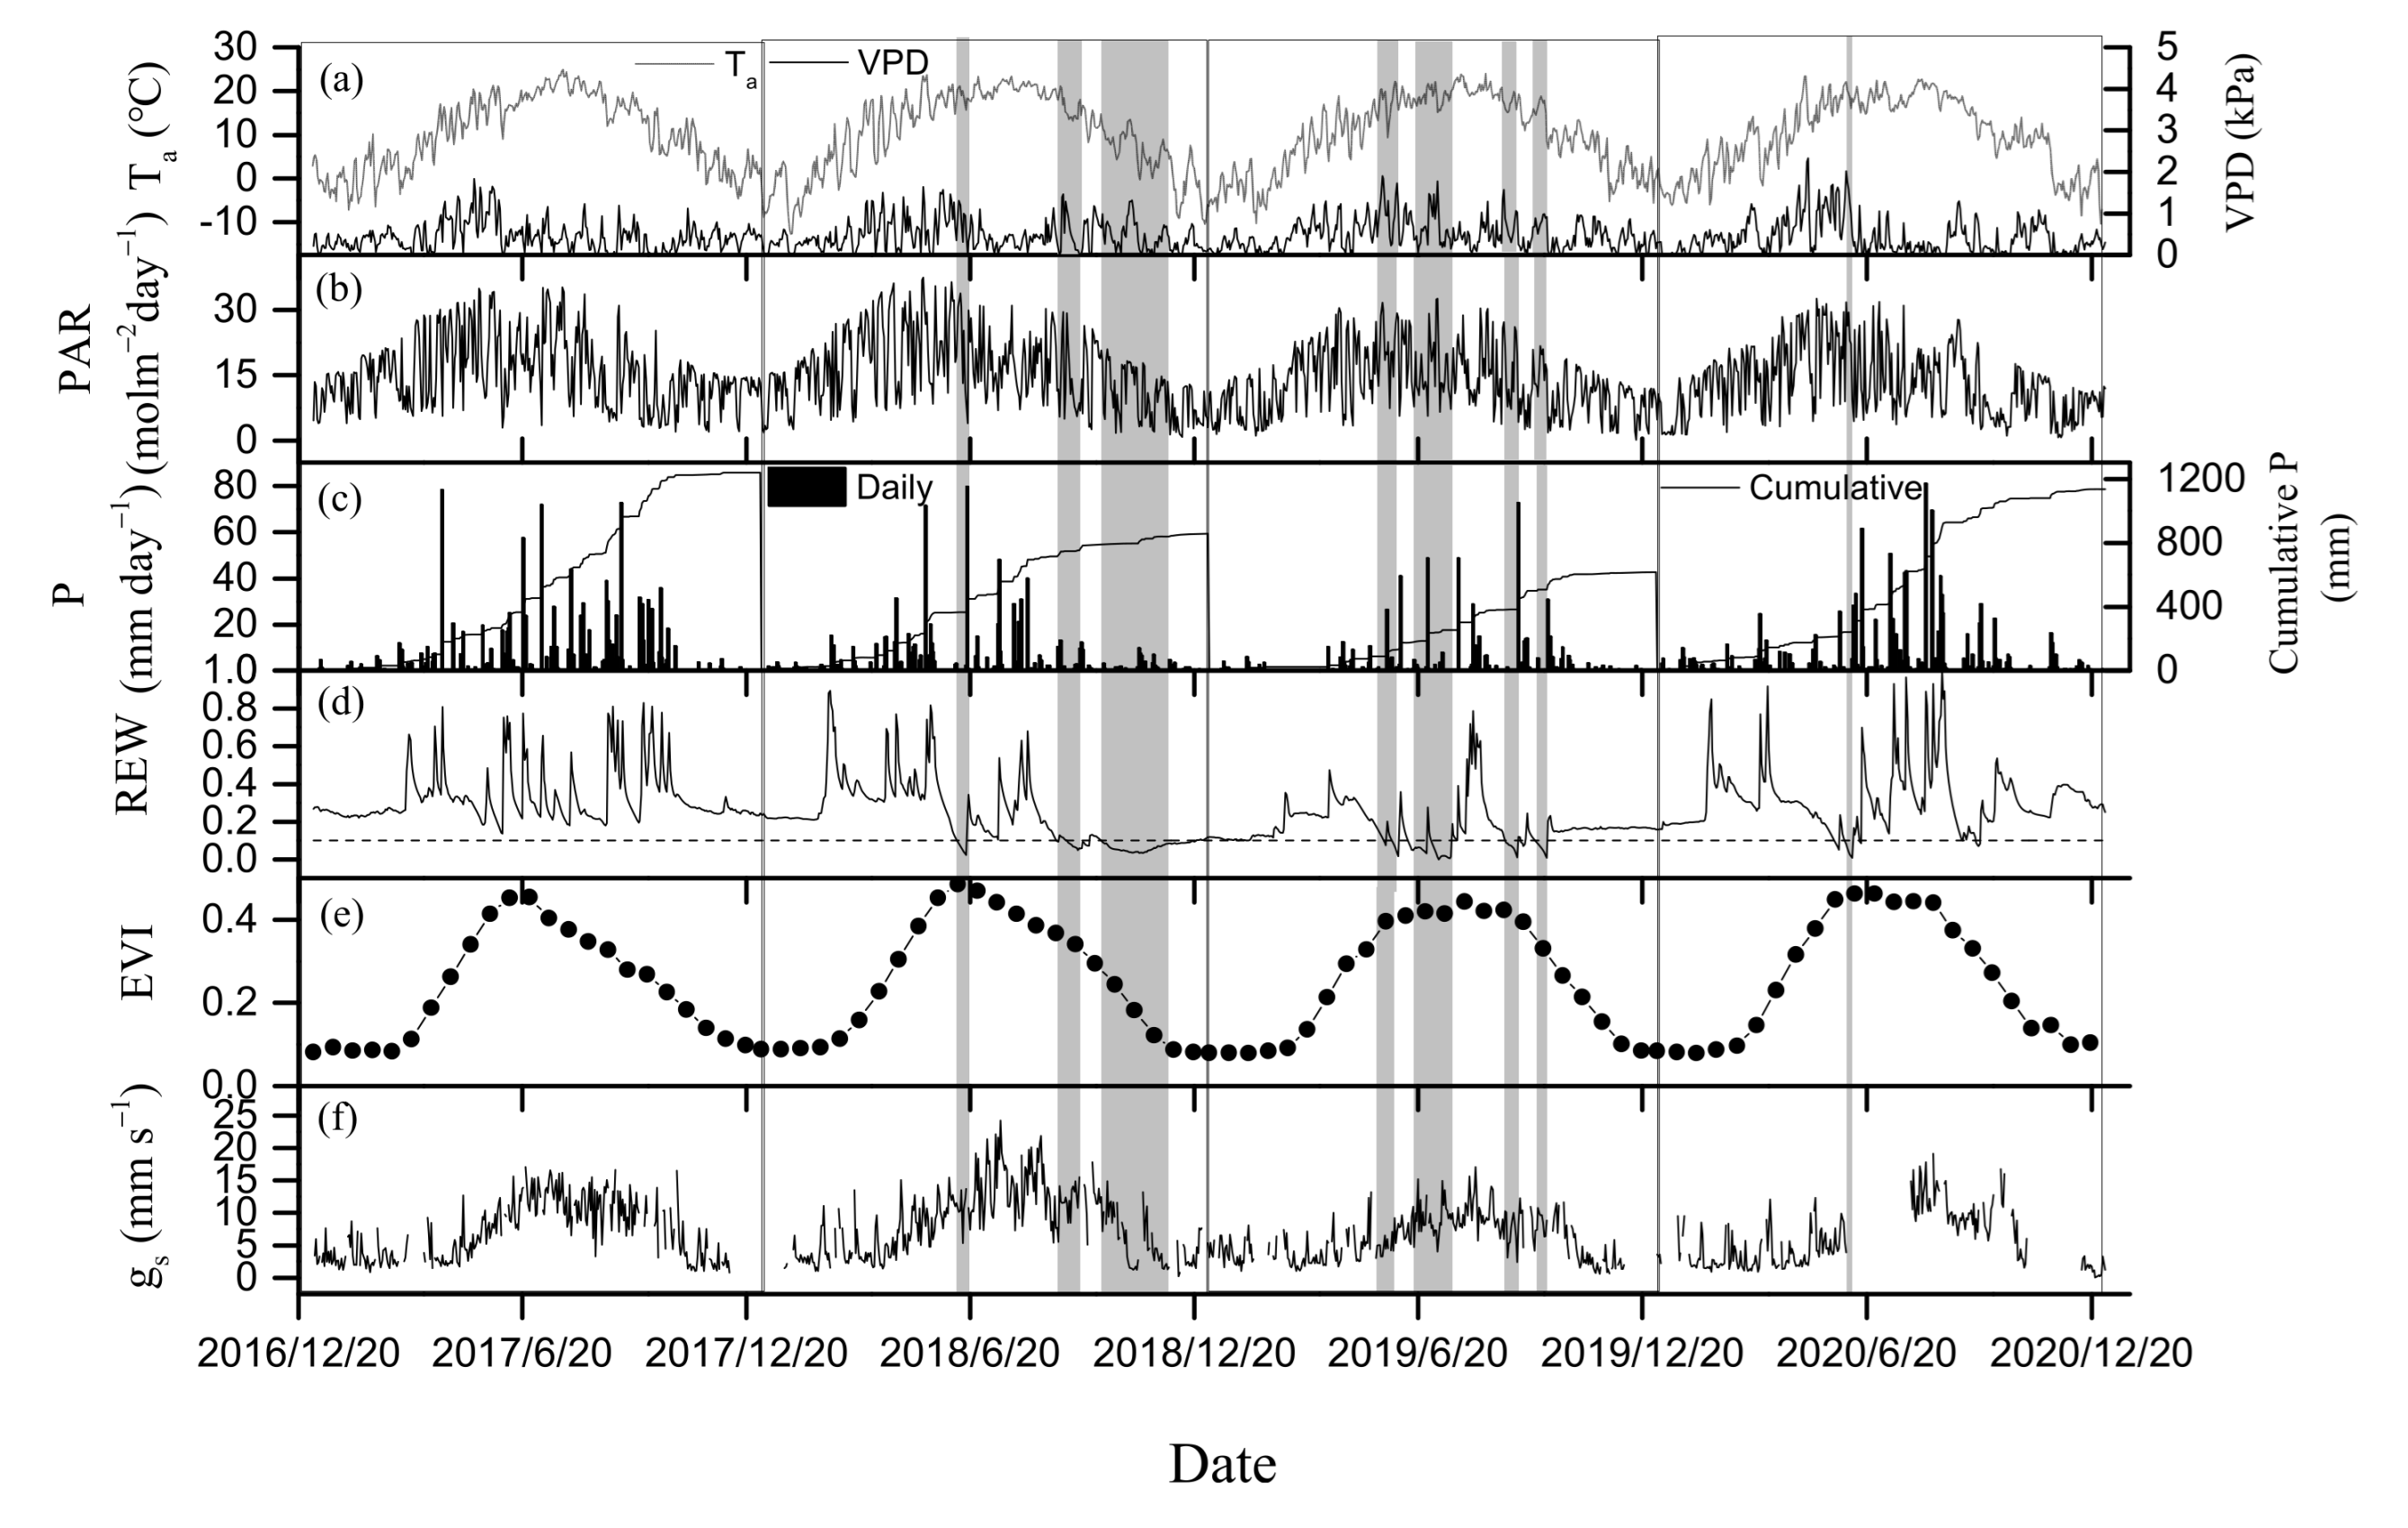
3.1. Environmental and Biological Factors

Seasonal dynamics of Ta, VPD and PAR were similar from 2017 to 2020 (Figure 3a,b). Daily mean Ta peaked in spring or summer, with a maximum of 24.8, 23.6, 23.9 and 23.4 °C during each of the four years. The minimum value of the daily mean Ta occurred in winter, with a value of −7.3, −12.8, −10.4 and −10.5 °C from 2017 to 2020. Annual mean Ta values were similar over the 4 years, ranging from 9.7 °C in 2020 to 10.1 °C in 2017 and 2018 (Figure 3a). The maximum daily mean VPD all appeared in May over the 4 years, with a value of 1.8, 1.6, 1.9 and 2.3 kPa. Annual mean VPD in 2019 was the highest of the four years (Figure 3a). Maximal daily mean PAR appeared in spring or summer, with a range from 32.5 molm−2day−1 to 37.3 molm−2day−1 (Figure 3b). Daily mean PAR varied from 13.1 in 2020 to 15.9 molm−2day−1 in 2018 during the study period (Table 1).
Precipitation mainly appeared during growing seasons (May–October) in each year during the observation period, but amount and seasonal distribution of precipitation were different over the 4 years (Figure 3c). The precipitation in summer (June–August) of 2019 was only half to the mean of rainfall in summer in other 3 years. The rainfall in spring (April–May) in 2020 only accounted for 8 percent of the annual precipitation, while the proportion was more than 16 percent in the other 3 years. In autumn (September–October), precipitation in 2018 decreased by 72% of the mean for the other three years. The year 2017 was wet, with 1239.4 mm of precipitation, nearly twice as much as in 2019 (Table 1). Seasonal fluctuations in daily SWC closely followed the variations in daily precipitation. Daily SWC varied greatly during the growing season, but it was relatively stable in non-growing seasons. Due to distinctly decreased precipitation, drought was observed in late-spring of 2020 (REW < 0.1), mid-summer of 2018 and 2019 (REW < 0.1), autumn and winter in 2018. Furthermore, the duration of each drought event was also distinctly different.
Biological factors (EVI and gs) also presented significant seasonal variations over the 4 years (Figure 3e,f). EVI presented a rapid increase with the increase in Ta in spring (Figure 3a,e), peaking in early summer, and then decreasing in autumn. Under the similar Ta conditions, 16-day-composited EVI was larger in spring than that in autumn. EVI did not decline sharply subjected to seasonal drought during the growing seasons. The growing season mean EVI was similar from 2017 to 2020 (Table 1), despite the apparent difference in precipitation (Figure 3c). Daily gs showed a single peak or bimodal pattern, peaking in summer, autumn or both. The mean gs during the growing seasons differed significantly over the four years, with the values of 10.1, 11.6, 8 and 8.7 mms−1 (Table 1). Gs showed a significant decrease during drought event over the 4 years, especially during the dry period in summer of 2019 (Figure 3f). Annual mean gs in 2019 was the lowest over the four years.

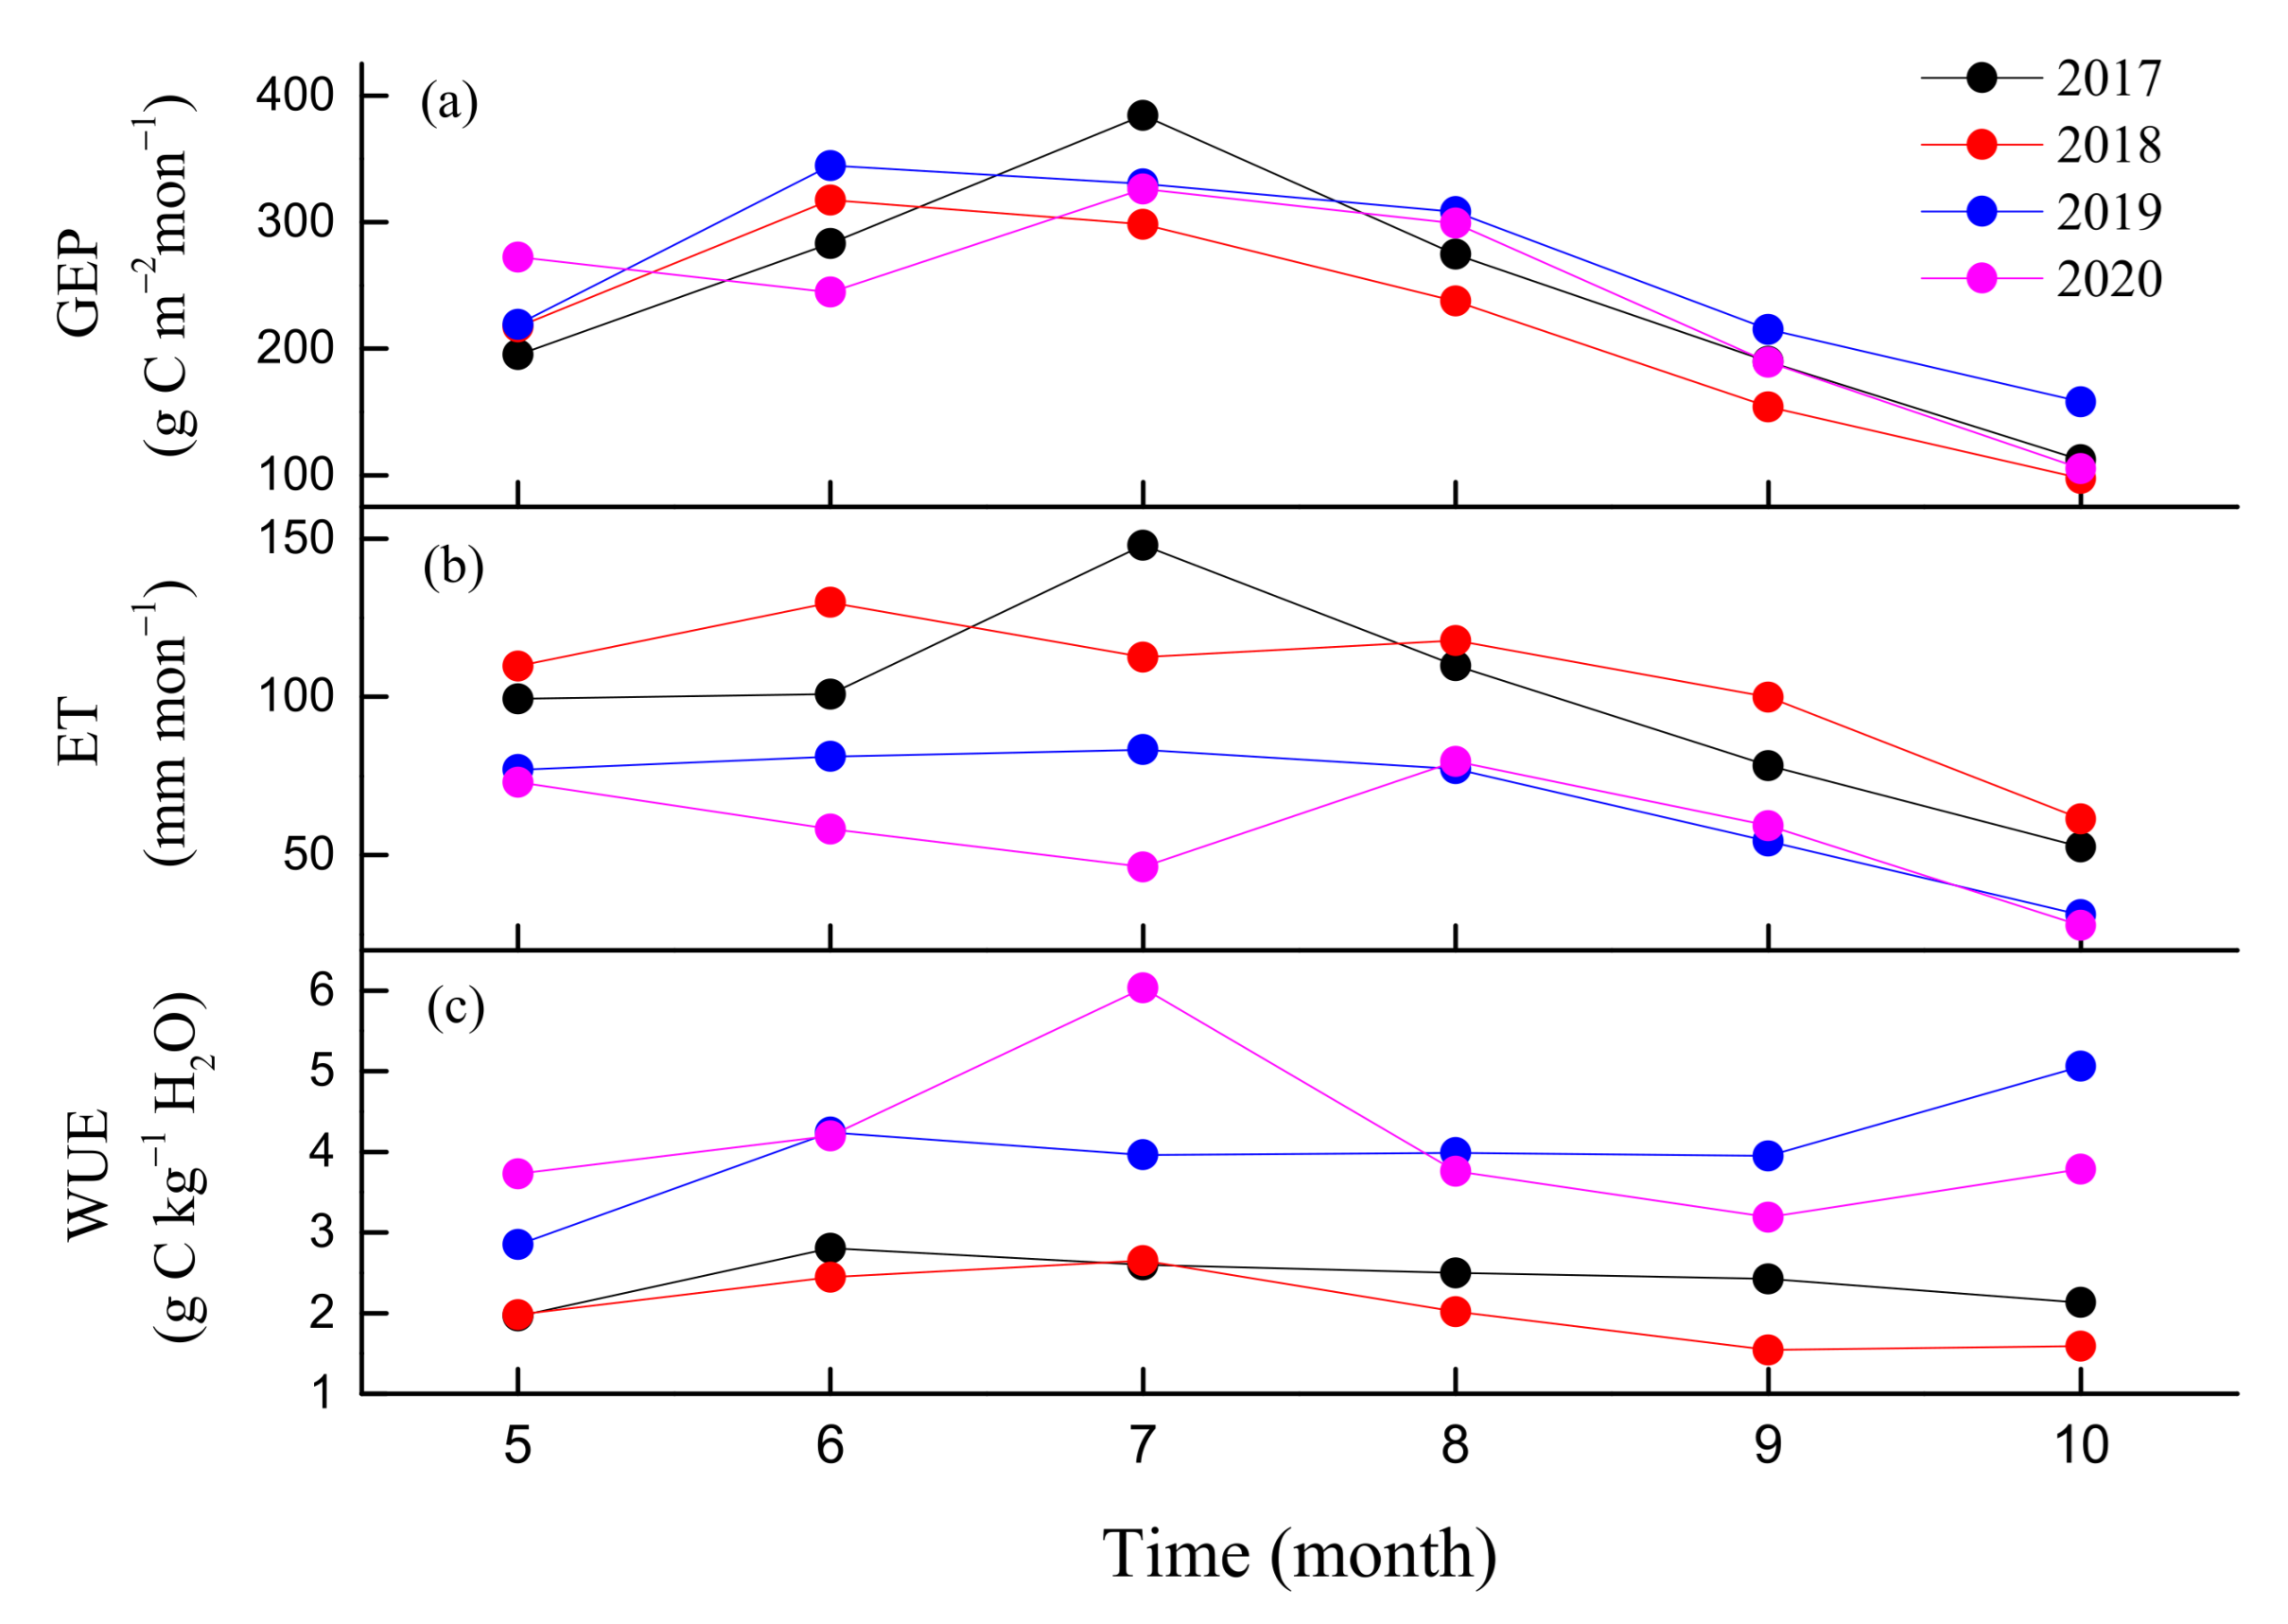
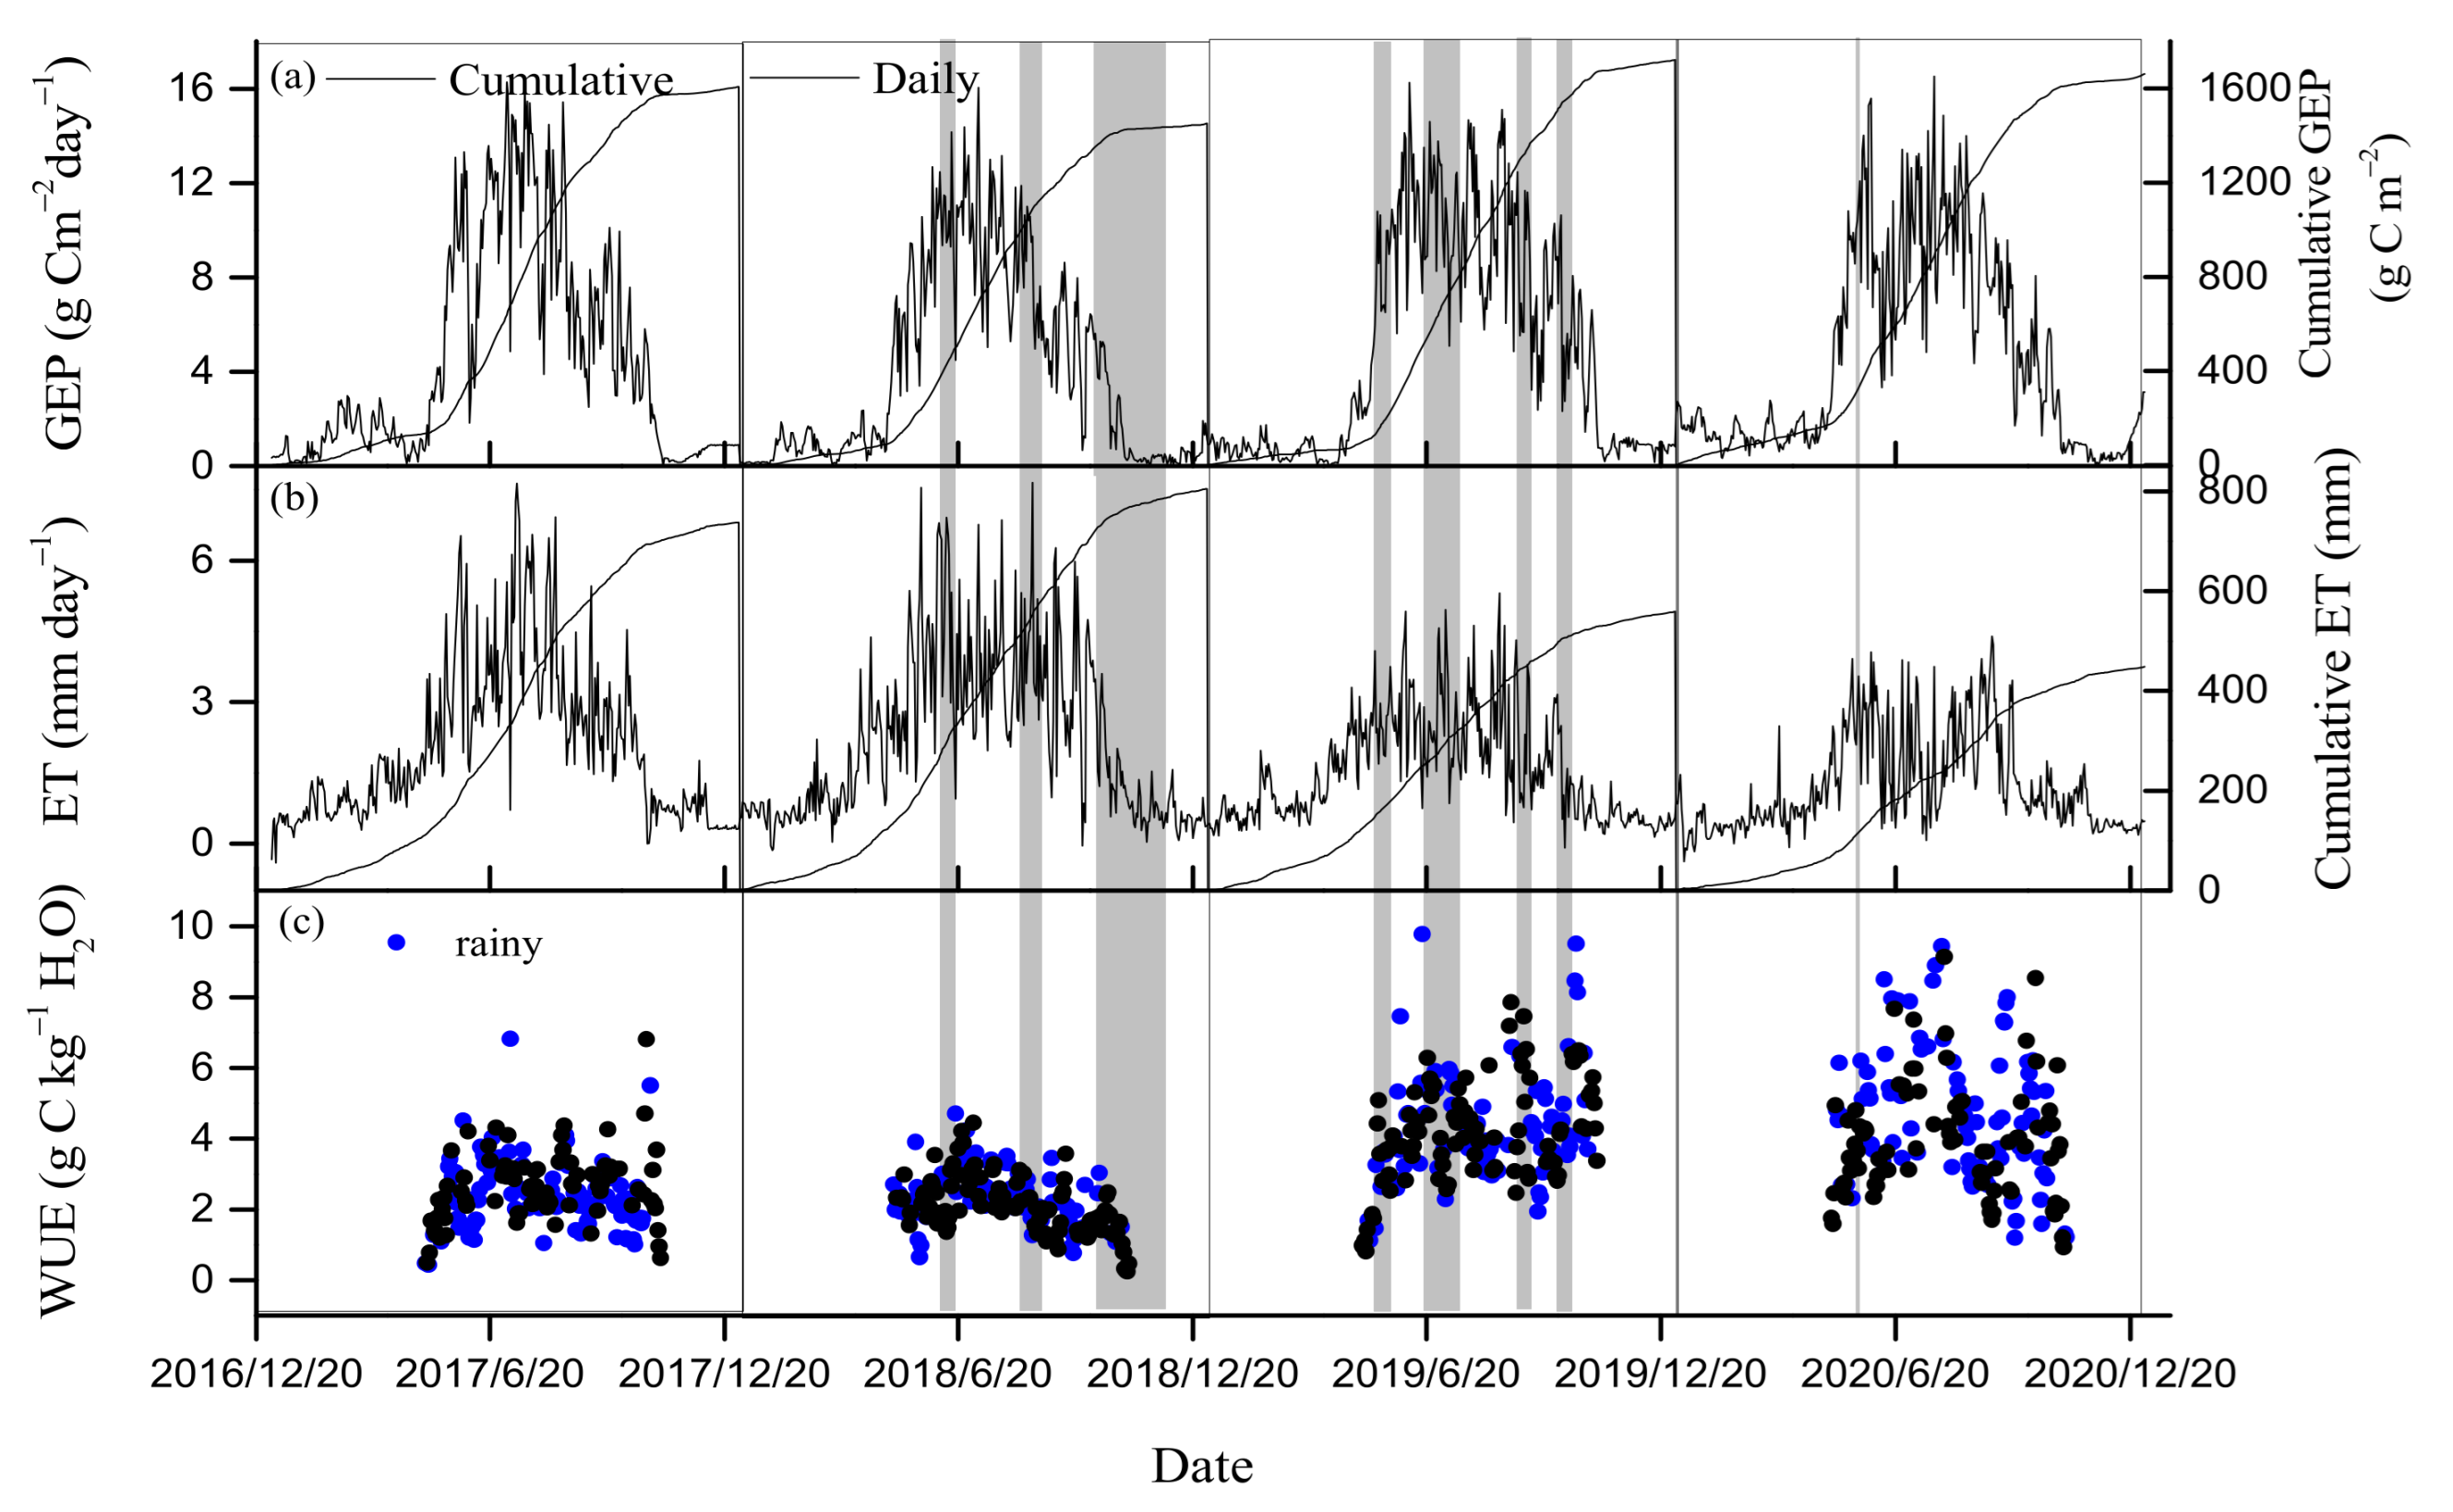
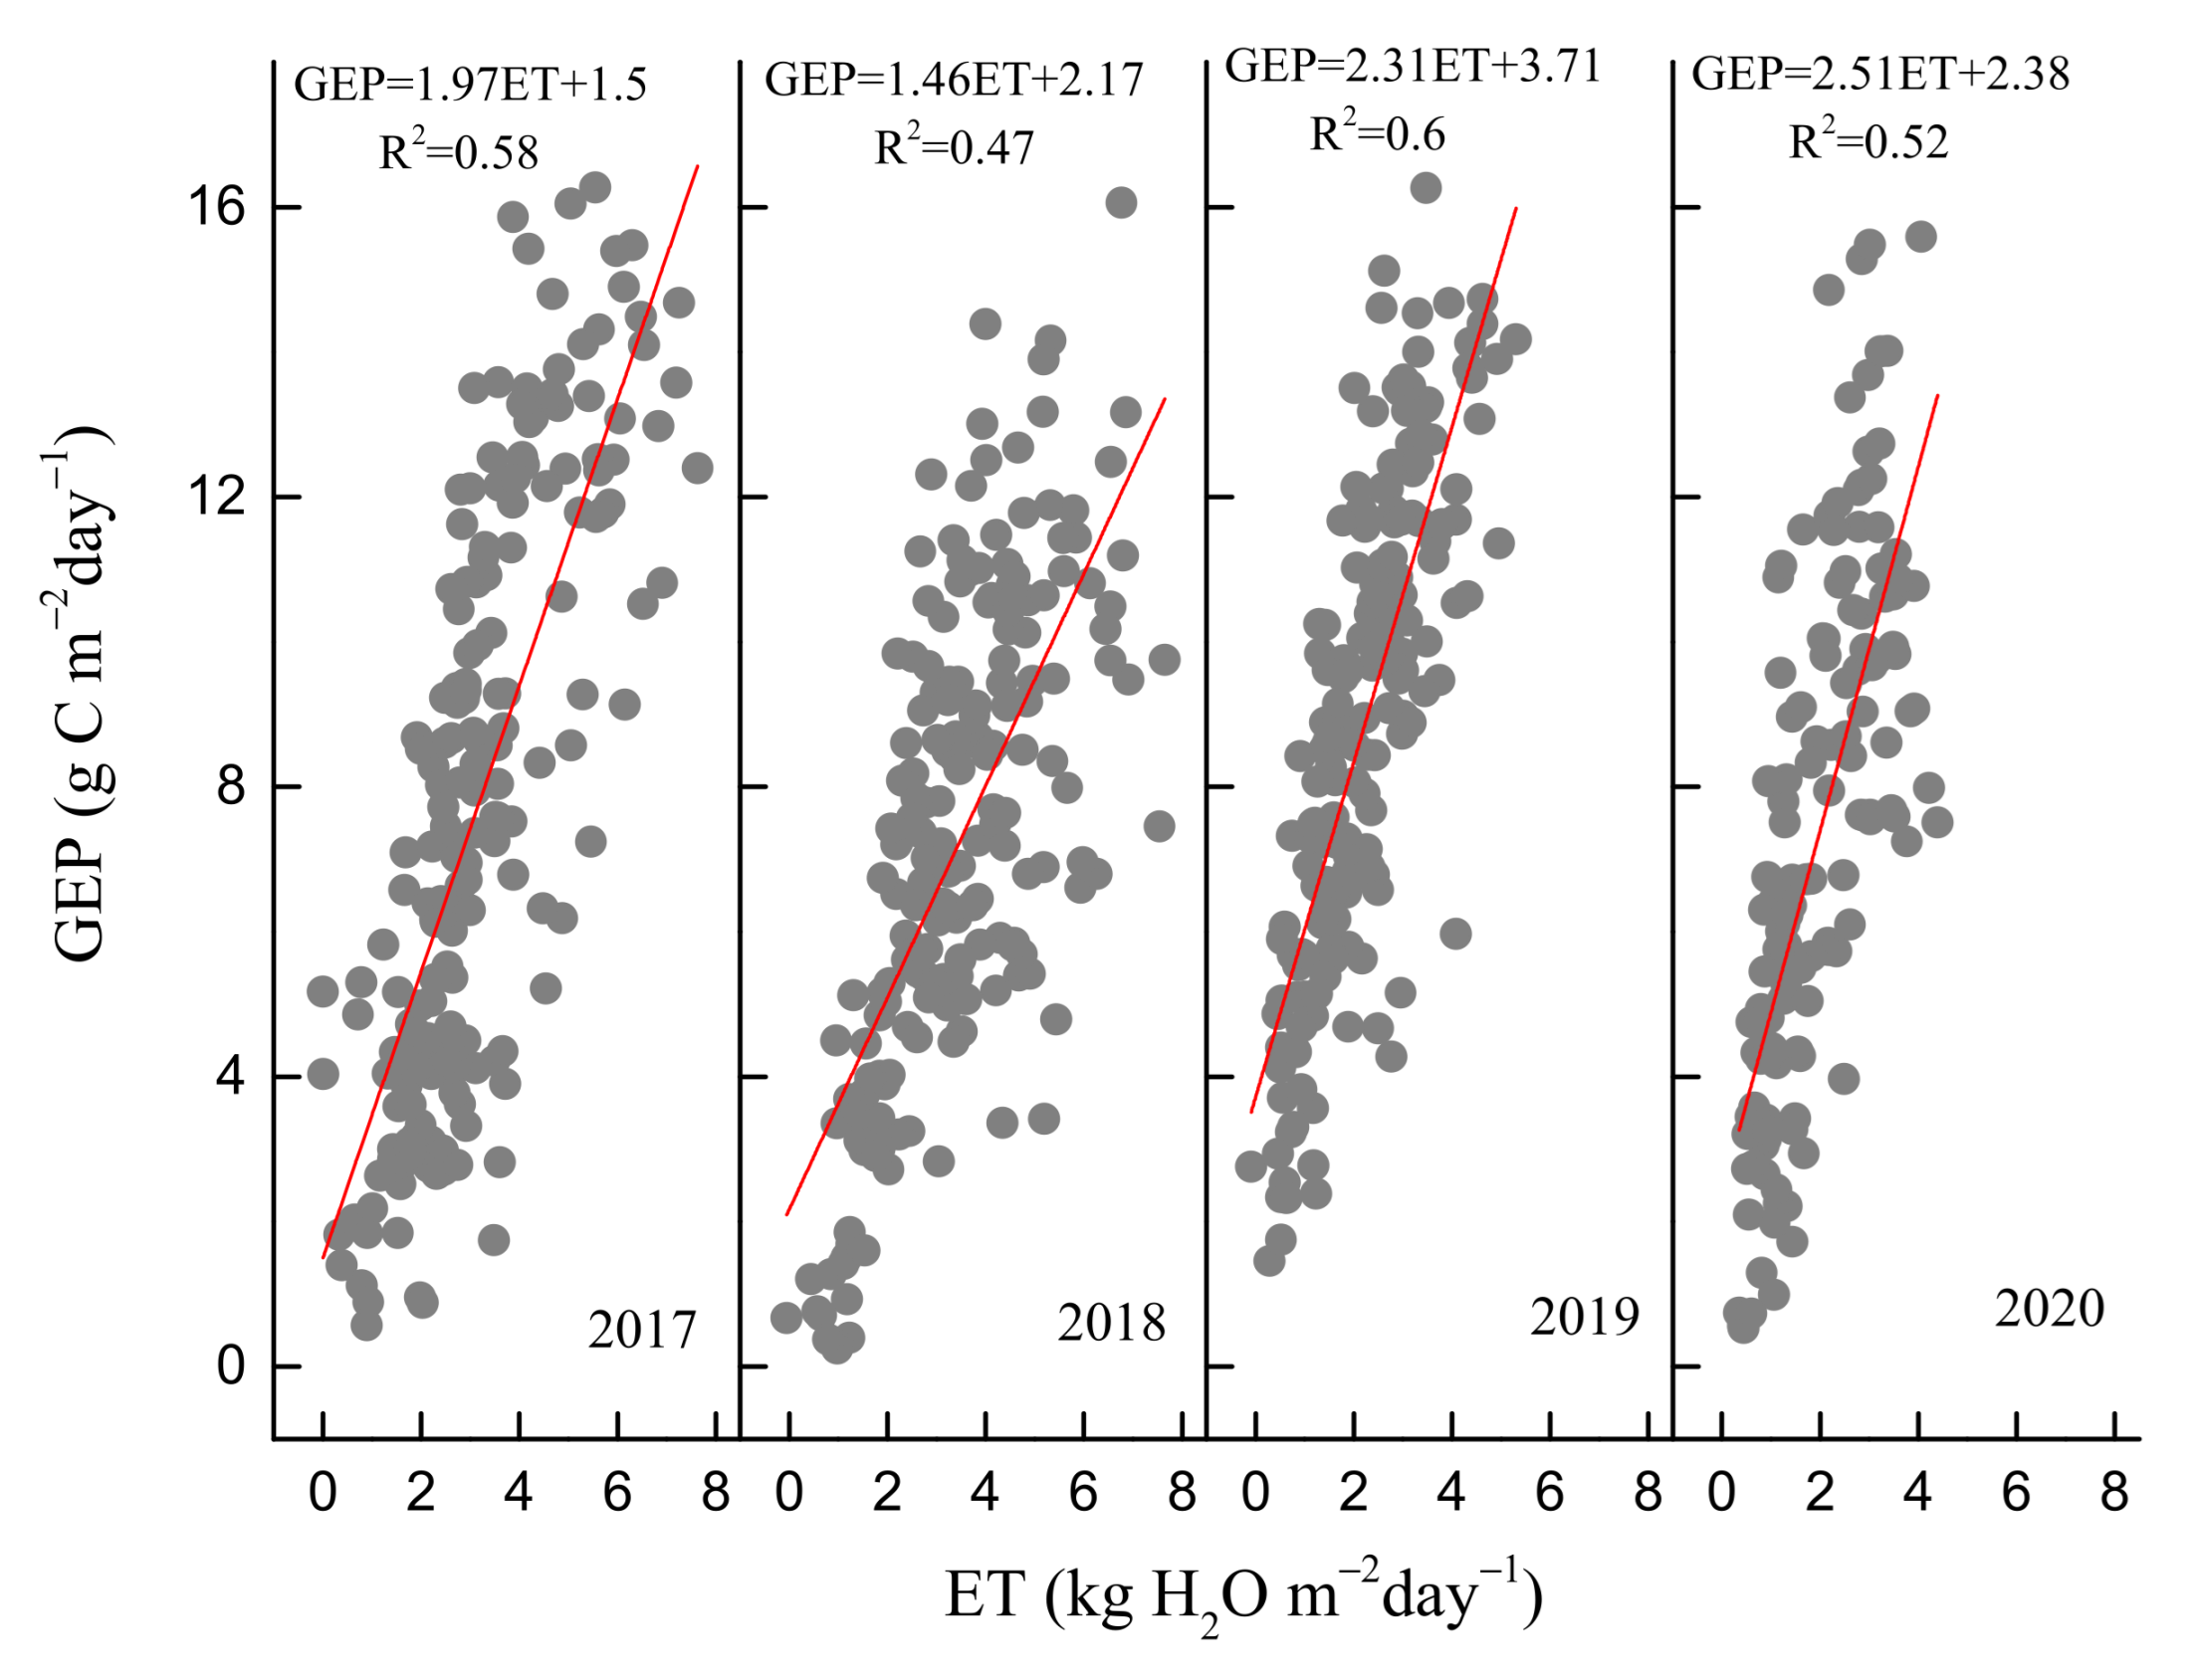
3.2. Seasonal and Inter-Annual Variations in GEP, ET, and WUE

There were similar seasonal variations in GEP and ET from 2017 to 2020 (Figure 4a,b). In spring, with increased PAR and Ta (Figure 3a,b), GEP and ET increased. Daily GEP reached a maximum in July for 2017, 2018 and 2020, and in June for 2019, with its values varying from 16.1 to 16.5 g Cm−2day−1. There was no observed significant decrease in GEP during seasonal drought events over the 4 years (Figure 4a). The monthly maximum GEP ranged between 317.4 in June of 2018 and 384.4 g Cm−2month−1 in July of 2017 over the 4 years (Figure 5a). The annual GEP values from 2017 to 2020 were 1609.1, 1454, 1723.4 and 1666.3 g Cm−2year−1, respectively (Table 1). The 4-year mean of annual GEP was 1613.2 ± 116 g Cm−2year−1, with a CV of 7.2%.
Daily ET generally peaked in mid-growing seasons in the 4-year experiment period, while it was rather low during the non-growing seasons (Figure 4b). Maximum daily ETs from 2017 to 2020 were 7.63, 7.65, 5.31 and 4.4 mmday−1, respectively. An obvious reduction in ET was observed during the drought periods in summer of 2019 and 2020. A slight increase in ET occurred during the autumn drought in 2018. The maximum monthly ET occurred in June, July, July and August during the four years, respectively (Figure 5b). The monthly maximum ET varied from 80 to 148 mm month−1. The annual ET values from 2017 to 2020 were 738.1, 805.3, 559.6 and 448.5 mm, respectively (Table 1). Inter-annual variations in ET were large; the four-year mean of ET was 637.8 ± 163.3 mm with a CV of 25.6%.
In contrast, daily WUE did not show a significant seasonal pattern (Figure 4c). Daily WUE varied between 0.25 and 9.8 g Ckg−1 H2O over the 4 years. The summer drought of 2019 increased WUE obviously, while autumn drought decreased WUE in 2018. Daily WUE values in 2019 and 2020 were obviously higher compared to those of 2017 and 2018. The maximum monthly WUE occurred in June, July, October and July during the four years, respectively (Figure 5c). The means of the daily WUE values during the four growing seasons were 2.5 ± 1, 2.2 ± 0.8, 4.2 ± 1.6 and 4.3 ± 1.8 g Ckg−1H2O from 2017 to 2020, respectively. The 4-year mean of annual WUE was 2.6 ± 0.68 g Ckg−1H2O, with a CV of 26.4%. Furthermore, daily GEP and ET during the growing season showed clear positive linear correlation from 2017 to 2020. The slope of this relationship can be used to express ecosystem WUE [54]. The slopes were 1.97, 1.5, 2.31 and 2.51, respectively, with higher values in 2019 and 2020 compared to those in 2017 and 2018 (Figure 6).

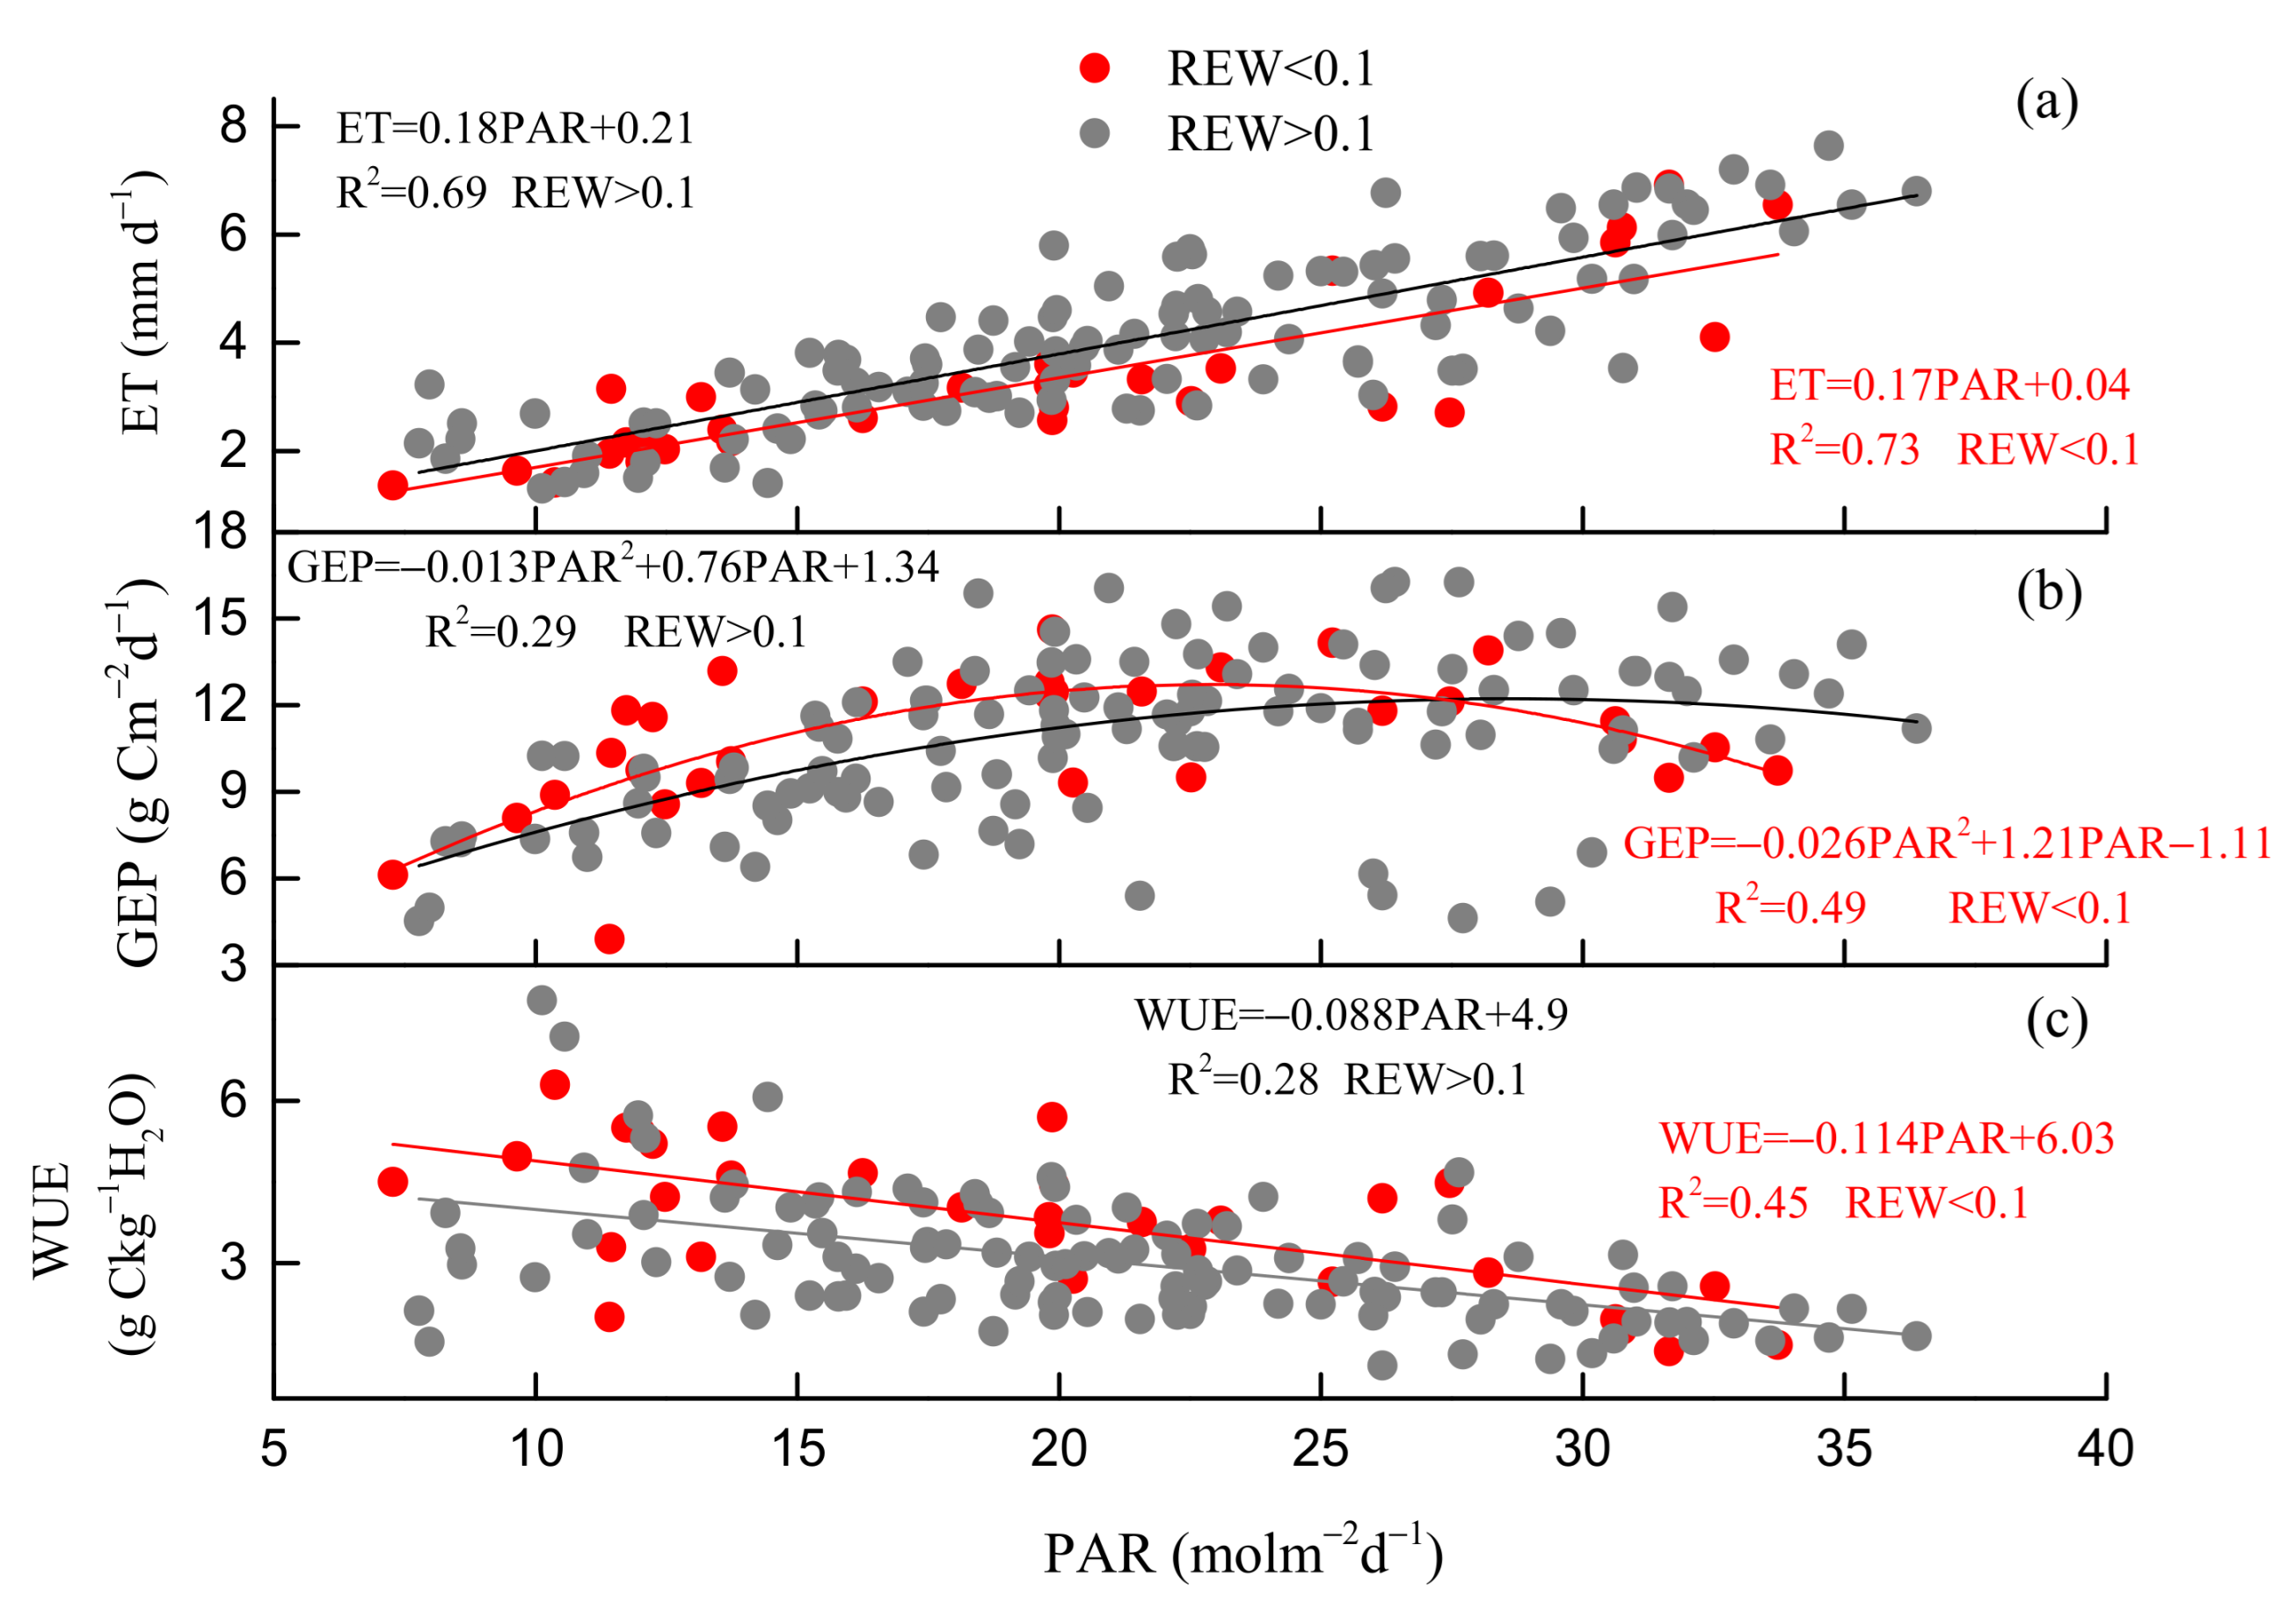
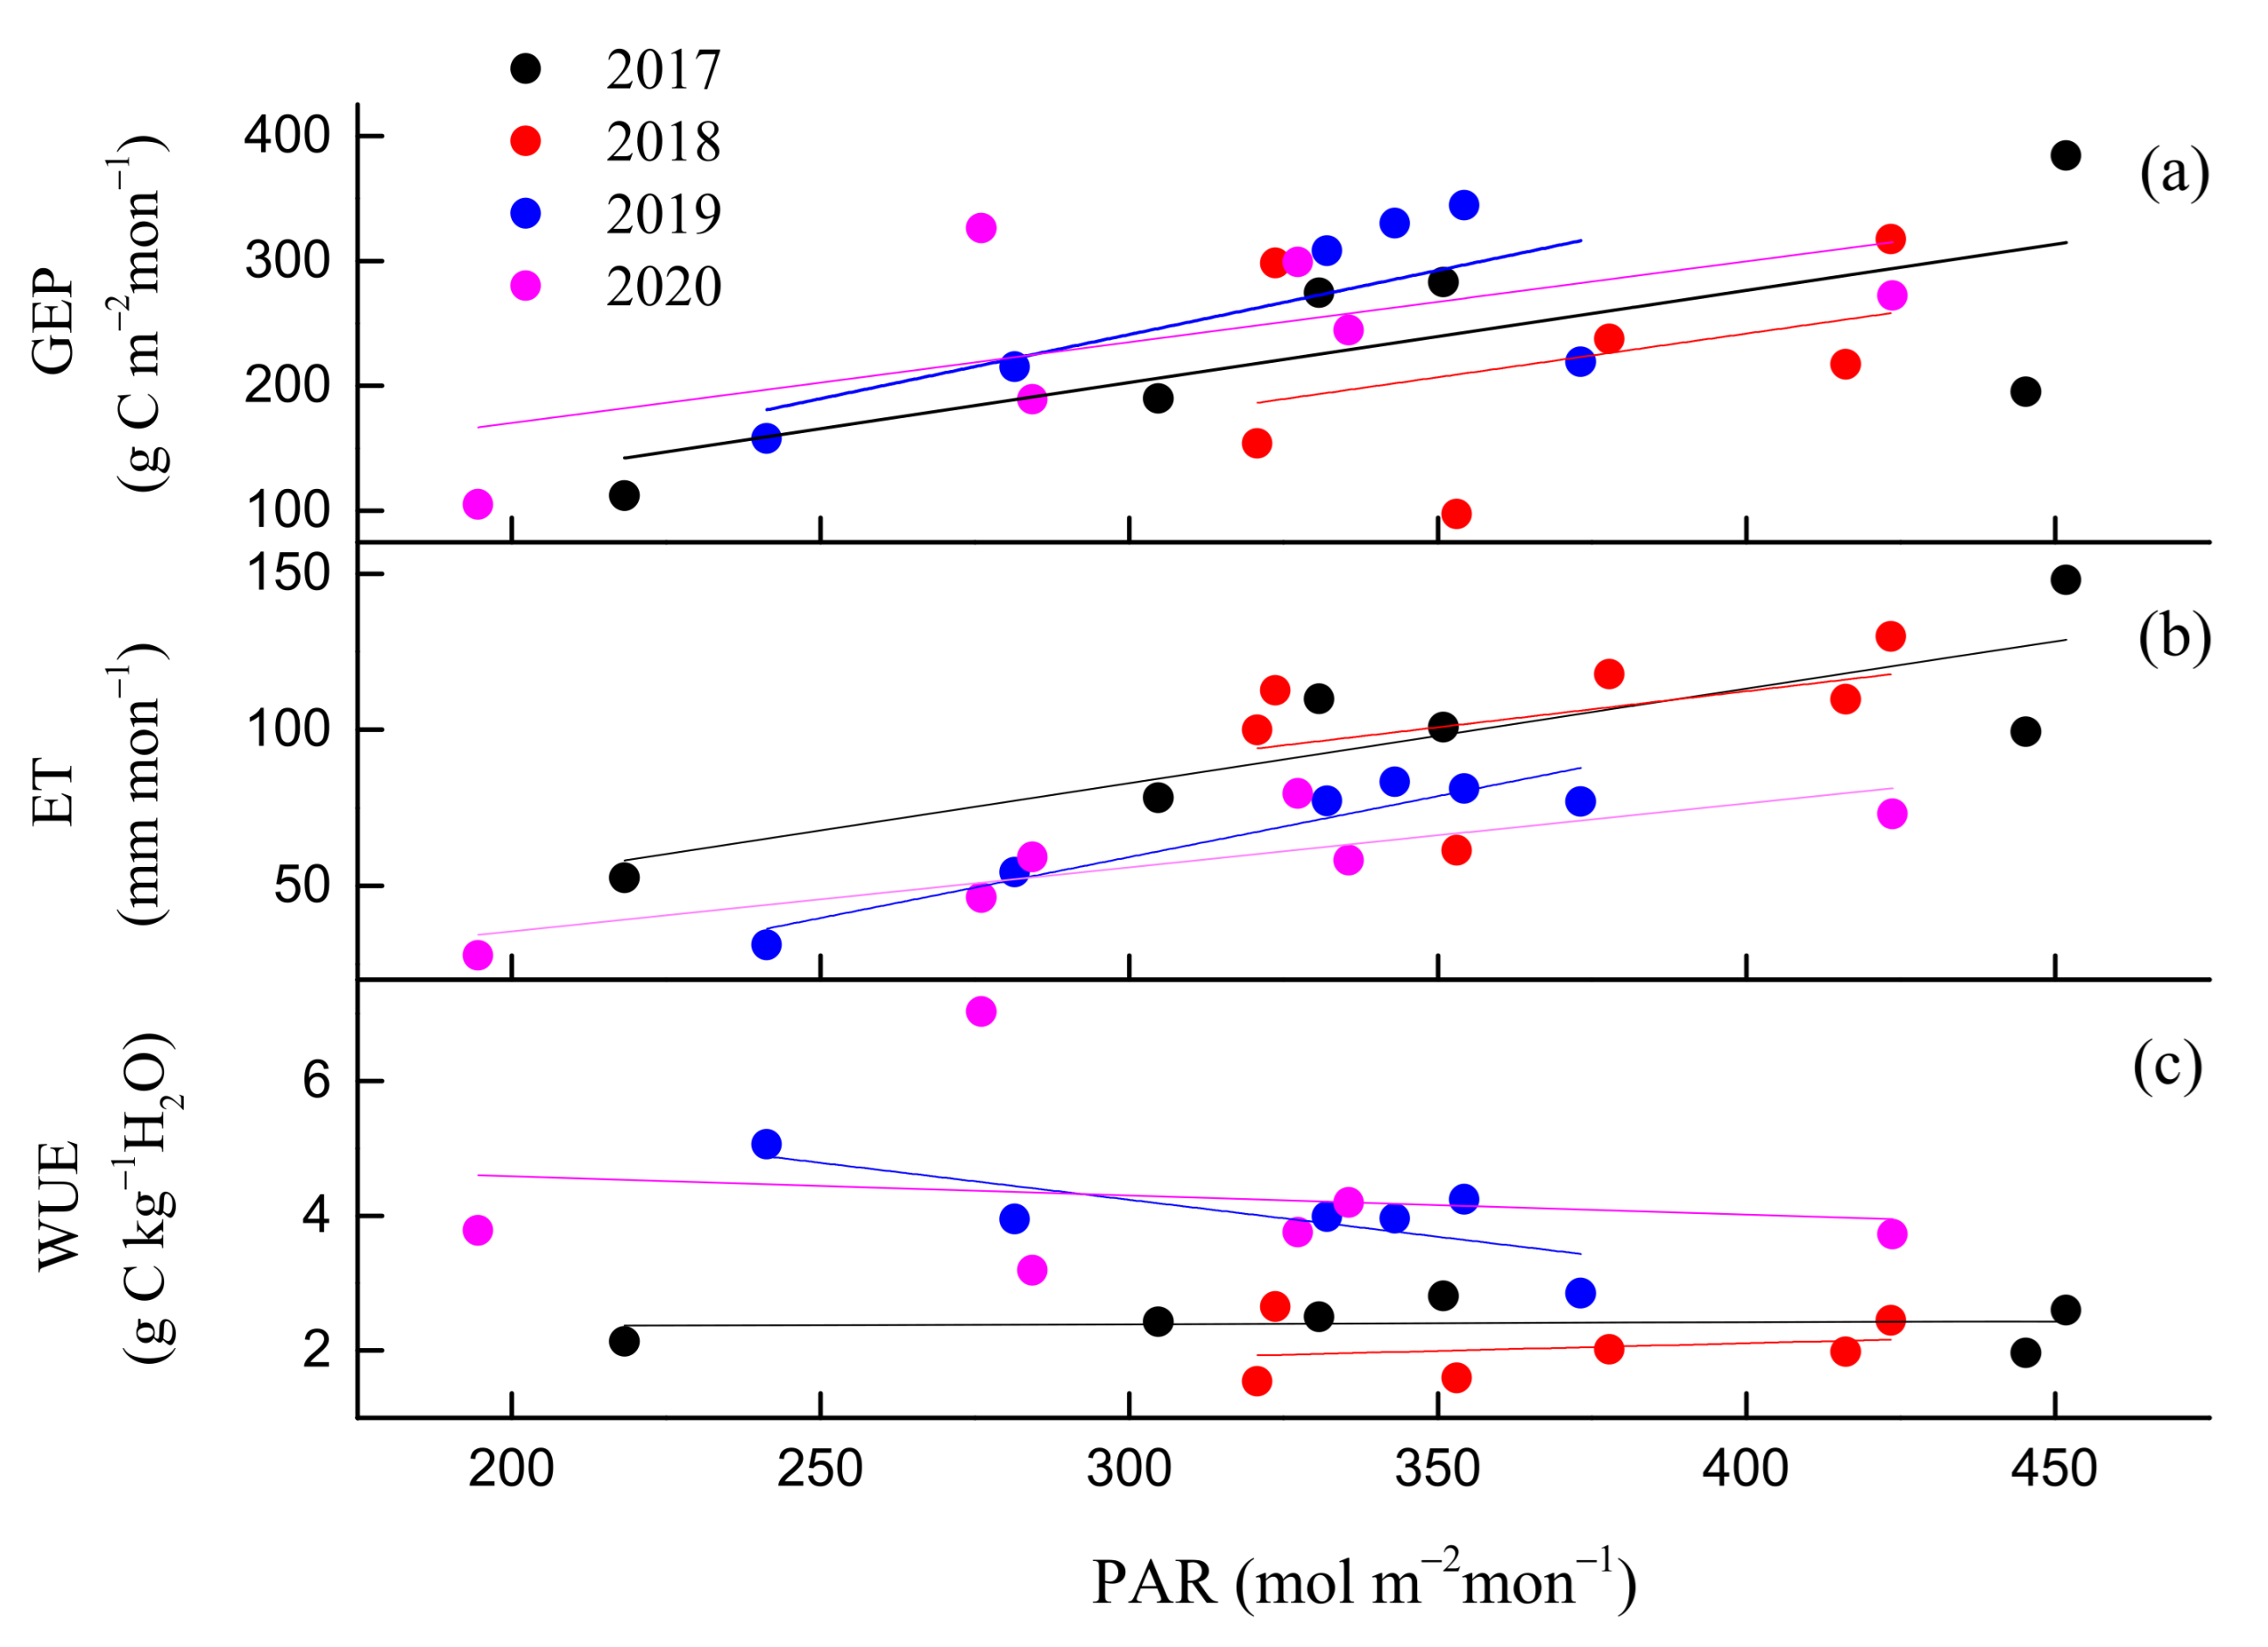
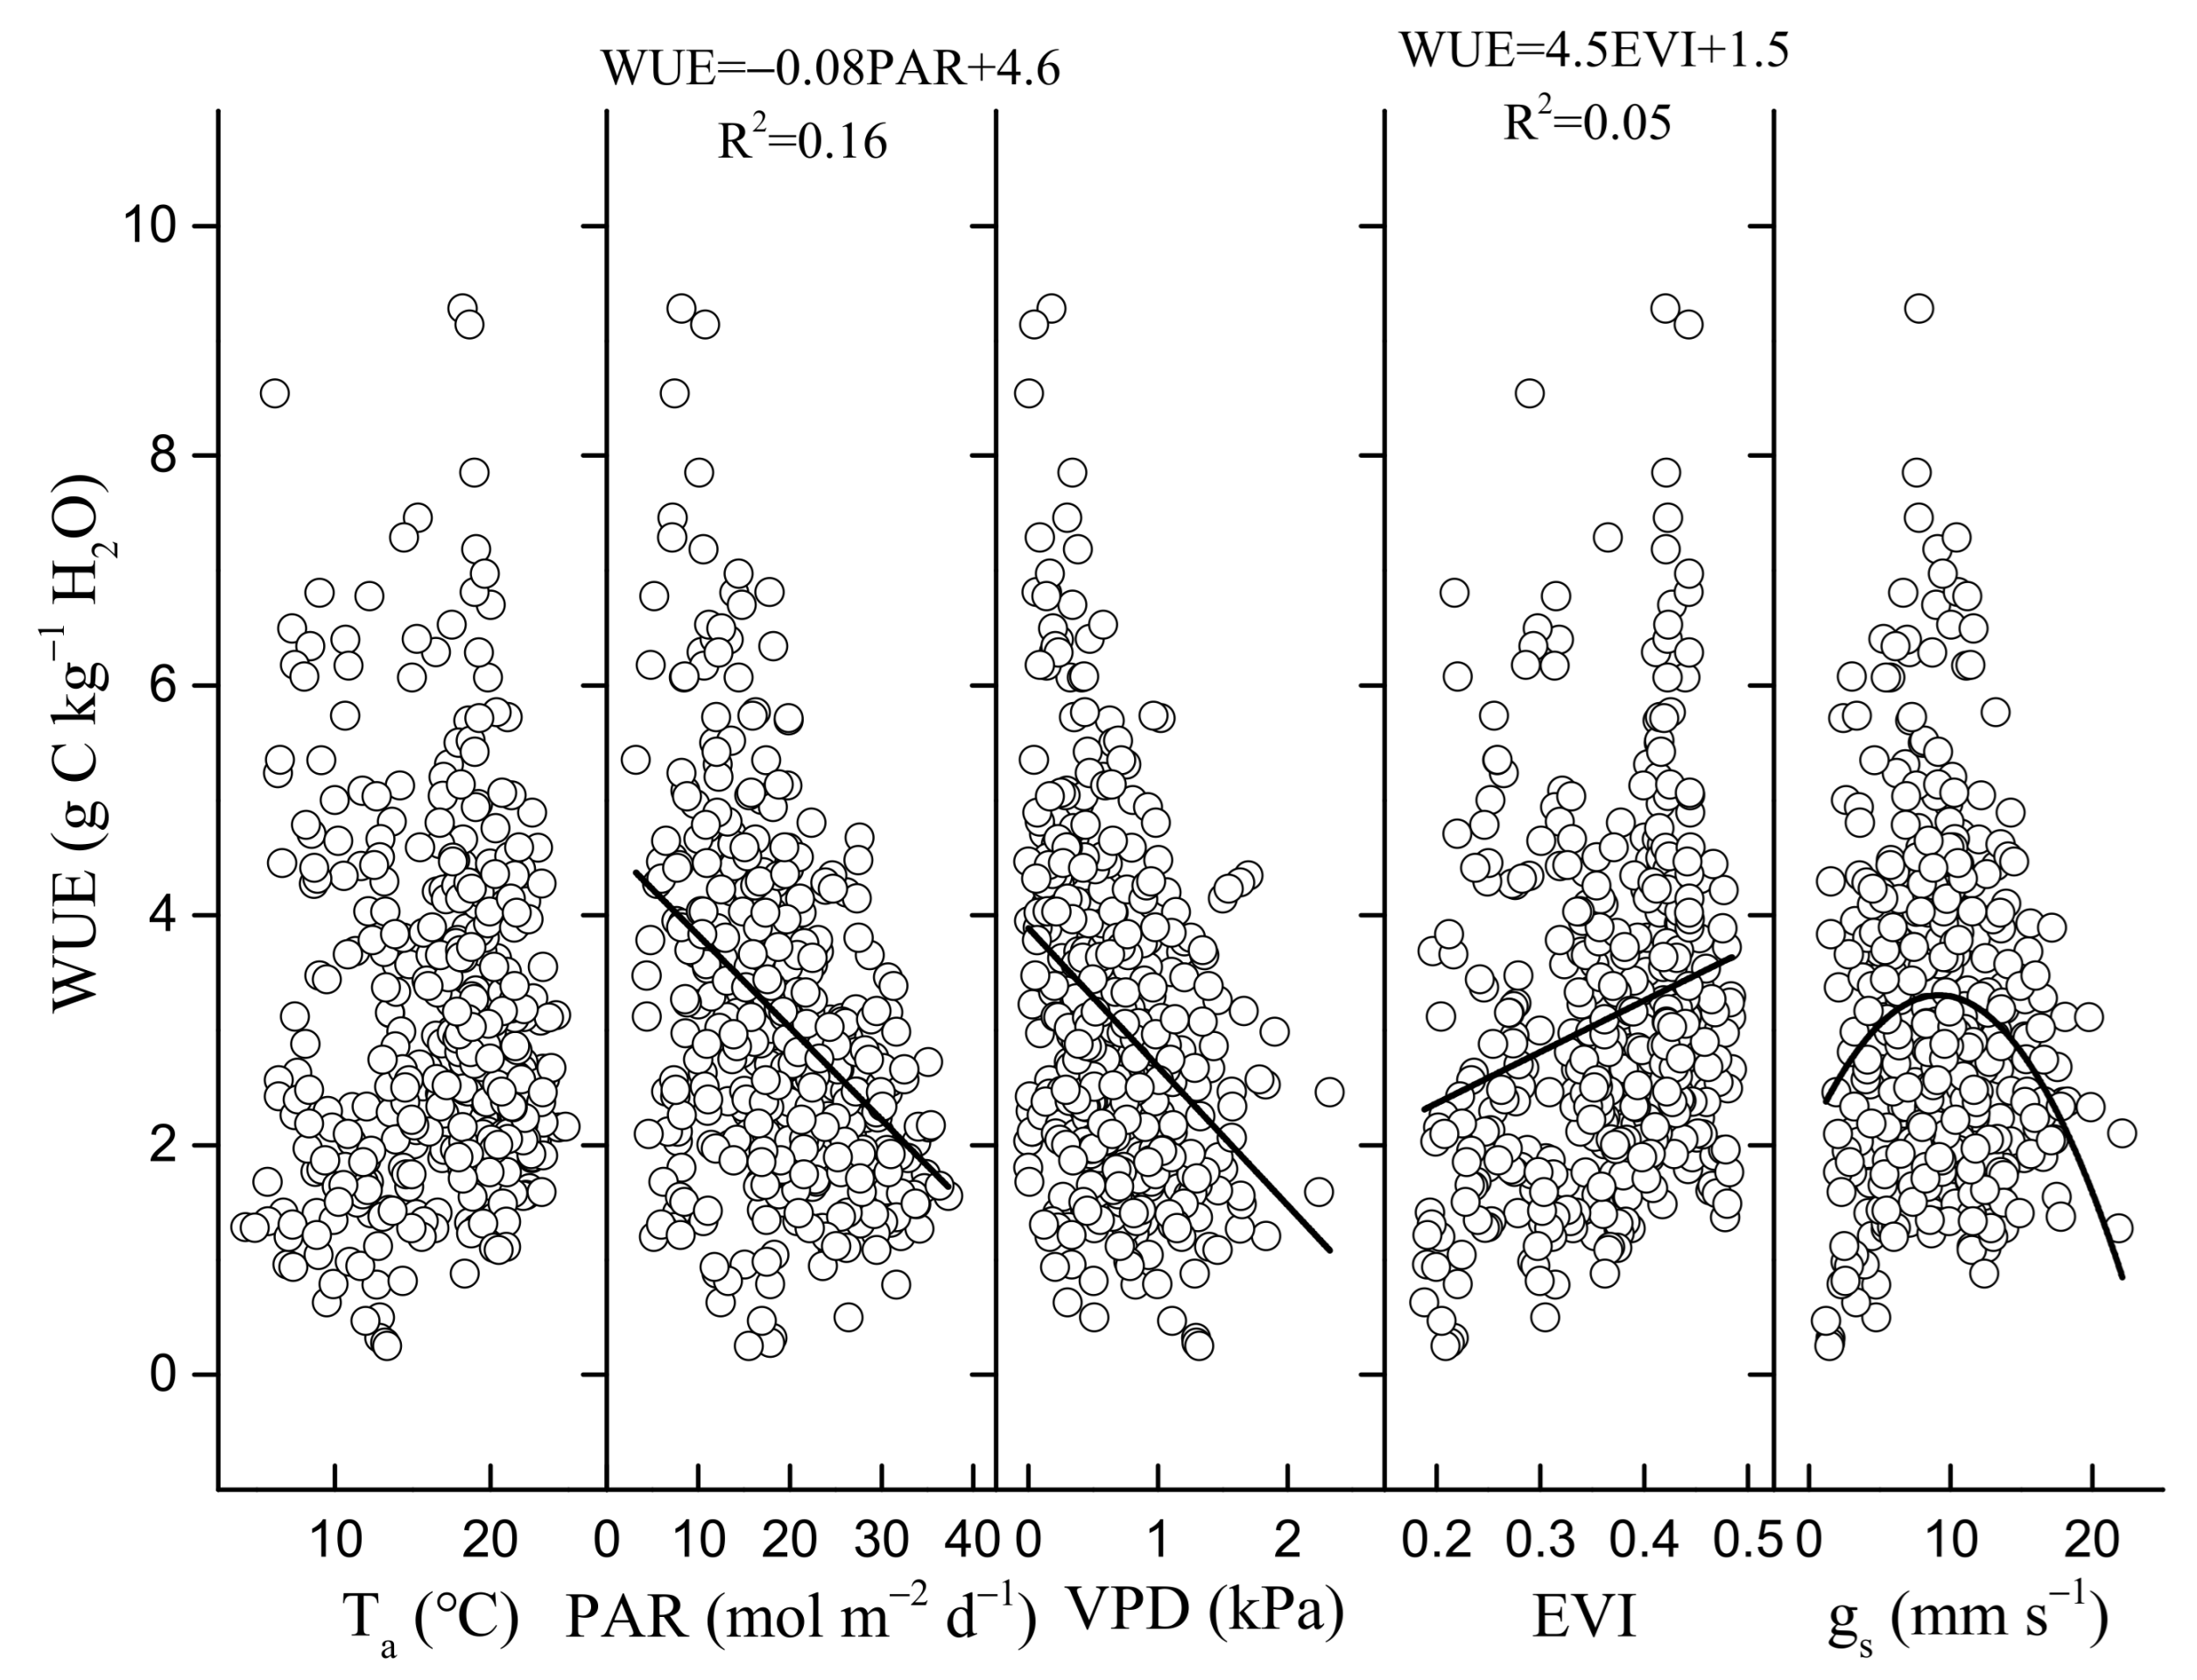
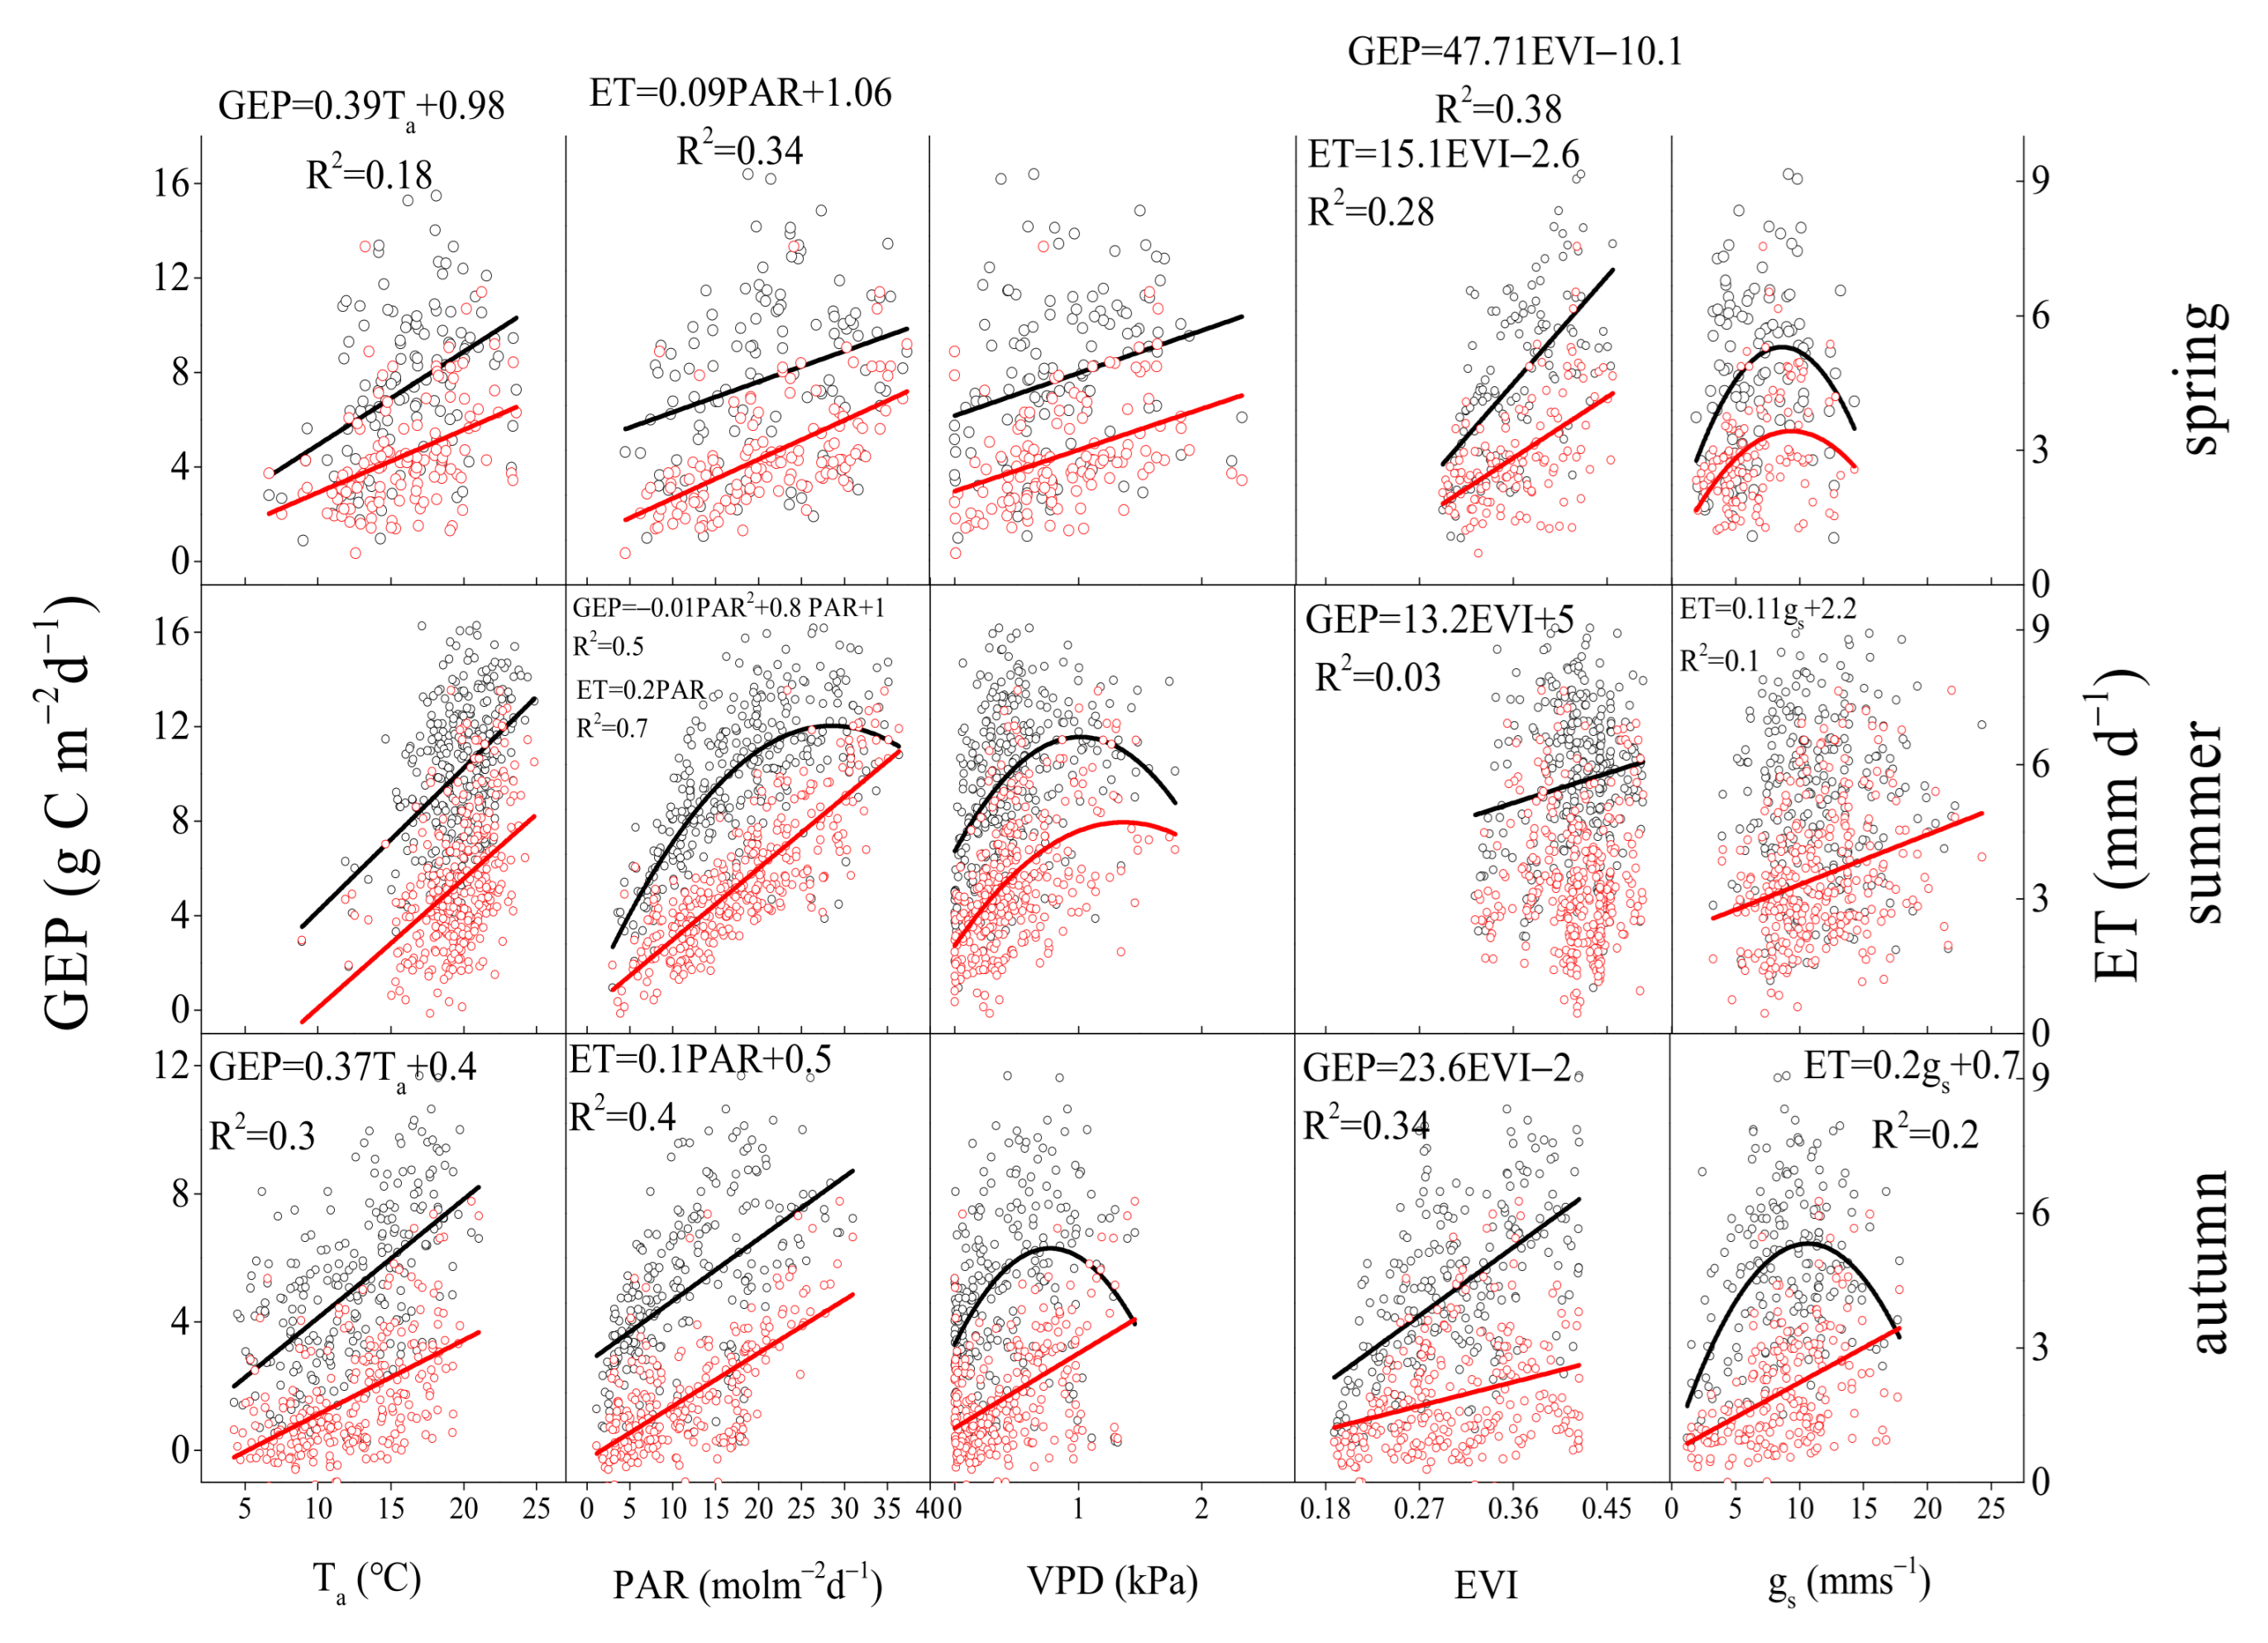
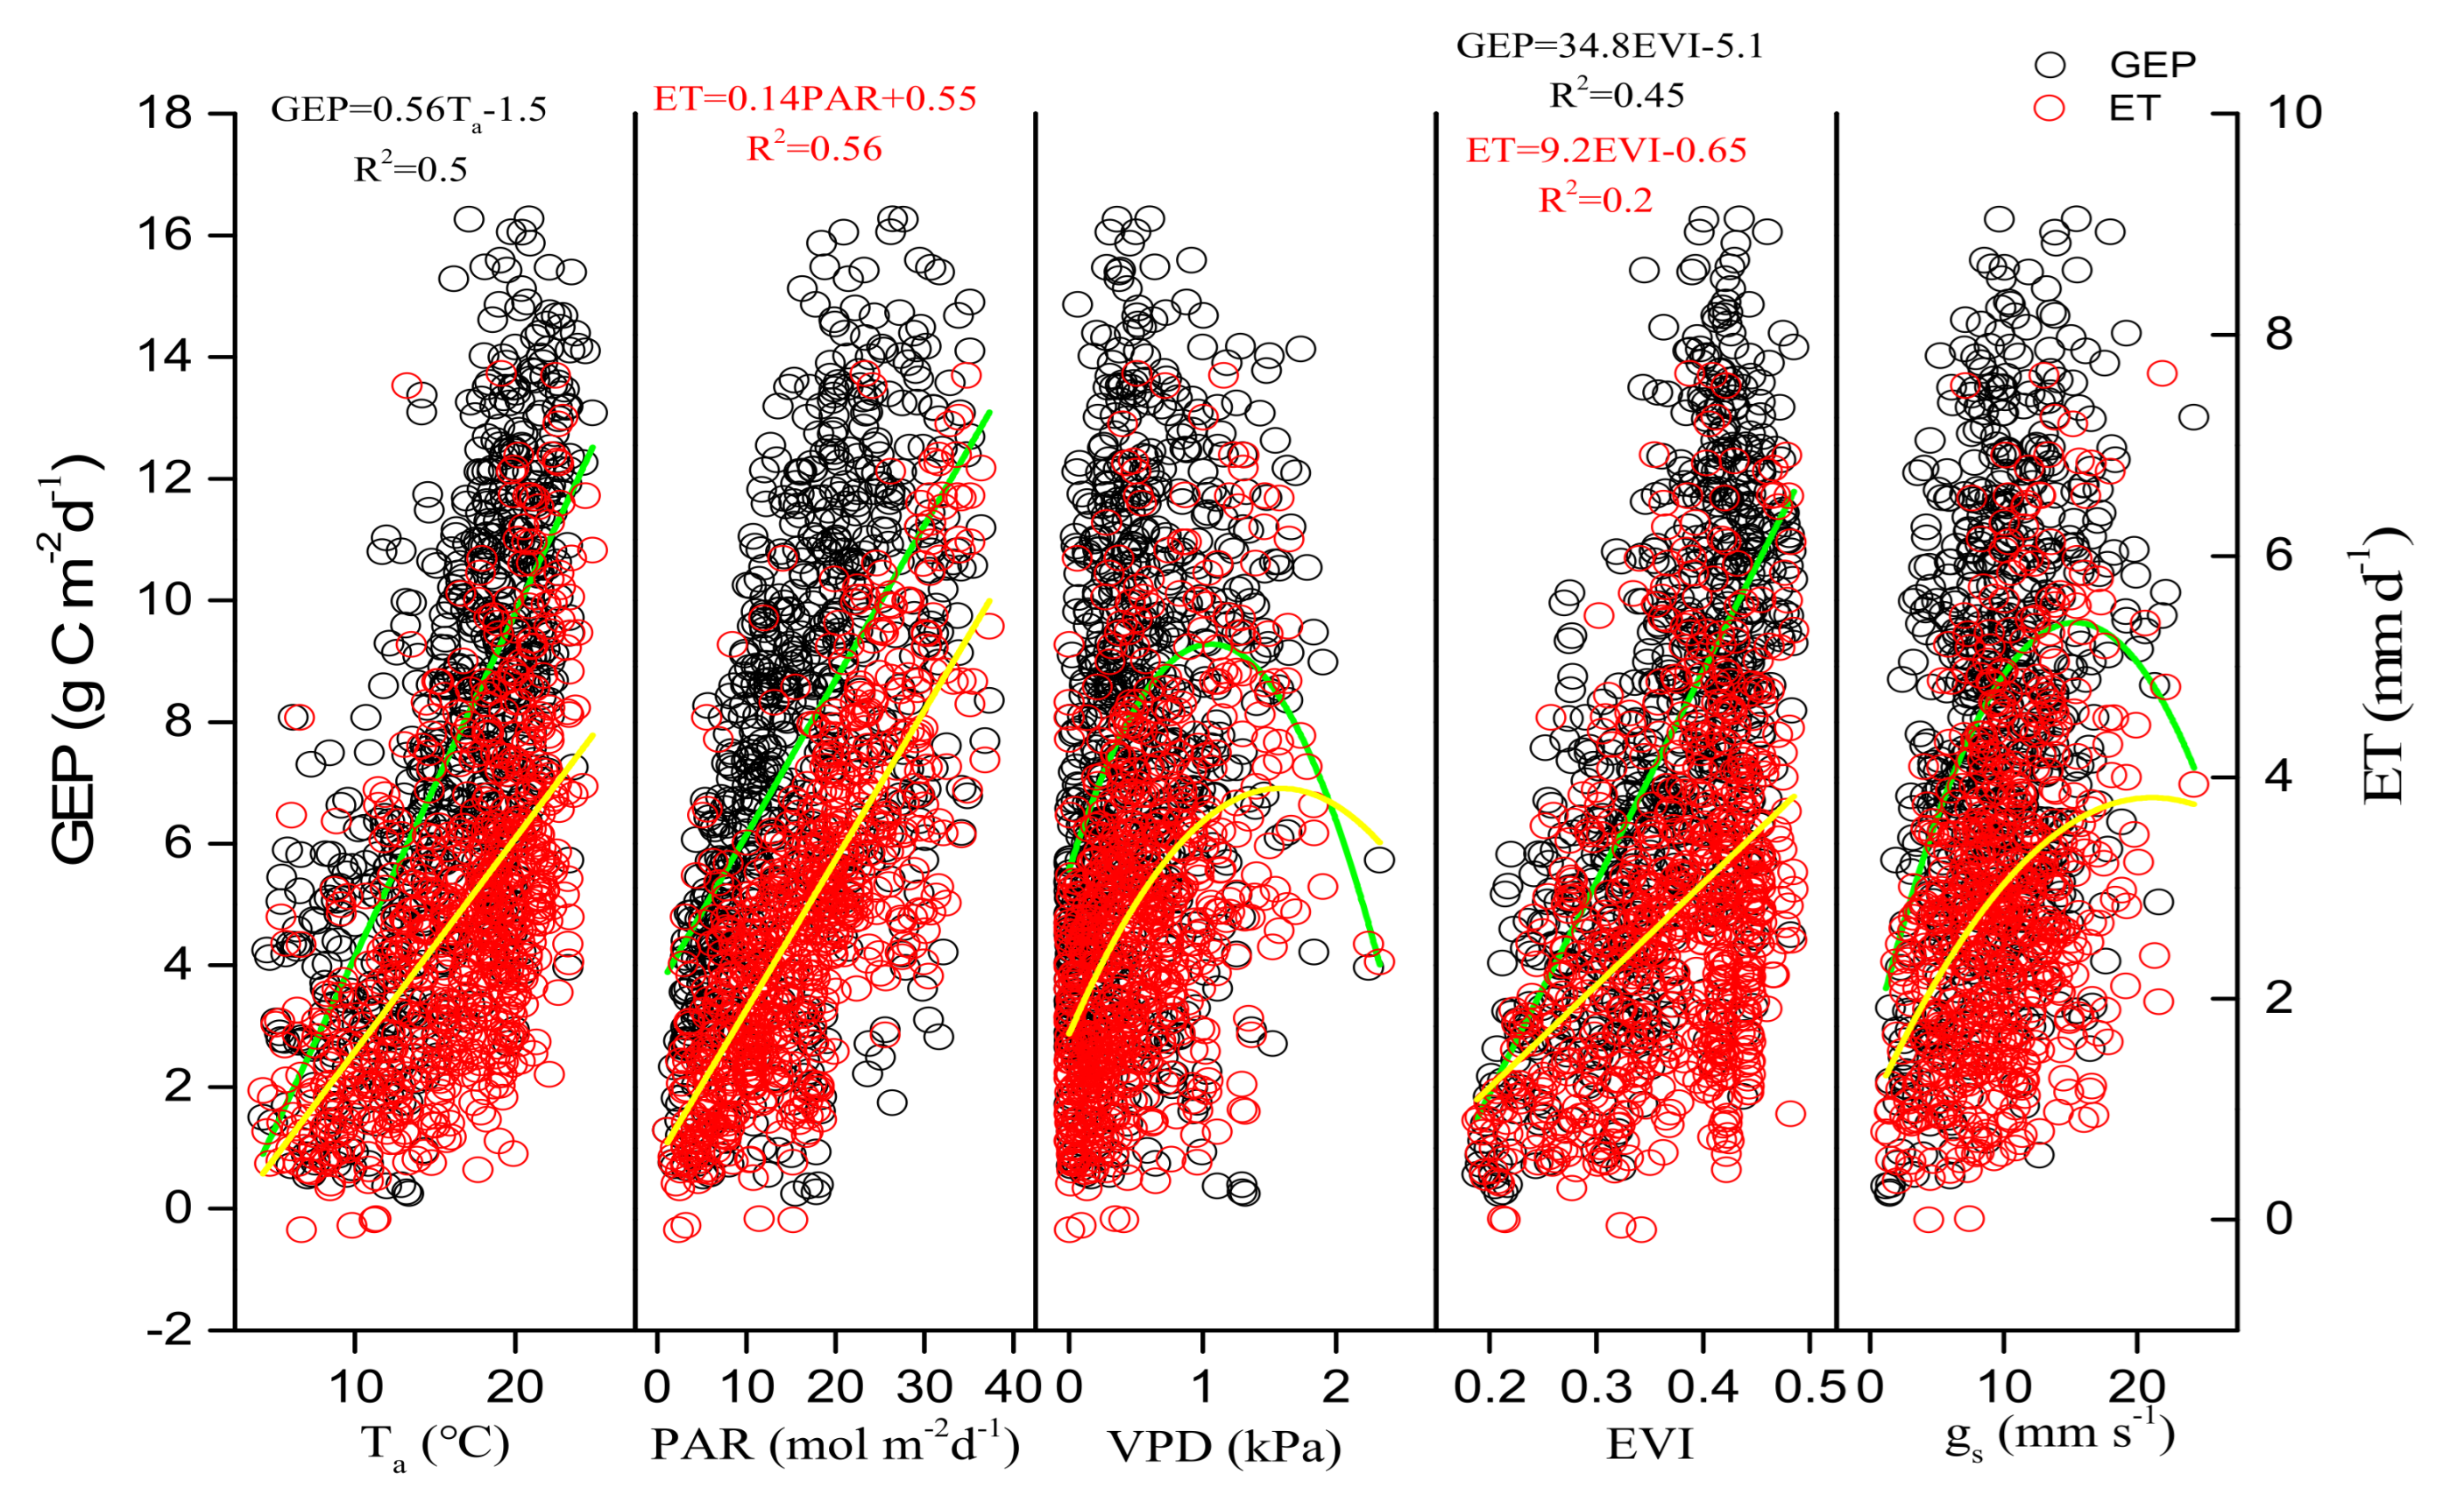
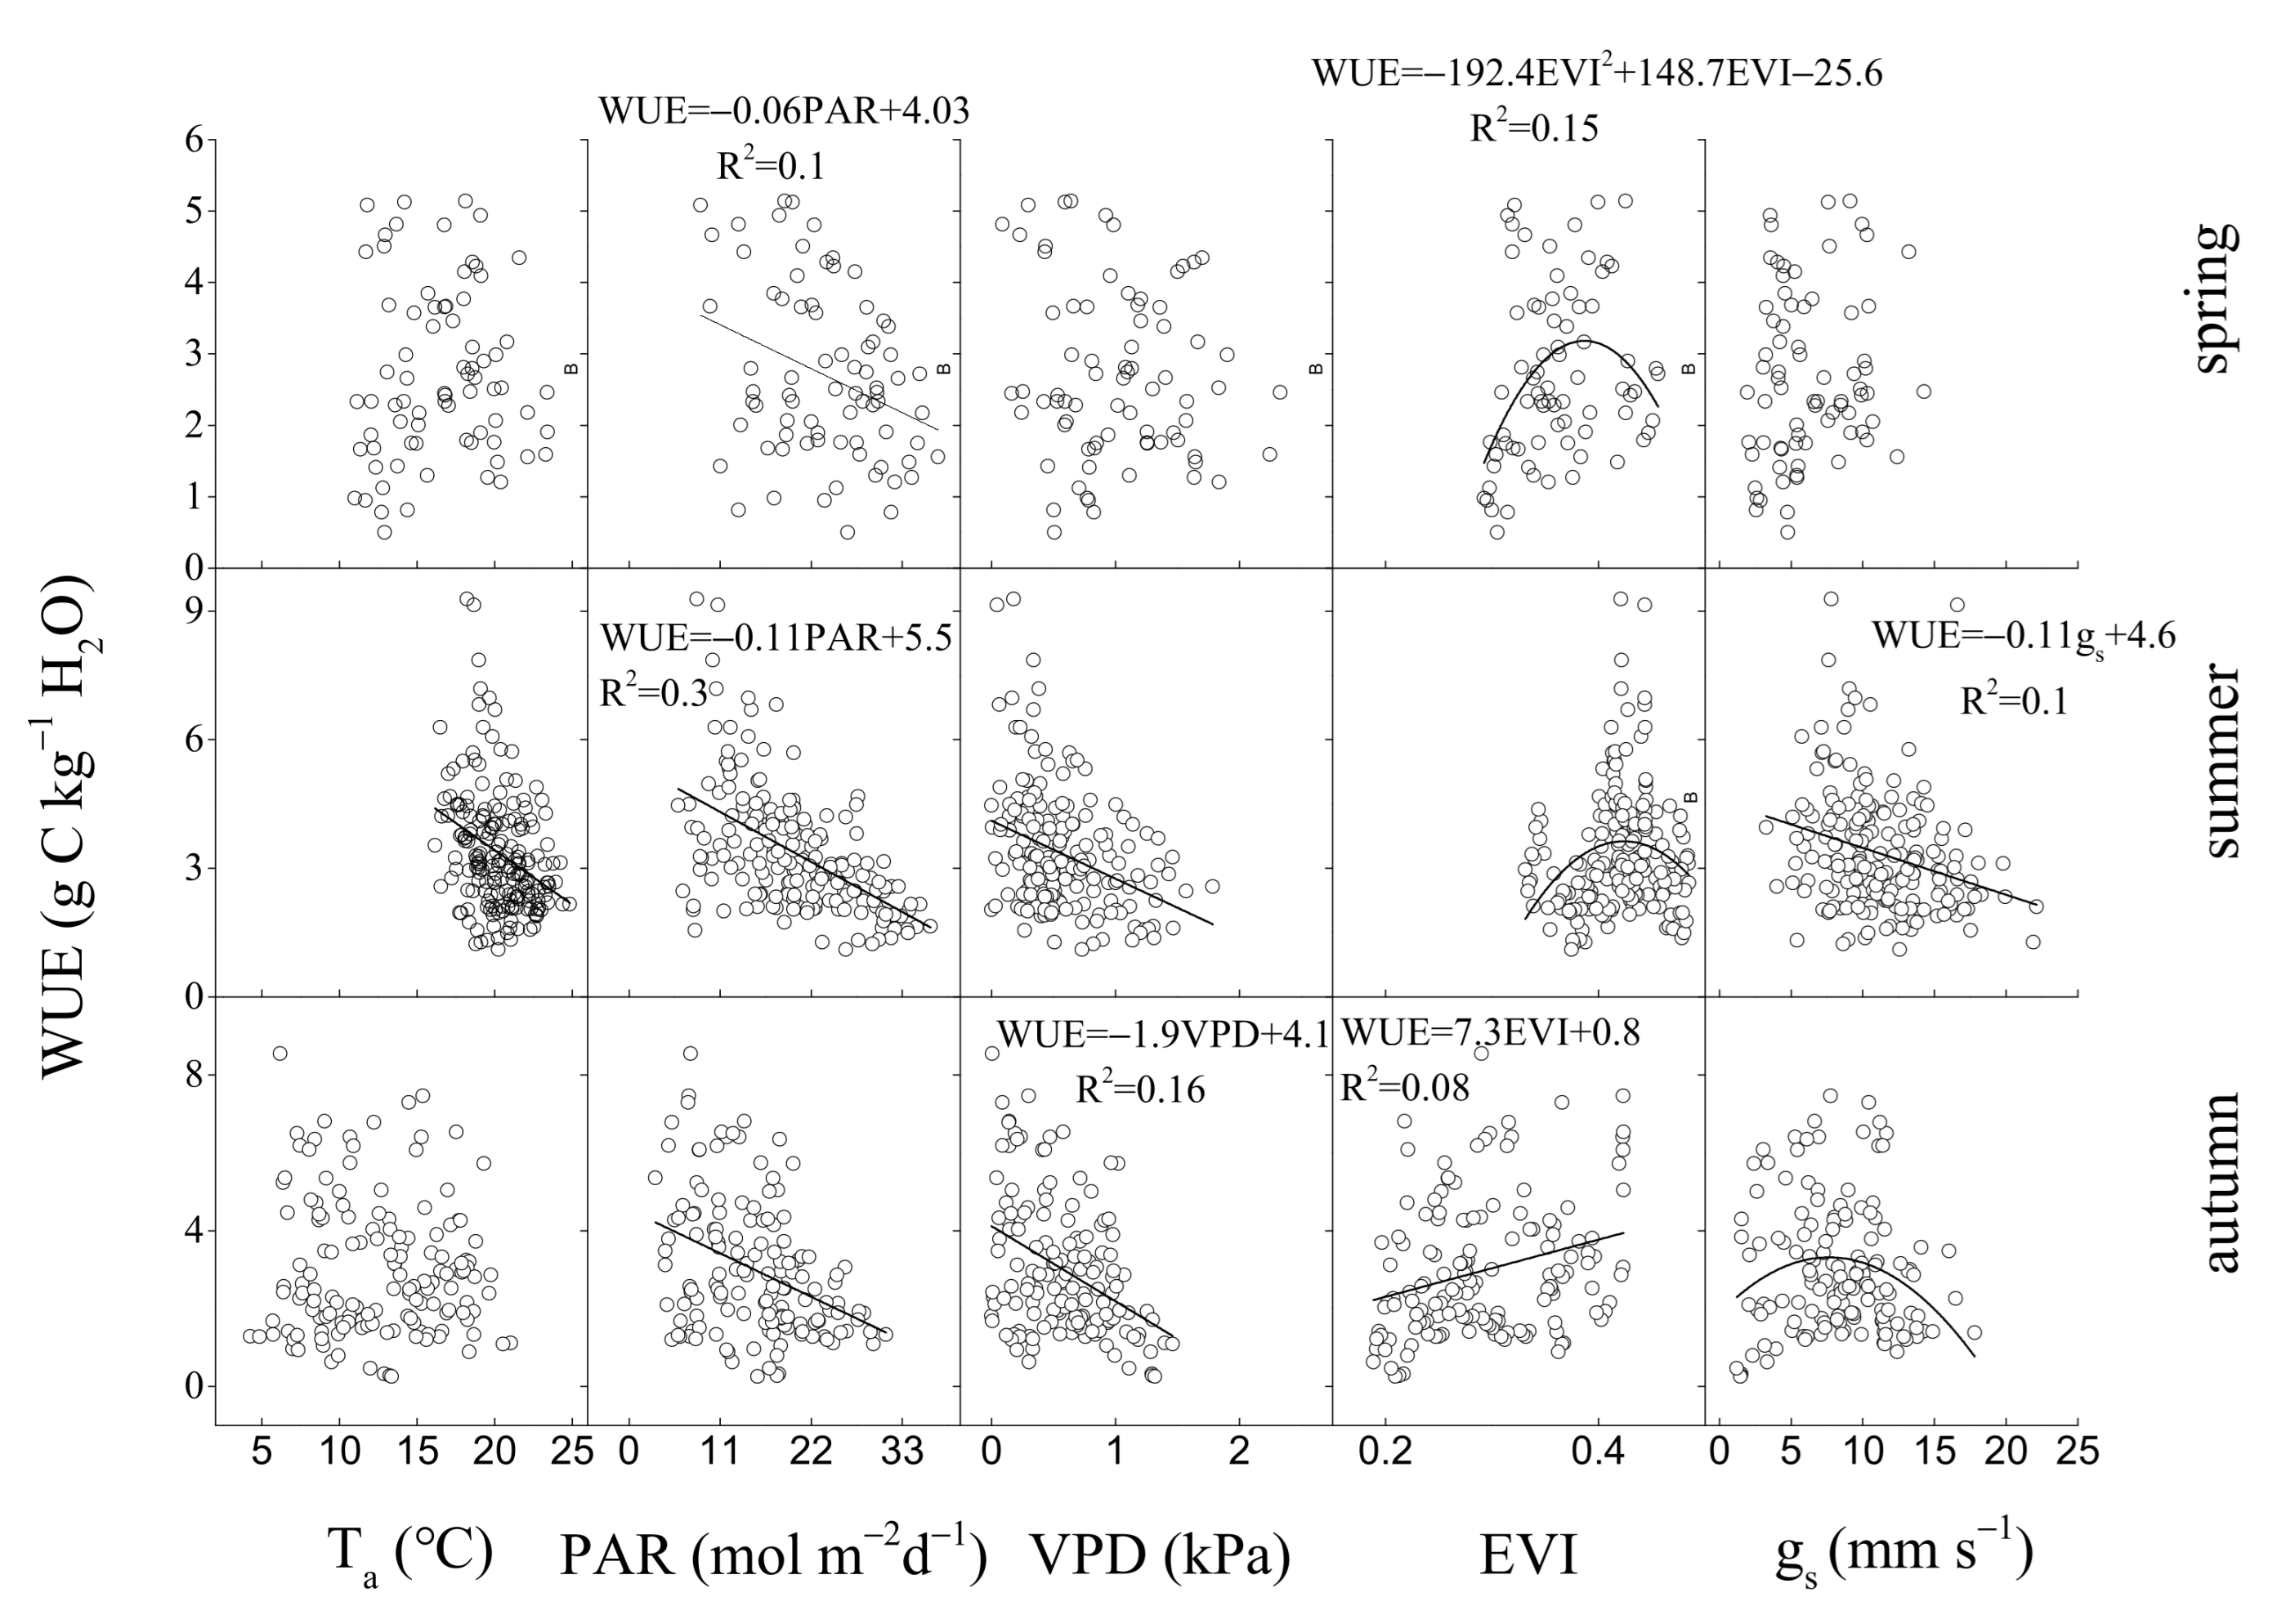
3.3. Environmental and Biological Controls on GEP, ET, and WUE

Environmental and biological factors had similar effects on daily GEP and ET, but the key environmental and biological factors that control GEP and ET were different in different seasons. Ta was the key environmental factor that controlled GEP in spring and autumn, but PAR was the key environmental factor in summer. Gs was the key biological factor that affected ET in summer and autumn, but EVI was the key biological factor in spring (Figure 7). During the whole growing season, the key environmental and biological factors that controlled GEP, ET were Ta, EVI and PAR, EVI (Figure 8). During summer, daily GEP and ET showed a positive relationship with PAR under two kinds of soil water contents (Figure 9a,b), when daily WUE was linearly and negatively related to PAR (Figure 9c). Under the same PAR level, lower ET and higher WUE under REW < 0.1 was observed compared with those under REW > 0.1. The relationship between GEP and PAR was not affected by low soil water content. Under similar PAR conditions, monthly ET, WUE in 2019 and 2020 was lower and higher than those in 2017 and 2018, respectively (Figure 10b,c). GEP in 2019 and 2020 was slightly higher than that in 2017 and 2018 (Figure 10a).
In contrast, the key environmental and biological factors that control WUE were PAR and EVI, PAR and gs, VPD and EVI, PAR and EVI, respectively, in spring, summer, autumn (Figure 11), and all of the growing seasons (Figure 12). Annual WUE had negative, linear relationships with precipitation in spring (R2 = 0.97, p < 0.05) (Figure 13a) and mean surface conductance (gs) (R2 = 0.91, p < 0.05) during the growing seasons (Figure 13b). Furthermore, a significantly negative relationship between the instantaneous gs and VPD in summer was observed in 2019 (Figure 14c) and 2020 (Figure 14d), but was positive in 2017 (Figure 14a). Daily gs decreased with VPD in 2018, when VPD was >1 kPa (Figure 14b). Gsref was 0.52 in 2019 (Figure 14c) and 0.5 in 2020 (Figure 14d), respectively. The ratios between m and gsref were 0.21 and 0.3 in the summer of 2019 and 2020, respectively.

4. Discussion

4.1. Drought Effects on WUE

Drought at different times had different effects on ecosystem WUE [55]. This study suggested that drought in summer (Figure 3d) decreased the ET (Figure 4b), gs (Figure 3f), and increased WUE (Figure 4c), particularly in 2019. During summer, when Ta was the highest in a year (Figure 3a), low soil water content (Figure 3d) resulted in low annual ET (559.6 mm year−1) and unaffected GEP (1723.4 g Cm−2year−1) in 2019 compared with ET in 2017 (738.1 mm year−1) and 2018 (805.2 mm year−1), GEP in 2017 (1609.1 g Cm−2year−1) and 2018 (1454 g Cm−2year−1) (Table 1). On the other hand, under the same PAR levels, ET under REW < 0.1 was distinctly lower than that when REW > 0.1 (Figure 9a). WUE under REW < 0.1 was also obviously higher than that under REW > 0.1 during the same PAR level (Figure 9c). However, the relationship between GEP and PAR was not affected by low soil water content (Figure 9b). Summer drought can affect ecosystem WUE by influencing stomatal behavior and vegetation greenness [56]. For instance, a significantly negative relationship between the instantaneous gs and VPD in summer (June–August) was observed in 2018 (Figure 14b), 2019 (Figure 14c) and 2020 (Figure 14d), but not in 2017 (Figure 14a). Gs even increased linearly with the increase in VPD in 2017 because it was a wet year. A study in a Douglas-fir forest [57] also showed that low soil moisture amplified the sensitivity of gs to VPD, leading to decreased ET during a dry period. Partial stomatal closure may reduce ET first but not affect CO2 absorption at leave level [58,59]. Wang [60] also found that decreases in gs due to increases in VPD can increase WUE of deciduous forests. On the other hand, many studies have shown that drought in summer can inhibit canopy development and affect the greenness of the ecosystem [61,62]. However, at this site, obviously decreased EVI was not observed during summer drought (Figure 3e). Many studies have also found that Normalized Difference Vegetation Index (NDVI) did not decrease or even increased during drought [63,64]. This difference may be related to drought intensity and the composition of tree species [65].
Responses of ecosystem to spring and autumn drought may differ from that to summer droughts [66,67]. Our study confirmed the first hypothesis. In this study, we observed that autumn drought decreased WUE and increased ET. Drought in autumn decreased WUE in 2018, maybe because of rather low SWC (Figure 3d), EVI (Figure 3e) and high PAR (Figure 3b), VPD (Figure 3a). During autumn drought, high PAR and VPD can increase ET (Figure 7). Some study suggested that only under low VPD and ample soil water was the stomatal optimization theory effective [17]. During autumn drought in this study, stomatal optimization behavior might fail during harsh conditions [68]. Furthermore, low EVI in autumn means that tree leaves become senescent, and stomatal regulation function may also be weakened [69], leading to increased ET and decreased WUE during autumn drought. In contrast, increased WUE caused by reduced ET during autumn drought was observed in a plantation [13]. The effect of autumn drought on ecosystem WUE needs further study. In this study, although no obvious drought was observed in spring, the decrease in precipitation in spring still existed. We found that a decrease in precipitation in spring led to increased annual WUE (Figure 13a). This result is consistent with finding in a mixed-wood plantation in the same area [23]. In our site, spring was the most vital period for canopy development of trees [47]. Although spring drought did not decrease EVI obviously during the growing season (Figure 3e), the stomatal density and size of the leaves may be affected during spring drought, leading to low annual surface conductance (gs). In addition, we also found a negative correlation between mean gs during the growing seasons and annual WUE (Figure 13b). Some study suggested that bamboo increased stomatal density but decreased stomatal size under manipulative drought [70]. For Quercus aliena, the dominant tree species in the natural oak forest, the stomatal traits of leaves may also have changed during spring drought, leading to higher annual WUE. In the future, we should further study the change of leaf traits during spring drought [71].
The response of ecosystem WUE to drought also depends on drought duration [72]. A long and continuous drought in 2019 (drought >20 days) (Figure 3c,d) significantly decreased gs (Figure 3f), ET (Figure 4b) and increased WUE (Figure 4c). In contrast, a short drought in the summer of 2018 (Figure 3c,d) did not have an apparent effect on gs, ET, and WUE. Therefore, we believe that short-term drought has little effect on the forest, but long-term drought will reduce ET and increase ecosystem WUE of the natural oak forest.
Many studies suggested that drought had a delayed effect on plant growth and water use [29,73,74,75]. In this study, we also found that annual ET and WUE in 2020 were the lowest and the highest in the 4 years, respectively, but precipitation in this year was sufficient. Notably, 2019 was a rare dry year, which also affected ET and WUE in 2020. Even though low PAR in 2020 may also be one of the reasons for the low ET in this year (Table 1), ET was still the lowest in the 4 years under the same PAR level (Figure 10b). Therefore, we conclude that strong drought can affect ecosystem WUE and ET the following year. However, the observed period was relatively short in this study, it is not clear for how many years the delayed effect can last.
In a word, we conclude that the natural oak forest adapts to spring and summer drought by increasing WUE (i.e., reducing ET), which could be due to its evolutionary strategy to secure carbon investments under harsh conditions [76].

4.2. Regulation of Seasonal and Inter-Annual Dynamics in WUE

Seasonal and inter-annual dynamics of WUE are determined by responses of GEP and ET to biological and environmental factors [77]. We found that key biophysical factor regulated the variation of WUE in summer was gs (Figure 11). Zhao [65] also found that gs was the most important biological factor regulating vegetation WUE. In this oak forest, the seasonal variation of ecosystem WUE was also negatively linearly correlated with PAR (Figure 12). Solar radiation drives photosynthesis and ET, resulting in variability in WUE [78]. Under weak light, GEP and ET increase with an increase in radiation. However, GEP will be suppressed with an increase in radiation under strong light, but ET continues to increase (Figure 8). At our site, monthly mean PAR usually peaked in May (Figure 3b). However, the air temperature was low (Figure 3a), the leaves were not fully developed during this period (Figure 3e), and the photosynthesis of the natural oak forest ecosystem was inhibited. Notably, the seasonal variability of WUE was more influenced by biological and environmental factors that control ET rather than GEP (Figure 8 and Figure 12).
Inter-annual fluctuation of WUE was affected by precipitation in spring (Figure 13a) and mean gs during the growing seasons (Figure 13b). For Quercus aliena, the critical period of canopy development occurred in spring (April–May). When precipitation decreased in spring, we did not see a decrease in EVI (Figure 3e), but soil water deficit in this period can affect the stomatal density and stomatal size and changed plant physiology, impacting ecosystem water use, leading to increased annual WUE. It should be noted that, for the study of inter-annual variation of WUE, the observation time in our site was relatively short, and it is necessary to use longer time data to study the control mechanism of inter-annual variability in ecosystem WUE in the next step.

4.3. WUE and Water Regulation Strategy of the Natural Oak Forest Ecosystem

During 4-year study period, annual WUE of the oak forest ecosystem ranged from 1.8 to 3.2 g Ckg−1H2O (Table 1), which is relatively low for temperate forests [79]. Nevertheless, the WUE value was higher than that in a mixed plantation in the same region [23]. In China, natural forests generally have higher WUE than the plantations [80]. In total, the natural oak forest ecosystem has relatively low WUE, but it should be noted that WUE varied greatly in wet and dry years. These results highlighted the importance of long-term continuous measurements for understanding long-term variations in ecosystem WUE under a changing climate [81].
Plants generally exhibit conservative water use strategy by regulating stomatal closure under drought stress in temperate forests [82,83]. In this study, distinctly decreased gs (Figure 3f) and ET (Figure 4b) during seasonal drought were observed. However, gs increased linearly with the increase in VPD in a wet year (Figure 14a). Furthermore, the ratio of m to gsref was 0.21 and 0.3 molm−2s−1ln(kPa)1 in summer of 2019 and 2020, respectively, both smaller than 0.6 molm−2s−1ln(kPa)−1, which has been considered to be the critical value for isohydric stomatal response [84]. In other words, the natural oak forest had typical anisohydric characteristics at ecosystem level, although it can regulate stomatal closure to cope with seasonal drought stress. In general, at the level of individual plants, an-isohydric species can sequester carbon more steadily than isohydric species subjected to seasonal drought [85], although the conclusion remains controversial. Our results seem to support this point at ecosystem level. The water regulation strategy of this natural oak forest was consistent with that of a poplar plantation [86]. Precipitation was relatively abundant in our site; this water regulation strategy may be more conductive to sequester carbon. These results indicated that unaffected carbon absorption capacity under seasonal drought can be related to anisohydric characteristics of the oak forest ecosystem. Nevertheless, GEP of the natural oak forest ecosystem may be inhibited when more serious drought occurred. In total, our findings show that the natural oak forest has strong resistance to seasonal drought and can steadily absorb carbon from the atmosphere under moderate drought conditions. Our study confirmed the second hypothesis clearly.

5. Conclusions

Based on 4-year observed data, the study investigated the effects of seasonal drought in ecosystem WUE and water regulation strategy of a natural oak forest in Central China. Both spring drought and summer drought increased WUE, only autumn drought reduced it, which may be caused by leaf senescence. Additionally, spring drought increased annual ecosystem WUE. Short drought did not affect ecosystem function when long-term drought affected ecosystem ET and WUE significantly. Strong drought can also affect ecosystem WUE and water regulation strategy of the following year. During summer drought, surface conductance (gs) usually decreased with an increase in VPD, when the ratios of stomatal sensitivity (m) and reference conductance (gsref) were 0.21 and 0.3 molm−2s−1ln(kPa)−1 in summer of 2019 and 2020. These results suggested that drought in different seasons and of different durations had different effects on ecosystem WUE. Overall, we conclude that the natural oak forest has strong resistance to seasonal drought and can maintain high GEP by increasing WUE (i.e., reducing ET) during dry conditions, which could be due to its typical anisohydric characteristics although it can also reduce stomatal opening during long-term drought.

Author Contributions

Conceptualization, X.N. and S.L.; data curation, X.N.; methodology, X.N.; supervision, S.L.; writing—original draft, X.N.; writing—review and editing, X.N. Both authors have read and agreed to the published version of the manuscript.

Funding

This study was supported by the National Key Technology R&D Program of China (2018YFC0507301).

Institutional Review Board Statement

Not applicable.

Informed Consent Statement

Not applicable.

Data Availability Statement

Not applicable.

Conflicts of Interest

The authors declare no conflict of interest.

References

  1. IPCC. Climate change. Synthesis report. In Contribution of Working Groups I, II and III to the Fifth Assessment Report of the Intergovernmental Panel on Climate Change; Pachauri, R.K., Meyer, L.A., Eds.; IPCC: Geneva, Switzerland, 2014; p. 151. [Google Scholar]
  2. Wang, X.; Qiu, B.; Li, W.; Zhang, Q. Impacts of drought and heatwave on the terrestrial ecosystem in China as revealed by satellite solar-induced chlorophyll fluorescence. Sci. Total. Environ. 2019, 693, 133627. [Google Scholar] [CrossRef]
  3. Song, X.; Chen, X.; Zhou, G.; Jiang, H.; Peng, C. Observed high and persistent carbon uptake by Moso bamboo forests and its response to environmental drivers. Agric. For. Meteorol. 2017, 247, 467–475. [Google Scholar] [CrossRef]
  4. Zhou, J.; Zhang, Z.; Sun, G.; Fang, X.; Zha, T.; Steve, M.; Chen, J.; Jin, Y.; Noormets, A. Response of ecosystem carbon fluxes to drought events in a poplar plantation in Northern China. For. Ecol. Manag. 2013, 300, 33–42. [Google Scholar] [CrossRef]
  5. Zhang, Z.; Huang, M.; Yang, Y.; Zhao, X. Evaluating drought-induced mortality risk for Robinia pseudoacacia plantations along the precipitation gradient on the Chinese Loess Plateau. Agric. For. Meteorol. 2020, 284, 107897. [Google Scholar] [CrossRef]
  6. Xenakis, G.; Ash, A.; Siebicke, L.; Perks, M.; Morison, J. Comparison of the carbon, water and energy balances of mature stand and clear-fell stages in a British Sitka spruce forests and the impact of the 2018 drought. Agric. For. Meteorol. 2021, 306, 108437. [Google Scholar] [CrossRef]
  7. Houghton, R.A. Aboveground forest biomass and the global carbon balance. Glob. Chang. Biol. 2010, 11, 945–958. [Google Scholar] [CrossRef]
  8. Food and Agriculture Organization of the United Nations (FAO) 2020. Global Forest Resources Assessment. Available online: http://www.fao.org/documents/card/en/c/ca9825en/ (accessed on 1 February 2021).
  9. Liu, S.; Wu, S.; Wang, H. Managing planted forests for multiple uses under a changing environment in China. N. Z. J. For. Sci. 2014, 44, S3/1–S3/9. [Google Scholar] [CrossRef] [Green Version]
  10. Cao, S.; Wang, X.; Song, Y.; Chen, L.; Feng, Q. Impacts of the Natural Forest Conservation Program on the livelihoods of residents of Northwestern China: Perceptions of residents affected by the program. Ecol. Econ. 2010, 69, 1454–1462. [Google Scholar] [CrossRef]
  11. Guo, L.; Sun, F.; Liu, W.; Zhang, Y.; Wang, H.; Cui, H.; Wang, H.; Zhang, J.; Du, B. Response of ecosystem water use efficiency to drought over China during 1982–2015: Spatiotemporal variability and resilience. Forests 2019, 10, 598. [Google Scholar] [CrossRef] [Green Version]
  12. Zhou, J.; Zhang, Z.; Sun, G.; Fang, X.; Zha, T.; Chen, J.; Noormets, A.; Guo, J.; McNulty, S. Water-use efficiency of a poplar plantation in Northern China. J. For. Res. 2014, 19, 483–492. [Google Scholar] [CrossRef]
  13. Xie, J.; Zha, T.; Zhou, C.; Jia, X.; Yu, H.; Yang, B.; Chen, J.; Zhang, F.; Wang, B.; Bourque, C.; et al. Seasonal variation in ecosystem water use efficiency in an urban-forest reserve affected by periodic drought. Agric. For. Meteorol. 2016, 221, 142–151. [Google Scholar] [CrossRef]
  14. Knowles, J.; Scott, R.; Minor, R.; Gafford, G. Ecosystem carbon and water cycling from a sky island montane forest. Agric. For. Meteorol. 2020, 281, 107835. [Google Scholar] [CrossRef]
  15. Jiang, Y.; Still, C.J.; Rastogi, B.; Page, G.; Wharton, S.; Meinzer, F.C.; Voelker, S.; Kim, J.B. Trends and controls on water-use efficiency of an old-growth coniferous forest in the Pacific Northwest. Environ. Res. Lett. 2019, 14, 074029. [Google Scholar] [CrossRef] [Green Version]
  16. Jones, H.; Black, T.A.; Jassal, R.S.; Nesic, Z.; Grant, N.; Bhatti, J.; Sidders, D. Water balance, surface conductance and water use efficiency of two young hybrid-poplar plantations in Canada’s aspen parkland. Agric. For. Meteorol. 2017, 246, 256–271. [Google Scholar] [CrossRef]
  17. Xu, H.; Zhang, Z.; Xiao, J.; Chen, J.; Zhu, M.; Cao, W.; Chen, Z. Environmental and canopy stomatal control on ecosystem water use efficiency in a riparian poplar plantation. Agric. For. Meteorol. 2020, 287, 107953. [Google Scholar] [CrossRef]
  18. Wagle, P.; Gowda, P.H.; Xiao, X.; Anup, K.C. Parameterizing ecosystem light use efficiency and water use efficiency to estimate maize gross primary production and evapotranspiration using MODIS EVI. Agric. For. Meteorol. 2016, 222, 87–97. [Google Scholar] [CrossRef] [Green Version]
  19. Xie, J.; Chen, J.; Sun, G.; Zha, T.; Yang, B.; Chu, H.; Liu, J.; Wan, S.; Zhou, C.; Ma, H.; et al. Ten-year variability in ecosystem water use efficiency in an oak-dominated temperate forest under a warming climate. Agric. For. Meteorol. 2016, 218–219, 209–217. [Google Scholar] [CrossRef]
  20. Zhang, M.; Chen, S.; Jiang, H.; Lin, Y.; Zhang, J.; Song, X.; Zhou, G. Water-use characteristics and physiological response of moso bamboo to flash droughts. Int. J. Environ. Res. Public Health 2019, 16, 2174. [Google Scholar] [CrossRef] [Green Version]
  21. Gao, L.; Zhao, P.; Kang, S.; Li, S.; Tong, L.; Ding, R.; Lu, H. Surface soil water content dominates the difference between ecosystem and canopy water use efficiency in a sparse vineyard. Agric. Water Manag. 2019, 226, 105817. [Google Scholar] [CrossRef]
  22. Roby, M.C.; Scott, R.L.; Moore, D. High vapor pressure deficit decreases the productivity and water-use efficiency of rain-induced pulses in semiarid ecosystems. J. Geophys. Res. Biogeosci. 2020, 125, e2020JG005665. [Google Scholar] [CrossRef]
  23. Tong, X.; Zhang, J.; Meng, P.; Lin, J.; Zheng, N. Ecosystem water use efficiency in a warm-temperate mixed plantation in the North China. J. Hydrol. 2014, 512, 221–228. [Google Scholar] [CrossRef]
  24. Aguilos, M.; Stahl, C.; Burban, B.; Herault, B.; Courtois, E.; Coste, S.; Wanger, F.; Ziegler, C.; Takagi, K.; Bonal, D. Interannual and seasonal variations in ecosystem transpiration and water use efficiency in a tropical rainforest. Forests 2018, 10, 14. [Google Scholar] [CrossRef] [Green Version]
  25. Tang, Y.; Wen, X.; Sun, X.; Zhang, X.; Wang, H. The limiting effect of deep soil water on evapotranspiration of a subtropical coniferous plantation subjected to seasonal drought. Adv. Atmos. Sci. 2014, 31, 385–395. [Google Scholar] [CrossRef]
  26. Kuglitsch, F.G.; Reichstein, M.; Beer, C.; Carrara, A.; Ceulemans, R.; Granier, A.; Janssens, I.; Koestner, B.; Lindroth, A.; Loustau, D.; et al. Characterisation of ecosystem water-use efficiency of European forests from eddy-covariance measurements. Biogeosci. Discuss. 2008, 5, 4481–4519. [Google Scholar]
  27. Wolf, S.; Eugster, W.; Ammann, C.; Hani, M.; Zielis, S.; Hiller, R.; Stieger, J.; Imer, D.; Merbold, L.; Buchmann, N. Contrasting response of grassland versus forest carbon and water fluxes to spring drought in Switzerland. Environ. Res. Lett. 2013, 8, 1345–1346. [Google Scholar] [CrossRef] [Green Version]
  28. Ma, J.; Jia, X.; Zha, T.; Bourque, C.P.; Tian, Y.; Bai, Y.; Liu, P.; Yang, R.; Li, C.; Li, C.; et al. Ecosystem water use efficiency in a young plantation in Northern China and its relationship to drought. Agric. For. Meteorol. 2019, 275, 1–10. [Google Scholar] [CrossRef]
  29. Liu, L.; Zhang, Y.; Wu, S.; Li, S.; Qin, D. Water memory effects and their impacts on global vegetation productivity and resilience. Sci. Rep. 2018, 8, 2962. [Google Scholar] [CrossRef]
  30. Anderegg, W.; Schwalm, C.; Biondi, F.; Camarero, J.; Koch, G.; Litvak, M.; Ogle, K.; Shaw, J.; Shevliakova, E.; Williams, A.; et al. Pervasive drought legacies in forest ecosystems and their implications for carbon cycle models. Science 2015, 349, 528–532. [Google Scholar] [CrossRef] [Green Version]
  31. Hernández-Santana, V.; David, T.S.; Martínez-Fernández, J. Environmental and plant-based controls of water use in a Mediterranean oak stand. For. Ecol. Manag. 2008, 255, 3707–3715. [Google Scholar] [CrossRef]
  32. Chen, Z.; Zhang, Y.; Yuan, W.; Zhu, S.; Pan, R.; Wan, X.; Liu, S. Coordinated variation in stem and leaf functional traits of temperate broadleaf tree species in the isohydric-anisohydric spectrum. Tree Physiol. 2021.
  33. Schmidt-Walter, P.; Richter, F.; Herbst, M.; Schuldt, B.; Lamersdorf, N. Transpiration and water use strategies of a young and a full-grown short rotation coppice differing in canopy cover and leaf area. Agric. For. Meteorol. 2014, 195–196, 165–178. [Google Scholar] [CrossRef]
  34. Domec, J.C.; Johnson, D.M. Does homeostasis or disturbance of homeostasis in minimum leaf water potential explain the isohydric versus anisohydric behavior of Vitis vinifera L. cultivars? Tree Physiol. 2012, 32, 245–248. [Google Scholar] [CrossRef] [Green Version]
  35. Xu, H.; Zhang, Z.; Chen, J.; Xiao, J.; Zhu, M.; Kang, M.; Cao, W. Regulations of cloudiness on energy partitioning and water use strategy in a riparian poplar plantation-ScienceDirect. Agric. For. Meteorol. 2018, 262, 135–146. [Google Scholar] [CrossRef]
  36. Chang, H.; An, J.; Roh, Y.; Son, Y. Experimental warming and drought treatments reduce physiological activities and increase mortality of Pinus koraiensis seedlings. Plant Ecol. 2020, 221, 515–527. [Google Scholar] [CrossRef]
  37. Fang, J.; Liu, G.; Xu, S. Biomass and net production of forest vegetation in China. Acta Ecol. Sin. 1996, 5, 497–508. [Google Scholar]
  38. Luan, J.; Liu, S.; Wang, J.; Zhu, X.; Shi, Z. Rhizospheric and heterotrophic respiration of a warm-temperate oak chronosequence in China. Soil Biol. Biochem. 2011, 43, 503–512. [Google Scholar] [CrossRef]
  39. Wang, Y.; Liu, S.; Wang, J.; Chang, S.X.; Luan, J.W.; Liu, Y.C.; Lu, H.B.; Liu, X. Microbe-mediated attenuation of soil respiration in response to soil warming in a temperate oak forest. Sci. Total Environ. 2019, 711, 134563. [Google Scholar] [CrossRef] [PubMed]
  40. Wilczak, J.M.; Oncley, S.P.; Stage, S.A. Sonic anemometer tilt correction algorithms. Bound. Layer Meteorol. 2001, 99, 127–150. [Google Scholar] [CrossRef]
  41. Webb, E.K.; Pearman, G.I.; Leuning, R. Correction of flux measurements for density effects due to heat and water vapour transfer. Q. J. R. Meteorol. Soc. 2010, 106, 85–100. [Google Scholar] [CrossRef]
  42. Foken, T.; Goockede, M.; Mauder, M.; Mahrt, L.; Amiro, B.; Munger, W. Post-field data quality control. Handb. Micrometeorol. 2004, 29, 181–208. [Google Scholar]
  43. Papale, D.; Reichstein, M.; Aubinet, M.; Canfora, E.; Bernhofer, C.; Kutsch, W.; Longdoz, B.; Rambal, S.; Valentini, R.; Vesala, T.; et al. Towards a standardized processing of Net Ecosystem Exchange measured with eddy covariance technique: Algorithms and uncertainty estimation. Biogeosciences 2006, 3, 571–583. [Google Scholar] [CrossRef] [Green Version]
  44. Culf, A.D.; Foken, T.; Gash, J.H.C. The energy balance closure problem: An overview. Ecol. Appl. 2008, 18, 1351–1367. [Google Scholar]
  45. Wilson, K.; Goldstein, A.; Falge, E.; Aubinet, M.; Verma, S. Energy balance closure at FLUXNET sites. Agric. For. Meteorol. 2002, 113, 223–243. [Google Scholar] [CrossRef] [Green Version]
  46. Liu, C.F.; Zhang, Z.Q.; Sun, G.; Zha, T.G.; Zhu, J.Z.; Shen, L.H.; Chen, J.; Fang, X.R.; Chen, J.Q. Quantifying evapotranspiration and biophysical regulations of a poplar plantation assessed by eddy covariance and sap-flow methods. Chin. J. Plant Ecol. 2009, 33, 706–718, (In Chinese with English Abstract). [Google Scholar]
  47. Niu, X.; Sun, P.; Liu, X.; Luan, J.; Liu, S. Net ecosystem carbon dioxide exchange in an oak (Quercus aliena) forest at transitional zone from subtropics to warm temperate, China. Acta Ecol. Sin. 2002, 40, 5980–5991. [Google Scholar]
  48. Huang, M.; Piao, S.; Sun, Y.; Ciais, P.; Cheng, L.; Mao, J.; Poulter, B.; Shi, X.; Zheng, Z.; Wang, Y. Change in terrestrial ecosystem water-use efficiency over the last three decades. Glob. Chang. Biol. 2015, 21, 2366–2378. [Google Scholar] [CrossRef]
  49. Monteith, J.L. Principles of environmental physics. Phys. Today 1974, 27, 51. [Google Scholar] [CrossRef]
  50. Monteith, J.; Unsworth, M. Principles of Environmental Physics, 4th ed.; Academic Press: Amsterdam, The Netherlands, 2007. [Google Scholar]
  51. Granier, A.; Reichstein, M.; Breda, N.; Janssens, I.A.; Falge, E.; Ciais, P.; Grunwald, T.; Aubinet, M.; Berbigier, P.; Bernhofer, C.; et al. Evidence for soil water control on carbon and water dynamics in European forests during the extremely dry year: 2003. Agric. For. Meteorol. 2007, 143, 123–145. [Google Scholar] [CrossRef]
  52. American Meteorological Society. Meteorological drought-policy statement. Bull. Am. Meteorol. Soc. 1997, 78, 847–849. [Google Scholar] [CrossRef] [Green Version]
  53. Launiainen, S. Seasonal and inter-annual variability of energy exchange above a boreal Scots pine forest. Biogeosciences 2010, 7, 3921–3940. [Google Scholar] [CrossRef] [Green Version]
  54. Law, B.; Falge, E.; Gu, L.; Baldocchi, D.; Bakwin, P.; Berbigier, P.; Davis, K.; Dolman, A.; Falk, M.; Fuentes, J. Environmental controls over carbon dioxide and water vapor exchange of terrestrial vegetation. Agric. For. Meteorol. 2002, 113, 97–120. [Google Scholar] [CrossRef] [Green Version]
  55. Forner, A.; Valladares, F.; Bonal, D.; Granier, A.; Grossiord, C.; Aranda, L. Extreme droughts affecting Mediterranean tree species’ growth and water-use efficiency: The importance of timing. Tree Physiol. 2008, 38, 1127–1137. [Google Scholar] [CrossRef] [PubMed] [Green Version]
  56. Song, Q.H.; Fei, X.H.; Zhang, Y.P.; Sha, L.Q.; Liu, Y.T.; Zhou, W.J.; Wu, C.S.; Lu, Z.Y.; Luo, K.; Gao, J.B. Water use efficiency in a primary subtropical evergreen forest in Southwest China. Sci. Rep. 2017, 7, 43031. [Google Scholar] [CrossRef] [PubMed] [Green Version]
  57. Humphreys, E.R.; Black, T.A.; Ethier, G.J.; Drewitt, G.B.; Spittlehouse, D.L.; Jork, E.M.; Nesic, Z. Annual and seasonal variability of sensible and latent heat fluxes above a coastal Douglas-fir forest, British Columbia, Canada. Agric. For. Meteorol. 2003, 115, 109–125. [Google Scholar] [CrossRef]
  58. Mccree, K.J.; Fernandez, C.J. Simulation model for studying physiological water stress responses of whole plants. Crop. Sci. 1989, 29, 353–360. [Google Scholar] [CrossRef]
  59. Yu, G.R.; Wang, Q.F.; Zhuang, J. Modeling the water use efficiency of soybean and maize plants under environmental stresses: Application of a synthetic model of photosynthesis-transpiration based on stomatal behavior. J. Plant Physiol. 2004, 161, 303–318. [Google Scholar] [CrossRef] [Green Version]
  60. Wang, M.; Chen, Y.; Wu, X.; Bai, Y. Forest-type-dependent water use efficiency trends across the northern hemisphere. Geophys. Res. Lett. 2018, 16, 8283–8293. [Google Scholar] [CrossRef]
  61. Hwang, T.; Gholizadeh, H.; Sims, D.A.; Novick, K.A.; Brzostek, E.R.; Phillips, R.P.; Roman, D.T.; Robeson, S.M.; Rahman, A.F. Capturing species-level drought responses in a temperate deciduous forest using ratios of photochemical reflectance indices between sunlit and shaded canopies. Remote Sens. Environ. 2017, 199, 350–359. [Google Scholar] [CrossRef]
  62. Hu, Z.; Shi, H.; Cheng, K.; Wang, Y.; Piao, S.; Li, Y.; Zhang, L.; Xia, J.; Zhou, L.; Yuan, W. Joint structural and physiological control on the interannual variation in productivity in a temperate grassland: A data-model comparison. Glob. Chang. Biol. 2018, 24, 2965–2979. [Google Scholar] [CrossRef] [PubMed]
  63. Cooley, S.S.; Williams, C.A.; Fisher, J.B.; Halverson, G.H.; Perret, J.; Lee, C.M. Assessing regional drought impacts on vegetation and evapotranspiration: A case study in Guanacaste, Costa Rica. Ecol. App. 2019, 29, e01834. [Google Scholar] [CrossRef]
  64. Dong, C.; Macdonald, G.M.; Willis, K.; Gillespie, T.W.; Okin, G.S.; Williams, A.P. Vegetation responses to 2012–2016 drought in Northern and Southern California. Geophys. Res. Lett. 2019, 46, 3810–3821. [Google Scholar] [CrossRef]
  65. Zhao, J.; Feng, H.; Xu, T.; Xiao, J.; Guerrieri, R.; Liu, S.; Wu, X.; He, X.; He, X. Physiological and environmental control on ecosystem water use efficiency in response to drought across the northern hemisphere. Sci. Total Environ. 2020, 758, 143599. [Google Scholar] [CrossRef]
  66. Xu, M.; Wang, H.; Wen, X.; Zhang, T.; Di, Y.; Wang, Y.; Wang, J.; Cheng, C.; Zhang, W. The full annual carbon balance of a subtropical coniferous plantation is highly sensitive to autumn precipitation. Sci. Rep. 2017, 7, 10025. [Google Scholar] [CrossRef]
  67. Noormets, A.; McNulty, S.G.; DeForest, J.L.; Sun, G.; Li, Q.; Chen, J. Drought during canopy development has lasting effect on annual carbon balance in a deciduous temperate forest. New Phytol. 2008, 179, 818–828. [Google Scholar] [CrossRef]
  68. Buckley, T.N. The control of stomata by water balance. New Phytol. 2005, 168, 275–292. [Google Scholar] [CrossRef]
  69. Manzoni, S.; Vico, G.; Katul, G.; Fay, P.A.; Polley, W.; Palmroth, S.; Porporato, A. Optimizing stomatal conductance for maximum carbon gain under water stress: A meta-analysis across plant functional types and climates. Funct. Ecol. 2011, 25, 456–467. [Google Scholar] [CrossRef]
  70. Wu, X.P.; Liu, S.; Luan, J.; Wang, Y.; Cai, C. Responses of water use in Moso bamboo (Phyllostachys heterocycla) culms of different developmental stages to manipulative drought. For. Ecosyst. 2019, 6, 1–14. [Google Scholar] [CrossRef] [Green Version]
  71. He, N.P.; Liu, C.C.; Piao, S.L.; Sack, L.; Xu, L.; Luo, Y.; He, J.; Han, X.; Zhou, G.; Zhou, X.; et al. Ecosystem traints linking functional traits to macroecology. Trends Ecol. Evol. 2019, 34, 200–210. [Google Scholar] [CrossRef]
  72. Schwalm, C.R.; Anderegg WR, L.; Michalak, A.M.; Fisher, J.B.; Biondi, F.; Koch, G.; Litva, M.; Ogle, K.; Shaw, J.; Wolf, A.; et al. Global patterns of drought recovery. Nature 2017, 548, 202–205. [Google Scholar] [CrossRef] [PubMed]
  73. Verduzco, V.S.; Garatuza-Payán, J.; Yépez, E.A.; Watts, C.J.; Rodriguez, J.C.; Robles, M.A.; Vivoni, E.R. Variations of net ecosystem production due to seasonal precipitation differences in a tropical dry forest of northwest Mexico. J. Geophys. Res. Biogeosci. 2015, 120, 2081–2094. [Google Scholar] [CrossRef]
  74. Yang, Y.; Guan, H.; Batelaan, O.; McVicar, T.R.; Long, D.; Piao, S.L.; Liang, W.; Liu, B.; Jin, Z.; Simmons, C.T. Contrasting responses of water use efficiency to drought across global terrestrial ecosystems. Sci. Rep. 2016, 6, 23284. [Google Scholar] [CrossRef] [PubMed] [Green Version]
  75. Ma, J.; Zha, T.; Jia, X.; Tian, Y.; Bourque, C.; Liu, P.; Bai, Y.; Wu, Y.; Ren, C.; Yu, H.; et al. Energy and water vapor exchange over a young plantation in northern China. Agric. For. Meteorol. 2018, 263, 334–345. [Google Scholar] [CrossRef]
  76. Sharma, A.; Goyal, M.K. Assessment of ecosystem resilience to hydroclimatic disturbances in India. Glob. Chang. Biol. 2017, 24, e432–e441. [Google Scholar] [CrossRef] [PubMed]
  77. Zhang, F.; Ju, W.; Shen, S.; Wang, S.; Yu, G.R.; Han, S.J. How recent climate change influences water use efficiency in East Asia. Theor. Appl. Climatol. 2014, 116, 359–370. [Google Scholar] [CrossRef]
  78. Zhang, M.; Yu, G.R.; Zhuang, J.; Gentry, R.; Fu, Y.-L.; Sun, X.-M.; Zhang, L.-M.; Wen, X.-F.; Wang, Q.-F.; Han, S.-J.; et al. Effects of cloudiness change on net ecosystem exchange, light use efficiency, and water use efficiency in typical ecosystems of China. Agric. For. Meteorol. 2011, 151, 803–816. [Google Scholar] [CrossRef]
  79. Beer, C.; Ciais, P.; Reichstein, M.; Baldocchi, D.; Law, B.E.; Papale, D.; Soussana, J.F.; Ammann, C.; Buchmann, N.; Frank, D.; et al. Temporal and among-site variability of inherent water-use efficiency at the ecosystem level. Glob. Biogeochem. Cycles 2009, 23. [Google Scholar] [CrossRef]
  80. Yu, Z.; Liu, S.; Wang, J.; Wei, X.; Schuler, J.; Sun, P.; Harper, R.; Zegre, N. Natural forests exhibit higher carbon sequestration and lower water consumption than planted forests in China. Glob. Chang. Biol. 2018, 25, 68–77. [Google Scholar] [CrossRef] [Green Version]
  81. Liu, X.; Chen, X.; Li, R.; Long, F.; Zhang, L.; Zhang, Q.; Li, J. Water-use efficiency of an old-growth forest in lower subtropical China. Sci. Rep. 2017, 7, 42761. [Google Scholar] [CrossRef]
  82. Launiainen, S.; Katul, G.G.; Kolari, P.; Lindroth, A.; Lohila, A.; Aurela, M.; Varlagin, A.; Grelle, A.; Vesala, T. Do the energy fluxes and surface conductance of boreal coniferous forests in Europe scale with leaf area? Globe Chang. Biol. 2016, 22, 4096–4113. [Google Scholar] [CrossRef]
  83. Ponce Campos, G.E.; Moran, M.S.; Huete, A.; Zhang, Y.; Bresloff, C.; Huxman, T.; Eamus, D.; Bosch, D.; Buda, A.; Gunter, S.; et al. Ecosystem resilience despite large-scale altered hydroclimatic conditions. Nature 2013, 494, 349–352. [Google Scholar] [CrossRef]
  84. Oren, R.; Sperry, J.; Katul, G.; Pataki, D.; Ewers, B.; Phillips, N.; Schäfer, K. Survey and synthesis of intra-and interspecifific variation in stomatal sensitivity to vapour pressure defificit. Plant. Cell. Environ. 1999, 22, 1515–1526. [Google Scholar] [CrossRef] [Green Version]
  85. Quero, J.L.; Sterck, F.J.; Martínez-Vilalta, J.; Villar, R. Water-use strategies of six co-existing Mediterranean woody species during a summer drought. Oecologia 2011, 166, 45–57. [Google Scholar] [CrossRef] [PubMed]
  86. Zenone, T.; Fischer, M.; Arriga, N.; Broeckx, L.; Verlinden, M.S.; Vanbeveren, S.; Zona, D.; Ceulemans, R. Biophysical drivers of the carbon dioxide, water vapor, and energy exchanges of a short-rotation poplar coppice-ScienceDirect. Agric. For. Meteorol. 2015, 209–210, 22–35. [Google Scholar] [CrossRef]
Figure 1. The geographical location of study site (BTM: Baotianman).
Forests 12 00839 g001
Figure 2. The topographical map of flux observation site at Baotianman forest ecosystem research station.
Forests 12 00839 g002
Figure 3. Temporal dynamics of (a) daily mean air temperature (Ta) and water vapor pressure deficit (VPD) at 22 m, (b) daily cumulative photosynthetically active radiation (PAR, molm−2day−1), (c) daily and cumulative precipitation (P), (d) relative extractable water content (REW), (e) 16-day composited MODIS EVI, (f) surface conductance (gs). Gray-shaded bands in plot indicate dryness stage.
Forests 12 00839 g003
Figure 4. Temporal fluctuations of (a) daily and cumulative gross ecosystem production (GEP), (b) daily and cumulative evapotranspiration (ET), and (c) daily ecosystem water use efficiency (WUE) from 2017 to 2020. Blue circles denote rainy days greater than 2 mm in growing seasons. Gray-shaded bands in plot indicate dryness stage.
Forests 12 00839 g004
Figure 5. Seasonal dynamics of (a) monthly gross ecosystem production (GEP), (b) monthly evapotranspiration (ET), and (c) monthly water use efficiency (WUE) during the growing seasons (May-October) from 2017 to 2020.
Forests 12 00839 g005
Figure 6. Relationship between daily gross ecosystem productivity (GEP) and evapotranspiration (ET) during the growing seasons from 2017 to 2020.
Forests 12 00839 g006
Figure 7. Relationships of daily gross ecosystem productivity (GEP), evapotranspiration (ET) with daily environmental factors (Ta, PAR, VPD) and biological factors (EVI, midday gs) in three seasons (spring, summer, autumn) from 2017 to 2020.
Forests 12 00839 g007
Figure 8. Relationships of daily gross ecosystem productivity (GEP), evapotranspiration (ET) with daily environmental factors (Ta, PAR, VPD) and biological factors (EVI, midday gs) in all of the growing seasons from 2017 to 2020.
Forests 12 00839 g008
Figure 9. Responses of daily (a) evapotranspiration (ET), (b) gross ecosystem productivity (GEP) and (c) water use efficiency (WUE) to photosynthetically active radiation (PAR) under two kinds of relative extractable water content (REW) levels (REW > 0.1 and REW < 0.1) during the summer in 2017–2019.
Forests 12 00839 g009
Figure 10. Responses of monthly (a) gross ecosystem productivity (GEP), (b) evapotranspiration (ET) and (c) water use efficiency (WUE) to PAR during the growing seasons from 2017 to 2020.
Forests 12 00839 g010
Figure 11. Relationships between daily water use efficiency (WUE) and daily environmental factors (Ta, PAR, VPD) and biological factors (EVI, midday gs) in three seasons (spring, summer, autumn) from 2017 to 2020.
Forests 12 00839 g011
Figure 12. Relationships between daily water use efficiency (WUE) and daily environmental factors (Ta, PAR, VPD) and biological factors (EVI, midday gs) in all of the growing seasons from 2017 to 2020.
Forests 12 00839 g012
Figure 13. Relationships between annual WUE and (a) mean soil water content (SWC) in spring (April–May) and (b) mean midday surface conductance (gs) during the growing seasons of 2017 to 2020.
Forests 12 00839 g013
Figure 14. Relationships between mean surface conductance (gs) at midday and VPD in summer (June–August period) in (a) 2017, (b) 2018, (c) 2019 and (d) 2020. Half-hourly gs was bin-averaged every 0.2 kPa-interval of VPD.
Forests 12 00839 g014
Table 1. Annual mean air temperature (Ta, °C), water vapor pressure deficit (VPD, kPa), photosynthetically active radiation (PAR, molm−2day−1), annual cumulative precipitation (P, mm), annual mean soil water content (SWC, %), mean-enhanced vegetation index (EVI), bulk surface conductance (gs, mms−1) during growing seasons, annual cumulative evapotranspiration (ET, mm), gross ecosystem production (GEP, g Cm−2) and annual water use efficiency (WUE, g Ckg−1 H2O).
Year
Variable2017201820192020
Ta10.110.19.89.7
VPD0.440.460.50.43
PAR15.515.913.413.1
P1239.4855.8645.61131.2
SWC24.522.521.124.3
EVI0.350.380.380.38
gs10.111.688.7
GEP1609.114541723.41666.3
ET738.1805.3559.6448.5
WUE2.21.83.13.2
Publisher’s Note: MDPI stays neutral with regard to jurisdictional claims in published maps and institutional affiliations.

