Article

A Dynamic Stand Growth Model System for Loblolly Pine Responding to Mid-Rotation Treatments

by
Mauricio Zapata-Cuartas
*,
Bronson P. Bullock
,
Cristian R. Montes
and
Michael B. Kane
Warnell School of Forestry and Natural Resources, University of Georgia, East Green Street, Athens, GA 30602, USA
*
Author to whom correspondence should be addressed.
Forests 2021, 12(5), 556; https://doi.org/10.3390/f12050556
Submission received: 24 March 2021 / Revised: 24 April 2021 / Accepted: 27 April 2021 / Published: 29 April 2021
(This article belongs to the Special Issue Modeling Forest Stand Dynamics, Growth and Yield)

Abstract

:
Intensive loblolly pine (Pinus taeda L.) plantation management in the southeastern United States includes mid-rotation silvicultural practices (MRSP) like thinning, fertilization, competitive vegetation control, and their combinations. Consistent and well-designed long-term studies considering interactions of MRSP are required to produce accurate projections and evaluate management decisions. Here we use longitudinal data from the regional Mid-Rotation Treatment study established by the Plantation Management Research Cooperative (PMRC) at the University of Georgia across the southeast U.S. to fit and validate a new dynamic model system rooted in theoretical and biological principles. A Weibull pdf was used as a modifier function coupled with the basal area growth model. The growth model system and error projection functions were estimated simultaneously. The new formulation results in a compatible and consistent growth and yield system and provides temporal responses to treatment. The results indicated that the model projections reproduce the observed behavior of stand characteristics. The model has high predictive accuracy (the cross-validation variance explained was 96.2%, 99.7%, and 98.6%; and the prediction root mean square distance was 0.704 m, 19.1 trees ha−1, and 1.03 m2ha−1 for dominant height ( D H ), trees per hectare (N), and basal area ( B A ), respectively), and can be used to project the current stand attributes following combinations of MRSP and with different thinning intensities. Simulations across southern physiographic regions allow us to conclude that the most overall ranking of MRSP after thinning is fertilization + competitive vegetation control (Fert + CVC) > fertilization only (Fert) > competitive vegetation control only (CVC), and Fert + CVC show less than additive effect. Because of the model structure, the response to treatment changes with location, age of application, and dominant height growth as indicators of site quality. Therefore, the proposed model adequately represents regional growth conditions.

1. Introduction

Throughout the southeastern United States, pine plantations have made a significant expansion. Before 1952 the pine plantations in this region were marginal, but during 1952–2010, the planted area accumulated 15.8 million hectares (19 percent of the total forest area in the Southeast) [1]. Forecasts reveal a positive rate of change of conversion from natural regenerated pine types to pine plantations. From 2010 to 2060, pine plantations are expected to represent between 24 and 36 percent of the Southeastern forest area [2]. That means a net increment between 3 and 11.4 million hectares, mainly with loblolly pine (Pinus taeda L.) plantations. Loblolly pine is the most planted species in the southeastern U.S. and is the principal source of timber and forest products for the national forest industry.
Concurrent with this expansion, pine plantation management has increasingly turned more intensive. Precise improvements in silvicultural practices have shown remarkable productivity gain [3,4]. Intensive management with Mid-Rotation Silvicultural Practices (MRSP) has been used extensively in the Southeast to raise the quality and proportion of volume in high-value product classes in loblolly pine plantations. The typical MRSP in the South are thinning (Thin), fertilization (Fert), and competitive vegetation control (CVC).
Fertilization at mid-rotation with nitrogen and phosphorus has been well documented, and the typical response is a positive increase in productivity in loblolly pine plantations [5]. Fert and CVC are common silviculture practices that serve to ameliorate nutrient and water limitations. Adding nutrients during the rotation produces an increase in nutrient availability  [5] and has some effect on reducing the carbon cost to produce fis [6]. MRSP with a one-time application of nitrogen (N; 168 to 224 kilograms per hectare) and phosphorous (P; 28 to 56 kilograms per hectare) on most soil types throughout the southeastern U.S. produces a large and consistent growth response of stand volume of approximately 25 percent [5].
The response of loblolly pine to fertilization treatments can be explained by increasing nutrient availability at the tree level and, consequently, an increased leaf area index, resulting in improved growth [7]. Therefore, the magnitude of fertilizer response is associated with the gap between the leaf area index before the treatment application and the potential leaf area index that an operational plantation can develop (around LAI = 4) [5,8]. N and P fertilization with responses of approximately 3.85 m 3 ha 1 yr 1 have been shown to enhance the profitability of loblolly pine plantations [5].
At early-ages herbaceous and hardwood competition can adversely affect growth [9]. Early control of competing woody and herbaceous vegetation increases wood volume by 23–121 percent when evaluated at age 15 [10]. Although there is considerable literature examining CVC’s effect at stand establishment, few works quantify the beneficial effects of CVC applied at the mid-rotation ages. The treatment consists of removing either the non-crop woody vegetation, the herbaceous weed vegetation, or both. The motivation behind CVC is to make scarce resources available to the crop trees. Specifically, at the tree level, competing vegetation reduces nutrient availability and increases water competition, influencing radiation use efficiency.
Thinning is another important MRSP in loblolly pine plantation management. Thinning not only changes the structure of the stand (diameter distributions), but alters the post-thinning height growth of dominant and co-dominant trees [11], reduces competition, and improve the stem quality of the residual trees. Thinning is a way to modify the process of site resource allocation. In general, the principal objective of this treatment is to concentrate light, water, and nutrients on fewer and better trees that can survive over the entire rotation, ending up with higher valued stems.
Foresters and landowners are particularly interested in knowing the long-term response of important stand characteristics after MRSP. Therefore, existing empirical growth and yield models have been adapted to include treatment indicators, timing, and intensity parameters to achieve the desired adjusted predictions. For the case of MRSP analyzed here, most of the empirical approaches reviewed invariably underpin the following two assumptions: First, an adequate growth and yield model (G&Y) is available to simulate the untreated condition. Second, the yield after MRSP can be expressed as a function of the estimated untreated yield or yield-baseline (also known as the reference curve) and a multiplicative or additive modifier sub-model [12,13,14,15]. Thus, after treatment, prediction accuracy depends on how well the yield-baseline performs for a particular locality and how well the modifier undertakes the expected growth type and size of response regarding treatment(s). Modifier-submodels have been used to correct the projections attained with the yield-baseline to reflect the new growth condition or resource availability. However, this compromises the principle compatibility in growth and yield systems.
There are different properties and assumptions used with modifiers. Table 1 summarizes the most important characteristics of some modifiers used in the literature. For example, the treatment’s duration effect, termed Z, (lasting effect of the treatment in years since treatment), or if the sub-model parameters are estimated simultaneously with the base-line model or are estimated independently of the base-line model.
There are few studies for loblolly pine incorporating multiple treatment responses and its interactions on the whole G&Y system and even less using a state-space or dynamic modeling method.
For example, [15] proposed a whole G&Y baseline system model that consists of a set of differential equations describing dominant height, basal area, and stand-level survival. The basal area and dominant height models were based on the Bertalanffy–Richards function. For the survival model, they used a modification of the model proposed by [19] that includes site index, number of trees, and age. Treatments effects for early vegetation control, thinning, and mid-rotation fertilization were included as multiplicative modifiers functions coupled with the yield curves (baseline stand-level models). The pair yield-modifier was fitted for each treatment independently. The data used by [15] to evaluate the responses to treatment do not include treatment combinations and come from three different regional silvicultural experiments across the southeastern U.S. where no combination of treatment was present. Therefore, no clear hypothesis was tested on treatments’ interactions, and the resulting model system lacks compatibility.
The authors in [20] proposed a biologically consistent whole-stand growth model that uses a state-space modeling approach. It includes four state variables: top height, trees per hectare, basal area, and a measure of stand closure. Top height was modeled as a function of the age using the Bertalanffy–Richards differential form; the change in trees per hectare (mortality) was modeled as a function of the number of trees and top height instead of the age. Furthermore, finally, they combined basal area with top height to model the tree growth rate discounting mortality from a gross increment. The thinning effect was included as an “occupancy” factor that reduces the growth increment by the typical sub-occupancy status after treatment. They present a biological justification to use the occupancy factor, which is nonlinear related to the closed-canopy stand attribute and explain the reduction in growth increment in recently thinned stands or young stands that do not yet fully occupy the site. They fitted each model component independently, and no combination of MRSP were included. The data used by [20] covers the piedmont physiographic region.
Some of the modeling strategies propose by [20] were adapted and used in this study. We point some similarities and differences in the Model Description section.
The reviewed literature allows us to highlight two research gaps in growth and yield modeling. First, the lack of prediction and projection models for loblolly pine derived from consistent and well-designed long-term studies considering interactions of MRSP. Second, the modifiers previously used are coupled with a base-line yield model rather than a base-line growth model, resulting in a non-compatible growth and yield expression. Our premise is that it makes more biological sense to consider the MRSP response as a modifier of the stand growth. The yield then results from the integration of the projected growth after treatment.
In an effort to increase understandings of the intensive management with MRSP in terms of growth, product distributions, and financial returns in the southern loblolly pine plantations, the Plantation Management Research Cooperative (PMRC) at the University of Georgia, established a regional Mid-Rotation Treatment Study (MRT) with a set of 49 experimental locations in non-thinned and first-thinned loblolly pine plantations across the southeastern U.S. between 2009 and 2018. The study’s goals were to (1) Develop databases appropriate for modeling first- and second-thinned plantations, and (2) Develop response models for fertilization and competitive vegetation control treatments of first- and second-thinned plantations. This present research address goal (2) of the study.
Alternative and flexible growth modeling strategies need to be addressed to overcome the second knowledge gap mentioned above. This study proposes a dynamic state-space approximation. Dynamic growth and yield systems use the current state of the stand attributes and predict the rate of change in the state using first-order differential equations. The state-space approach has proven to be robust and performed very well for loblolly pine [20].
The main goals in this research were to (1) propose a new whole-stand dynamic growth and yield system for thinned and non-thinned loblolly pine plantations rooted in theoretical and biologically consistent state-space modeling, (2) to extend the dynamic system with a robust growth response modifier for Fert and CVC treatments, singly and in combination, following first- and second-thinning operations. The expectation with these new systems of models is to provide accurate stand predictions and projections to reflect silvicultural treatment impacts and better support silvicultural investment and forest planning decision making.

2. Materials and Methods

2.1. Study Design

At any given location, the MRT study design was a randomized 2 × 2 factorial of post-thinning Fert and CVC plus one control plot, with no replication within a location. The study covers two southern physiographic regions; the Upper Coastal Plain/Piedmont (UC/PI) and the Lower Coastal Plain (LC) [21]. Within each physiographic group, plots were established in first-thinned and second-thinned loblolly pine plantations. Within each thinning condition and region combination, three stands (Installations) were identified for each of four unique combinations of site index at a base age of 25 years (low: 16.8–21.3 m and high: 21.3–30.5 m) and initial stand basal area (low: 20.7–27.6 m2ha−1 and high: 27.6–34.4 m2ha−1), resulting in 12 stands per thinning condition and region combination. One of the three stands for a given site index and initial basal area class was assigned to a post-thinning basal area of 11.5 m2ha−1, a second stand to a post-thinning basal area of 16 m2ha−1, and the third stand to a post-thinning basal area of 20.7 m2ha−1.
Within each stand (installation), five plots were established. One plot did not receive any subsequent thinning or cultural treatment, and four plots were thinned to the basal area target. After thinning, the following treatments were randomly assigned to the four remaining plots; no treatment, competitive vegetation control (CVC) only, fertilization only (Fert), and CVC plus Fert (see Table 2). The same treatment levels were applied to all the installations.
The complete experiment was designed to have 48 installations and a total of 60 plots in each combination of the thinning condition and region (2 site index classes × 2 initial basal area classes × 3 post-thinning basal areas × 5 treatments). One plot represents each unique combination of site index, pre-thinning basal area, and thinning and post-thinning treatment regime. The plot size for first-thinning and second-thinning installations was a 3000 m2 gross plot with a 2000 m2 measurement plot. This allowed for approximately 50 trees per measurement plot for the most intensive second thinning option and more than 50 trees per measurement plot for the other thinning options. The MRT experiment dataset currently consist of 49 installations. Table 3 shows the distribution of plots by physiographic region for these 49 installations.
Figure 1 shows the spatial distribution of 49 installations from the MRT study across the southeastern United States.
The first-thinning was done with an improvement cut from below (fifth row removed with a selection from below in leave rows), removing mostly smaller trees with some large trees taken for spacing or low stem quality. The second-thinning method was by selection from below while considering spatial distribution. Other information related to tree quality and presence of defects or diseases was also collected.
All plots were measured before thinning, immediately post-thinning (as needed), and every two years after that. Diameters at breast height ( D B H ) were measured at 1.37 m to the nearest 0.25 cm. The total height (H) measurements were collected using Haglöf Vertex hypsometers to the nearest 0.3 m on a subsample of trees selected from the tree diameter distribution.
Plots that received the first-thinning treatment were established in plantations no older than 17 years, and the locations were selected across the regions in a such way that the range of the stand attributes were similar. The age and intensity of the first-thinning in the selected plots for second thinning was unknown but the current stand conditions were used in site selection. The second-thinning installations have a larger age range at establishment (16 to 32 years). Table 3 shows the MRTs summary and ranges for age (Age), dominant height ( D H ), stand density (N), and basal area ( B A ) by physiographic region and thinning condition at the plot establishment. In general the selected 5 plots within an installation were homogeneous prior to treatment.
The CVC treatment was prescribed for each location as conditions warrant. This treatment removed all non-pine competitive vegetation after thinning and with one follow-up treatment for missed areas to enhance application uniformity. The fertilization treatment was timed to coincide with or follow the CVC treatment to maximize the fertilization effect. MRT fertilizer treatment of nitrogen (N) and phosphorous (P) per hectare for this research trial (see Table 2), was established based on standard forest industry fertilization levels and based on previous research, predominantly coming out of the Forest Productivity Cooperative (FPC) hosted at North Carolina State University, Virginia Polytechnic Institute and State University, the Universidad de Concepción, and the Federal University of Lavras [5,17,22].
Before the CVC treatment, this study measured the competition in subplots covering approximately 5% of the measurement plot. The subsample measurements included large and small arborescent, shrubs count, and weeds groundcover percent. Competition vegetation measurements were not used in the development of the stand level growth models proposed here.

2.2. Model Description

The dynamic model system proposed here is rooted in theoretical and biologically consistent growth principles. We have used available knowledge from previous published empirical and dynamic models to formulate a new system capable of simulating stand state attribute behavior and growth responses to MRSP. The model uses a state-space approach where each state is represented as an ordinary differential equation. The system includes dominant height ( D H ), stand density as trees per hectare (N), and stand basal area ( B A ). We used the MRT study dataset to estimate system parameters. We used diagnostic graphics and statistics tests to select experiment factor variables for each state model independently, and then, the ensemble model was fitted simultaneously. Next, we describe the proposed model for each state and the system parameter fitting method.

2.2.1. Dominant Height ( D H ) Model

The D H is the state-driven component for N and B A , following the same reasoning as was presented by [20]. We define D H as the average tree height for those trees whose D B H is larger than the plot average D B H . However, when thinned, the average D B H is altered, producing thinning-dependent D H measurements. For this reason, we calculated the average of tree heights for those trees which D B H is larger than the average D B H and remain in the stand after thinning, and that more likely will survive to the rotation age; that is, those trees without annotations of damages or diseases after thinning. The base-line growth model form for D H follows the von Bertalanffy differential Equation [23],
d D H d t = α D H m k D H
where α , m, and k are parameters, and t is the independent time variable in years. This model states that the change in D H over time is the result of confronting the anabolic process, α D H m that makes the trees grow in height, and a catabolic process k D H , that limits potential height growth. The anabolic process is proportional to an allometric relationship with the stand D H . The catabolic process is assumed proportional to the stand D H size. This model was introduced in the forestry literature by [24]. The integral form or model in (1) has been used to model the D H yield [25] and the basal area [24].
Further, we found that the parameters α and m can be functions of experimental conditions. The following expressions were used,
α = a 0 + a 1 R + a 2 I U C + a 3 I P I
m = a 4 + a 5 R + a 6 I U C + a 7 I P I
where a 0 , a 1 , , a 7 are parameters, R is the thinning intensity defined as the ratio of trees per hectare removed at the moment of the thinning and the trees per hectare before thinning, I U C is an indicator variable that takes the value of 1 if the plot belongs from the U C region and it takes the value of zero otherwise, I P I is another indicator variable that takes the value of 1 if the plot belongs from the P I region or takes a zero otherwise, and L C is the contrast factor level for region. Note that for the control plots, the amount of trees per hectare removed is zero, and then, the effect of R in (2) and (3) is goes away. The complete differential form for D H is
d D H d t = α D H m k D H
Equation (4) is a nonlinear ordinary differential equation. A projection equation for D H can be obtained from the integration of (4) applying Bernoulli’s integration Equation [26] (see Appendix A.1),
D H 2 = α k + D H t h ( 1 m ) α k e x p { k ( 1 m ) ( t t t h ) } 1 1 m
where D H t h is the known dominant height determined before thinning when t = t t h . The prediction equation can be derived using the origin solution ( 0 , 0 ) for ( t t h , D H t h ) . Fixing the base age at 25 years into (5) results in a Site Index ( S I ) equation and solving for D H results in an equation in terms of S I (see Appendix A.1),
D H = α k 1 ( 1 m ) 1 1 S I ( 1 m ) k α t 25 1 ( 1 m )

2.2.2. Stand Density

Stand density can change by natural density-dependent mortality or by intervention with thinning. It is thought that the course and magnitude of change in stand density must be affected by the intensity of thinning. We adopted a flexible model proposed by [20], but we modified parameters as a function thinning intensity,
d N d D H = n 1 1 e + 16 D H n 2 N n 3
n 3 = n 30 + n 31 R
where N is number of trees per hectare, n 1 , n 2 , n 30 , and n 31 are parameters. Here we are assuming that the original parameter n 3 now changes linearly with the thinning intensity to reflect reduced mortality typically observed after thinning. This model form is similar to the model proposed by [19], but using D H as the independent variable. The selection of D H instead of the chronological age as a determinant of stand density changes has several benefits toward understanding the mortality. On sites with high site quality and fast growth rates it is expected that there is an early occurrence of intraspecific competition accelerating the density-dependent mortality process. D H growth rather than the lineal time increment may better express the causal effect of stand mortality [20]. Equation (7) then states that the change in trees per hectare is proportional to a D H allometric term and with the instantaneous stand density. Note that the power term for N in (7) includes the thinning intensity R; this allows the model to express different future density (trees per hectare) effects on mortality for stands having the same level of occupancy, coming from different density management regimenes.
Integration of (7) gives an expression to project the stand density N 2 at the time when the stand has a D H 2 , and given a known initial condition ( D H 1 , N 1 ) . The projection form is (see Appendix A.2)
N 2 = N 1 1 n 3 + n 1 1 e + 16 n 3 1 n 2 + 1 D H 2 n 2 + 1 D H 1 n 2 + 1 1 ( 1 n 3 )

2.2.3. Basal Area

We consider the DH growth as a driver for modeling the change in basal area. Inspired in the work presented by [20], we hypothesized that the change in the basal area results from comparing the potential total gross increment and a detrimental component. The gross increment is proportional to the product of two allometric expressions:
gross increment = b 0 N b 1 B A b 2
where b 0 , b 1 , and b 2 are parameters. We state that the gross increment depends on the instantaneous accumulation of stem-wood (a size effect measured as B A ) and an allometric form for the available living trees in the stand. Further, we consider that the allometric parameter b 1 can be extended as a linear function, including the effect of previous thinning managements and the actual thinning intensity.
The detriment component is assumed to be proportional to the amount of basal area from the living trees that is reduced relative to the D H growth, that is:
detriment in B A = b 3 B A N d N d D H
where b 3 is the proportional parameter, which also can be interpreted as the mean size of dying trees relative to the mean size of living trees. It is expected that for a growth period (e.g., two years), the total gross increment surpasses any losse due to mortality. Previous exploratory data analysis (not-shown here) indicated that thinning practices considerably reduce the mortality rate but favor the average tree basal area increment. Therefore the proportional parameter in (11) should reflect the stand management condition. The authors in [20] do not include predictors like basal area or mean diameter in the detriment component like in Equation (11) by considering that the amount of wood accumulated on the stems should be largely irrelevant as a causal factor of mortality change. However, for the thinning treatments observed here, the reduced occupancy large express differences in mortality. The experimental factors in the MRT study were thoroughly evaluated through regression methods and graphical diagnostics to select the variables to be included in the expressions for b 1 and b 3 , but that detail is omitted here. The final expression for b 3 is
b 3 = b 30 + b 31 I T + b 32 R
where b 30 , b 31 , and b 32 are parameters, I T is an indicator variable for the thinning condition, I T takes a value of 1 if the stand receives a second-thinning, and takes the value of zero if it receives the first-thinning. For convenience (see Appendix A.3) parameter b 1 in Equation (11) is expressed as b 1 = b 3 ( b 2 1 ) .
We hypothesized that B A growth might respond to the MRSP differently according to the physiographic region location, the plantation age when the treatment was applied, and the MRSP must have a temporal effect. To include this behavior in (10), the proportional parameter b 0 was extended as a linear combination of the physiographic region and a modifier equation. This modifier is a function of the type of MRSP present and the age when applied. The expression for b 0 is
b 0 = b 01 + b 02 I U C + b 03 I P I + b 04 A g e t h I f + I r + I f r × c d D H D H t h d c 1 e x p D H D H t h d c
c = 1 + c 1 I f + c 2 I r + c 3 I f r
d = 1 + d 1 I f + d 2 I r + d 3 I f r
where b 01 , , b 04 , and c 1 , c 2 , c 3 , d 1 , d 2 , and d 3 are parameters, A g e t h is the plantation age when the MRSP was applied. I f , I r , and I f r are indicator variable for Fert, CVC, or Fert+CVC, respectively. These indicator variables take the value of one if the respective MRSP is present after thinning and take a value of zero elsewhere. The other variables as defined before.
The equation in (13) uses a modification of a two-parameter Weibull probability density function (pdf) to define a modifier function for each of the treatments like Fert, CVC, or their combination. Note that this modifier is coupled with a B A growth model parameter instead of the B A yield. Here, the modifier is considered an intervention function that produces temporal growth increments compared to the thinning only control.
The Weibull pdf has been used before as a yield modifier Equation [15]. The Weibull pdf is flexible and can take multiple density forms, which here is used to represent different types of treatment responses on the proportionality parameter b 0 . Specifically, the scale parameter d is related to the lasting effect of the treatment in the thinned stand, and the shape parameter c is related to the mechanism by which the treatment interacts with the growth process. For example, unimodal pdf shapes indicate that the treatment’s resource availability does not produce an immediate effect on growth but gradually accelerated until a maximum in response is achieved with a posterior descending as these extra resources are drained or used by the stand. Alternatively, an inverse j-shape type indicates an immediate growth response with a subsequent decreasing effect. When the pdf takes values close to zero, that implies that the stand growth follows the same growth rate of a thinning only control.
The Weibull pdf proposed here is a new conceptualization in this approach. Note that we used dominant height instead of the time elapsed from when the treatment was applied. There are two primary reasons for that. First, the use of D H D H t h in the Weibull modifier is consistent because DH is the independent variable in the B A growth model. Second, the resources provided by the treatments are used for growth, and the growth response behavior is guided by how the stand D H responds instead of following a chronological time-line dimension, which does not necessarily hold a strong causal relationships with the stand development.
The growth model for B A considered here was, therefore, of the form
d B A d D H = b 0 N b 3 ( b 2 1 ) B A b 2 b 3 B A N d N d D H
The integral of the differential Equation (16) has a closed-form solution (see Appendix A.3),
B A 2 = [ B A 1 ( 1 b 2 ) N t h N 2 b 3 ( 1 b 2 ) + ( b 01 + b 02 I U C + b 03 I P I ) ( 1 b 2 ) N 2 b 3 ( b 2 1 ) ( D H 2 D H t h ) + b 04 A g e t h ( I f + I r + I f r ) 1 e x p D H 2 D H t h d c ( 1 b 2 ) N 2 b 3 ( b 2 1 ) ] 1 ( 1 b 2 )
where B A 2 is the projected basal area when the stand has a stand density N 2 and a dominant height D H 2 . We assume that the stand information immediately after thinning is known, that is, N t h , D H t h , and A g e t h are known. Other variables and parameters are as defined previously.

2.3. Estimation

The model parameters for the three differential Equations (1), (7), and (16) were initially fitted separately to obtain good initial values and as initial testing of the working hypothesis. AIC (Akaike’s information criterion) and BIC (Schwartz’s Bayesian information criterion) were used to decide on the inclusion of experimental factors or covariates in each model. Given the results of the initial separate fitting, then the system of growth equations was simultaneously estimated. All the calculations were performed in the statistical software language R [27] with the function optim and optimization algorithm BFGS for separate models and the algorithm L-BFGS-B for the complete system. The parameter estimation method proceeded as follow:
  • Obtain initial parameter estimations for the D H growth model independently of the other state variables, assuming the resulting yield follows a normal distribution with constant variance and mean explained by Equation (5). The initial value condition for each plot corresponds with the measured attributes at the thinning age.
  • Project the plot D H yield and use these projections (instrumental variables) for the initial parameter estimations for finding the stand density growth Equation (7).
  • Use the yield projections of D H and N from the two previous steps and estimate parameters for the basal area growth model (1).
  • Use the plot prediction residuals to explore and propose a function that predicts the standard deviations model error for each state.
  • Use the previous plot level yield predictions to explore the type of cross-equation correlation for each combination of two responses.
  • Use the multivariate normal distribution framework. The projected states are the mean, and the estimated standard deviations and cross-equation correlation are used to construct the respective covariance matrix for each plot observation.
  • Use the maximum likelihood procedure to optimize the system parameters.
  • The inverse of the Hessian matrix resulting from the optimization process should be used to obtain approximate standard errors for parameters. We found that the resulting Hessian matrix is invertible but, some of the diagonal elements produce negative values and a few returned huge numbers. In this case, the likelihood function may still contain considerable information about the models of interest, but through the Hessian the parameters are non-identifiable [28]. As not all the parameters were completely identifiable with the inverse of the Hessian matrix, we then compute the standard errors using a boostrap method. Five hundred random replications of the complete experiment data set were obtained sampling with replacement within physiographic region and thinning condition, then the model system was fitted with each replication and the fitted parameters were stored. The approximated standard error was obtained as:
    S E B o o t ( θ j ) = i = 1 N ( θ i j * θ ^ j ) 2 N
    where, S E B o o t ( θ j ) is the bootstrap standard error for the jth parameter, θ i j * is the estimate jth paramater from the ith replicate data set, θ ^ j is the estimate parameter with the original data set, N is the number of replications.
We defined the following functions to describe the standard deviations of state projections.
s d ( D H 2 ) = e x p ( γ 1 ) D H ( t 2 A g e t h ) e x p ( γ 2 ) γ 3
s d ( N 2 ) = γ 4 + γ 5 ( D H 2 D H t h ) + γ 6 ( D H 2 D H t h ) I T 1
s d ( B A 2 ) = γ 7 + γ 8 ( D H 2 D H t h ) + γ 9 B A 2 I T 2
where γ 1 , , γ 9 are parameters. The model in (19) assumes the prediction standard deviation is proportional to the response and increases as the projection length increases. The increased projection length is scaled to determine if the standard deviation increases in relation to projection length in a linear ( γ 2 = 0 ), exponential ( γ 2 > 0 ), or logarithmic ( γ 2 < 0 ) fashion [29]. The model in (20) assumes the prediction standard deviation is lineal with the increment in dominant height since thinning and with different slopes for the control ( I T 1 = 1 ). The model in (21) assumes the prediction standard deviation is lineal with the increment in dominant height since thinning and with an additive effect proportional to the second thinning plots ( I T 2 = 1 ).
In this study, the cross-equation correlation was found simultaneously with the mean functions and the standard deviations for each of the three response variables. The correlation matrix for the three state variables was defined as follow:
Φ = 1 ϕ D H _ N ϕ D H _ B A ϕ D H _ N 1 ϕ N _ B A ϕ D H _ B A ϕ N _ B A 1
The standard deviations of each state were expressed as a diagonal matrix as follow:
s = s d ( D H t ) 0 0 0 s d ( N t ) 0 0 0 s d ( B A t )
The covariance matrix used in the likelihood function was computed as Σ t = s Φ s . The system consists of 39 parameters. We use a maximum likelihood approach to find parameter estimates. The valuation of the multivariate normal density function was made using the package mvtnorm [30] in the software language R [27].

2.4. Validation

The model validation consisted of testing the predictive ability of the system of models for an out-sample observation. We used the variance explained based on cross-validation ( V E c v ) (Equation (24)) recommended by [31] as the best reliable accuracy measure for model validation. We also evaluated the residual mean E ¯ i (Equation (25)), and the root mean square difference ( R M S D ) as proposed by [32].
V E c v i = 1 j = 1 n t = 1 T ( R i j t R ^ i j t ) 2 j = 1 n t = 1 T ( R i j t R ¯ i j t ) 2 100
E ¯ i = j = 1 n t = 1 T ( R i j t R ^ i j t ) n T
R M S D i = j = 1 n t = 1 T ( R i j t R ^ i j t ) 2 n T
where R i j t and R ^ i j t is the observed and predicted value for the ith response with the jth plot at the time t, n is the number of plots, and T is the number of observations within a single measured plot.

3. Results

The parameter estimates for models (4), (7), and (16) are shown in Table 4. The approximate confidence intervals for all the parameters constructed with the bootstrap standard error indicates that almost all the main parameter and factors are important in the model.
The approximate 95% confidence interval for the estimate parameter a ^ 6 includes zero, which indicate that the effect of Upper Coastal Plain and Lower Coastal Plain in Equation (2) is the same. The parameter b 2 presented large variability, and the 95% confidence interval included zero, which indicates that a more simple model could be obtained. However, to maintain the compatible growth and yield model conditions, we decide to keep this parameter in the model.
Although the MRT study design aggregates the UC and PI physiographic regions as one stratum, we modeled them as separate geographic regions. We found that for D H and B A the three physiographic regions exhibit important differences in parameter values (see Table 4).
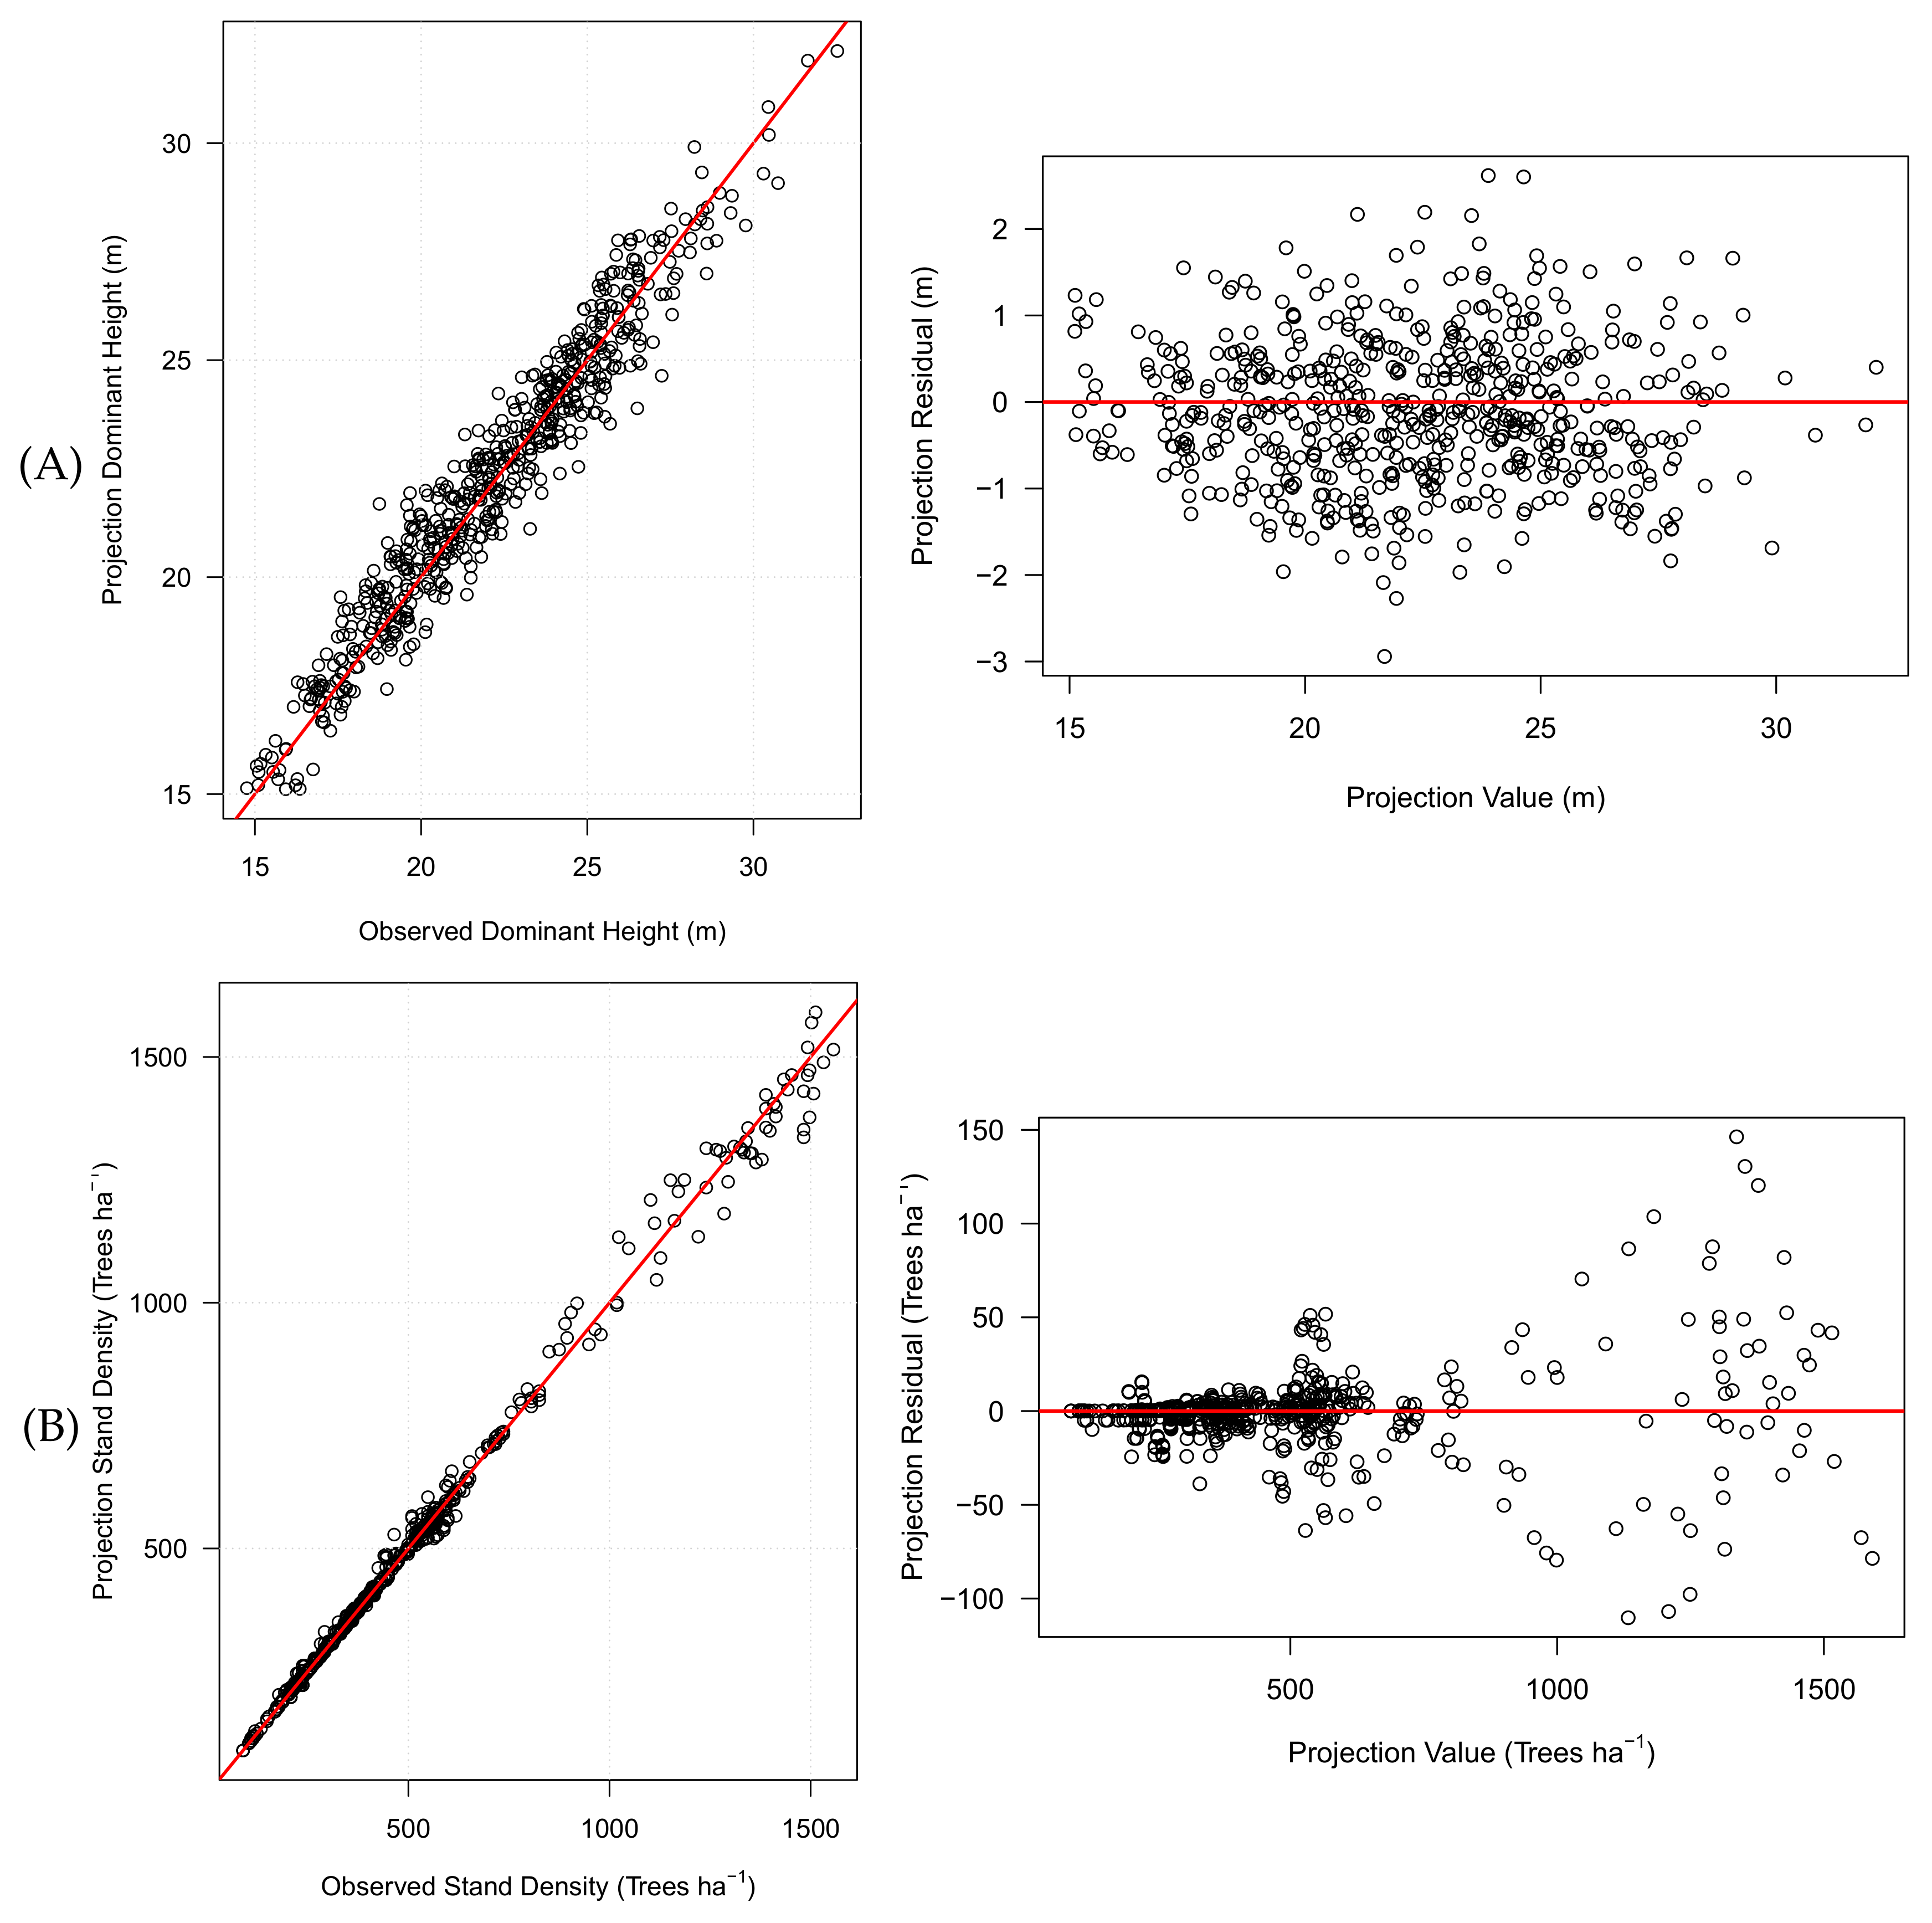
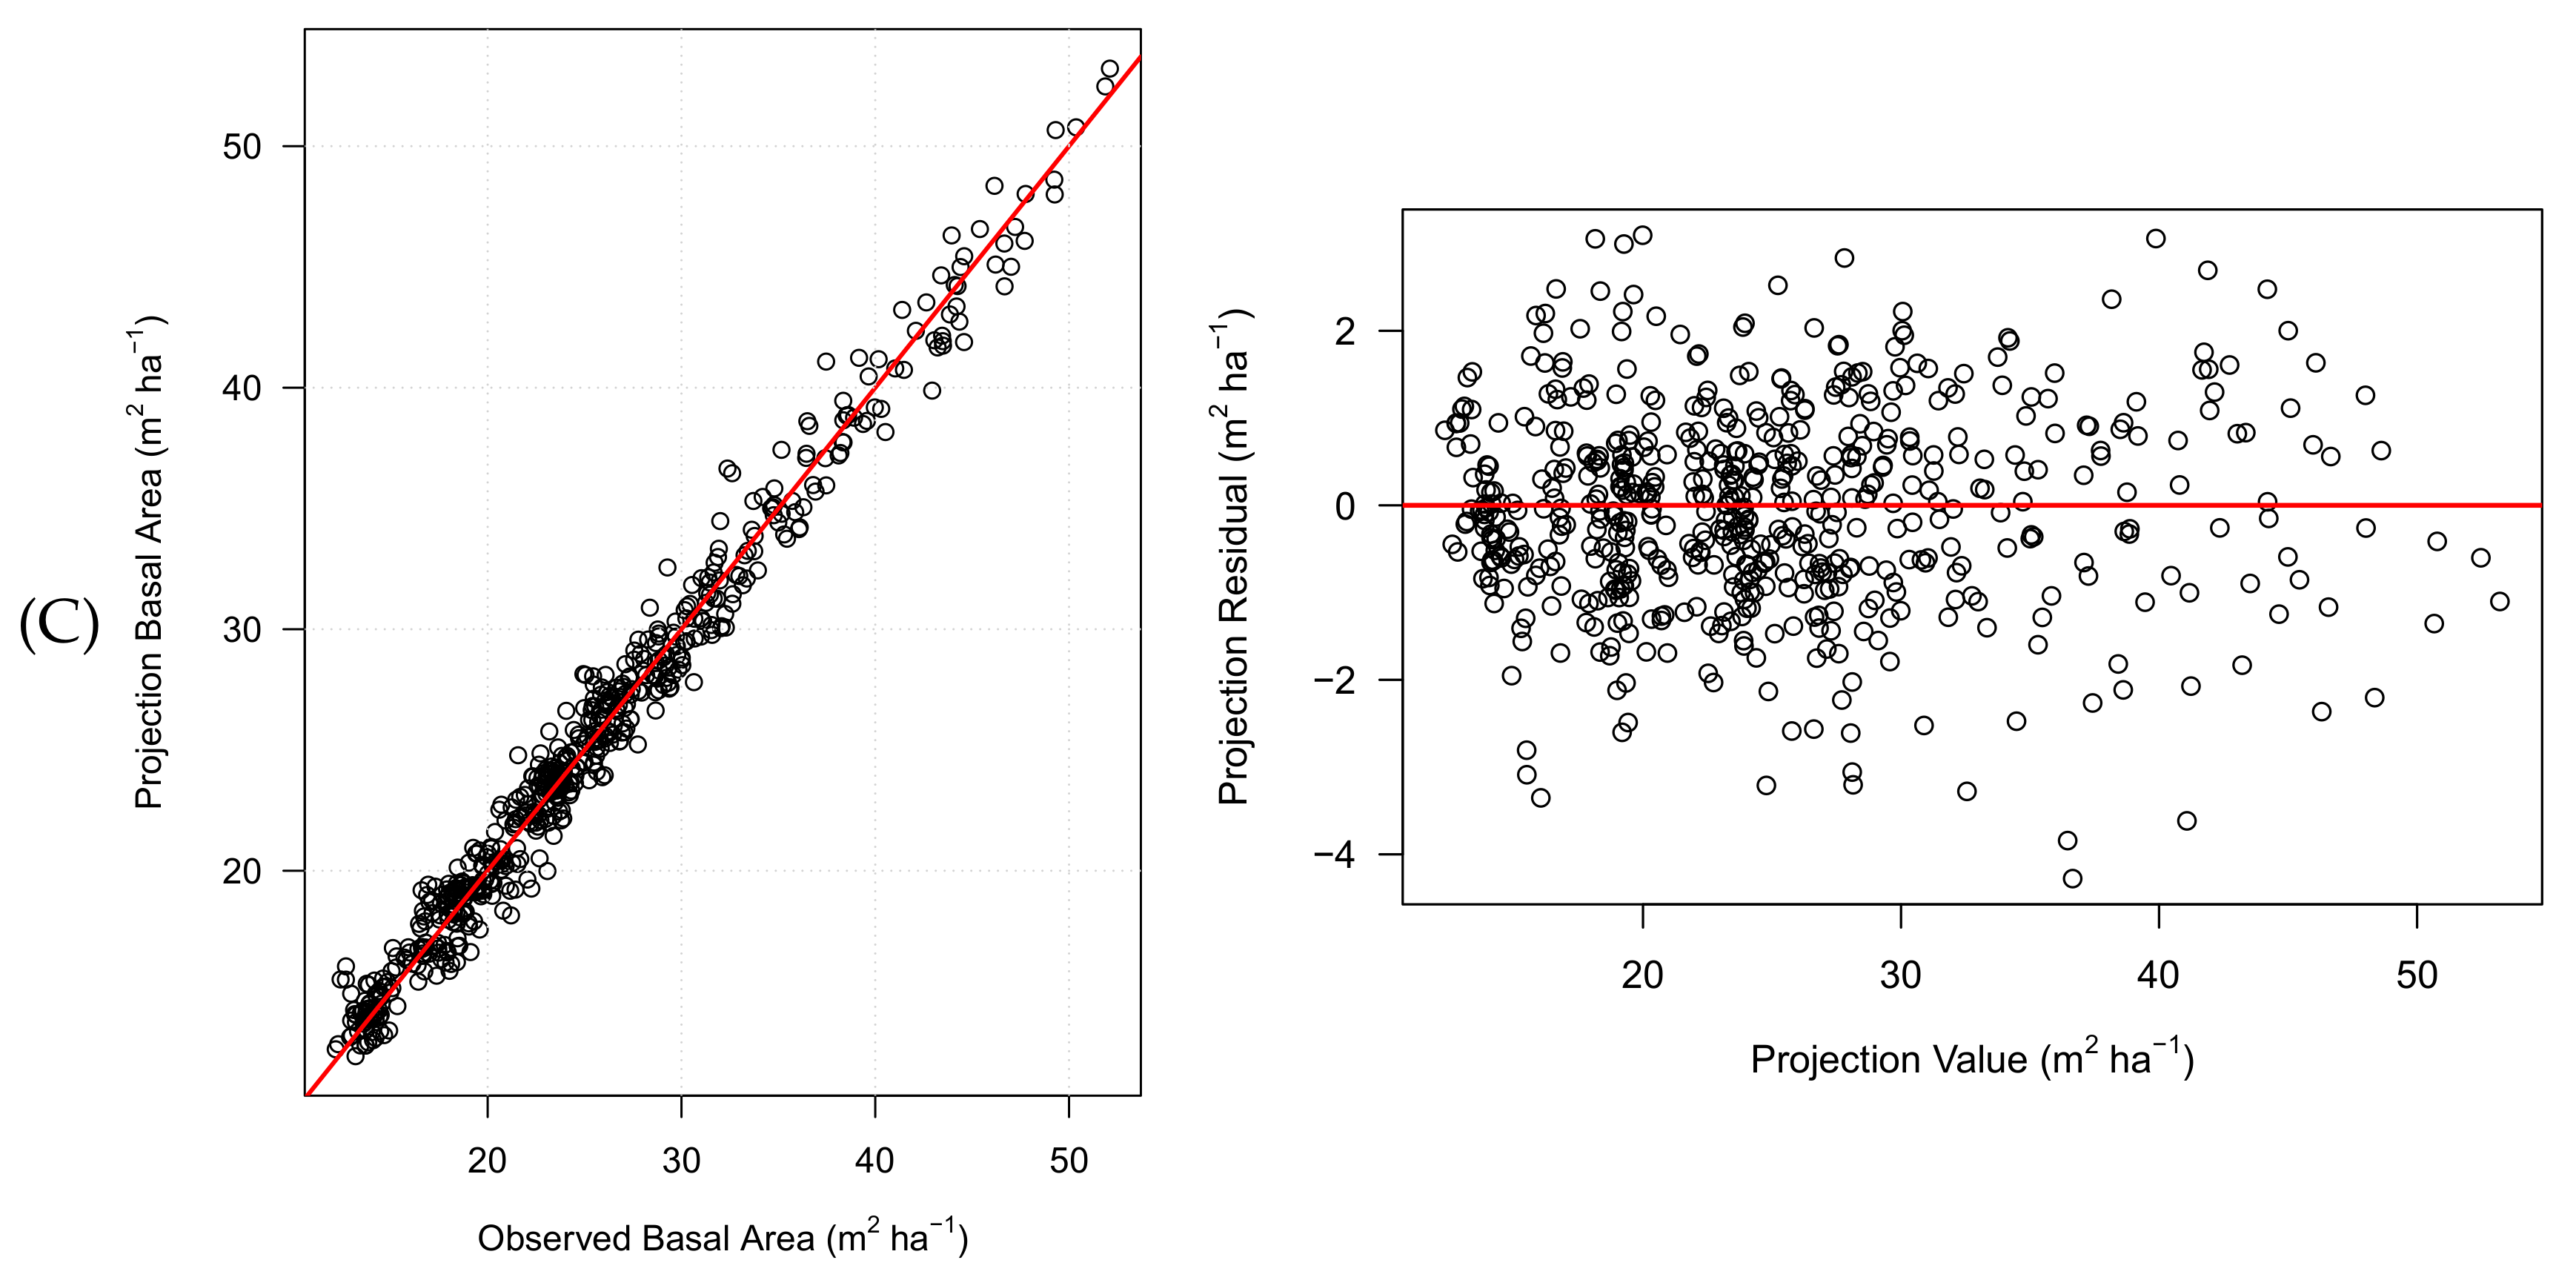
The residual diagnostic plots and a comparison of observed and predicted values for each of the three state variables indicate that the simultaneous fitting successfully achieves an adequate representation of system dynamics (see Figure 2). The residuals for D H and B A show acceptable error distributions and unbiased predictions. The stand density model’s distribution of errors indicates that the non-thinned control plots’ values, with the largest stand densities, were predicted with less precision than the thinned plots. This situation is also reflected in the estimated parameters of γ 5 and γ 6 . When the model (20) is used for non-thinned control plots, the standard deviation of error predictions is increased eight times for each increment unit in dominant height. For treated plots, the fitted stand density provides good predictions with lower errors. However, considering the wide range of plot densities included (from 247 trees ha−1 to 1735 trees ha−1), the errors for treated plots with MRSP are relatively low.
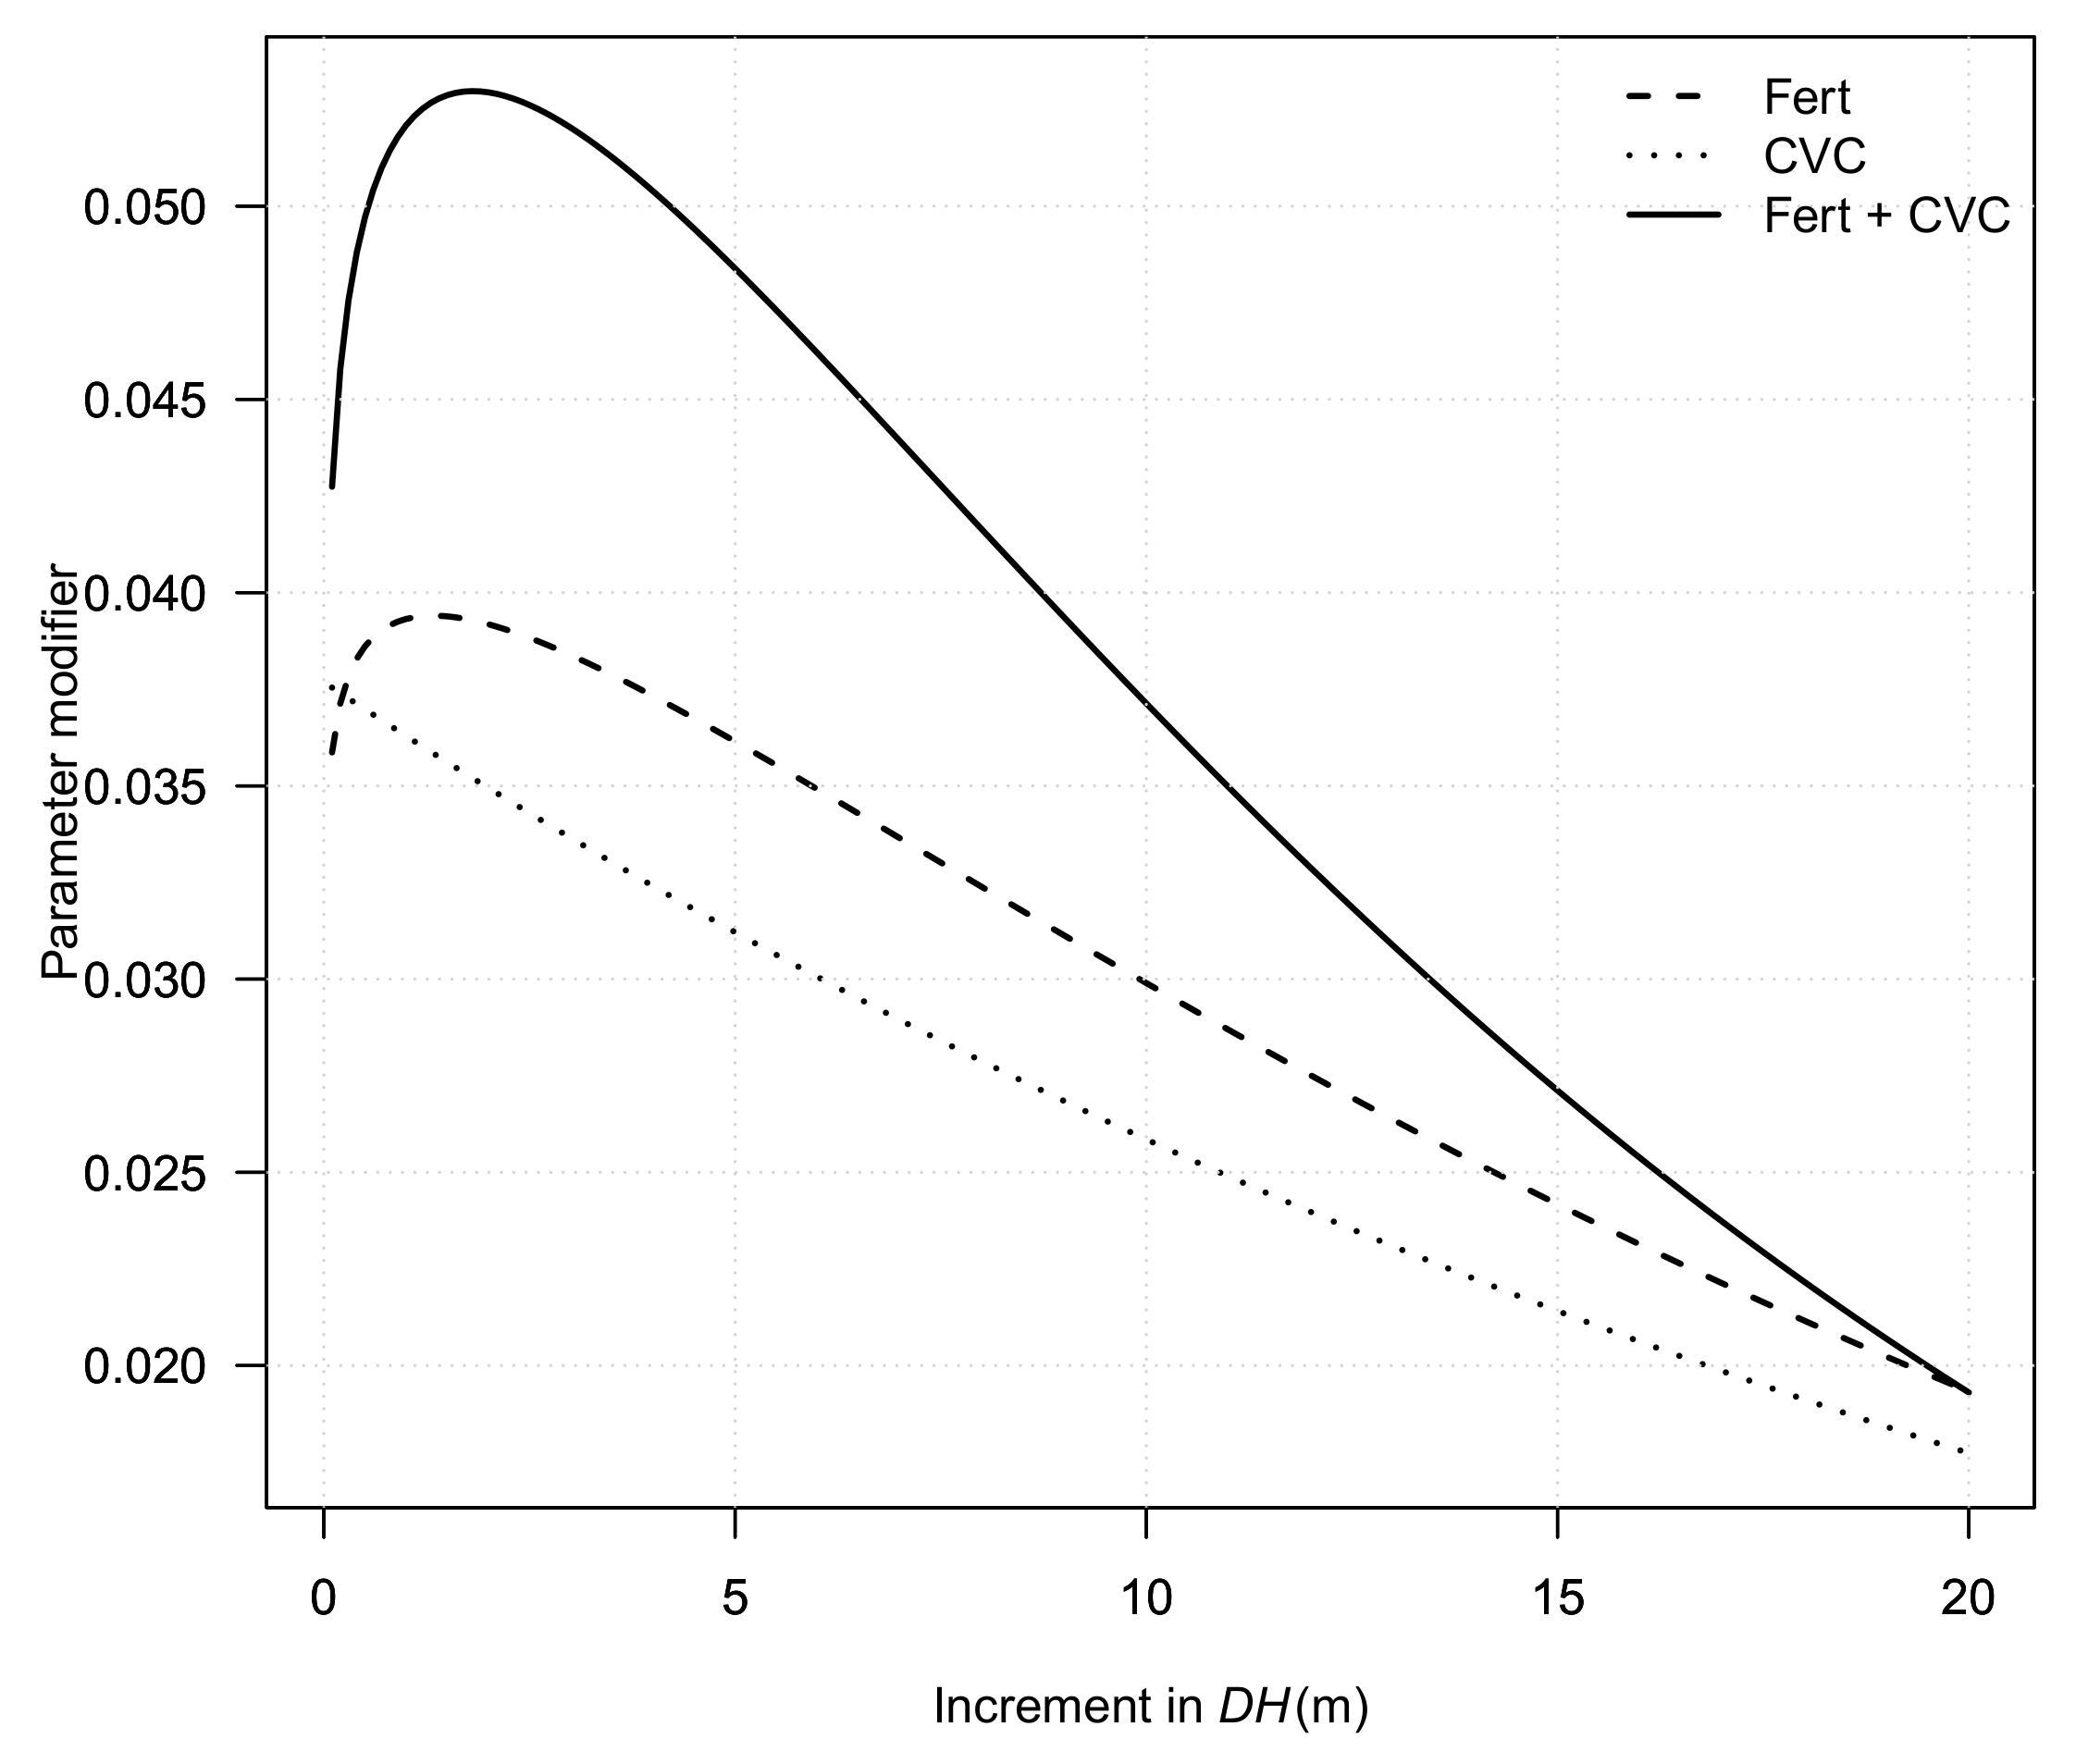
Figure 3 presents the Weibull modifiers for Fert, CVC, and their combination. On average, the CVC treatment shows an immediate effect on the gross B A growth, and as the dominant height increases its effect decreases following a inverse-j shape. Fert only produces an increased growth response until the D H has gained 1.3 m after treatment. After that point, the effect starts to decrease following a similar pattern like CVC. The combinations of treatments Fert + CVC produces a large effect on the gross B A growth, but it is less than additive. The maximum value for the combined treatment was reached when the D H increment was exactly 1.8 m after treatment. After that point, the growth effect decreases with D H increases. In Figure 3, we extrapolate the D H increments until 20 m to see the behavior of the modifiers over a long run. The growth effect in the three treatments decreases, and they approach asymptotically to zero as was expected. The fertilization effect has a long-lasting effect on the sites.
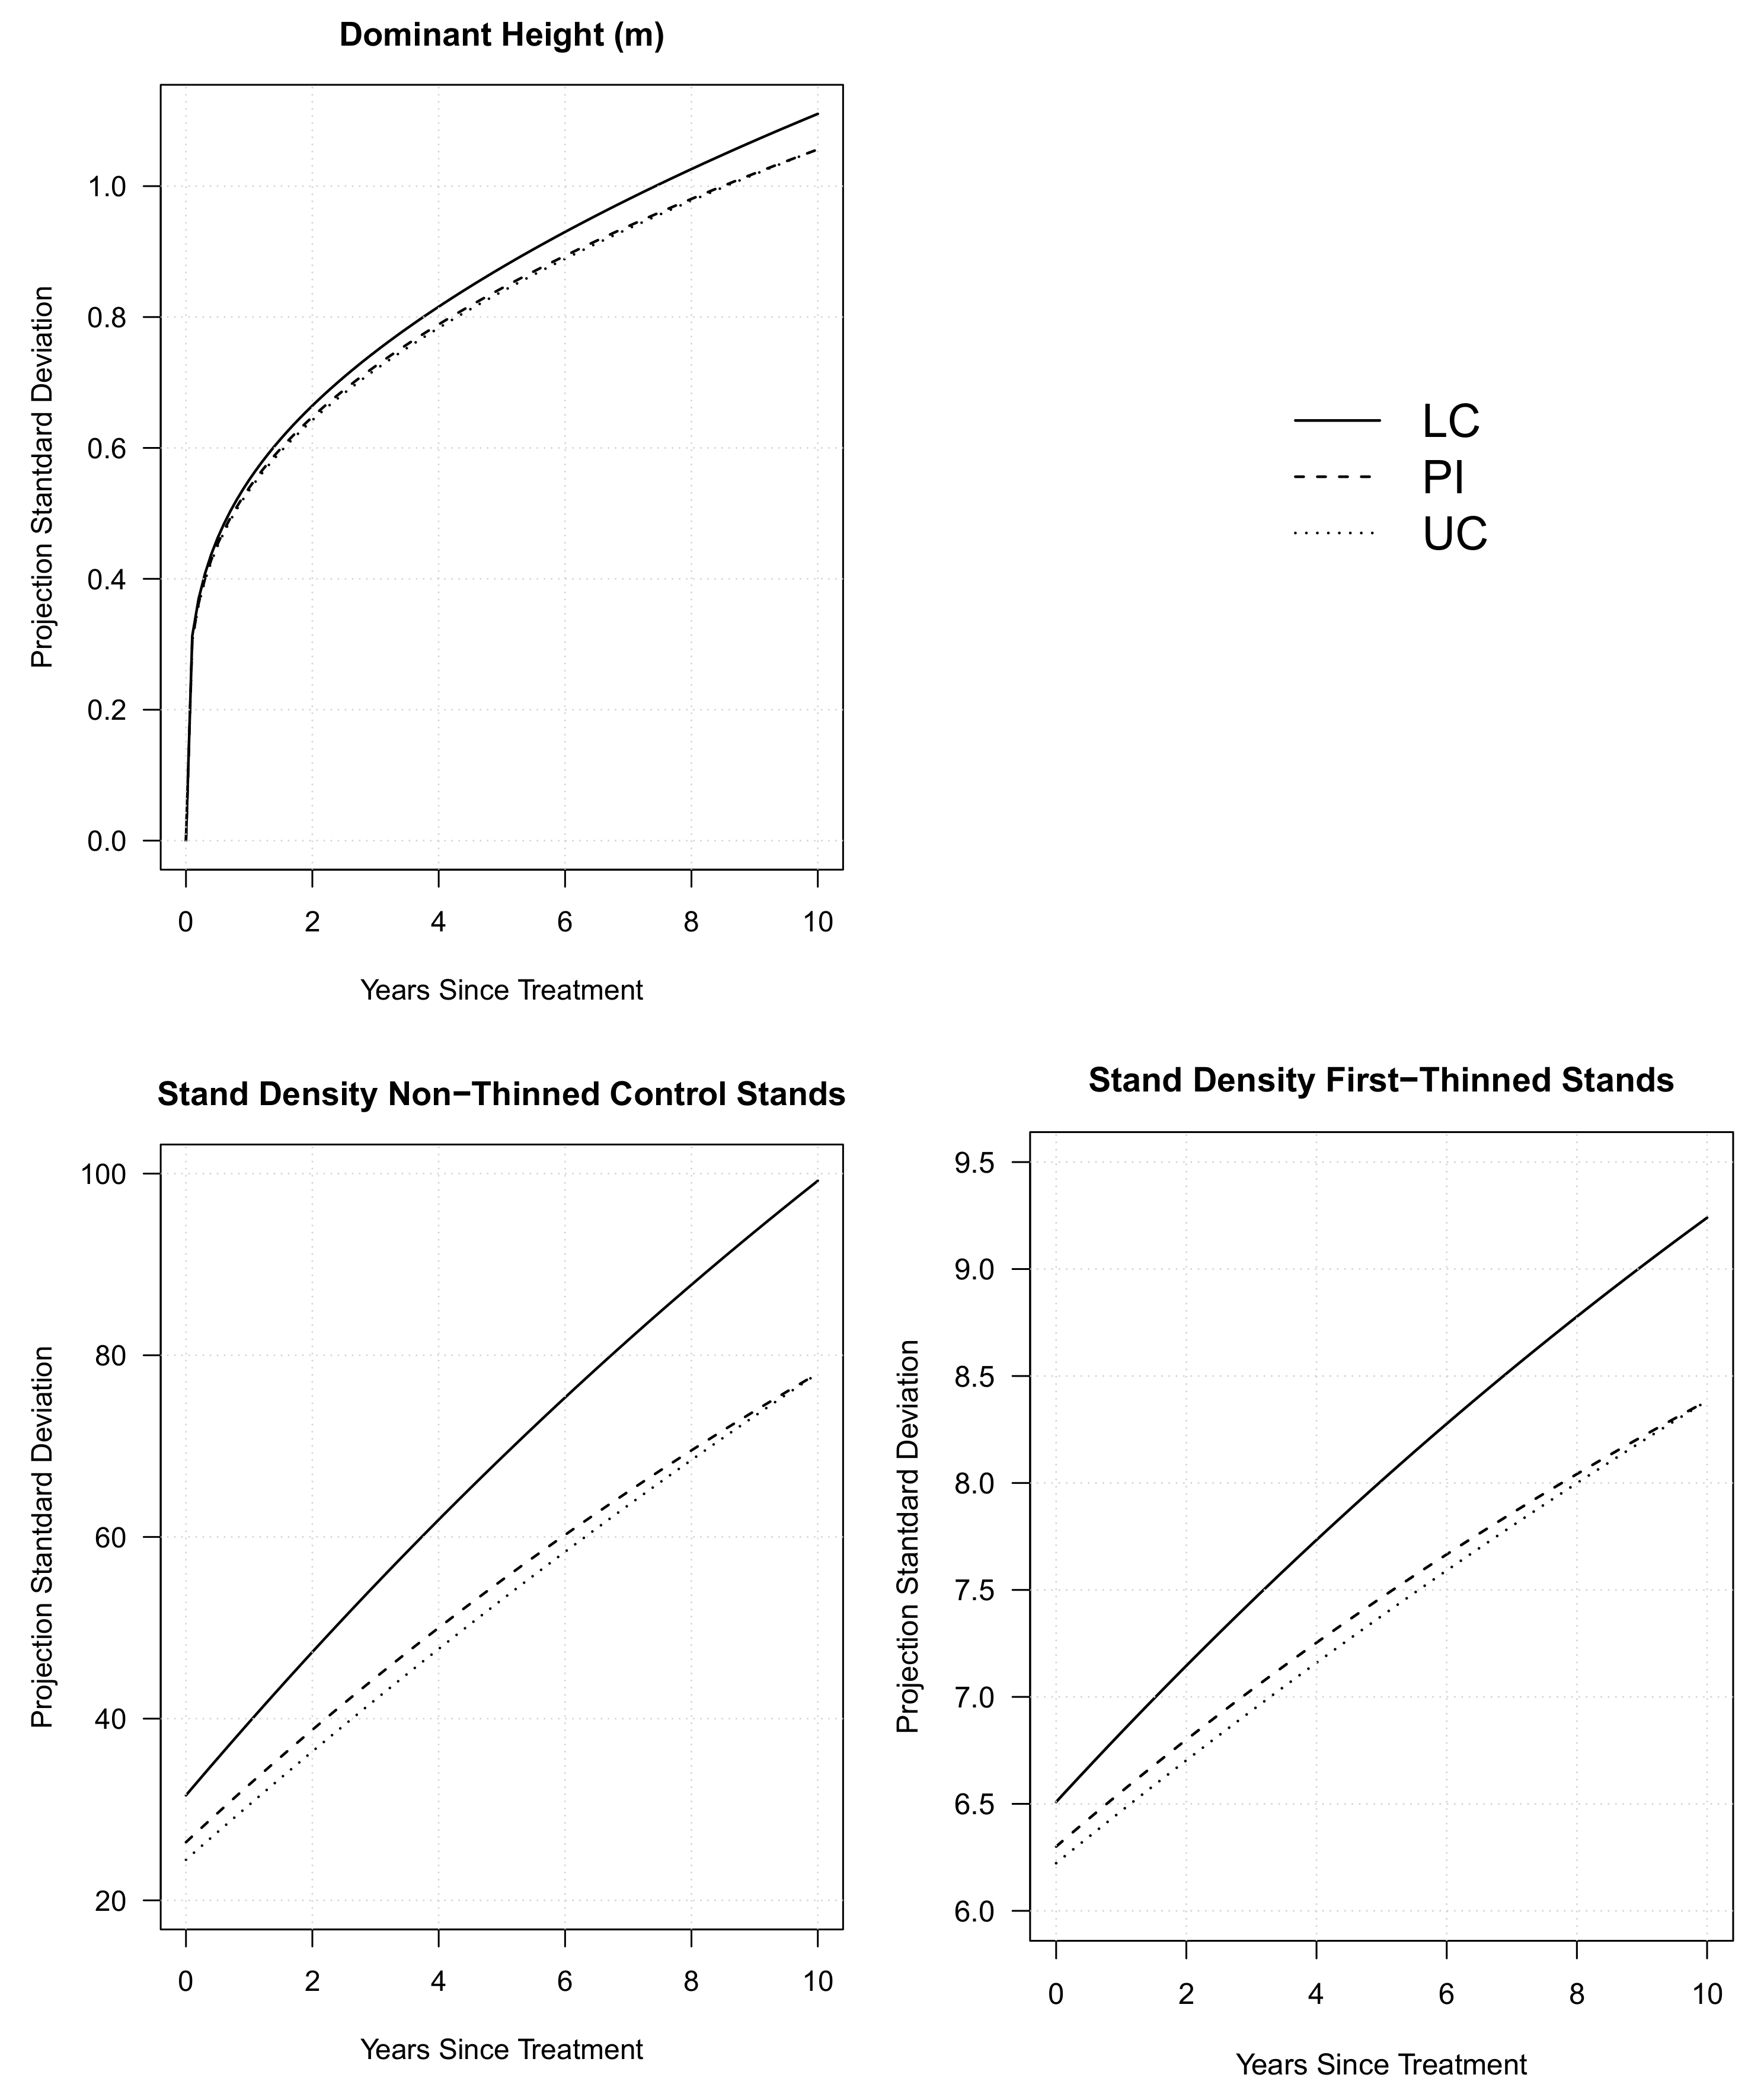
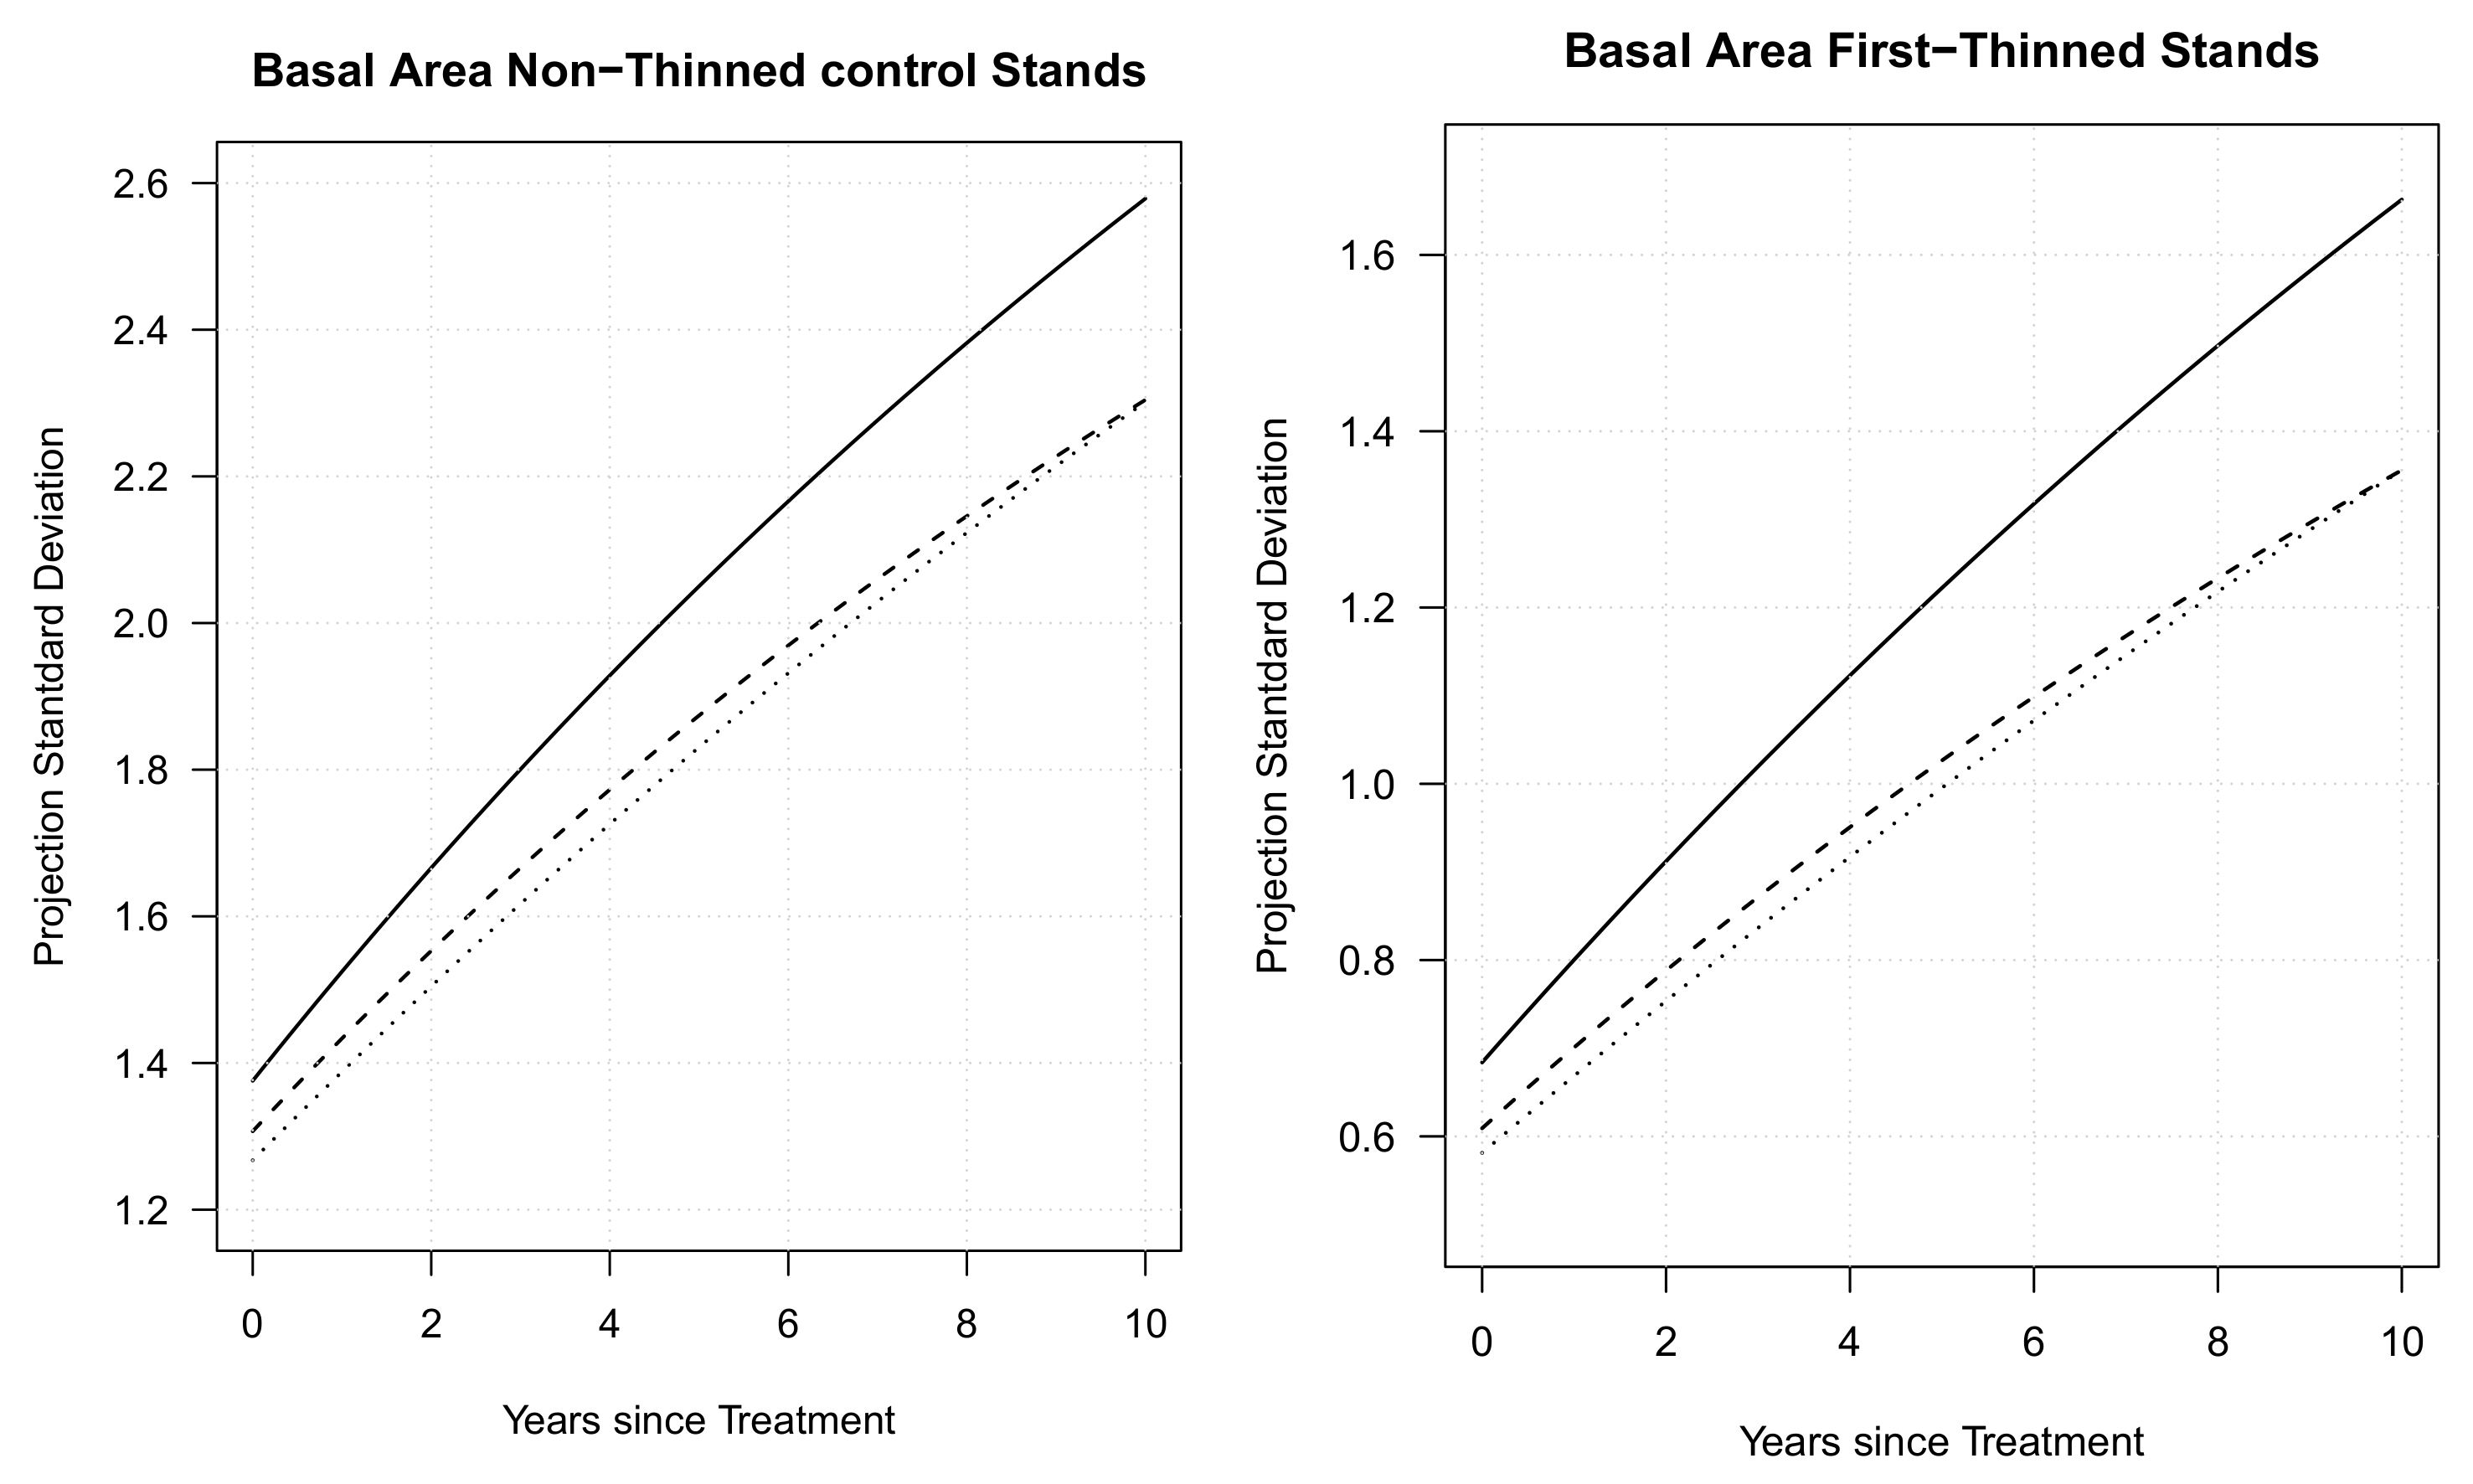
The estimated parameters for the projection standard deviation models for D H , N and B A in Equations (19)–(21) are also in Table 4. The predicted error standard deviations all exhibit an increasing trend as the time of projection increases (Figure 4). The slope of this uncertainty projection is drastically different between LC and UC/PI. The projection uncertainty for a non-thinned stand is always higher than for thinned stand (see Figure 4). As the estimated parameter γ ^ 2 < 0 , then the projection standard deviation for D H increases at a logarithmic rate. The best model we found to express the projection uncertainty for N and B A resulted in nearly a linear trend (see Figure 4, and Equations (20) and (21)). This result is biologically sound given that Equations (5), (9), and (17) will project values in the future as a function only of the initial observed condition of the state variables at the treatment age.

3.1. Validation

Predictivity ability and performance for each response variable were evaluated using leave-one-plot-out cross-validation (243 plots). The results of the cross-validation are presented in Table 5. The cross-validation variance explained ( V E c v ) for each response variable using all the validation plot-measurements out-sample are 96.2% for dominant height, 99.7% for stand density, and 98.6% for basal area (Table 5). The residual mean ( E ¯ ) is −0.04 m for dominant height, −0.73 trees ha−1 for stand density, and −0.075 m2 ha−1 for basal area. In general, the small residual mean and high variance explained obtained with cross-validation indicate that this model system produces unbiased predictions. We are confident it will reflect the treatment effect across the southern physiographic regions when used for long-term projections. The non-thinning conditions produce the highest RMSD for stand density (37.9 trees ha−1) and basal area (1.32 m2 ha−1) compared with others plots that have received thinning at least one time (treatments Thin, Fert, CVC, and Fert + CVC). This result is consistent with the differences in standard prediction error observed in Figure 4 between non-thinned control and first-thinned plots.

3.2. Treatment Effects

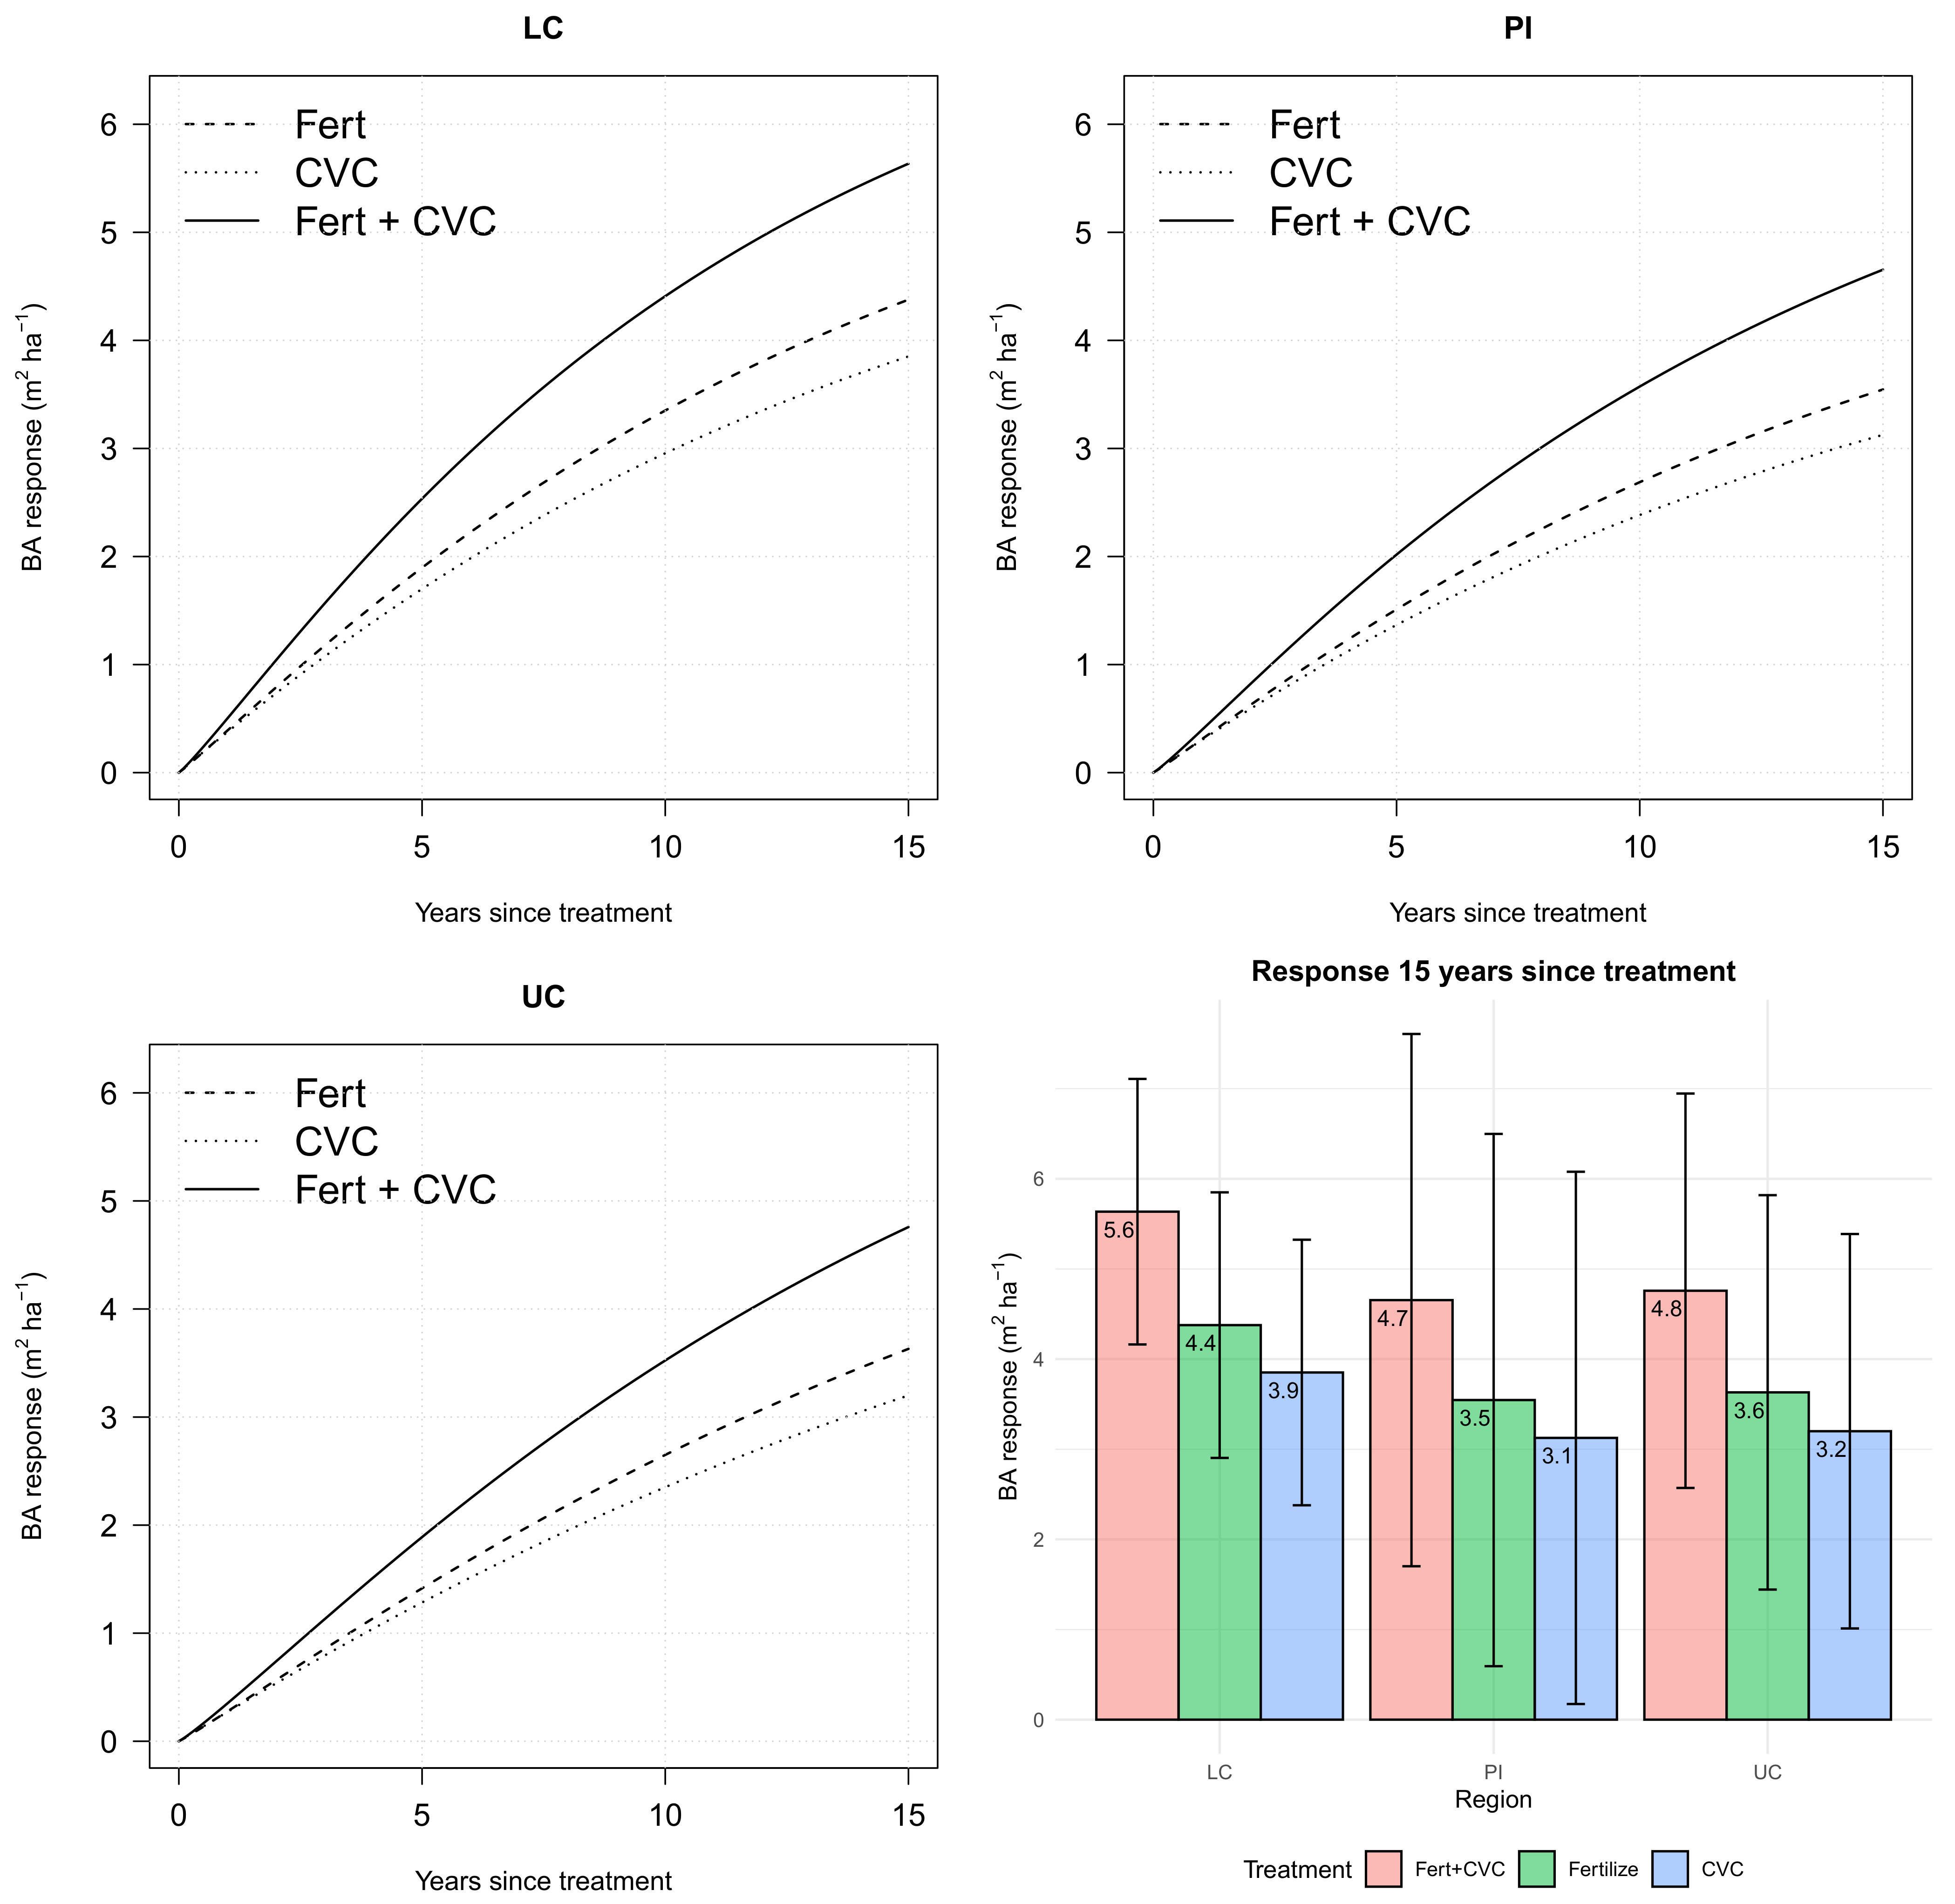
Considering that the model system fits well, and the cross-validation results indicate an acceptable predictability ability, Equation (17) can be used for inference and to characterize the basal area response type due to the MRSP. Figure 5 shows the result of using the Equation (5), (9), and (17) to simulate the response in basal area of a stand that was thinned by the first time at age 12, the basal area before thinning was 26.7 m2 ha−1, the number of trees before thinning was 1493 trees ha−1, the thinning intensity R = 0.672 , the remaining basal area was 11.5 m2 ha−1, the remaining number of trees was 489 trees ha−1, and the dominant height at the moment of the thinning was 15.5 m (site index of 28.2 m at base age 25). The same simulated plot was used in each physiographic region to visualize the treatment effects across regions. All simulations were compared with the basal area of the Thin only condition. In this particular example, after 15 years since treatments (age 27), all the treated plots (Fert, CVC, and Fert + CVC) responded positively to the treatments and resulted in significant differences compared with thin only (see Figure 5).
The combined treatment produces the largest mean response in the three regions. LC is the most responsive region in all the treatments. The B A response for treatment Fert+CVC was 5.6 m2 ha−1, which is 18.1 percent of the accumulated basal area with thin only. In this example, after 15 years, the treatment effects persisted in producing favorable growth rates in basal area. However, the large projected standard deviation obtained with the fitted model 15 years after treatment does not conclude statistical differences between treatments. The Weibull modifier influences the type of response observed in Figure 5. For all the installations available in the MRT study, we found that the combined treatment produces a less than additive response.
The basal area projection equation was used to compare the expected relative increment after 15 years since treatment in all the installations. The response pattern Fert + CVC > Fert > CVC was observed in 26 of 49 installations. Fert produced the larges response in 7 of 49 installations, CVC produced the largest response in 4 of 49 installations. The pattern Fert + CVC > CVC > Fert was observed in 8 of 49 installations. The Fert and CVC produced equal relative increments in 3 of 49 installations. In only one installation, all the treatments produced the same relative increment.
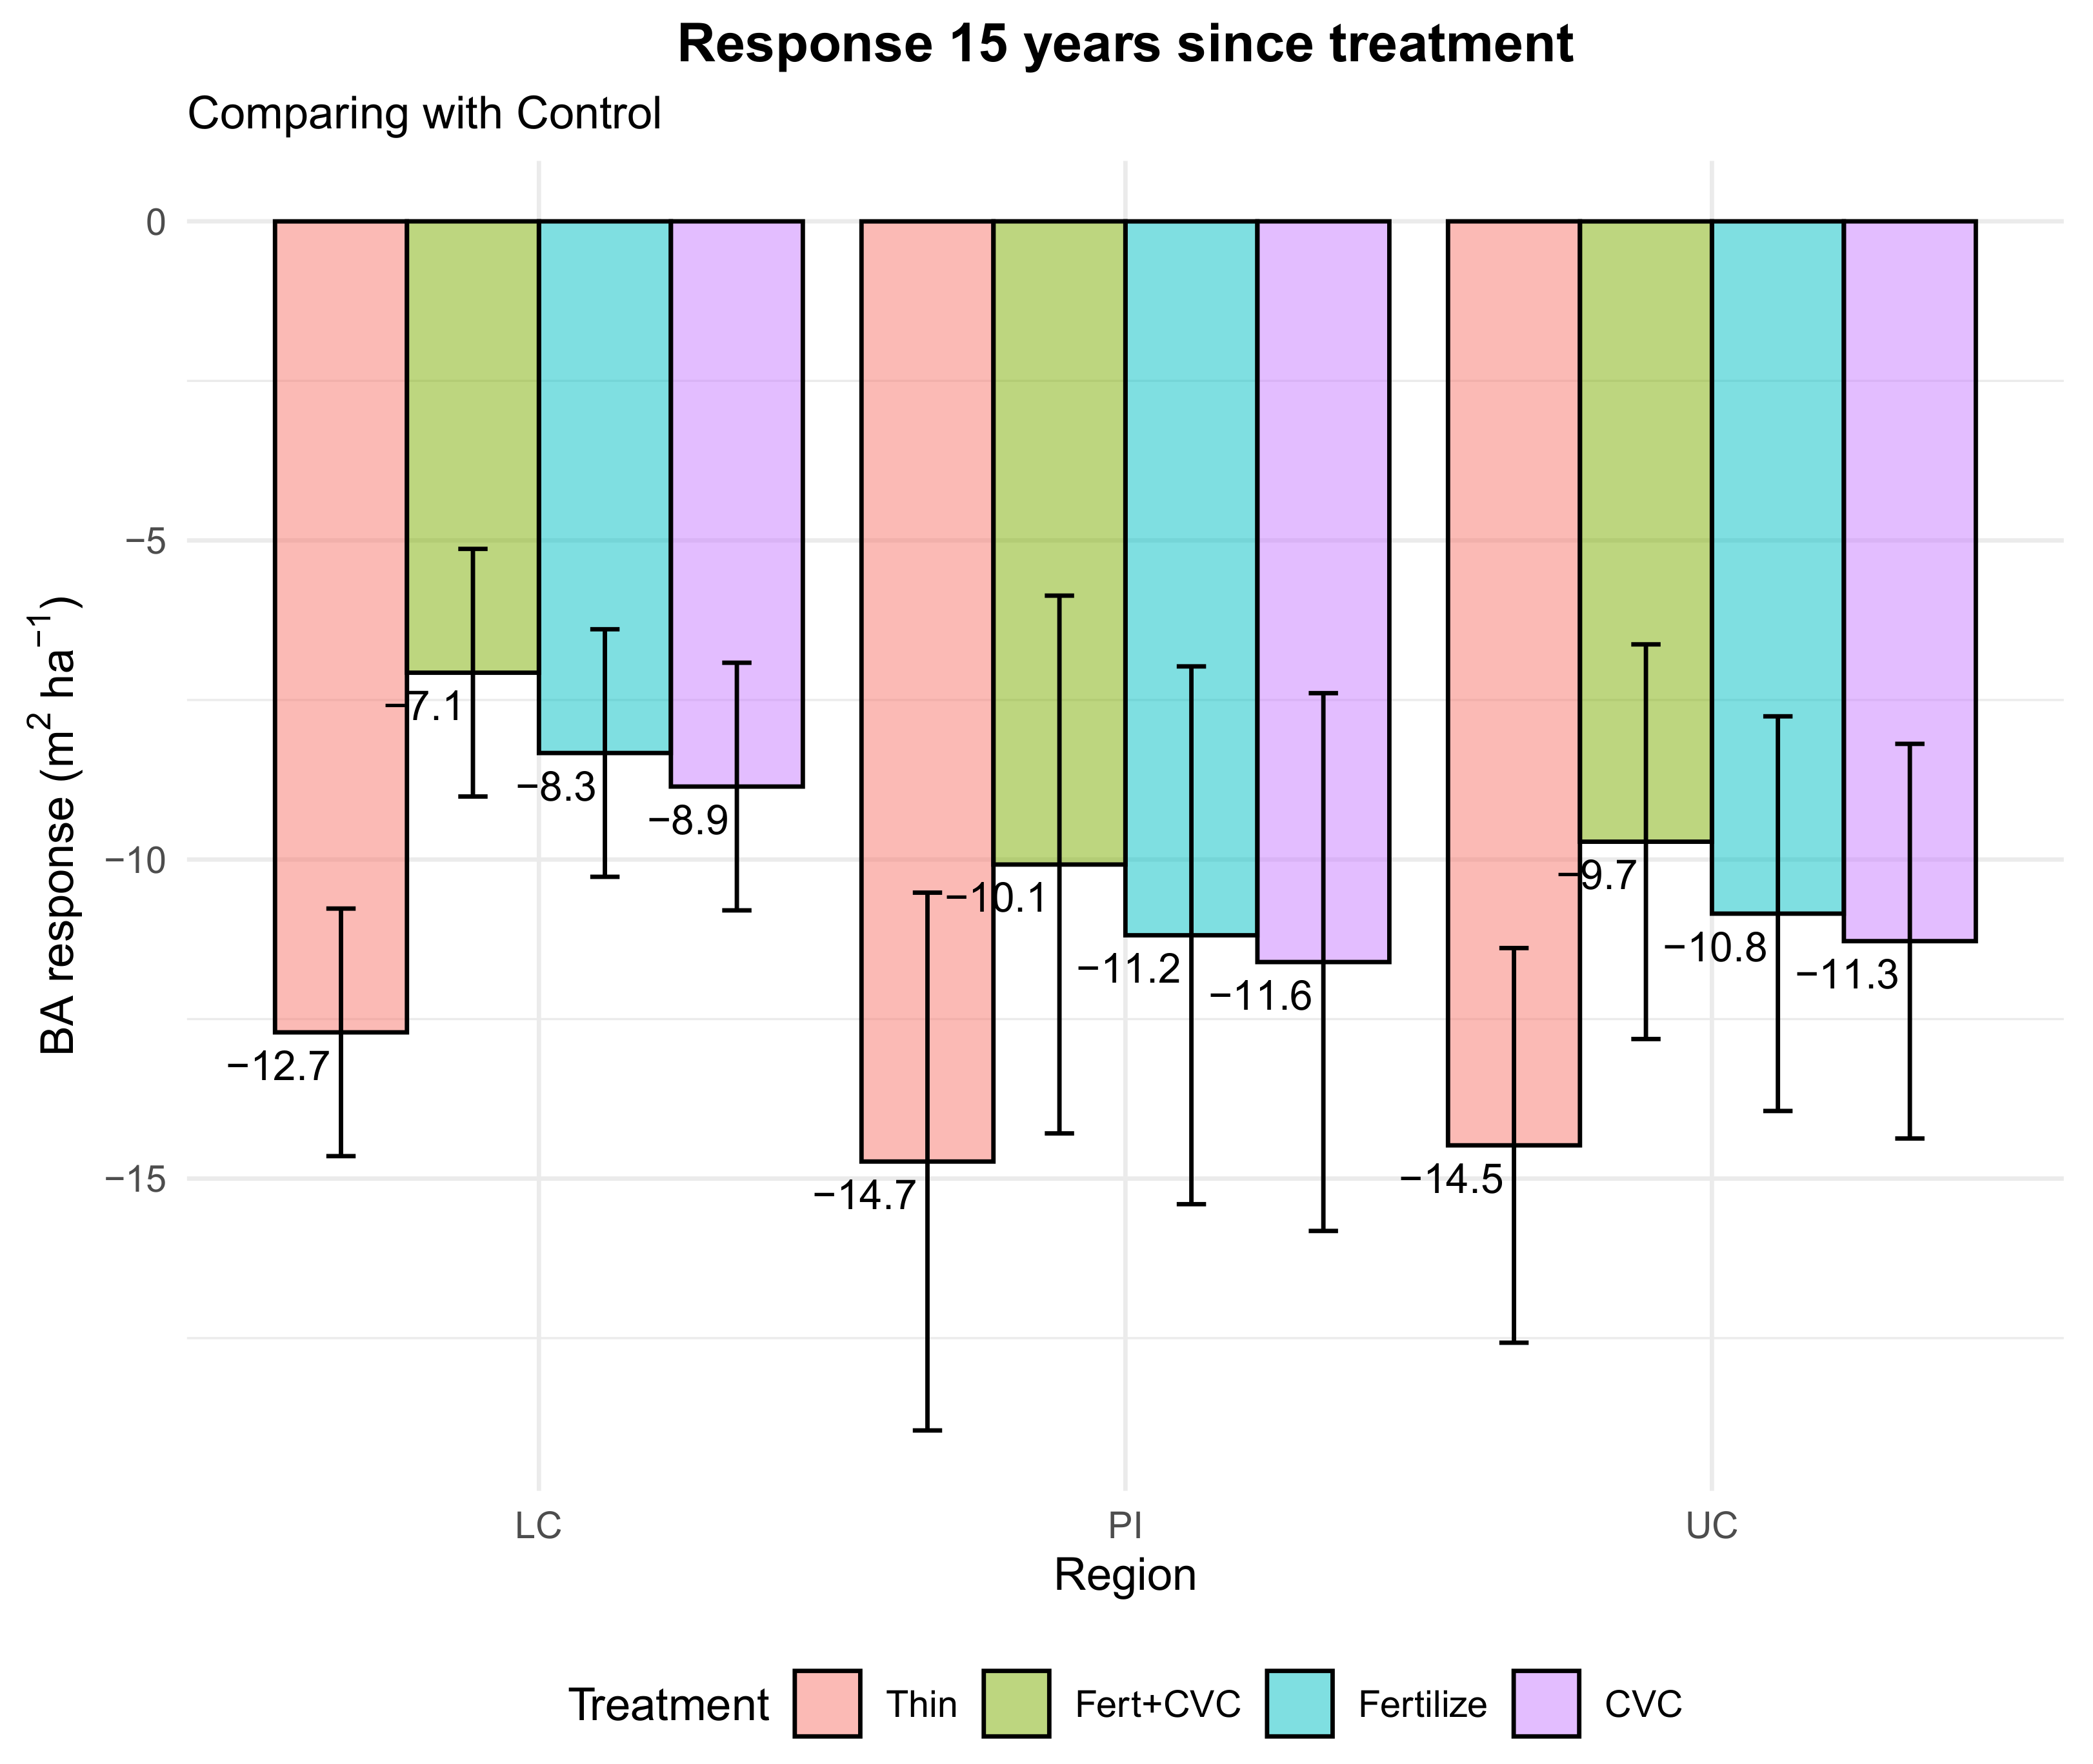
Figure 6 compares the response of the treatments with the Control. The response was defined as the difference between the basal area in the treated plot and the basal area in the Control. Negative values indicate that after 15 years the thinning treatments do not exceed the basal area accumulated in the Control. However, as is evident from the above analysis in Figure 5, the Fert + CVC treatment consistently produces projections closer to the Control trajectories, but even so, the effect of thinning after 15 years produces significant differences between the Control and the treatments.

4. Discussion

Different modeling assumptions and approaches have been proposed to mode MRSP effects. It ranges from empirical models at the tree level (e.g., [7,33]), or single treament at the stand level (e.g., [34]) to ones based on process-based models (e.g., [35,36]). The model presented here mostly undertake an empirical approach at the stand level but was formulated using growth theory principles. The fitted model system was designed to project stand attributes like dominant height, stand density, and basal area. Initial stand information at the moment of the thinning and immediately after thinning is required for projections. They can be obtained directly from field measurements or can be simulated using existing non-thinning regional base-models and applying thinning intensity indices to derive the remaining trees and basal area per hectare.
From a modeling perspective, the G&Y system presented here with the MRT study provides an understanding of how thinning practices interact with other mid-rotation treatments commonly applied across the southeastern U.S. Traditionally, responses to mid-rotation treatments have been included in G&Y systems using modifier sub-models [12,13,15]. However, previous approaches do not produce compatible G&Y systems. Our literature review indicates that most of the modifiers have been used as perturbing functions to the stand-yield trajectory and mostly are pure empirical models without biological support.
Our model’s creativity and importance are based on the possibility of integrating a Weibull D H -dependent probability density function as a modifier accounting for the direct effect and interaction of MRSP into the basal area growth model, and that the model as a whole consist of a compatible and consistent state-space formulation for three physiographic regions in the southeastern U.S.
The Weibull-modifier was shown to be convenient, bound the magnitude of the response, include a temporal component, and allows us to derive closed forms for the basal area yield. The inclusion of bounding parameters or bounding modifiers has been shown to be effective in modeling plantations responses [17].
We interpreted the Weibull-modifier pdf shapes as how the stand gross increment responds to the treatment relative to the D H growth. Over time, the D H growth after treatment will indicate when the plantation reaches a limit of productivity gain as the treatment ameliorates resource constraints. Two crucial characteristics arise from this new D H -dependent modifier. First, using the D H change as a driver for the treatment response effect means that the model can adjust the projected response accordingly with the site quality. Second, the D H growth is directly linked to the physiological growth response for B A .
The dynamic G&Y model presented only includes modifiers in the BA growth model. The statistical variable selection criteria used do not support the hypothesis that D H or N was affected by the presence of MRSP compared with the thinning only control. Other authors have reported similar results with mid-rotation treatments. For example, [37] reported no changes in stem density in a mid-rotation controlled experiment with optimal and sustained treatment applications of fertilization and irrigation. They also observed that nine years after treatment, there was a continuous increase in height growth rate for treated plots, explained by the very poor initial nutrient availability of the study site. In the control plots, without thinning, the most competition-related mortality occurred in diameter classes below the plot mean, which is consistent with other reports of the thinning effect in the literature [38]. Contrary to the control plots, on the treated plots, the thinning practice minimized mortality losses, and on those with an extra MRSP, the BA growth was enhanced compared with thinning only treatment.
The estimated parameters for the model in Equation (4) indicate that the anabolic component for the D H growth is affected by location (physiographic region) and intensity of thinning (R). Specifically, the results of estimated parameters for Equations (2) and (3) reveal that physiographic regions and thinning intensities are essential to define the asymptotic and growth rate behavior for D H . MRSP, other than thinning, does not show important contributions in the D H model estimation. This result is consistent with [15], who found no effect of mid-rotation fertilization on the D H asymptotic parameter.
The treatment Fert + CVC was the most responsive across all installations. Analyzing the confidence intervals for B A projections from the simulated stand in Figure 5 indicates that after 2.8 years, the BA with Fert + CVC treatment differs from its control. Twenty years after treatment, all three treatment responses present significantly larger values. Additionally, the order Fert + CVC > Fert > CVC was observed in 53% of the installations when comparing their projected relative basal area gain. The projected response for the combination of treatments was always less than additive. The authors in [39] reported contrasting results. They studied fertilization and vegetation control responses in a 2 × 2 factorial design replicated in a wide range of sites across the Southeastern (13 sites). They found that the results of the interaction of treatments indicate that the combined treatment effects were additive, only four sites had a less than additive response. They conclude that other limitations beyond nitrogen and phosphorus were being ameliorated by the vegetation control.
Across all the physiographic regions, we found that in 65% of the installations, the BA response with Fert was larger than with CVC. This result agrees with other reports for loblolly pine in the southeastern U.S. The authors in [40] reported that at mid-rotation, the low level of available soil nutrients, principally N and P, were the more limiting factor to growth rather than water limitations. In 22% of the installations, we found that CVC treatments produce equal or larger relative responses than Fert only. This changing positive result can be explained by the low local availability of nutrients and low efficacy of Fert when there is no vegetation control. The importance of competition for soil nutrients between pines and understory plants has been well established. In nutrient-limited environments such as these, sustained control of understory competition can reduce the nutrient deficiencies in a pine plantation similar to annual fertilizer applications [41].
The projection system of equations proposed here assumes that the stand’s initial conditions when applying the treatments are known. The MRT experiment design supports this modeling assumption. The installation plots were carefully selected for homogeneity (not a random sample within a stand), seeking nearly similar basal area values and dominant height. The treatments were randomly assigned to plots following the same thinning intensity level within the installation. The first measurement was simultaneous or close to the treatment application; therefore, the first measurement, does not express the treatment effect. The estimation method proposed here assumes the first measurements as fixed and known and are the initial conditions used to solve the differential Equations in (4), (7) and (16).

5. Conclusions

The modeling strategies followed in this research offer a biological and mathematically consistent framework to assess loblolly pine growth responses due to mid-rotation treatments, including thinning, fertilization, competitive vegetation control, and their combinations. The proposed model system is a dynamic compatible growth and yield system rooted in theoretical and biological principles. The model proved to have high predictive accuracy and can be used to project the current stand attributes following combinations of mid-rotation silvicultural practices with different thinning levels and intensities. The modifier incorporated in the growth model for the basal area is a D H -dependent function that expresses a temporal effect of treatments. Because of the model structure, the response to treatments changes with location, age when applied, and dominant height growth.
We use the regional Mid-Rotation Treatment (MRT) study established by the Plantation Management Research Cooperative (PRMC) at the University of Georgia, which includes a variety of site qualities and growth conditions in thinned and non-thinned conditions. Therefore, the proposed model well represents regional growth conditions in loblolly pine plantations.
The results for model validation demonstrate that the proposed model has high predictive accuracy for the three stand components of D H , N, and B A . This robust model quality through all the treatments and geographic locations can be attributed to a consistent growth assumption. Combining the high predictive ability, width spatial representation, and the fact that our data set includes treatment measurements for ten years after mid rotations treatments makes the model predictions accurate either for a second thinning or final rotation management decisions.

Author Contributions

Conceptualization, M.Z.-C.; methodology, M.Z.-C., B.P.B., C.R.M., and M.B.K.; formal analysis, M.Z.-C. and B.P.B.; writing—original draft preparation, M.Z.-C. and B.P.B.; writing—review and editing, M.Z.-C., B.P.B., C.R.M. and M.B.K.; funding acquisition, B.P.B. and C.R.M. All authors have read and agreed to the published version of the manuscript.

Funding

This research was funded by the Plantation Management Research Cooperative (PMRC) in the Warnell School of Forestry and Natural Resources at the University of Georgia, and was supported in part by resources and technical expertise from the Georgia Advanced Computing Resource Center, a partnership between the University of Georgia’s Office of the Vice President for Research and Office of the Vice President for Information Technology.

Data Availability Statement

Data sharing not applicable.

Acknowledgments

The authors thank the Plantation Management Research Cooperative (PMRC) members for their support and interest in sustaining the field experiment, and the PMRC Field Crew for the establishment, treatments, and plot measurements.

Conflicts of Interest

The authors declare no conflict of interest. The funders had no role in the design of the study; in the collection, analyses, or interpretation of data; in the writing of the manuscript, or in the decision to publish the results.

Appendix A

Appendix A.1. Derivation of Equation (5)

Equation (4) is a first-order differential equation:
d D H d t = α D H m k D H
We can solve the integral turning (A1) as a Bernoulli equation. First let us define V = D H 1 m , then D H = V 1 1 m . Differentiation of D H with respect t gives,
d D H d t = 1 1 m V m 1 m d V d t
Substituting (A2) in (A1), and substituting D H by this new transformation in terms of V gives,
1 1 m V m 1 m d V d t = α V 1 1 m m k V 1 1 m
After some algebra to solve for d V d t we get,
d V d t = ( 1 m ) α k ( 1 m ) V
Equation (A4) is a linear differential equation. Let us define the integrating factor μ ( t ) as
μ ( t ) = e k ( 1 m ) d t
Note that the first derivative of the integrating factor in (A5) is,
d μ ( t ) d t = e k ( 1 m ) d t k ( 1 m ) = μ ( t ) k ( 1 m )
and its integral is,
μ ( t ) d t = 1 k ( 1 m ) e k ( 1 m ) t + C
Multiplying everything in (A4) by μ ( t ) and rearrange terms, we get,
μ ( t ) d V d t + μ ( t ) k ( 1 m ) V ( t ) = μ ( t ) ( 1 m ) α
The left side of (A8) becomes ( μ ( t ) V ) by the product rule in calculus. Then (A8) reduce to
μ ( t ) V = μ ( t ) ( 1 m ) α
Integrating both sides of (A9) and solving for D H gives,
μ ( t ) V = ( 1 m ) α 1 k ( 1 m ) e k ( 1 m ) t + C e k ( 1 m ) t D H 1 m = α k e k ( 1 m ) t + C D H 1 m = α k + C e k ( 1 m ) t D H = α k + C e k ( 1 m ) t 1 1 m
The invariant equation is obtained from (A10) solving for the constant C:
C = D H 1 m α k e k ( 1 m ) t
Assuming known initial conditions, D H ( t 0 ) = D H t h , and t 0 = t t h , associated at the moment of the thinning, then the constant term in (A11) is known and fixed. Substituting (A11) into (A10) and using the initial values condition gives,
D H = α k + D H 1 m α k e k ( 1 m ) t e k ( 1 m ) t t h 1 1 m D H = α k + D H 1 m α k e k ( 1 m ) t t t h 1 1 m
Equation (A12) is a projection equation for D H . The initial condition values comes from the stand D H and age at the moment of thinning. Equation (A12) correspond with the equation presented in (5).

Appendix A.2. Derivation of Equation (7)

The stand density differential equation is separable and has the following form
d N d D H = n 1 1 e + 16 D H n 2 N n 3
Grouping terms, (A13) can be written as
N n 3 d N = n 1 D H n 2 d D H
Integrating both sides of (A14) gives,
N n 3 d N = n 1 D H n 2 d D H N 1 n 3 n 3 + 1 = n 1 D H n 2 + 1 n 2 + 1 + C N 1 n 3 = n 1 n 3 1 n 2 + 1 D H n 2 + 1 + C
Taken ( N t h , t t h ) , and D H t h as initial values, the resulting invariant is,
C = N t h 1 n 3 n 1 n 3 1 n 2 + 1 D H t h n 2 + 1
Substituting (A16) into (A15) and solving for N, we get,
N 1 n 3 = n 1 n 3 1 n 2 + 1 D H n 2 + 1 + N t h 1 n 3 n 1 n 3 1 n 2 + 1 D H t h n 2 + 1 N = N t h 1 n 3 + n 1 n 3 1 n 2 + 1 D H n 2 + 1 D H t h n 2 + 1 1 1 n 3
(A17) is the projection form for stand density given the known initial stand density ( N t h ) and dominant height ( D H t h ) immediately after thinning.

Appendix A.3. Derivation of Equation (17)

The stand basal area differential equation has the following form
d B A d D H = b 0 N b 3 ( b 2 1 ) B A b 2 b 3 B A N d N d D H
Let us V = B A 1 b 2 , then B A = V 1 1 b 2 . Taken derivatives of B A respect to D H :
d B A d D H = 1 1 b 2 V b 2 1 b 2 d V d D H
Substituting (A19) in (A18) and rearranging terms, we get,
1 1 b 2 V b 2 1 b 2 d V d D H = b 0 N b 3 ( b 2 1 ) V b 2 1 b 2 b 2 b 3 V 1 1 b 2 N d N d D H
1 1 b 2 d V d D H = b 0 N b 3 ( b 2 1 ) b 3 V N d N d D H
d V d D H + b 3 ( 1 b 2 ) V N d N d D H = b 0 N b 3 ( b 2 1 ) ( 1 b 2 )
Equation (A21) can be solved using the Bernoulli’s integration rule. Let us define the integrating factor as
μ ( D H ) = e x p b 3 ( 1 b 2 ) 1 N d N d D H d D H = N b 3 ( 1 b 2 )
Multiplying everything in (A21) by μ ( D H ) gives,
μ ( D H ) d V d D H + b 3 ( 1 b 2 ) μ ( D H ) V N d N d D H = μ ( D H ) b 0 N b 3 ( b 2 1 ) ( 1 b 2 )
The left side of (A23) becomes the product rule ( μ ( D H ) V ) . Integrating both sides of (A23) gives,
μ ( D H ) V = μ ( D H ) b 0 N b 3 ( b 2 1 ) ( 1 b 2 ) d D H N b 3 ( 1 b 2 ) B A 1 b 2 + C 1 = b 0 ( 1 b 2 ) d D H
The integral on the right-hand side is resolved as follow:
b 0 ( 1 b 2 ) d D H = ( 1 b 2 ) b 01 + b 02 I U C + b 03 I P I d D H + b 04 ( 1 b 2 ) A g e t h I f + I r + I f r c d D H D H t h d c 1 e x p D H D H t h d c d D H = ( 1 b 2 ) ( b 01 + b 02 I U C + b 03 I P I ) D H + b 04 ( 1 b 2 ) A g e t h I f + I r + I f r 1 e x p D H D H t h d c + C 2
Let us take the observed stand attributes immediately after thinning as initial condition values, D H = D H t h , N = N t h , B A = B A t h . Doing this, the invariant for the B A differential equation is,
C = B A t h ( 1 b 2 ) N b 3 ( 1 b 2 ) ( 1 b 2 ) ( b 01 + b 02 I U C + b 03 I P I ) D H t h
Substituting (A26) in (A24) and solving for B A gives,
B A = [ b 01 + b 02 I U C + b 03 I P I ) D H + W ( 1 b 2 ) N b 3 ( b 2 1 ) + B A t h ( 1 b 2 ) N b 3 ( 1 b 2 ) ( 1 b 2 ) ( b 01 + b 02 I U C + b 03 I P I ) D H t h N b 3 ( b 2 1 ) ] 1 1 b 2
where
W = b 04 A g e t h I f + I r + I f r 1 e x p D H D H t h d c
and rearranging terms we get,
B A = [ B A t h ( 1 b 2 ) N t h N b 3 ( 1 b 2 ) + b 01 + b 02 I U C + b 03 I P I ( 1 b 2 ) N b 3 ( b 2 1 ) D H D H t h + W ( 1 b 2 ) N b 3 ( b 2 1 ) ] 1 1 b 2
Equation (A28) is the basal area projection equation as presented in (17).

Appendix A.4. Modifiers Equations

f Δ B A = ( 1 I S j ) B A S U , age j ( 1 I S i ) B A S U , age i
where f Δ B A is the multiplicative basal area modifier, B A S U , j is the basal area per hectare of the non-thinned counterpart with the same age j, same site index, and N as the thinned plantation B A S T , j . I S = B A S U , j B A S T , j B A S U , j = 1 B A S T , j B A S U , j is the index of suppression at the age i after thinning, and I S j is the suppression index at age j, with i < j [12].
B A S T , age t 2 = B A S U , age t 1 + ( B A a B A b ) + l n ( α ( Z + 1 ) ) γ Z β
where B A S T , age t 2 is the basal area of a thinned stand at age t 2 , B A S U , age t 1 is the basal area of the a reference non-thinned stand at age t 1 obtained from the available yield and growth models. B A a B A b is the thinning intensity measured as the basal area after minus basal area before thinning. The term l n ( α ( Z + 1 ) ) reflects an initial effect of suppression in the basal area’s development immediately after thinning. The power term γ Z β captures the increasing growth of the thinning stand relative to the control after the initial growth suppression stage. Z is years since thinning, β is a parameter to be estimated, parameters α , and γ are functions of stand variables [13].
N S t , age t 2 = N S u , age t 2 + ( N a N b ) e x p ( α Z )
where N S t , age t 2 is the number of trees of the thinned stand at age t 2 following thinning, N S u , age t 2 is the number of trees of the corresponding non-thinned stand at age t 2 . The difference N a N b is the change in the number of trees due to the thinning. α is a parameter that is a function of stand variables at the time of thinning [13].
f r e s = 1 Z > k B A b B A a r ( Z ) 2 + k ( Z ) t 2 0 < Z k
where f r e s is the treatment-response function or modifier, t is the stand age, r is the rate parameter, k is the duration parameter for thinning effect in years, Z is an integer defining years since treatment, and all others terms are as previously defined [15].
N t 2 = N t 1 β 1 + β 2 B A a B A b S I 100 β 3 ( t 2 β 4 t 1 β 4 ) 1 / β 1
where N t 2 is the trees per hectare after thinning at age t 2 , S I is the stand site index, N t 1 is the current number of trees at age t 1 , with t 1 < t 2 , and β 1 , , β 4 are parameters [15].
R = K T A C Z Q
where K is a constant that depend of the species, T = 1 e x p ( a t b ) is the time-effect, t is years elapsed since fertilization, A = 1 e x p ( c r ) is the fertilization effect, r is the amount of fertilizer nutrient applied, C is the composition factor which depend of the specie, C = 1 if it is a pure stand, Z = g s + h s 2 is the stocking factor, s is the stocking expressed as a percentage of normal stocking, Q = i j q is the site quality, q is the site index, a, b, c, g, h, i, and j are parameters.
f r e s = 1 + ( ρ 0 + ρ 1 P ) N 1 β e x p Z β
where N is the nitrogen doses (kg ha 1 ), P is an indicator variable (P=1 if fertilized with P, otherwise P = 0), Z is years since treatment, and ρ 0 , ρ 1 , and β are parameters.
f r e s = 1 + a 0 P S a 1 1 e x p a 2 N ( 1 e x p ( b 0 + b 1 R S ) Z )
where P is a indicator variable, P = 1 if phosphorous is applied, P = 0 if not, N is the level of nitrogen (kg ha−1), S is the estimate site index in m at a base age of 25 years, R S is the relative spacing, R S = 10000 N D H , a 0 , a 1 , a 2 , b 0 , and b 1 are parameters.
f r e s = α Z β e x p { γ Z } α = ( 1 e x p { b 1 N } ) ( D H / 10 ) b 2 ( A / 10 ) b 3 ( S / 10 ) b 4 ( N / 100 ) b 5 + ( D 1 b 6 ) γ = b 7 + b 8 l n ( 1 + P )
where Z is years since treatment, N is the amount (kg ha−1) of nitrogen applied, P is the amount (kg ha−1) of phosphorous applied, D H is the dominant height at fertilization, A is the stand age in years at fertilization, S is the site index base age 25 yr, N is number of trees per hectare at fertilization, D 1 is an indicator variable, D 1 = 1 if the site is somewhat poorly, poorly or very poorly drained, D 1 = 0 otherwise, β , b 1 , , b 8 are parameters.
f r e s = α Z β e x p { γ Z } α = ( 1 e x p { b 1 N } ) ( D H / 10 ) b 2 ( N / 100 ) b 3 ( B A / 10 ) b 4 γ = b 5 + ( D 1 b 6 + D 2 b 7 + b 8 ) l n ( 1 + P )
where B A is the stand basal area at fertilization, D 1 is an indicator variable, D 1 = 1 if the site is very poorly drained, D 1 = 0 otherwise, D 2 is another indicator variable, D 2 = 1 for somewhat excessively, well, and moderately well drained sites, D 2 = 0 otherwise, b 1 , , b 8 are parameters.

References

  1. Wear, D.N.; Greis, J.G. The southern forest futures project: Summary report. In The Southern Forest Futures Project: Summary Report; SRS-168; Forest Service Southern Research Station: Asheville, NC, USA, 2012; p. 68. [Google Scholar]
  2. Huggett, R.; Wear, D.N.; Li, R.; Coulston, J.; Liu, S. Forecasts of forest conditions. In The Southern Forest Futures Project: Technical Report; Wear, D.N., Greis, J.G., Eds.; General Technical Report SRS-GTR-178; USDA-Forest Service, Southern Research Station: Asheville, NC, USA, 2013; pp. 73–101. [Google Scholar]
  3. Stanturf, J.A.; Kellison, R.C.; Broerman, F.S.; Jones, S.B. Productivity of southern pine plantations. Where are we and how did we get here? J. For. 2003, 101, 26–31. [Google Scholar]
  4. Fox, T.R.; Eric, J.J.; Allen, L.H. The Evolution of Pine Plantation Silviculture in the Southern United States. In Southern Forest Science: Past, Present, and Future; Gen. Tech. Rep SRS-75; U.S. Department of Agriculture, Forest Service, Southern Research Station: Asheville, NC, USA, 2004; Volume 75, p. 394. [Google Scholar]
  5. Fox, T.R.; Lee Allen, H.; Albaugh, T.J.; Rubilar, R.; Carlson, C.A. Tree nutrition and forest fertilization of pine plantations in the Southern United States. South. J. Appl. For. 2007, 31, 5–11. [Google Scholar] [CrossRef] [Green Version]
  6. Cannell, M.; Dewar, R. Carbon allocation in trees: A review of concepts for modelling. Adv. Ecol. Res. 1994, 25, 59–104. [Google Scholar]
  7. Albaugh, T.J.; Fox, T.R.; Rubilar, R.A.; Cook, R.L.; Amateis, R.L.; Burkhart, H.E. Post-thinning density and fertilization affect Pinus taeda stand and individual tree growth. For. Ecol. Manag. 2017, 396, 207–216. [Google Scholar] [CrossRef] [Green Version]
  8. Sampson, D.; Allen, H. Regional influences of soil available water-holding capacity and climate, and leaf area index on simulated loblolly pine productivity. For. Ecol. Manag. 1999, 124, 1–12. [Google Scholar] [CrossRef]
  9. Jokela, E.J.; Martin, T.A.; Vogel, J.G. Twenty-five years of intensive forest management with Southern pines: Important lessons learned. J. For. 2010, 108, 338–347. [Google Scholar]
  10. Miller, J.H.; Zutter, B.R.; Zedaker, S.M.; Edwards, M.B.; Newbold, R.A. Growth and yield relative to competition for loblolly pine plantations to midrotation—A southeastern United States regional study. South. J. Appl. For. 2003, 27, 237–252. [Google Scholar] [CrossRef]
  11. Sharma, M.; Smith, M.; Burkhart, H.E.; Amateis, R.L. Modeling the impact of thinning on height development of dominant and codominant loblolly pine trees. Ann. For. Sci. 2006, 63, 349–354. [Google Scholar] [CrossRef]
  12. Pienaar, L. An Approximation of Basal Area Growth after Thinning Based on Growth in Unthinned Plantations. For. Sci. 1997, 25, 223–232. [Google Scholar]
  13. Amateis, R.L. Modeling Response to Thinning in Loblolly Pine Plantations. South. J. Appl. For. 2000, 24, 17–22. [Google Scholar] [CrossRef] [Green Version]
  14. Weiskittel, A.R. (Ed.) Forest Growth and Yield Modeling; Wiley: Hoboken, NJ, USA, 2011. [Google Scholar]
  15. Gyawali, N.; Burkhart, H.E. General Response Functions to Silvicultural Treatments in Loblolly Pine Plantations. Can. J. For. Res. 2015, 45, 252–265. [Google Scholar] [CrossRef]
  16. Ballard, T. A simple model for predicting stand volume growth response to fertilizer application. Can. J. For. Res. 1984, 14, 661–665. [Google Scholar] [CrossRef]
  17. Scolforo, H.F.; Montes, C.; Cook, R.L.; Lee Allen, H.; Timothy, J.; Rubilar, R.; Campoe, O. A New Approach for Modeling Volume Response from Mid-Rotation Fertilization of Pinus taeda L. Plantations. Forests 2020, 11, 646. [Google Scholar] [CrossRef]
  18. Amateis, R.L.; Liu, J.; Ducey, M.J.; Lee Allen, H. Modeling response to midrotation nitrogen and phosphorus fertilization in Loblolly Pine plantations. South. J. Appl. For. 2000, 24, 207–212. [Google Scholar] [CrossRef] [Green Version]
  19. Clutter, J.L.; Jones, E. Prediction of growth after thinning in old-field slash pine plantations. In Forest Service Research Paper; SE-217; Southern Forest Experiment Station: Asheville, NC, USA, 1980; p. 19. [Google Scholar]
  20. Garcia, O.; Burkhart, H.E.; Amateis, R.L. A biologically-consistent stand growth model for loblolly pine in the Piedmont physiographic region, USA. For. Ecol. Manag. 2011, 262, 2035–2041. [Google Scholar] [CrossRef]
  21. U.S. Environmental Protection Agency. Level III and IV Ecoregions by State. Available online: https://www.epa.gov/eco-research/level-iii-and-iv-ecoregions-state (accessed on 16 April 2021).
  22. Albaugh, T.J.; Fox, T.R.; Cook, R.L.; Raymond, J.E.; Rubilar, R.A.; Campoe, O.C. Forest fertilizer applications in the Southeastern Unites States from 1969 to 2016. For. Sci. 2019, 65, 335–362. [Google Scholar]
  23. Bertalanffy, V. Problems of organic growth. Nature 1949, 163, 156–158. [Google Scholar] [CrossRef]
  24. Pienaar, L.; Turnbull, K. The Chapmant-Richards generalization of von Bertalanffy’s growth model for basal area growth and yield in even-age stands. For. Sci. 1973, 19, 2–22. [Google Scholar]
  25. Garcia, O. A stochastic differential equation model for the height growth of forest stands. Biometrics 1983, 39, 1059. [Google Scholar] [CrossRef]
  26. Blanchard, P.; Devaney, R.; Hall, G. Differential Equations, 4th ed.; Brooks/Cole, Cengage Learning: Boston, MA, USA, 2012. [Google Scholar]
  27. R Core Team. R: A Language and Environment for Statistical Computing; R Foundation for Statistical Computing: Vienna, Austria, 2020. [Google Scholar]
  28. Kreutz, C.; Raue, A.; Kaschek, D.; Timmer, J. Profile likelihood in systems biology. FEBS J. 2013, 280, 2564–2571. [Google Scholar] [CrossRef]
  29. Gallagher, D. Uncertainty Estimaton in Forest Growth and Yield Systems. Ph.D. Thesis, University of Georgia, Athens GA, USA, 2019. [Google Scholar]
  30. Genz, A.; Bretz, F.; Miwa, T.; Mi, X.; Leisch, F.; Scheipl, F.; Hothorn, T. Mvtnorm: Multivariate Normal and t Distributions; R Package Version 1.1-0. Available online: https://cran.r-project.org/web/packages/mvtnorm/mvtnorm.pdf (accessed on 24 March 2021).
  31. Li, J. Assessing the accuracy of predictive models for numerical data: Not r nor r2, why not? Then what? PLoS ONE 2017, 12, e0183250. [Google Scholar] [CrossRef] [PubMed] [Green Version]
  32. Stage, A.; Crookston, N. Partitioning error components for accuracy-assessment of near-neighbor methods of imputation. For. Sci. 2007, 53, 62–72. [Google Scholar]
  33. Soderbergh, I.; Ledermann, T. Algorithms for simulating thinning and harvesting in five European individual-tree growth simulators: A review. Comput. Electron. Agric. 2003, 39, 115–140. [Google Scholar] [CrossRef]
  34. Franklin, O.; Aoki, K.; Seidl, R. A generic model of thinning and stand density effects on forest growth, mortality and net increment. Ann. For. Sci. 2009, 66, 815. [Google Scholar] [CrossRef] [Green Version]
  35. Bryars, C.; Maier, C.; Zhao, D.; Kane, M.; Borders, B.; Will, R.; Teskey, R. Fixed physiological parameters in the 3-PG model produced accurate estimates of loblolly pine growth on sites in different geographic regions. For. Ecol. Manag. 2013, 289, 501–514. [Google Scholar] [CrossRef]
  36. Subedi, S.; Fox, T.R. Modeling repeated fertilizer response and one-time midrotation fertilizer response in loblolly pine plantations using FR in the 3-PG process model. For. Ecol. Manag. 2016, 380, 90–99. [Google Scholar] [CrossRef] [Green Version]
  37. Albaugh, T.J.; Lee Allen, H.; Dougherty, P.M.; Johnsen, K.H. Long term growth responses of loblolly pine to optimal nutrient and water resource availability. For. Ecol. Manag. 2004, 192, 3–19. [Google Scholar] [CrossRef]
  38. Jokela, E.J.; Dougherty, P.M.; Martin, T.A. Production dynamics of intensively managed loblolly pine stands in the southern United States: A synthesis of seven long-term experiments. For. Ecol. Manag. 2004, 192, 117–130. [Google Scholar] [CrossRef]
  39. Albaugh, T.J.; Stape, J.L.; Fox, T.R.; Rubilar, R.A.; Allen, H.L. Midrotation Vegetation Control and Fertilization Response in Pinus taeda and Pinus elliottii across the Southeastern United States. South. J. Appl. For. 2012, 36, 44–53. [Google Scholar] [CrossRef]
  40. Allen, H.; Fox, T.; Campbell, R. What is ahead for intensive pine plantation silviculture in the South? South. J. Appl. For. 2005, 29, 62–69. [Google Scholar] [CrossRef] [Green Version]
  41. Jokela, E.J.; Martin, T.A. Effects of ontogeny and soil nutrient supply on production, allocation, and leaf area efficiency in loblolly and slash pine stands. Can. J. For. Res. 2000, 30, 1511–1524. [Google Scholar] [CrossRef]
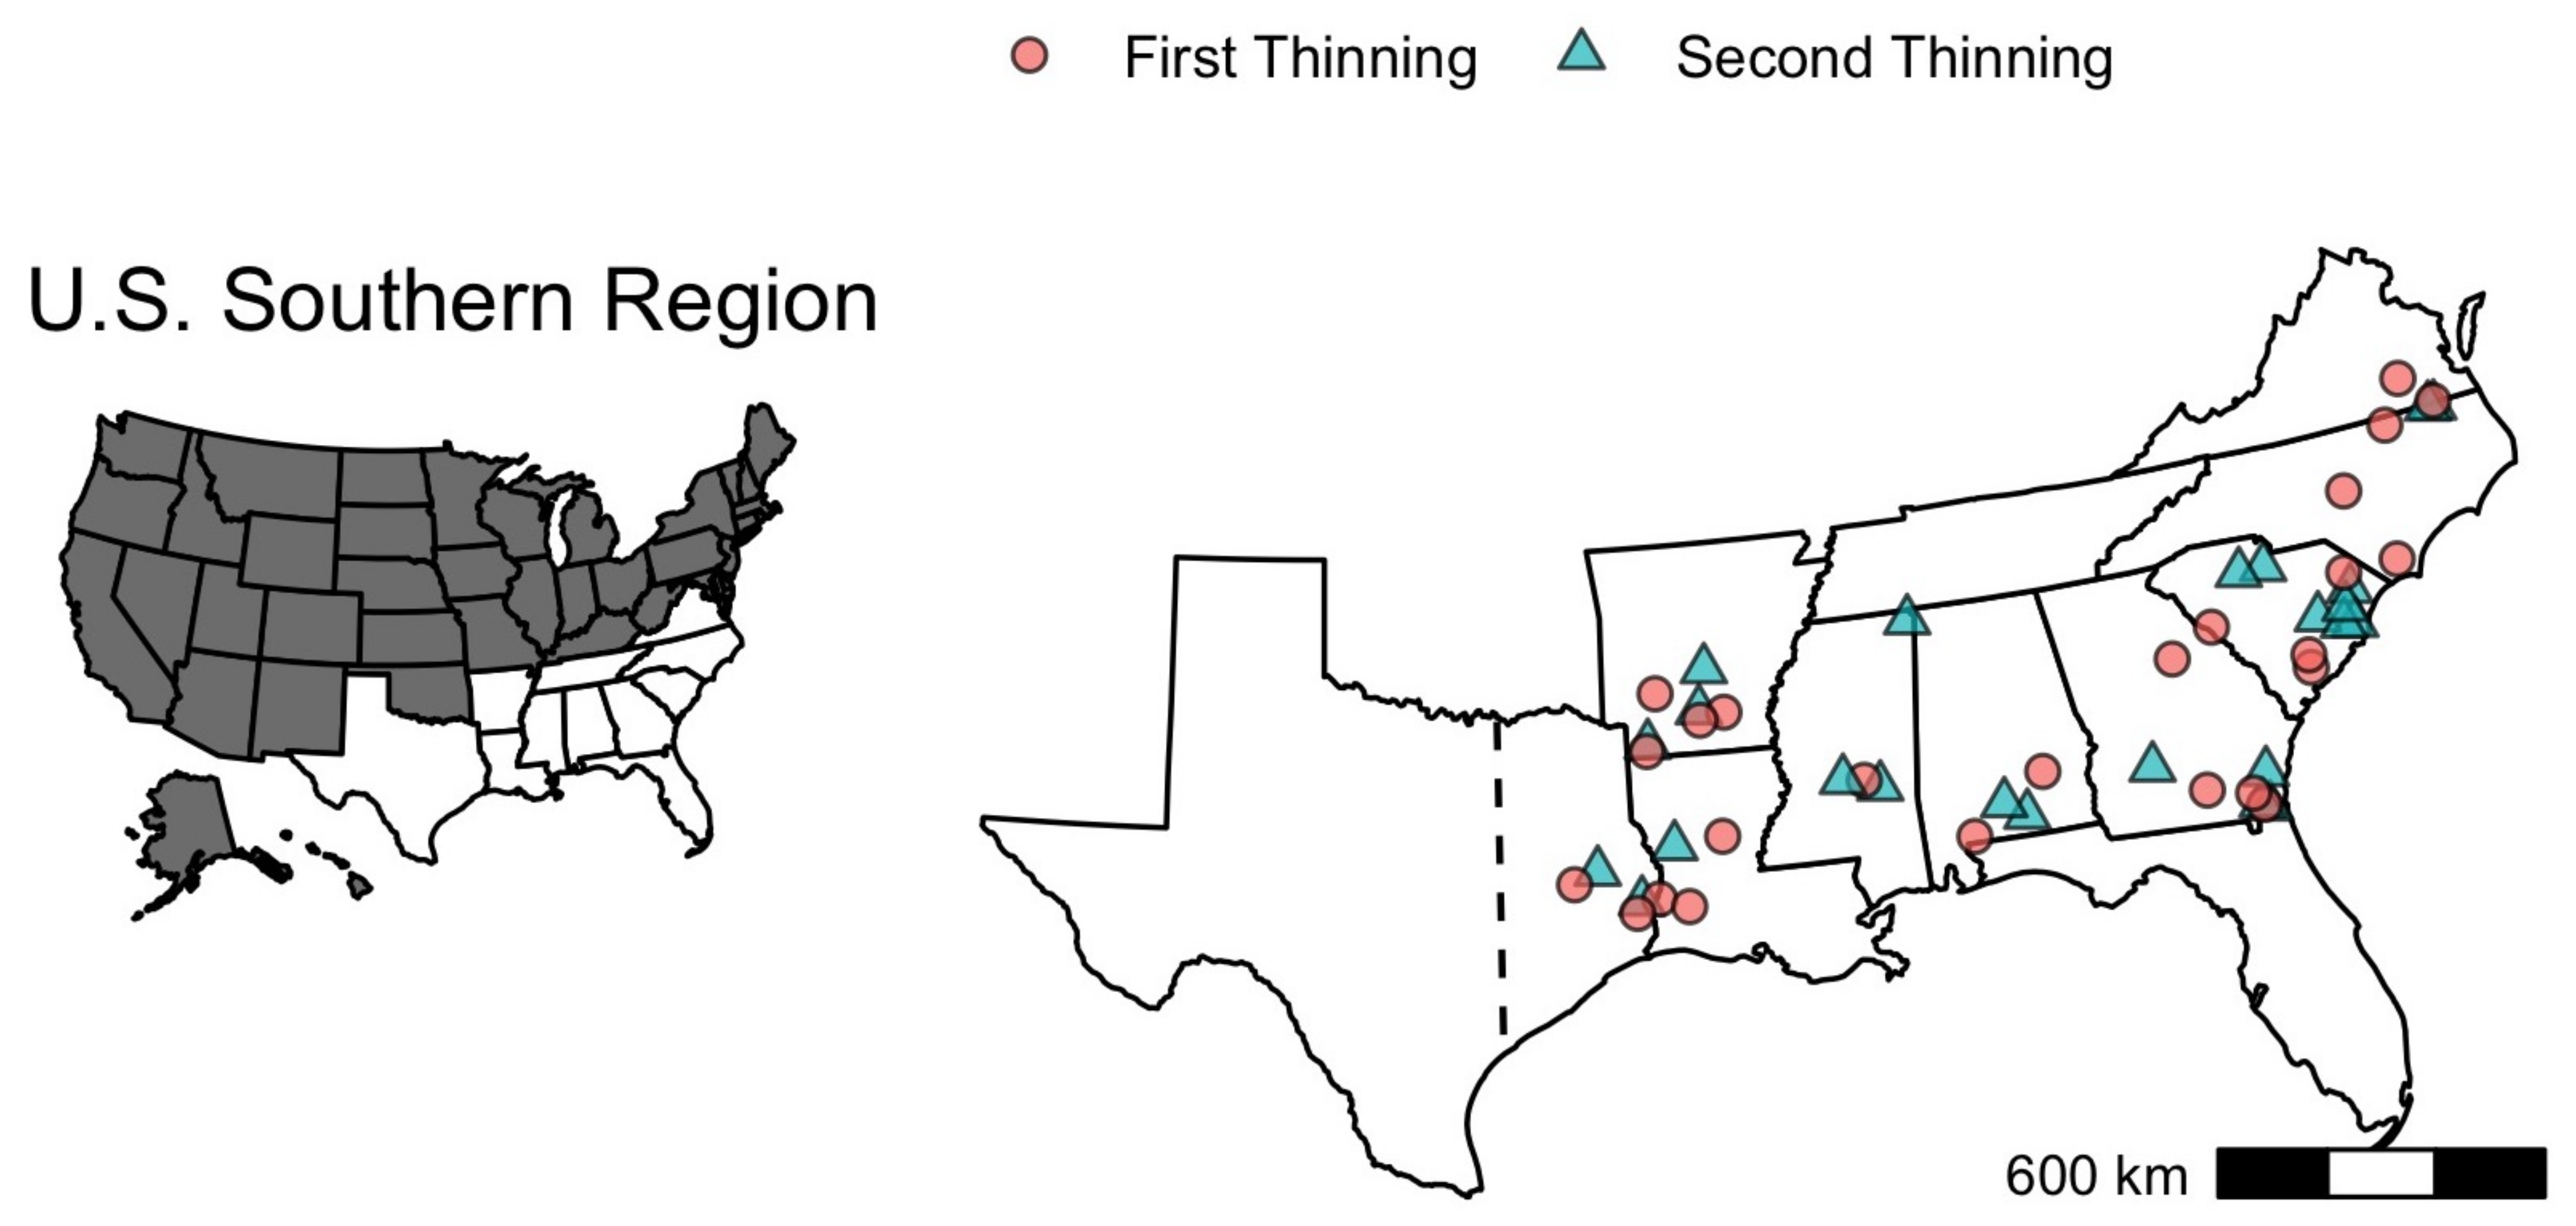
Figure 1. The southeastern U.S. region (left) and location of 49 installations from the PMRC Mid-Rotation Treatment study (right). Twenty-five installations in first-thinned and 24 in second-thinned loblolly pine plantations. In each installation, an unreplicated randomized 2 × 2 factorial setting for post-thinning fertilization and competitive vegetation control treatments was established plus a control non-thinned plot.
Forests 12 00556 g001
Figure 2. Observed and predictions for the three stand-level variables (left) and residuals compared with estimated values (right) for dominant height (A), stand density (B), and basal area (C). The diagonal red line has slope one and origin zero.
Forests 12 00556 g002aForests 12 00556 g002b
Figure 3. Magnitude and behavior of the modifier Weibull function for three mid-rotation silvicultural practices. Fertilization (Fert), Competitive vegetation control (CVC), and their combination (Fert + CVC). The modifier function is coupled with the basal area growth equation, Equation (13).
Forests 12 00556 g003
Figure 4. Projected error standard deviation for dominant height (m), stand density (trees ha−1), and basal area (m2 ha−1) by physiographic region using Equations (19)–(21). All projections were calculated assuming a loblolly pine plantation thinned at age 12 years, 1493 trees ha−1 before thinning, 489 trees ha−1 remaining after thinning, 11.5 m2 ha−1 of basal area after thinning, 15.5 m of dominant heights at age 12, and a thinning intensity R = 0.672 .
Forests 12 00556 g004aForests 12 00556 g004b
Figure 5. Basal area response of loblolly pine to mid-rotation treatments after thinning (Fert = fertilization, CVC = competitive vegetation control, and Fert + CVC = combination of fertilization and competitive vegetation control), for a simulated stand in three physiographic regions (LC = Lower Coastal Plain, UC = Upper Coastal Plain, and PI = Piedmont) in the southeastern U.S. The simulated stand received the first thinning at age 12, the basal area before thinning was 26.7 m2 ha−1, the number of trees before thinning was 1493 trees ha−1, the thinning intensity R = 0.672 , the remaining basal area was 11.5 m2 ha−1, the remaining number of trees was 489 trees ha−1, and the dominant height at the moment of thinning was 15.5 m (site index 28.2 m at base age 25). The expected Basal Area responses 15 years since treatment by region (bottom right) are shown with respective 95% confidence intervals.
Forests 12 00556 g005
Figure 6. Expected basal area response of loblolly pine to mid-rotation treatments compared with the Control situation (Thin = thinning only, Fert = fertilization, CVC = competitive vegetation control, and Fert + CVC = combination of fertilization and competitive vegetation control), for a simulated stand in three physiographic regions (LC = Lower Coastal Plain, UC = Upper Coastal Plain, and PI = Piedmont) in the southeastern U.S. The simulated stand received the first thinning at age 12, the basal area before thinning was 26.7 m2 ha−1, the number of trees before thinning was 1493 trees ha−1, the thinning intensity R = 0.672 , the remaining basal area was 11.5 m2 ha−1, the remaining number of trees was 489 trees ha−1, and the dominant height at the moment of thinning was 15.5 m (site index 28.2 m at base age 25). The expected Basal Area responses 15 years since treatment by region are shown with respective 95% confidence intervals.
Forests 12 00556 g006
Table 1. Some stand-level modifiers used to predict Mid-Rotation Silvicultural Practices (MRSP) responses in growth and yield models reported in the southeastern U.S. Thin = thinning, Fert = fertilization, BA = basal area per hectare, N = trees per hectare, MV = merchantable volume per hectare, V = total stand volume, DH = dominant height, M = multiplicative modifier, A = additive modifier, Z = lasting effect of the treatment in years since treatment, k = fixed maximum lasting time effect, inf = infinite time limit.
MRSPSourceStand AtributeEquationType of ModifierBase-Line Yield ModelDuration EffectEstimation Procedure
Base-Line and Modifier
Thin[12]BAEquation (A29)MCounterpart stand0 < Z < infIndependently
Thin[13]BAEquation (A30)ANon-thinned stand0 < Z < infIndependently
ThinNEquation (A31)ANon-thinned stand0 < Z < infIndependently
Thin[15]BAEquation (A32)MNon-thinned stand0 < Z < kSimultaneously
ThinNEquation (A33)MNon-thinned stand0 < Z < kSimultaneously
Fert[16]MVEquation (A34)MNon-thinned stand0 < Z < infIndependently
Fert[15]BAEquation (A35)MNon-thinned stand0 < Z < infSimultaneously
Fert[17]VEquation (A36)MNon-thinned stand0 < Z < infindependently
Fert[18]DHEquation (63)ANon-thinned stand0 < Z < kindependently
Fert[18]BAEquation (64)ANon-thinned stand0 < Z < kindependently
Table 2. Treatments description for the MRT study.
Treatment NumberThinningSilvicultural Treatment
1—ControlNoNone
2—ThinYesNone
3—FertYesFertilize (224.2 kg N ha−1 + 28 kg P ha−1)
4—CVCYesPrescribed for each location as conditions warrant and
with follow-up to obtain excellent operational efficacy
5—Fert + CVCYesFert + CVC
Table 3. Number of plots and range values of the MRT at establishment. Age in years, dominant height (DH) in m, stand density (N) in trees ha−1, and basal area (BA) in m2 ha−1.
First-Thinning Second-Thinning
RegionNo. PlotsAgeDHNBANo. PlotsAgeDHNBA
LC6011–1714.6–21.21013–173510.8–44.75516–2517.6–25.6430–71711.4–33.7
PI2014–1512.9–21.11310–162611.1–44.61021–2719.6–23.1534–57815.6–33.2
UC4512–1713.8–19.6919–16709.9–45.55516–3217.3–31.3247–77610.7–36.9
Table 4. Parameters estimates for Equations (4), (7), and (16). Boot SE = Bootstrap estimate standard error, Lower Limit, Upper Limit = lower and upper bound for an approximate 95% confidence interval.
ParameterEstimateBoot SELower LimitUpper LimitParameterEstimateBoot SELower LimitUpper Limit
a ^ 0 1.78110.09021.60381.9584 d ^ 1 20.76642.964014.941626.5912
a ^ 1 −2.742 × 10−52.954 × 10−7−2.799 × 10⁻⁵−2.683 × 10⁻⁵ d ^ 2 25.47543.752418.101232.8496
a ^ 2 −0.85260.2716−1.3863−0.3189 d ^ 3 14.16191.406611.397716.9261
a ^ 3 0.22840.07540.08010.3766 b ^ 2 0.16020.1014−0.03910.3594
a ^ 4 0.02500.00660.01190.0380 b ^ 30 −0.31370.0577−0.4271−0.2002
a ^ 5 0.01500.00470.00580.0243 b ^ 31 −0.03520.0081−0.0510−0.0194
a ^ 6 0.16180.1033−0.04120.3648 b ^ 32 −0.02750.0099−0.0469−0.0081
a ^ 7 −0.09360.0130−0.1192−0.0680 γ ^ 1 −4.24400.1455−4.5298−3.9581
K ^ 0.04390.00430.03550.0524 γ ^ 2 −0.67480.0596−0.7920−0.5576
n ^ 1 11.59351.81508.026715.1604 γ ^ 3 0.50510.05040.40610.6041
n ^ 2 4.09361.31531.50886.6783 γ ^ 4 4.86980.45653.97285.7668
n ^ 30 3.63100.53432.58094.6811 γ ^ 5 0.32260.02840.26670.3784
n ^ 31 −0.01980.0031−0.0258−0.0138 γ ^ 6 8.01780.85146.34479.6910
b ^ 01 0.14930.06900.01380.2849 γ ^ 7 0.27320.02900.21620.3302
b ^ 02 0.03700.01230.01280.0612 γ ^ 8 0.09500.01010.07520.1148
b ^ 03 0.03980.01930.00200.0777 γ ^ 9 0.02330.00190.01960.0270
b ^ 04 11.46253.99693.608019.3171 ϕ ^ D H _ N −0.15280.0148−0.1820−1.1236
c ^ 1 0.05560.01190.03220.0790 ϕ ^ D H _ B A 0.26740.02240.22340.3114
c ^ 2 2.379 × 10−81.096 × 10−142.379 × 10−82.379 × 10−8 ϕ ^ N _ B A 0.21720.02110.17560.2587
c ^ 3 0.10470.02520.05510.1542
Table 5. Cross-validation variance explained Equation (24), prediction residual mean Equation (25), and prediction root mean square distance (RMSD) Equation (26) for each of the three response variables: dominant height (DH), stand density (N), and basal area (BA). n = number of plot-observation predicted out-sample.
ResponseGroup/TreatmentnVariance Explained (%)Residual MeanRMSD
DH (m)LC33596.3−0.06460.649
PI10598.00.1170.519
UC39395.5−0.06450.787
Non-Thin16096.6−0.02890.673
Thin16296.1−0.1620.679
Fert16995.9−0.04210.751
CVC16996.1−0.05780.729
Fert+CVC17396.40.07590.682
All83396.2−0.04160.704
N (trees ha−1)LC33599.5−2.0723.4
PI10599.74.7319.9
UC39399.8−1.0514.0
Non-Thin16099.1−1.2537.9
Thin16299.8−0.5667.67
Fert16999.4−0.86612.1
CVC16999.60.3409.61
Fert+CVC17399.5−1.3211.4
All83399.7−0.73019.1
BA (m2 ha−1)LC33598.4−0.01961.01
PI10598.90.04830.907
UC39398.6−0.1551.06
Non-Thin16096.1−0.1401.32
Thin16296.9−0.03860.911
Fert16997.0−0.1010.955
CVC16997.2−0.04040.924
Fert + CVC17397.1−0.05820.975
All83398.6−0.07511.03
Publisher’s Note: MDPI stays neutral with regard to jurisdictional claims in published maps and institutional affiliations.