Article

Integrated Analysis of Fatty Acid Metabolism and Transcriptome Involved in Olive Fruit Development to Improve Oil Composition

1
School of Ecology and Environment, Ningxia University, Yinchuan 750021, China
2
State Key Laboratory of Tree Genetics and Breeding, Research Institute of Forestry, Chinese Academy of Forestry, Beijing 100091, China
3
Institute of Forestry and Pomology, Beijing Academy of Agriculture and Forestry Sciences, Beijing 100093, China
*
Author to whom correspondence should be addressed.
These authors contributed equally to this work.
Forests 2021, 12(12), 1773; https://doi.org/10.3390/f12121773
Submission received: 20 November 2021 / Revised: 10 December 2021 / Accepted: 10 December 2021 / Published: 14 December 2021
(This article belongs to the Special Issue Functional Genomics of Forest Trees)

Abstract

:
Olea europaea L. is an important oil crop with excellent nutritional properties. In this study, a full-length transcriptome combined with fatty acid composition was used to investigate the molecular mechanism of fatty acid (FA) metabolism of olive fruits at various stages of development (S1–S5). A total of 34 fatty acids (FAs) were measured using gas chromatography-mass spectrometry (GC-MS). All transcripts of FA metabolism during olive fruit development were studied, including glycolysis, fatty acid synthesis, triacylglycerol synthesis, and FA degradation. A total of 100 transcripts of 11 gene families, 68 transcripts of 12 gene families, 55 transcripts of 7 gene families, and 28 transcripts of 7 gene families were identified as encoding for enzymes involved in FA metabolism. Furthermore, one of the critical reactions in TAG metabolism is the activation of fatty acyl chains to fatty acyl CoA, which is catalyzed by long-chain acyl CoA synthetases (LACS). Phylogenetic analysis showed that 13 putative LACS-encoding genes clustered into five groups, of which two putative transcripts encoding LACS6/7 may participate in FA degradation. The aim of this study was to evaluate the fatty acid from synthesis to degradation pathways during olive fruit development to provide a better understanding of the molecular mechanism of FA metabolism during olive fruit maturation and provide information to improve the synthesis of oil components that are beneficial to human health.

1. Introduction

Olea europaea L. belongs to the Oleaceae family and is one of the most economically important and widely distributed trees [1,2]. Olive mesocarp possesses high oil content, a natural and edible vegetable oil that is directly cold pressed from fresh olive fruit. Due to its excellent natural health benefits, it is widely used in food preparation [3,4]. Olive fruit is also rich in secondary metabolites, such as fat-soluble vitamins, antioxidants, and other natural nutrients necessary to the human body [5,6].
Previous studies have typically focused on the oil content of olive fruits and the FA content of the oil [7,8,9]. TAG, the main component of oil, is esterified with different fatty acids, which can be divided into saturated fatty acids (SFAs) and unsaturated fatty acids (UFAs). UFAs, such as oleic acid, linoleic acid, and linolenic acid, are more beneficial for human health than SFAs [10]. In plants, concerning the pathway of FA and TAG biosynthesis, it is basically understood that the long-chain fatty acids originate from a carbon source and are catalyzed by various enzymes, such as fatty acid synthase, elongase, and desaturase [11,12,13]. TAGs are in a dynamic balance, which is accompanied by synthesis and degradation. Previous studies in other species have confirmed that the oil content of the fruit or seeds first peaks and then decreases slightly in the later stages of maturity [14]. Meanwhile, current research has been focused on the cloning and characterization of genes involved in the fatty acid biosynthetic pathway in olives [4,15,16]. There is limited information on the regulatory mechanism for FA and TAG synthesis and degradation during fruit development. Therefore, study of the molecular mechanism of TAG and FA reduction during the mature period is important for improving the oil content of olive fruits. As an important pathway for FA degradation, β-oxidation converts FA to acetyl-CoA and then into 4-carbon compounds through the glyoxylic cycle in the peroxisomes, which requires a variety of enzymes, such as long-chain acyl-CoA synthetase (LACS), acyl-CoA oxidase (ACX), multifunctional protein (MFP/AIM), and 3-ketoacyl-CoA thiolase (KAT) [17].
As the transcriptome has spatiotemporal specificity, studying the transcriptome during olive fruit development provides a basis for further revealing the molecular mechanisms of FA metabolism. The third-generation sequencing platform is a rapidly emerging technology. Compared with Illumina sequencing, this technology can provide more advantages, including long read lengths and high consensus accuracy [18]. This strategy was previously used to analyze polyphenol biosynthesis in olive fruits and obtained many additional results compared to the Illumina sequencing analysis [18], confirming that full-length transcriptome sequencing combined with metabolome analysis is reliable and rigorous.
In this study, a PacBio full-length transcriptome, Illumina RNA-seq transcriptome, and fatty acid composition from olive fruits at different developing stages were used to comprehensively analyze the metabolic pathways of FA synthesis and degradation. These findings may provide new strategies for improving olive oil content and quality.

2. Materials and Methods

2.1. Plant Materials

The olive fruits were collected from 15-year-old olive trees (O. europaea L. cv. Leccino) planted in the orchard of the Academy of Forestry in Gansu, China. Fruits were collected at five developmental stages of 50, 80, 110, 140, and 170 days after flowering (DAF), namely S1–S5. The selected fruits were basically at the same level of maturity (similar color, size, and shape). Three replicates of each stage were collected from three trees, quick-frozen in liquid nitrogen, and stored at −80 °C for further study.

2.2. Transcriptome Processing and Bioinformatics Analysis

For Illumina RNA-seq, total RNA from the samples was extracted using RNA Prep Pure Plant kit (Tiangen Biotechnology, Beijing, China.). The libraries were sequenced using Illumina HiSeq™4000, and raw reads were stored in fastaq format. Clean reads were achieved by removing reads with adapters, low-quality reads, and poly-N reads from raw data and used for further analyses. For PacBio Iso-Seq, total RNA from seven tissues, including shoot tips, annual leaves, leaves from the previous year, annual shoots, branches from the previous year, fruits (different development stages), and roots, was combined to obtain full-length transcripts for single-molecule long-read sequencing [18]. The mRNA was reversed into cDNA using SMARTer PCR cDNA Synthesis Kit (Clontech, Mountain View, CA, USA). BluePippin was used for screening the fragments, and the cDNA was further standardized with a Trimmer-2 cDNA Normalization Kit (Evrogen, Moscow, Russia). An Iso-Seq library was constructed and sequenced through SMRT (single-molecule real-time) on the PacBio platform to obtain ploymerase reads [19]. Circular consensus sequence (CCS) generated from subread data was identified according to the Iso-Seq process. We then screened the CCS sequences containing 5′-primer, 3′-primer, and poly-A to obtain FLNC (full-length non-chimera) sequence and used the ICE (isoform-level clustering) to convert the FLNC of the same transcript sequence clustering to obtain consensus sequence and further obtain polished consensus after correction of non-full-length sequence. The polished consensus was corrected through Illumina RNA-seq data using proovread (https://github.com/BioInf-Wuerzburg/proovread, accessed on 10 December 2014) [20]. GMAP software v2017-01-14 (http://research-pub.gene.com/gmap, accessed on 10 December 2005) was used for mapping the final consensus sequence to the Olive genome cultivar Farga.
Finally, the full-length transcript information was used as a reference to analyze the Illumina RNA-seq data. The RSEM software kit with bowtie2 was used for mapping Illumina fastq data to the full-length tanscriptome isoforms and then used to analyze the number of reads of each isoform and to perform FPKM conversion on it to analyze the expression level of isoform [21]. Differential expressed genes (DEGs) of two groups was performed using the DESeq R package [22]. A p value < 0.05 and|log2 (fold change)| > 1 were used as the thresholds for selecting significant differences in gene expression [22,23].

2.3. Targeted Fatty Acid Metabolite Analysis

For determination of total and free FAs, methyl salicylate was used as an internal standard (IS) [24]. The detection procedure of FAs is as follows: 1 mL of chloroform methanol solution and 2 mL of sulfuric acid-methanol solution were added to 50 mg of plant tissue, which was then placed into an 80 °C water bath to methylate for 30 min. One milliliter of n-hexane (Guaranteed reagent, GR) was added for extraction, and 5 mL of pure water was added for washing. The supernatant (500 μL) was obtained, and 25 μL of internal label was added, followed by oscillation. For total FA extraction, a total of 50 mg of fruit sample was collected and ground. Two milliliters of 2% sodium hydroxide methanol solution was added to the sample for 15 min in a water bath at 80 °C to methylate. Five milliliters of 2% sulfuric acid-methanol solution was then added to the sample for esterification in a water bath at 80 °C (for 15 min). Next, 10 mL ultrapure water was added to stop the reaction, and n-hexane (5 mL) was added for the extraction of the organic phase. The supernatant (organic phase) was diluted 20 times. Twenty-five microliters of IS of methyl salicylate was added (500 ppm) and mixed. Gas chromatography-mass spectrometry (GC-MS) was used to analyze the fatty acid contents of the different developmental stages of the olive fruit. These fruit extracts were analyzed using a capillary column (30 × 0.25 mm, 0.25 μm) (Agilent HP-INNOWAX, Agilent Technologies, Santa Clara, CA, USA).

2.4. Statistical Analyses

All samples for GC-MS were analyzed in triplicate with SPSS software. Analysis of significance was performed using Tukey’s multiple comparisons tests at p < 0.05.

3. Results and Discussion

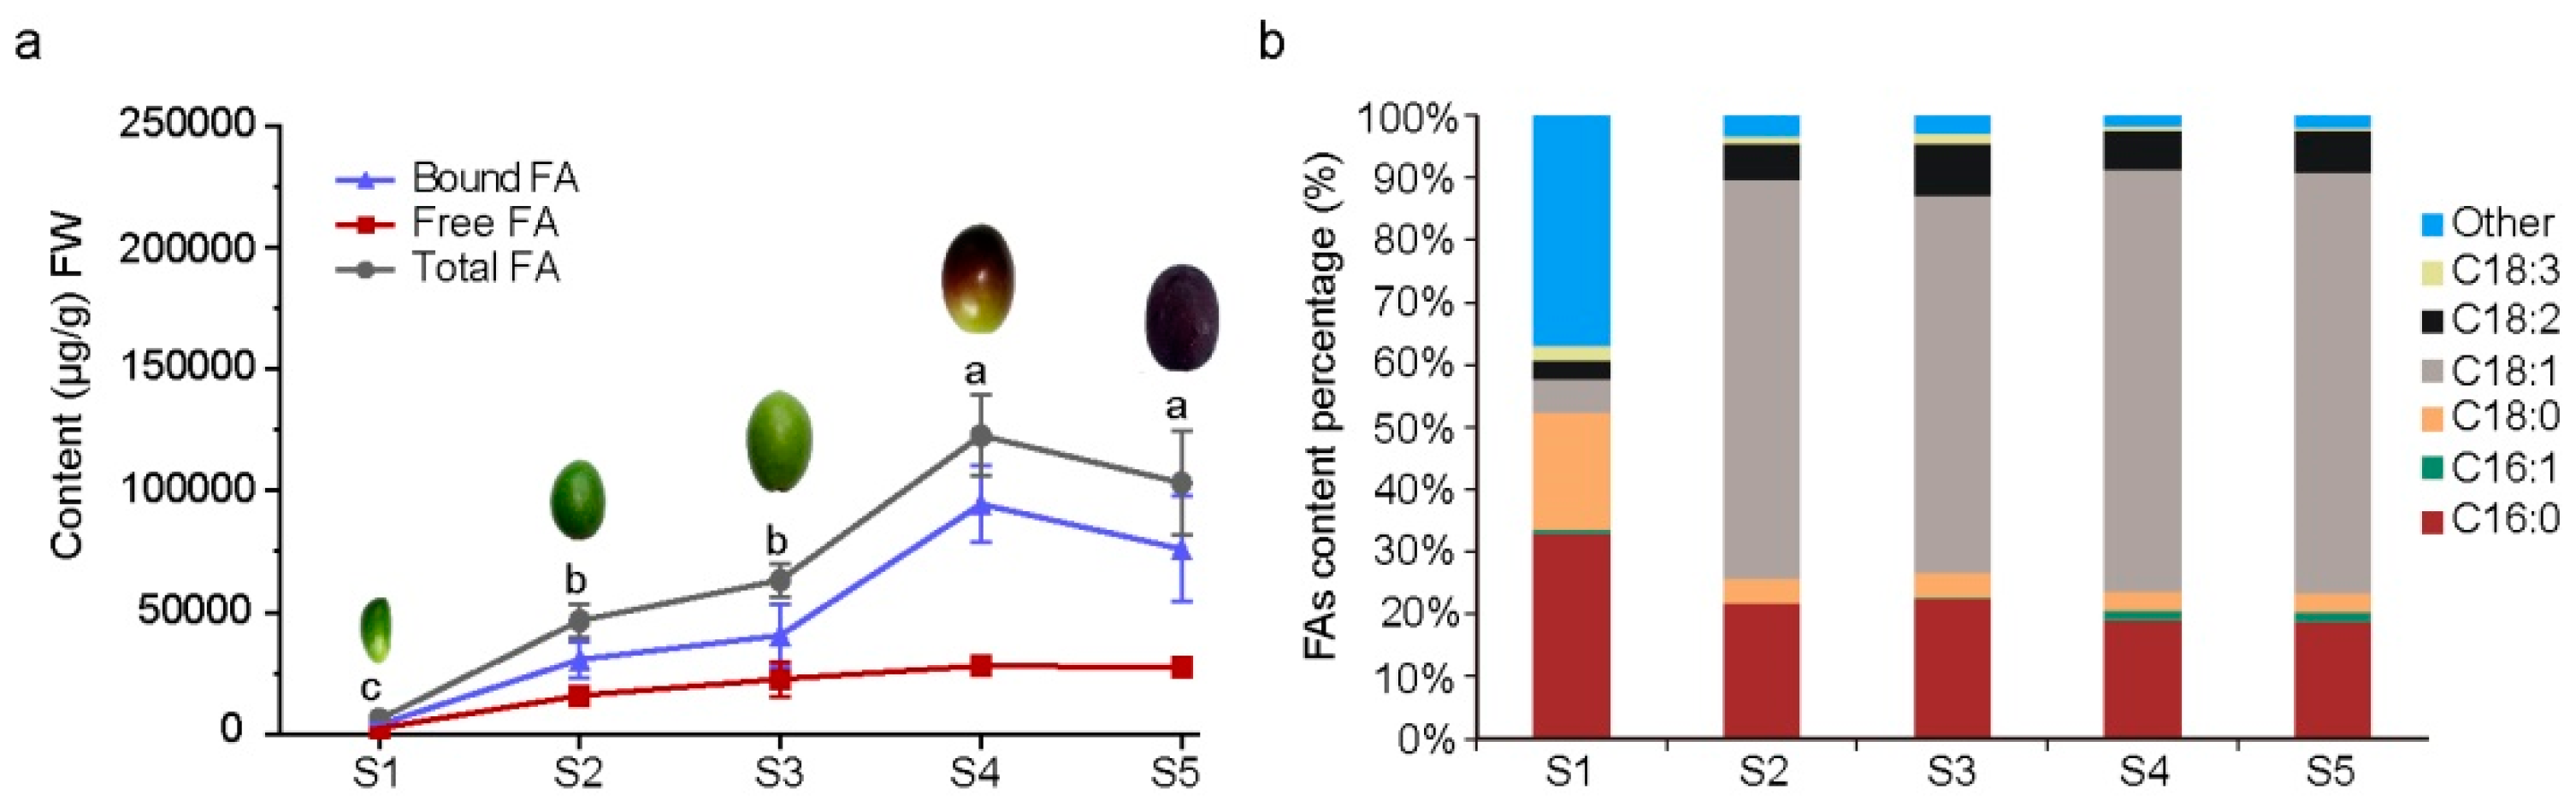
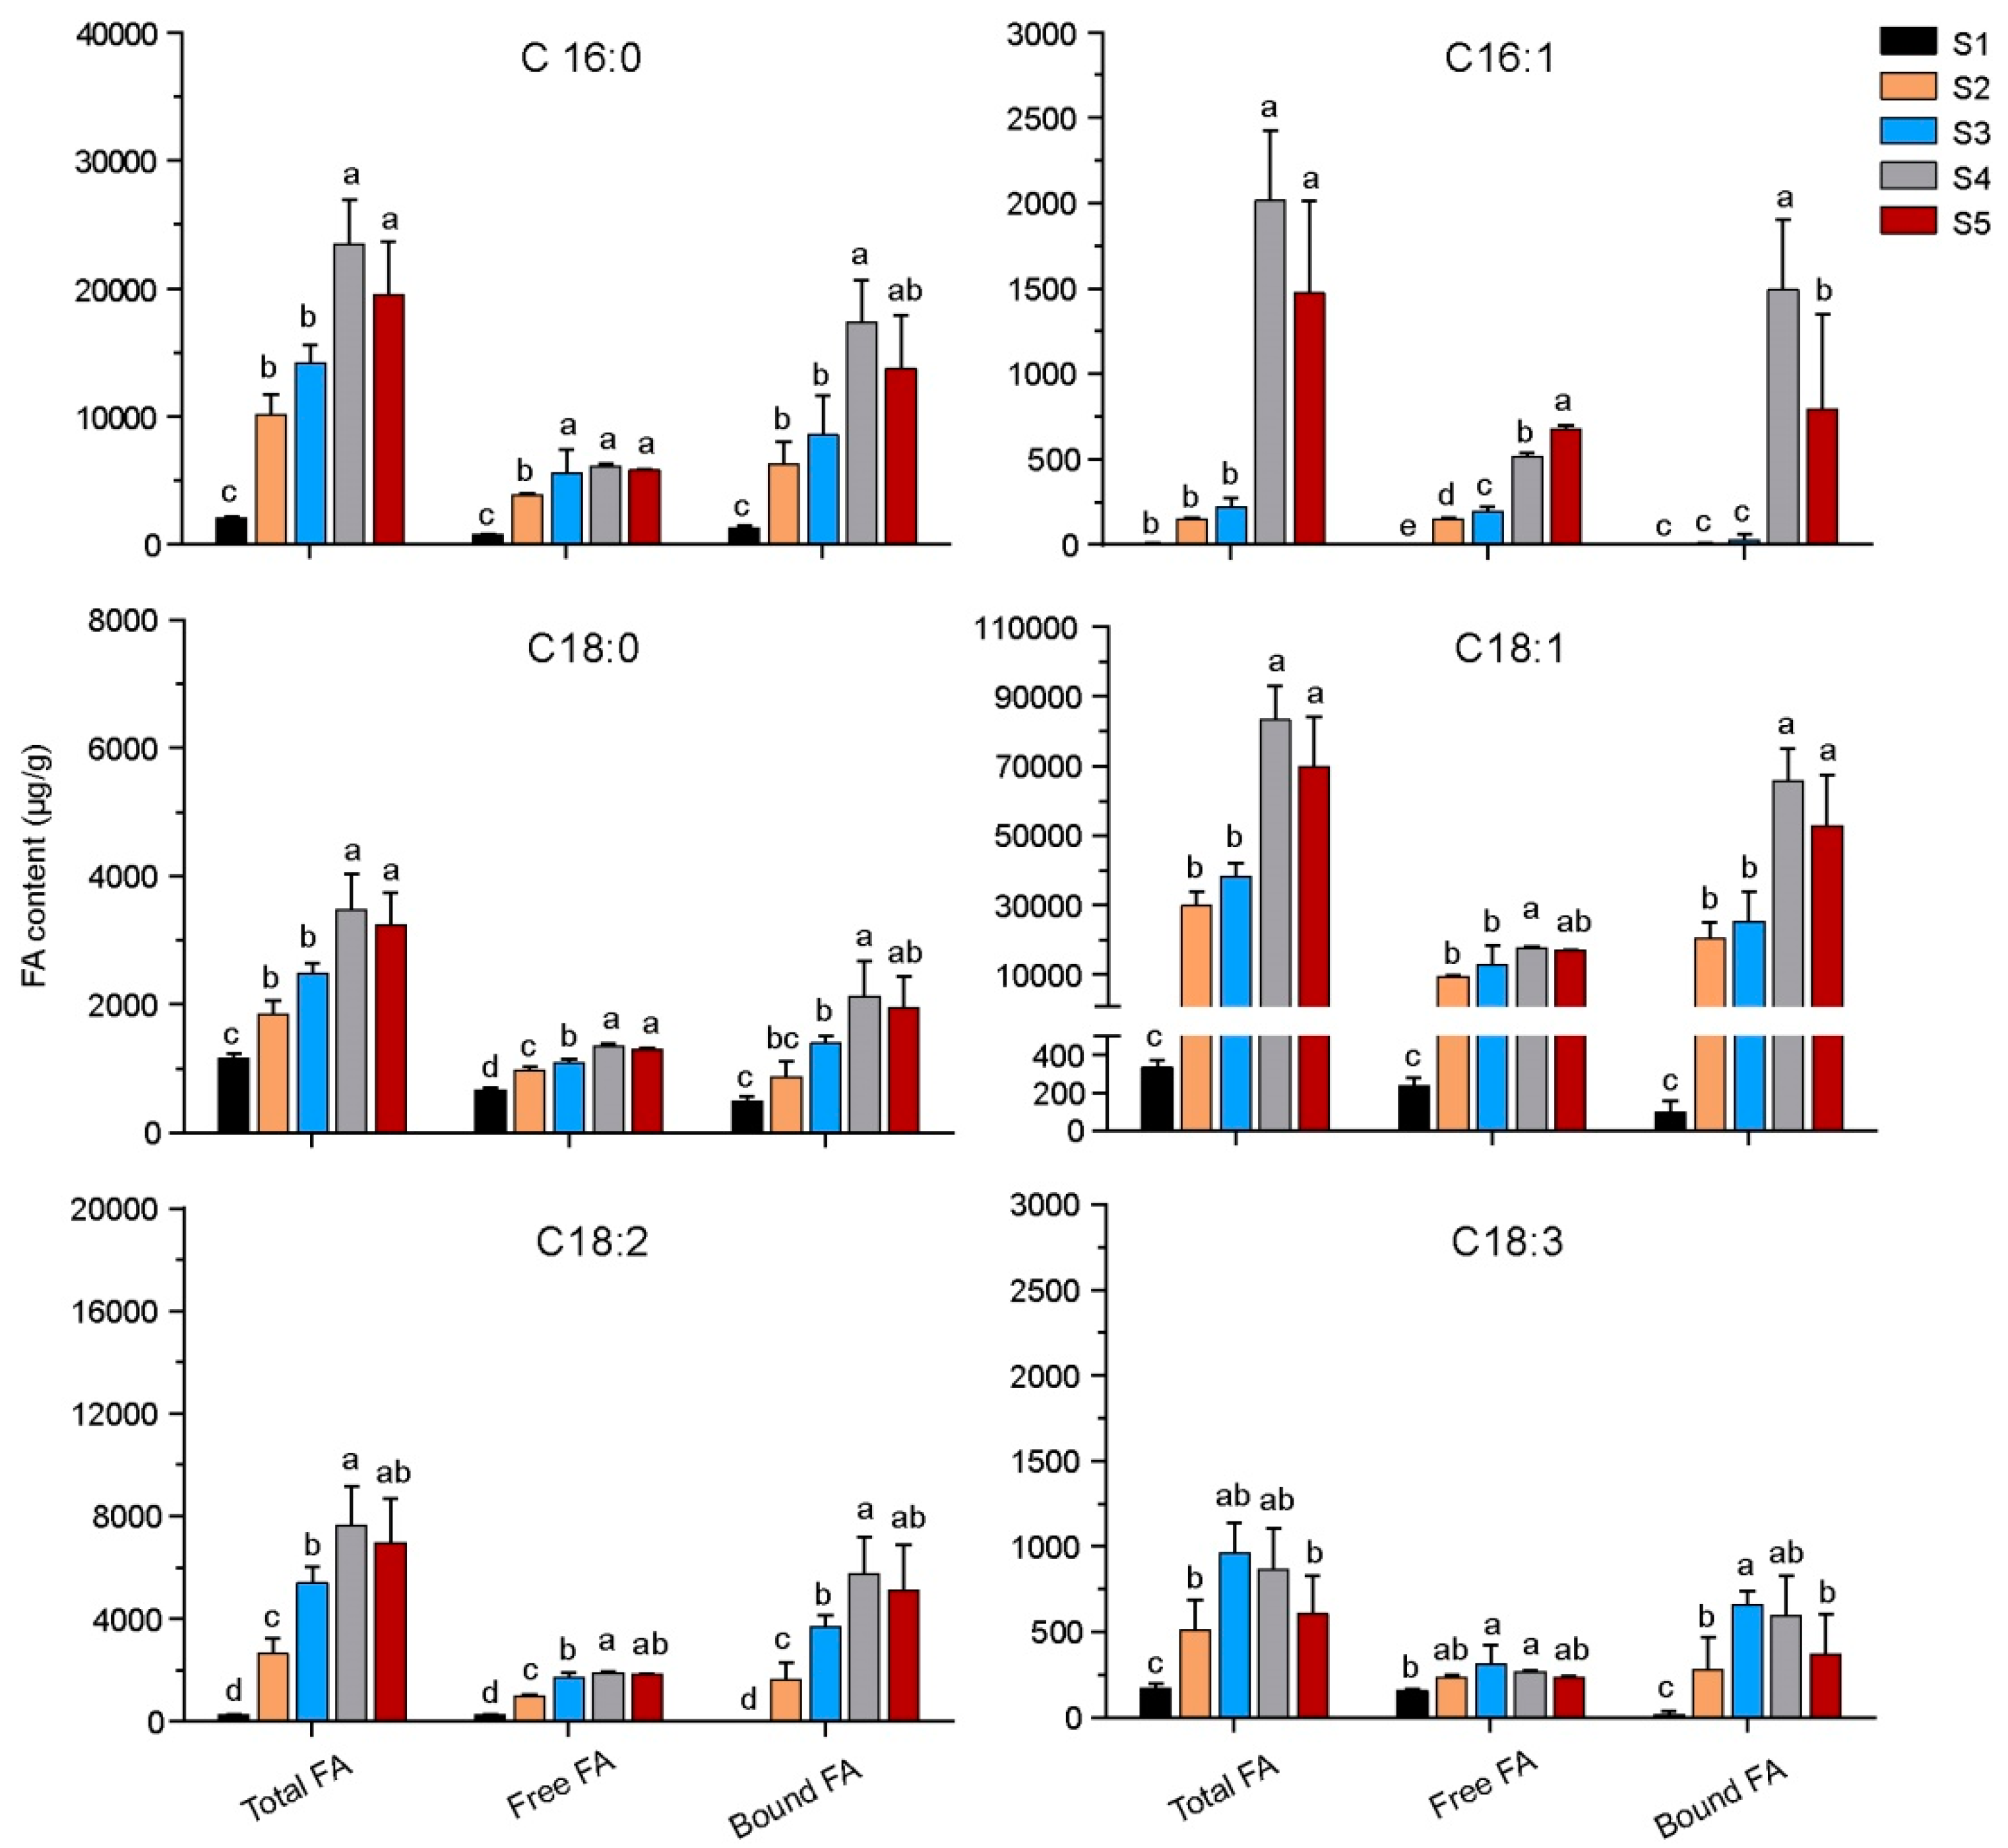
3.1. Fatty Acids Content of Olive Pulp during Maturation

With reference to the fruit-ripening process, the fruits were labelled according to five developmental stages (S1–S5) and were harvested at 50, 80, 110, 140, and 170 DAF from three different trees in 2016. The FA contents of the olive pulp from S1 to S5 were first investigated using a targeted global metabolomics platform with a GC-MS-based analysis. A total of 34 FA standards were collected. To test the repeatability and reliability of the FA content data during olive fruit ripening, correlation and principal component analysis were performed (Figure S1). The results showed that the correlation between biological repetitions was high, indicating that the experimental data were reliable.
Fatty acids existing in combined and free states were tested separately. The free FAs were synthesized at S1–S2, and the content remained basically at a continuous level throughout the fruit-ripening process (Figure 1a). In contrast, the total FA content increased significantly from development stage S2 and reached a maximum of about 130,000 μg/g at stage S4, and then decreased slightly at S5, which indicates that the large amounts of FAs generated in the olive fruits were mainly used for oil synthesis during the five developmental stages (Figure 1a). Six dominant components, namely palmitic acid (C16:0), hexadecenoic acid (C16:1), stearic acid (C18:0), oleic acid (C18:1), linoleic acid (C18:2), and linolenic acid (C18:3), together, possessed over 60% of the total FA content at stage S1, and this value rapidly increased to 95% in the S2 stage and continued to other development stages (S3–S5). The content of oleic acid was significantly higher than that of the other five FAs (Figure 1b). During the development of the olive fruit, these six major fatty acids are involved in the synthesis of oil. The higher the FA content, the higher the oil biosynthesis. Among them, oleic acid had the highest content, which increased significantly at S2 and peaked at S4. Although the content of hexadecenoic acid continued to increase in the S1–S4 stages (Figure 2), its proportion in the total FA continued to decrease (Figure 1b), indicating that only a small portion of C16:0 converted into C16:1; a large amount of them were basically converted into C18:0 and then generated C18:1, especially in the S4 stage.

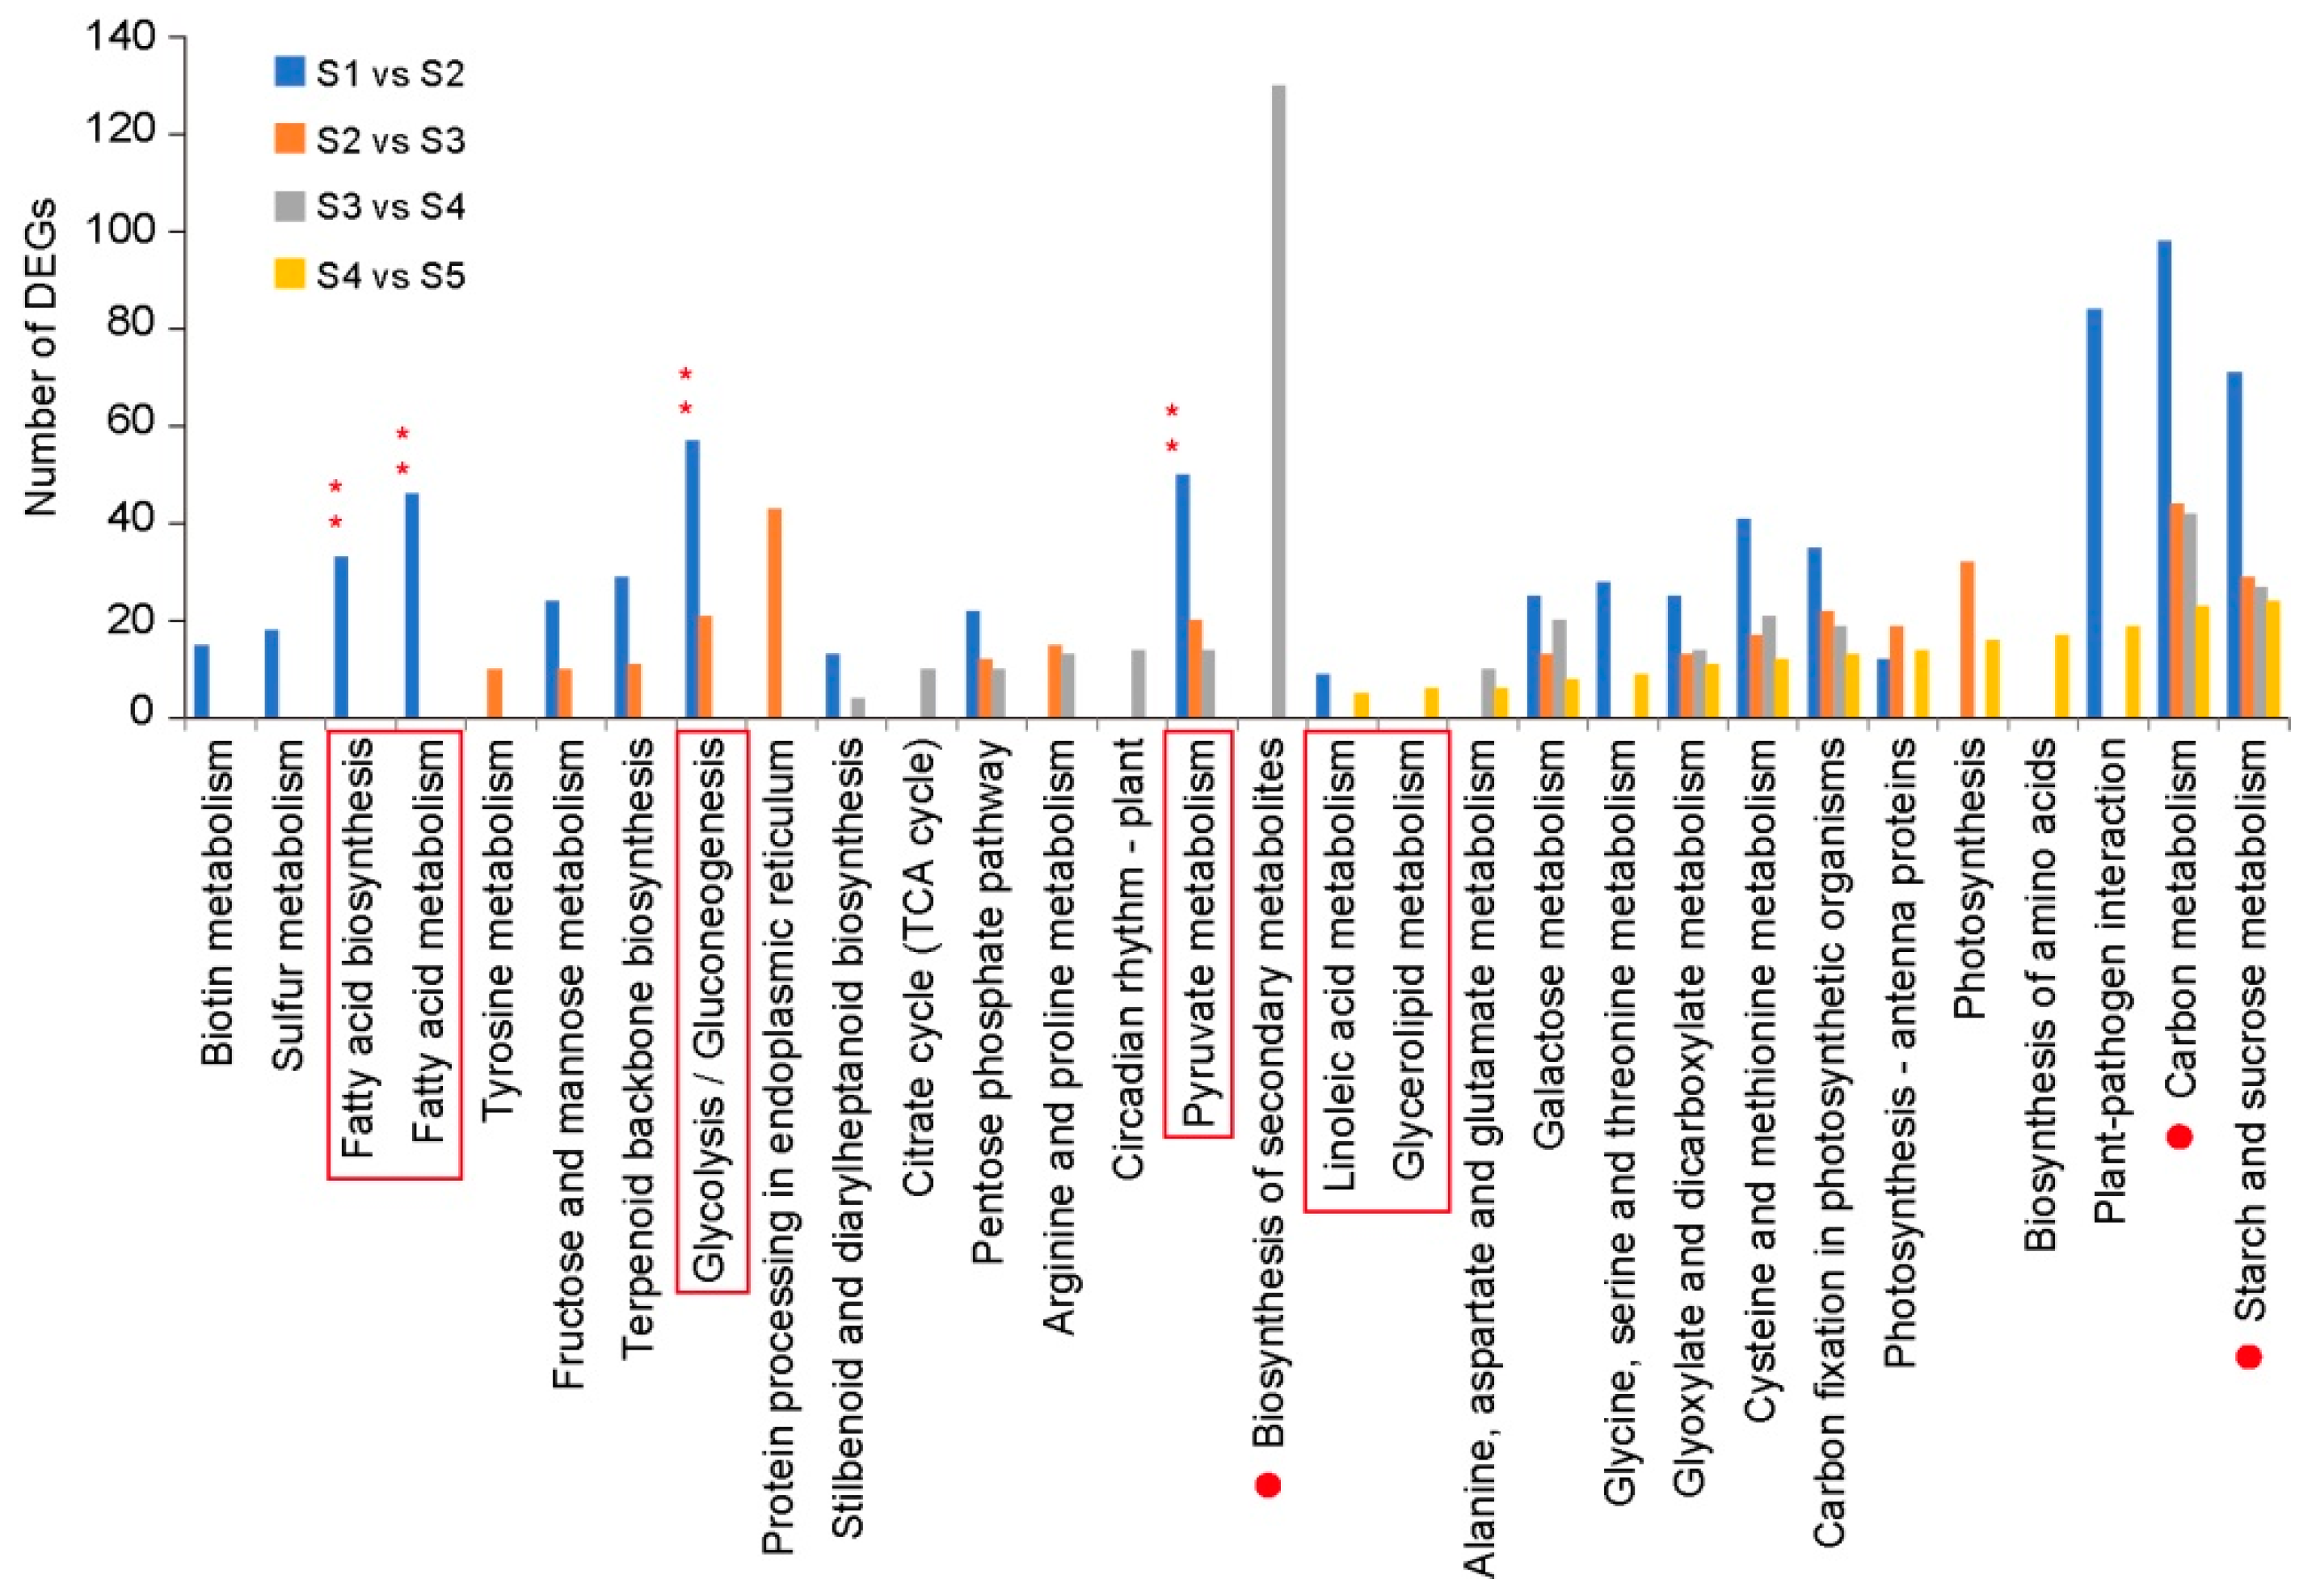
3.2. Transcriptome Data Analysis

All of the 186,150 error-corrected consensus reads were compared and mapped with the draft genome of olive using GMAP. In total, 175,700 (94.39%) reads were mapped to the olive genome, among which 46.26% and 46.29% were mapped to the sense and antisense, respectively (Table 1, Figure S2a). The 175,700 mapped reads were divided into three groups. The first group includes reads that are the same in the reference genome and consisted of 29.38% of total mapped reads. The second group contained 63.53% of total mapped reads that were novel isoforms from known genes in the reference genome. The third group included novel isoforms from novel genes in the reference genome and contained 7.08% of total mapped reads (Figure S2b). After genome mapping, the 175,700 reads were next classified into 62,260 unique transcripts, which were then mapped to 22,348 genes, and 2933 new genes were also identified. We identified 3179 transcription factors (TFs) from 64 families and 1366 transcription regulation factors (TRs) from 23 families (Figure S2c). Furthermore, the full-length transcriptome was used as a reference for analyzing Illumina RNA-seq data, then obtaining DEGs for further analysis (Table 2).
To analyze the pathways of DEGs, enriched KEGG pathway analysis was performed from the total DEGs (S1 vs. S2, S2 vs. S3, S3 vs. S4, S4 vs. S5) (Figure 3). The DEGs related to secondary metabolism and carbohydrate metabolism were in large quantities and participated in fruit ripening, such as biosynthesis of secondary metabolites, carbon metabolism, and starch and sucrose metabolism (red dots). The most of FA biosynthesis- and metabolism-related DEGs and DEGs of pyruvate metabolism and glycolysis were mainly present in S1 vs. S2 (red asterisk), indicating that fatty acids begin to largely accumulate in the S1–S2.

3.3. Identification and Characterization of Genes Involved in Glycolysis at Five Developmental Stages

In most plants, carbon is delivered to FA synthesis via glycolysis, which may provide sufficient precursors and energy for TAG synthesis. Pyruvate, the final product of glycolysis, is the substrate for fatty acid chain synthesis. Many enzymes are involved in this pathway, such as HXK (hexokinase), GPI (glucose-6-phosphate isomerase), PFK (phosphofructokinase), FBA (fructose 1,6 bisphosphate aldolase), GAPDH (glyceraldehyde phosphate dehydrogenase), PGK (phosphoglycerate kinase), GPMA (2,3-bisphosphoglycerate phosphoglyceromutase), ENO (enolase), and PK (phosphoenolpyruvate kinase), most of which were identified from the olive fruit transcriptome in this study. The results show that 118 transcripts were identified as involved in glycolysis, of which 100 transcripts of nine gene families were involved and 18 were not detected (Figure 4a). Among this, we identified 42 transcripts that were differentially expressed in the glycolysis pathway during olive fruit development, including two PGM, three HXK, two GPI, four PFK, five FBA, 10 GAPDH, three GPMA, three ENO, one PPDK, and 10 PK. Almost all of these DEGs were upregulated in the early developmental stage, indicating that pyruvate is highly synthesized during the early stage of olive fruit maturation (Figure 4b). Among them, 17 DEGs were encoding rate-limiting enzymes, such as HXK, PFK, and PK (Figure 4b, asterisk). Compared with the expression level at S1, the expression of three transcripts of PFK and eight transcripts of PK was highly up regulated at other developmental stages, which is beneficial for pyruvate formation. Notably, the transcripts of HXK exhibited different FPKM values in stages S1–S2, suggesting that the transcripts of the same family have different functions (Figure 4b). The above results were consistent with a previous study, which showed that the products of glycolysis eventually participate in the synthesis of FAs in Brassica napus [25], suggesting that pyruvate may be synthesized in large amounts to provide a precursor for FA biosynthesis during olive fruit maturation.

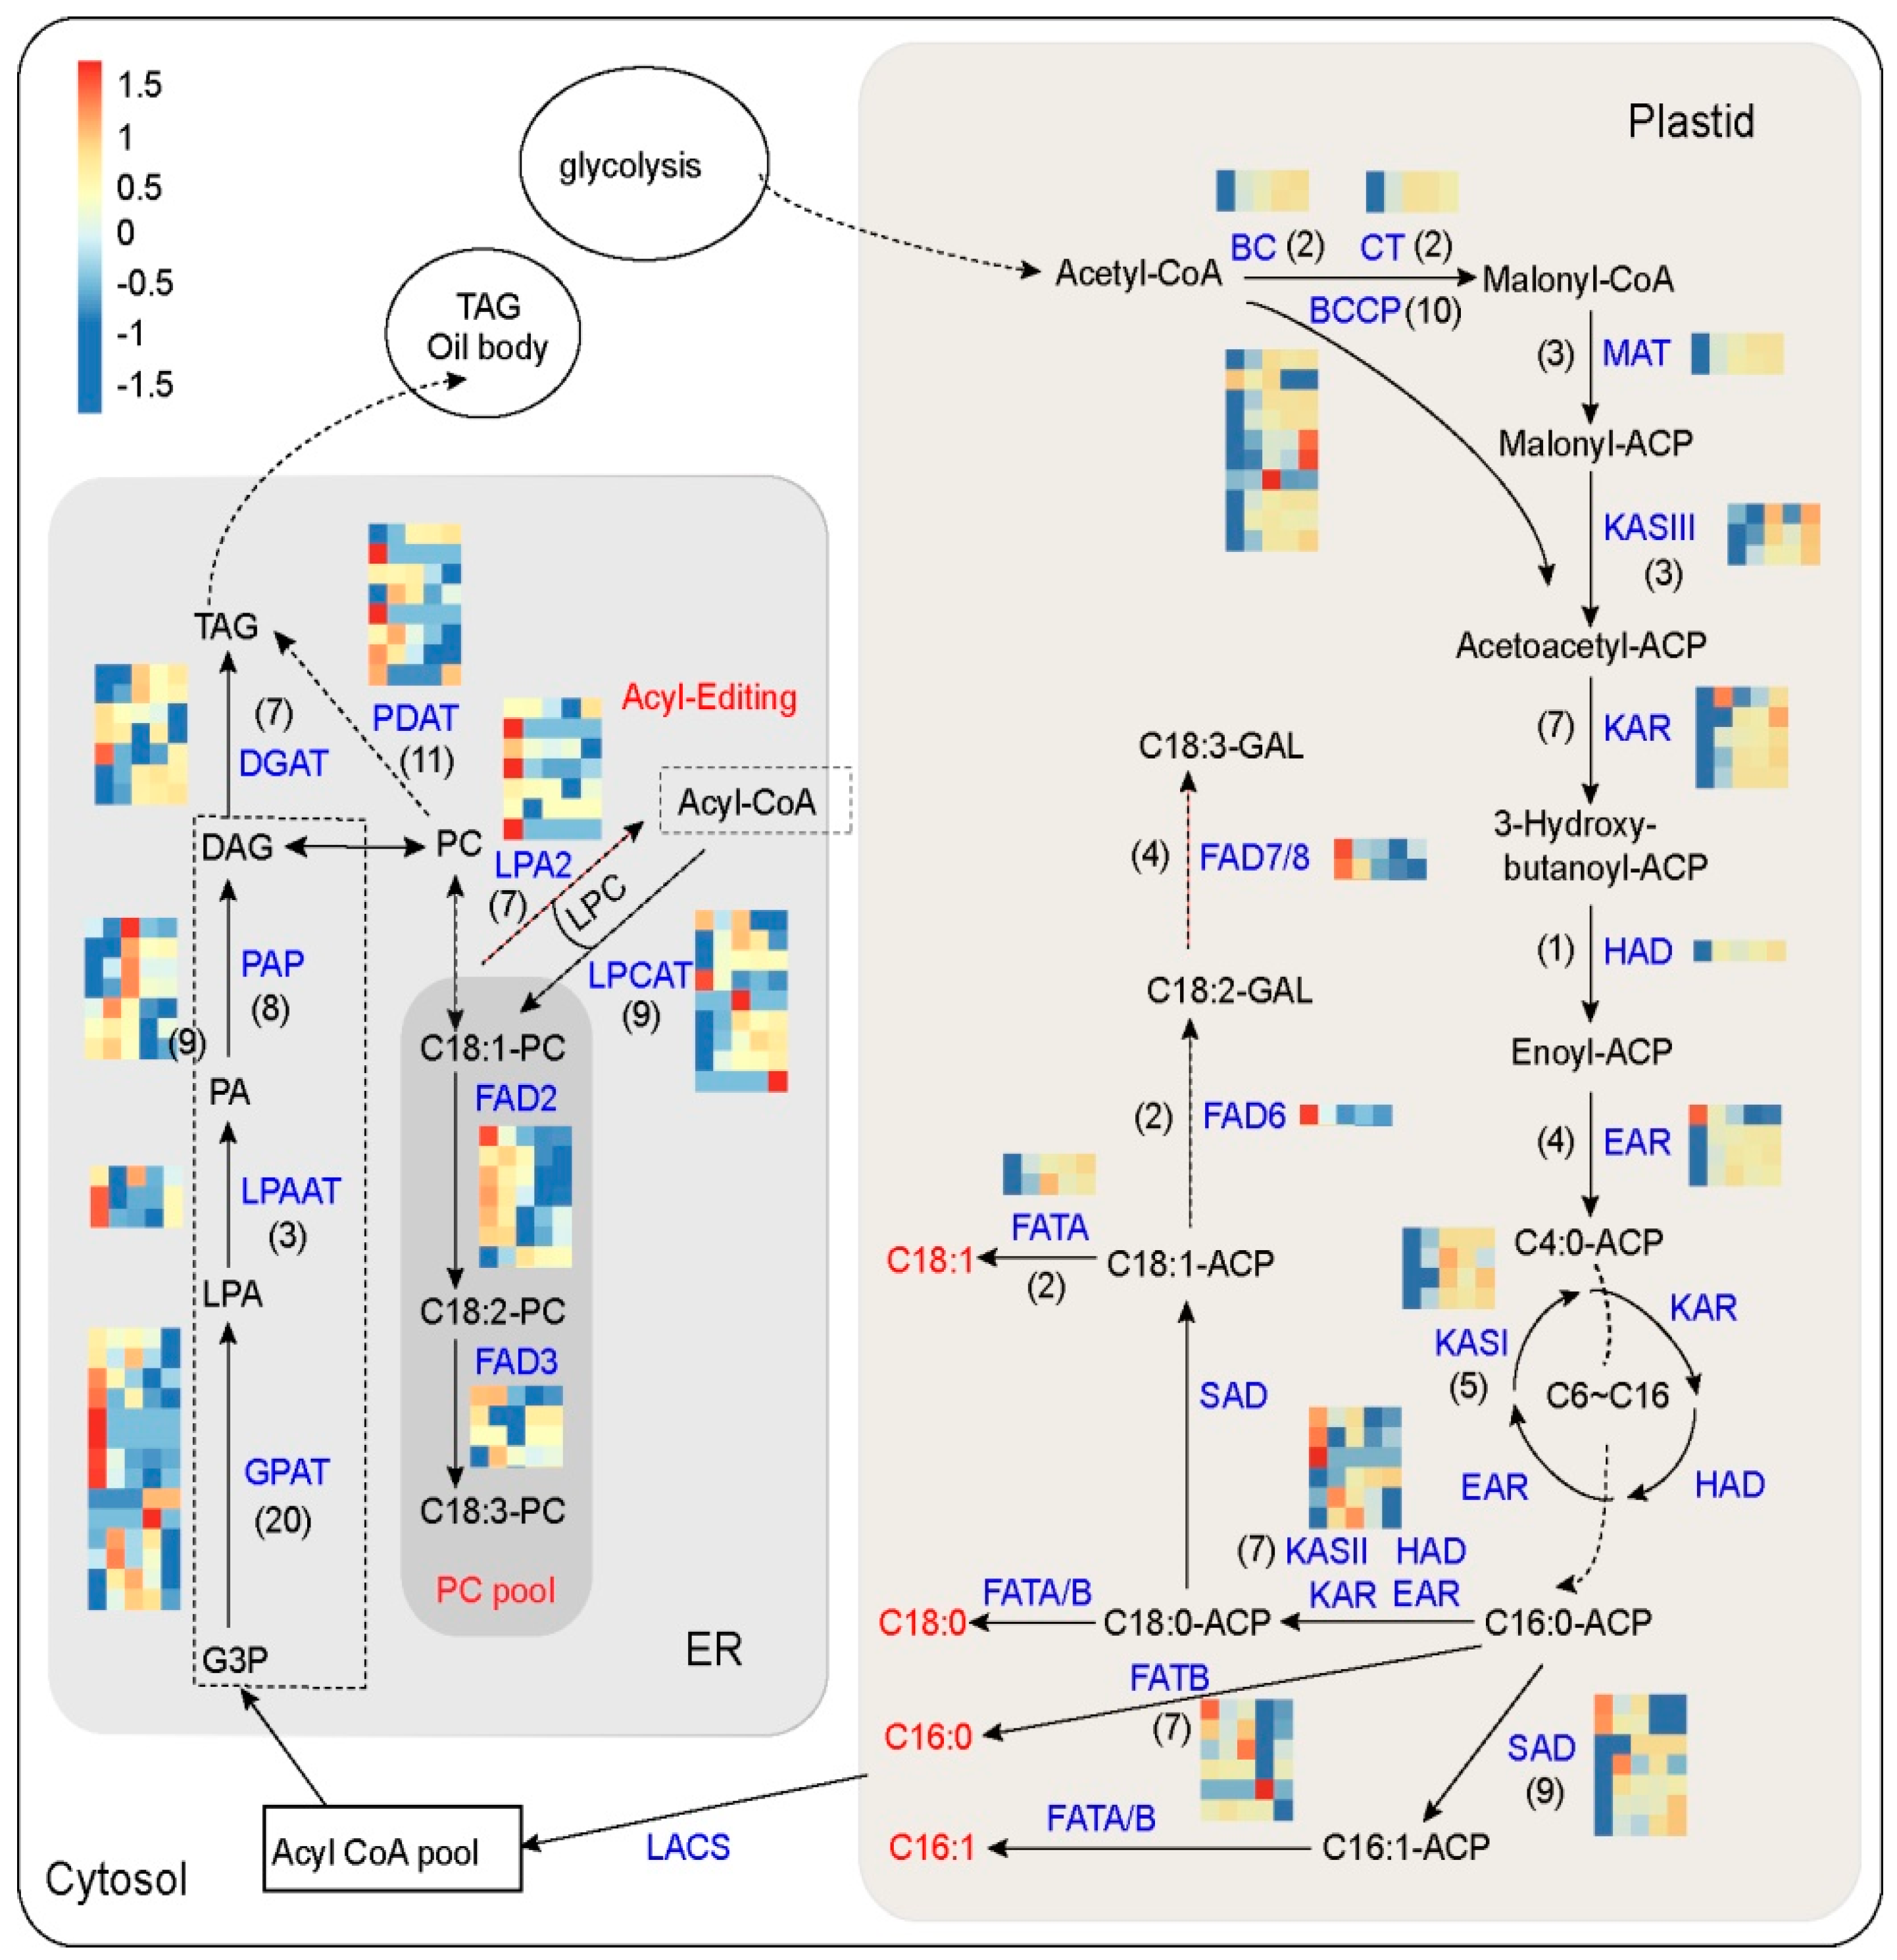
3.4. Identification of Genes Involved in FA and TAG Metabolism at Five Developmental Stages

The oil composition in olive fruit is an important index for evaluating the quality of olive oil, which is largely dependent on fatty acids [26]. The biosynthesis of TAGs begins with FA synthesis. A total of 68 transcripts were identified in FA synthesis, and most of the detected genes were upregulated in S2, compared with S1. Among the 31 DEGs in FA synthesis, only six genes were downregulated (one KASII gene, two FATB genes, two FAD2 genes, one FAD7 gene). In FA synthesis, ACCase contains three subunits of BC, α-CT, and BCCP and catalyzes the formation of malonyl-CoA from acetyl-CoA in the plastids. This step is a key control point for the conversion of carbon into fatty acids [27]. A previous study reported that the expression of BCCP2 in developing seeds is reduced by about 38%, which ultimately leads to a reduction in the fatty acid content of the mature seeds by about 9% [28]. This is consistent with the study finding that ACCase, including two CT transcripts, three BCCP transcripts, and two BC transcripts, were highly expressed during FA accumulation (Figure 5, Table 3), indicating that the synthesis of FAs was induced in the olive-developing stage. Fatty acid synthase (FAS) is essentially a multienzyme complex that is composed of KAS, KAR, HAD, EAR, and others [29]. With the catalysis of these enzymes, acetyl-CoA and malonyl-CoA undergo seven cycles to produce hexadecanoic acid (C16:0) or hexadecenoic acid (C16:1). Previous studies reported that loss of KASI resulted in significant changes in FA content in Arabidopsis [30]. Overexpression of KASII reduces the C16:0 content in seed oil and increases the C18:0 content [31]. In this study, these genes were highly upregulated in the S2 stage, which provides a reasonable explanation for FA accumulation in stage S2 (Figure 5, Table S1).
Desaturation is the key step that is hydrolyzed from ACP by the action of thioesterase to form UFAs [12]. All of the 9 annotated SADs and 22 FADs were identified, and 7 transcripts and 18 transcripts were detected in this study, respetively. The transcripts encoding FADs and SADs were named through phylogenetic analysis (Figure S3). Among them, three SADs did not differ from S1 to S5 (OE6A108617, OE6A033129, OE6A012975). The other four SADs were highly expressed in the S2 stage and continued to be expressed until stage S5, including OE6A089828, OE6A118450, OE6A048475, and OE6A020845 (Figure 5). The transcript OE6A020845 was especially highly expressed, reaching an FPKM exceeding 1000 in the S4 stage. The transcript OE6A098403, encoding FAD2, exhibited higher expressions than other FADs. OE6A075849, encoding FAD7, gradually decreased during fruit ripening. This is similar to a previous study, which found that FAD2-2 is the main gene involved in the linoleic acid content of olive oil, and FAD7 contributes mostly to the linolenic acid present in the mesocarp [16,32], indicating that the two transcripts may play important roles in the accumulation of polyunsaturated fatty acids in olive fruit development (Figure 5). In the research, four SADs (OE6A089828, OE6A118450, OE6A048475, and OE6A020845) were highly expressed in the S2 stage and continued to be expressed until stage S5, indicating that these four transcripts are essential for FA synthesis. The transcript OE6A020845 was especially highly expressed, reaching an FPKM exceeding 1000 in the S4 stage. The two different thioesterases encoded by FATA and FATB catalyze the hydrolysis of the FA carbon chain from ACP [33]. A previous study showed that FATA in Arabidopsis had the highest catalytic efficiency (Kcat/km) for C18:1-ACP. FATB has the highest activity on C16:0-ACP [34]. The content of C16:0 in fatb mutants decreased by 42%, 56%, 48% and 56% in the leaves, flowers, roots, and seeds, respectively, indicating that FATB is an important determinant of FA synthesis [35]. In the study, two transcripts of OE6A018491 and OE6A059595 encoding FATA were upregulated, and two transcripts of OE6A080663 and OE6A029754 encoding FATB were downregulated. Furthermore, the relative expression ratio of SAD to FATB indicated the degree of unsaturation of FA. We compared the ratios of the four SADs to those of two FATBs from the DEGs. The ratio of SAD1/FATB1 was very low in the five stages, while the other three groups were slightly reduced in stage S3 and reached the maximum at S4. The ratio of SAD2-3/FATB1 was increased by approximately 100 times. This suggests that SAD2-3 and FATB1 play important roles in the accumulation of UFAs during olive fruit development (Figure S4a,b). The result of the high regulation of FATA and downregulation of FATB is in accordance with the high percentage of C18:1 in total FAs (Figure 5).
Following FA synthesis, TAGs can be synthesized in plants through two different pathways, which are catalyzed by PDAT and DGAT, respectively (Figure 5). Multiple enzymes play important roles in TAG synthesis, including GPAT, LPAAT, PAP, DGAT, and PDAT [36,37]. 49 transcripts were identified from olive genomes involved in TAG synthesis, among which 14 transcripts encoding GPAT and 7 transcripts encoding PAP were detected in the transcriptome. However, their expression levels were very low during fruit development, indicating that synthesizing DAG from G3P might not be a major pathway for TAG synthesis in olive fruit development (Figure 5, Table 3). As a rate-limiting enzyme, DGAT catalyzes the last step of the TAG synthesis. PDAT realizes the transfer of FAs from PC to DAG for TAG synthesis [37]. Among the seven transcripts of DGAT, the expression of three transcripts (OE6A093626, OE6A108115 and OE6A030092) gradually increased during fruit development, reaching the maximum at S3/S4, and then decreased at S4 or S5. The expression level of one transcript (OE6A119597) decreased at S1–S4 and increased at S5. The expression of three other transcripts of DGAT was very low during olive fruit development, including OE6A007305, OE6A016254, and OE6A114235. In the 11 transcripts of PDAT, only one transcript (OE6A007392) was gradually increased during fruit development, suggesting that it plays an important role in the PDAT-mediated TAG biosynthesis pathway (Table 3). These results indicate that the four transcripts encoding DGAT (OE6A093626, OE6A108115, OE6A119597, OE6A030092) and one transcript of PDAT (OE6A007392) played crucial roles in TAG assembly, which is consistent with a previous study in which PDAT and DGAT were found to be the major enzymes involved in TAG synthesis and to possess overlapping functions [29]. In addition, membrane lipid phosphatidylcholine (PC) can be converted into DAG and subsequent TAG synthesis (Figure 5). The transcripts related to PC-DAG transformation remain active, such as OE6A102251 and OE6A111035 (Table 3).

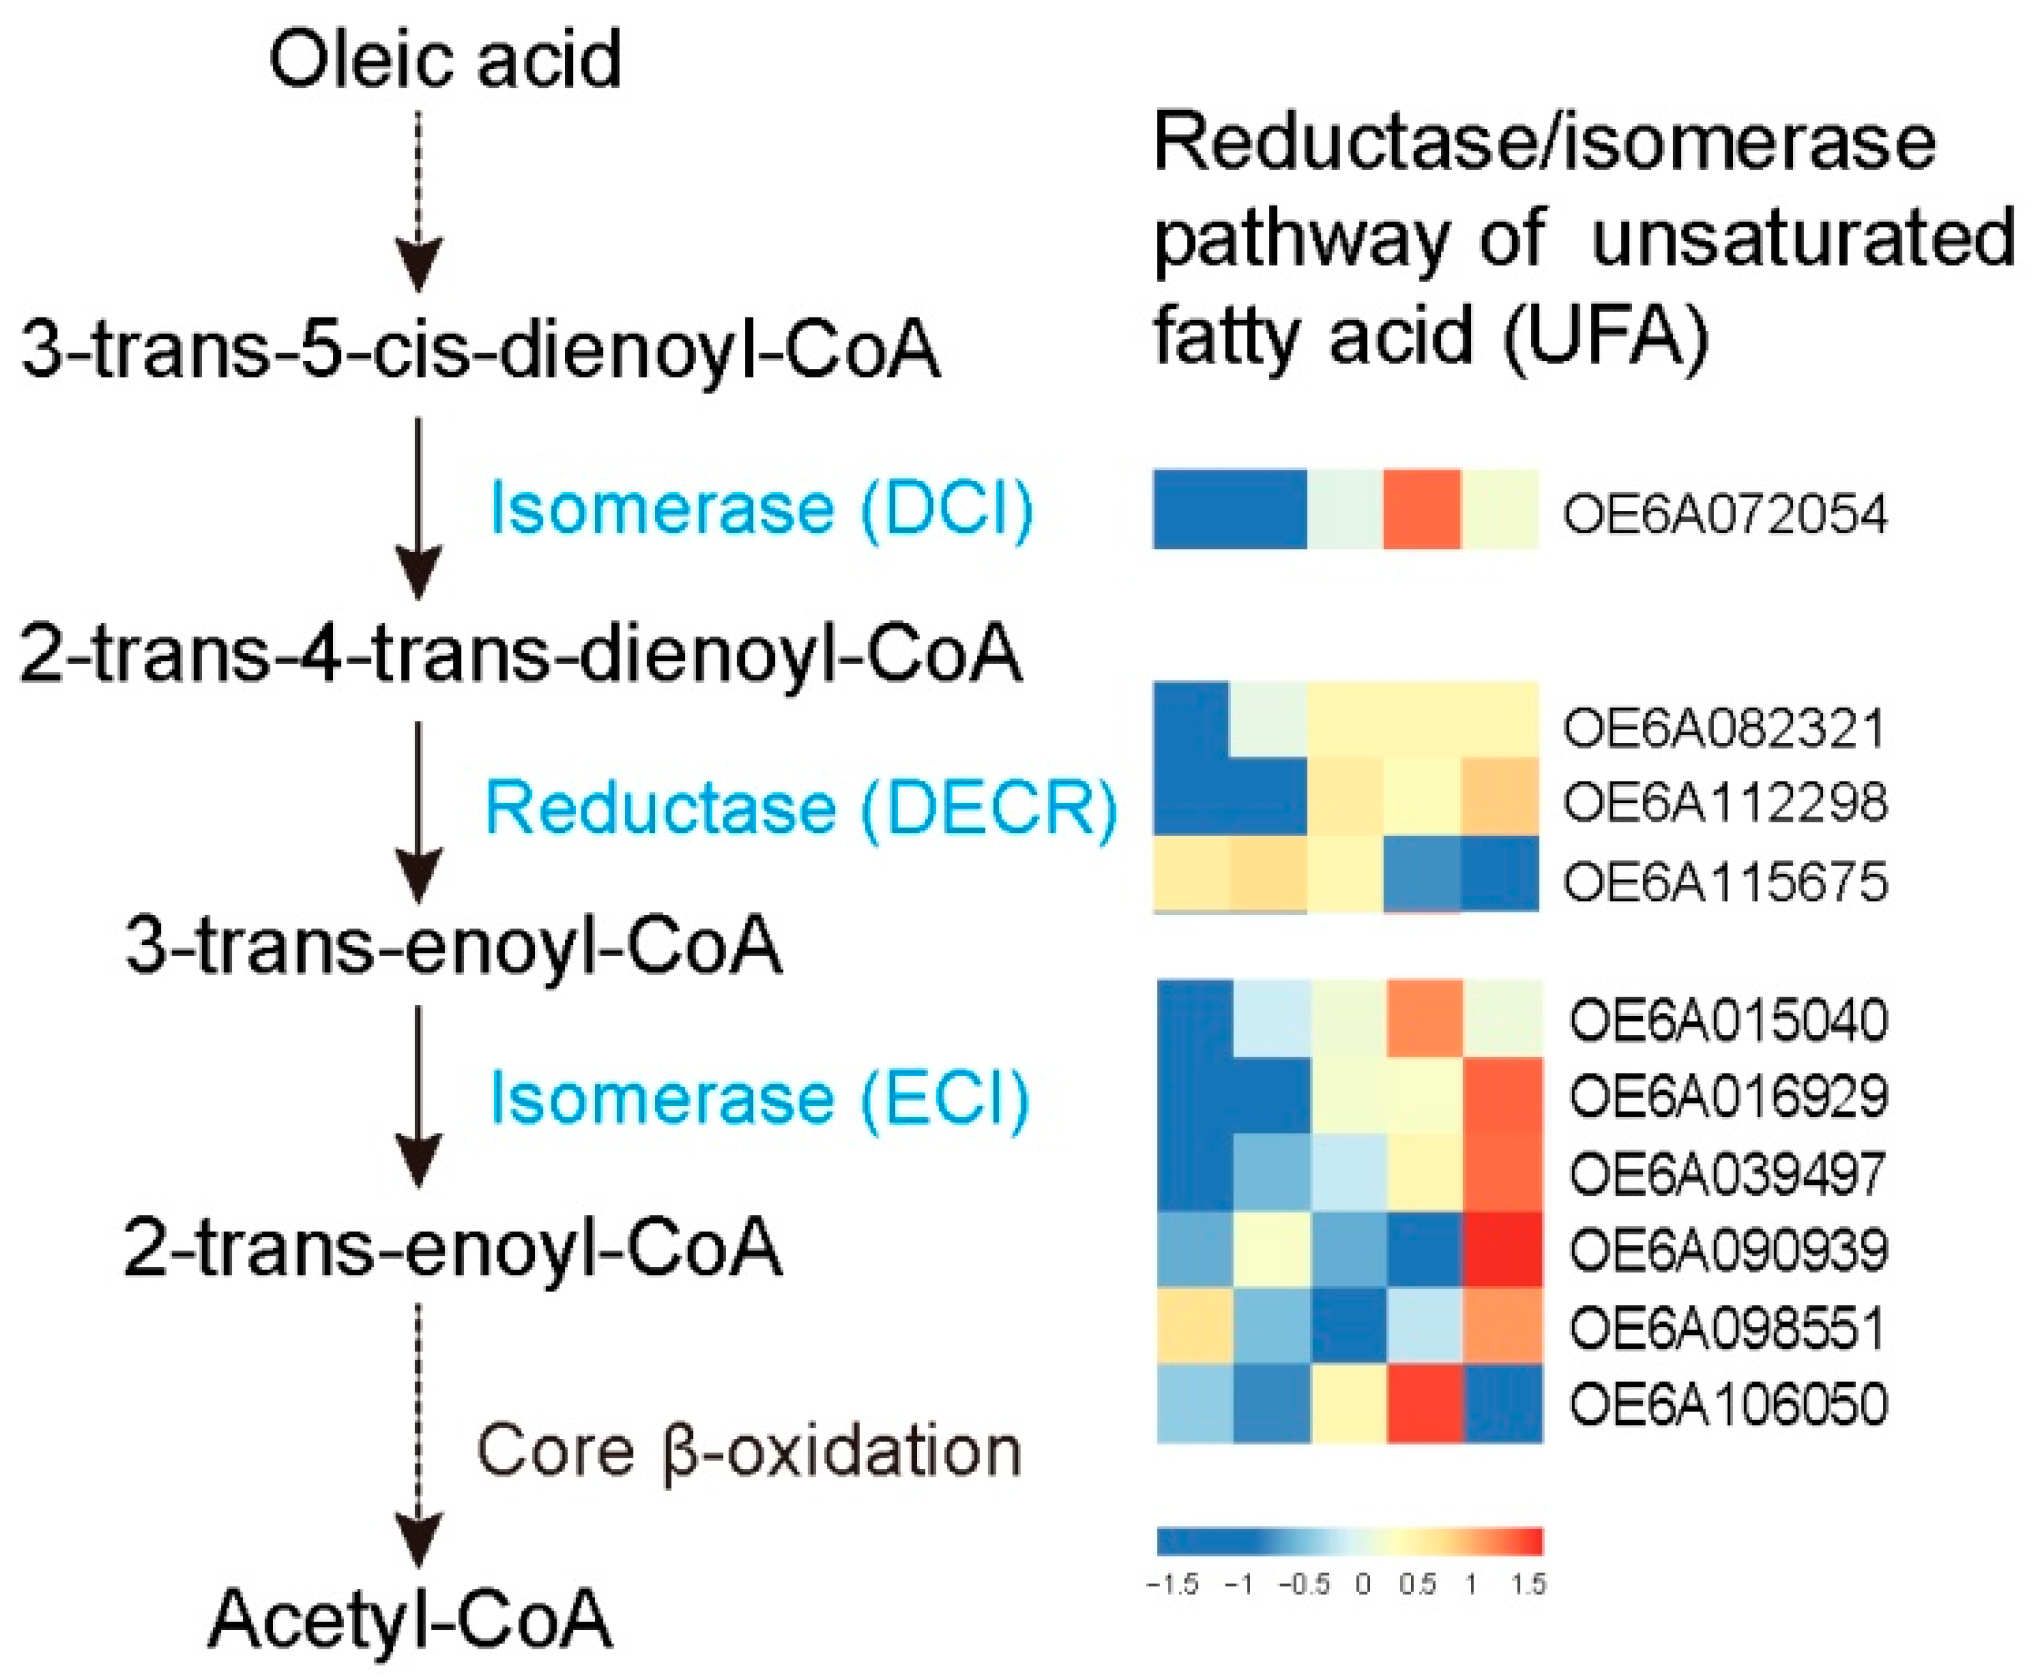
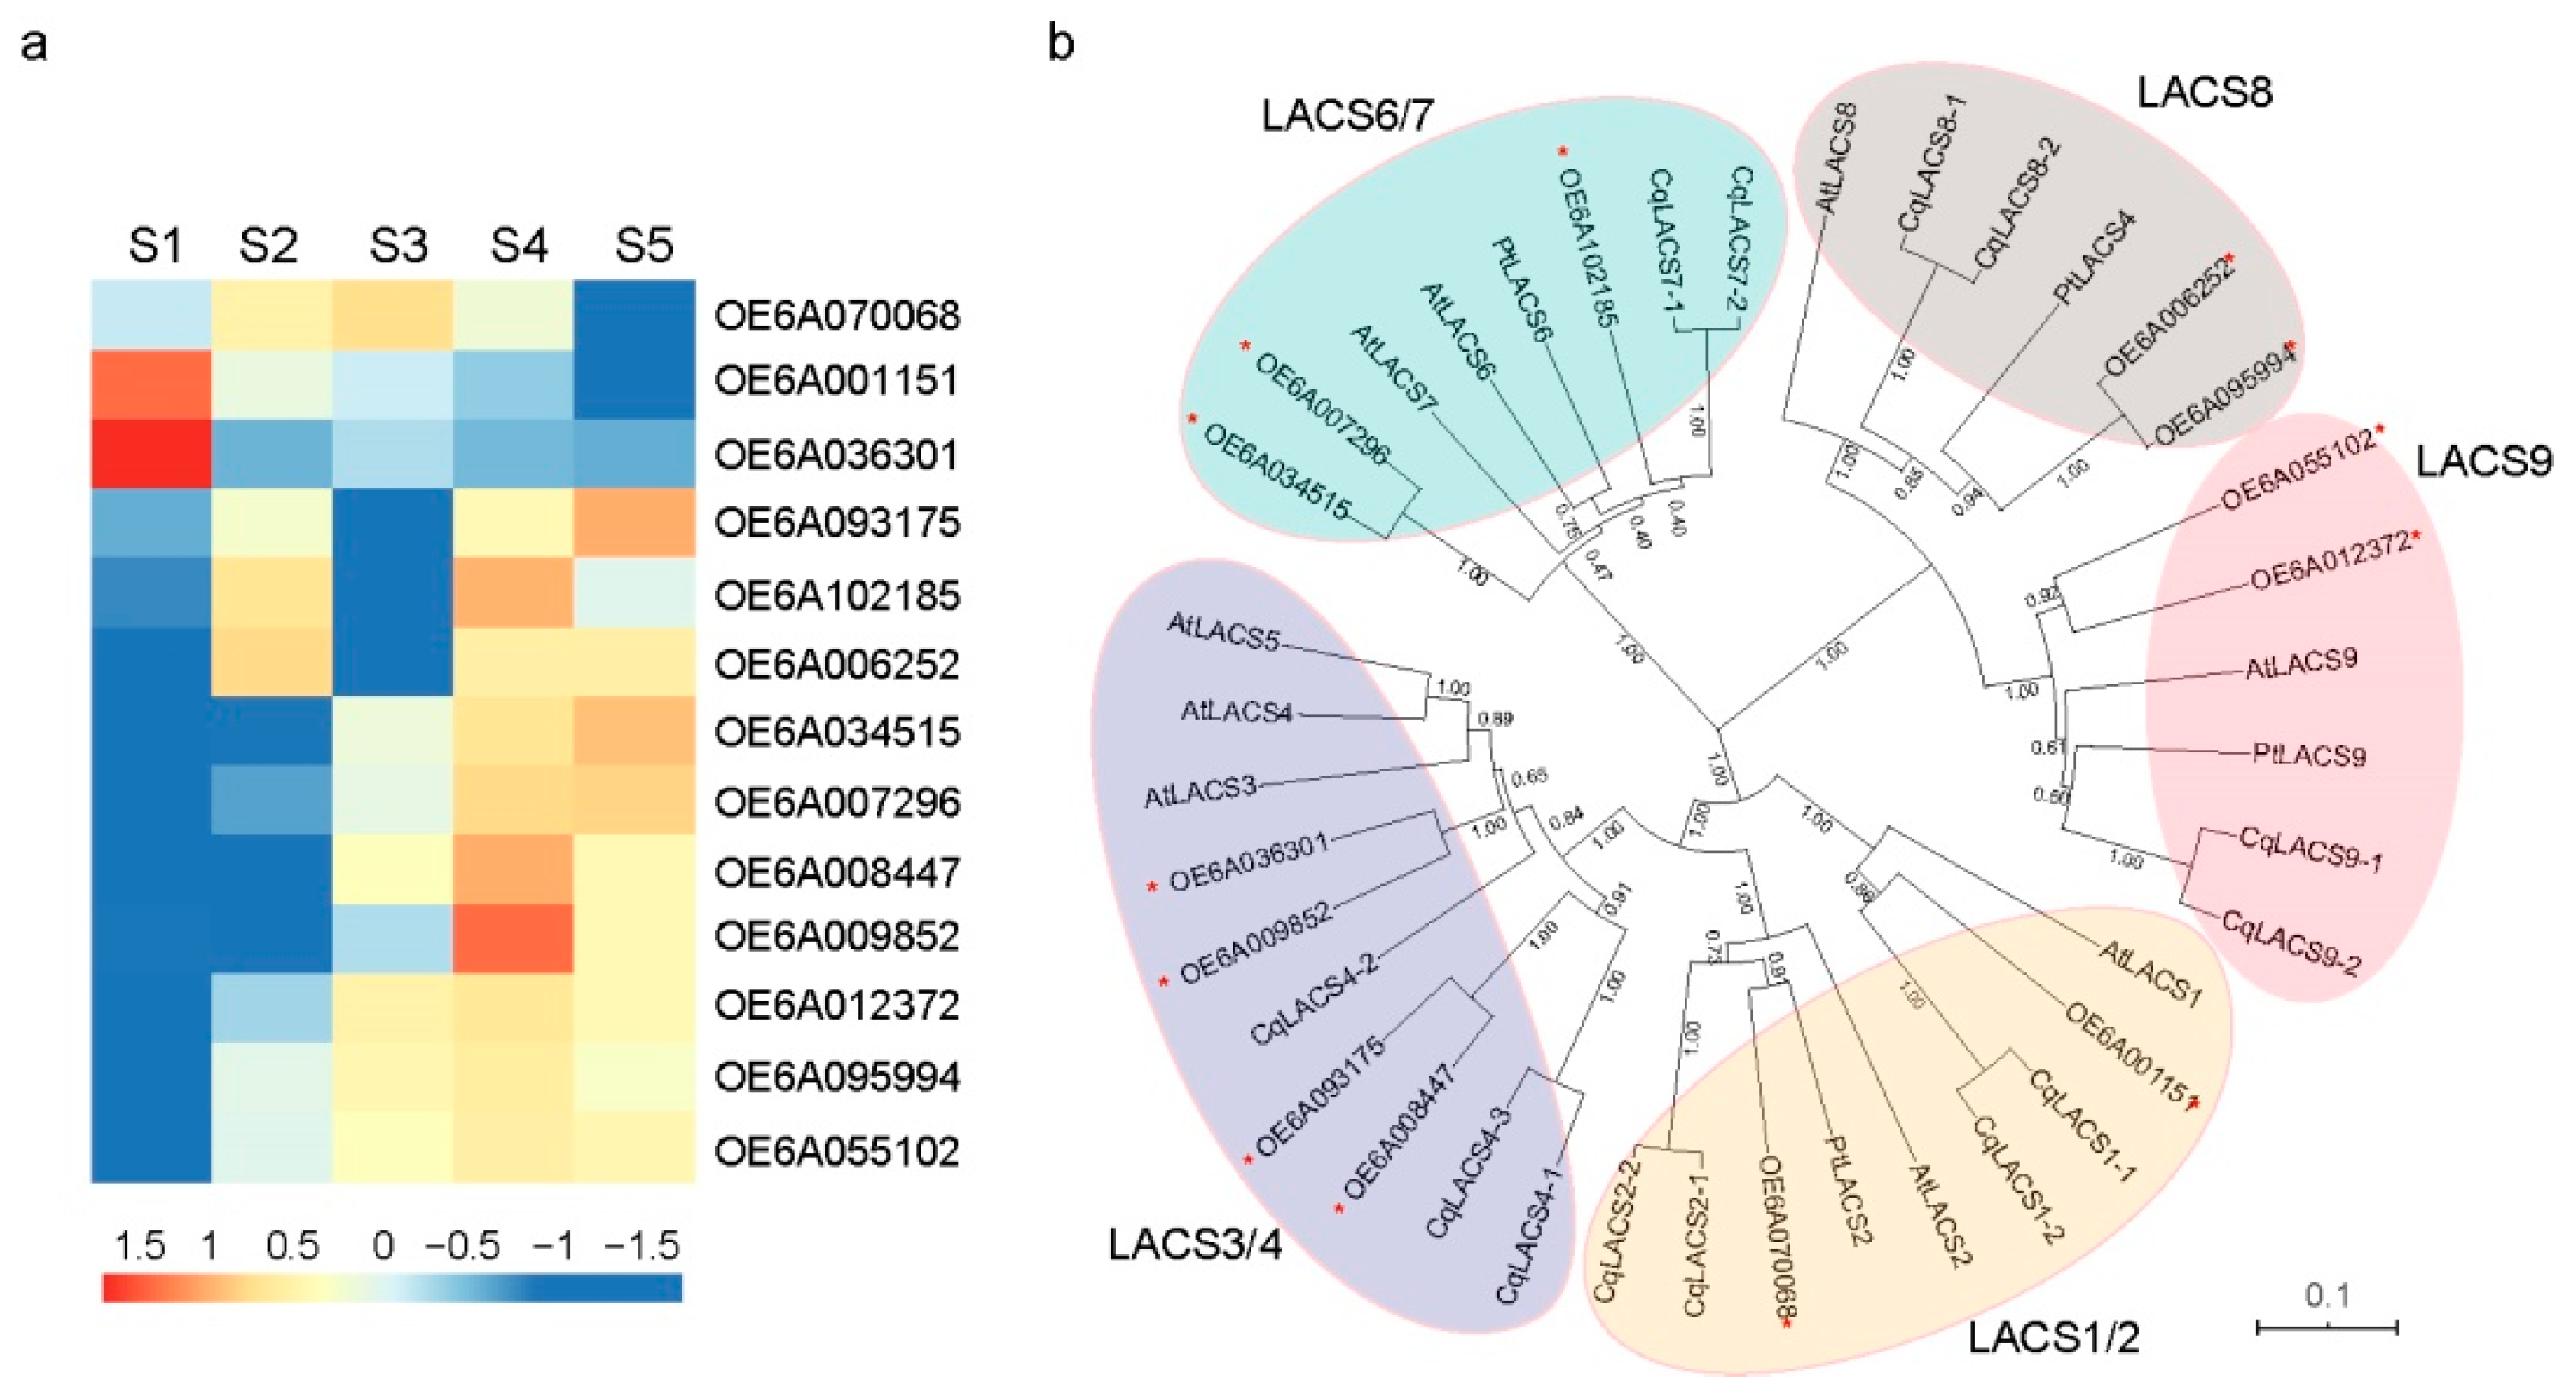
3.5. FA Degradation at Different Stages

In plants, the fatty acids released from TAGs are mostly catabolized by β-oxidation in peroxisome [15,25]. The inhibition of TAG degradation can guarantee a high level of oil content [34]. The β-oxidation pathway occurs in glyoxysome and involves some main enzymes for oil degradation [25]. In total, 18 transcripts implicated FA degradation in peroxisome were identified, including LACS, ACX, MFP (Hydratase/DH), and KAT (Figure 6). The degradation of several types of unsaturated fatty acids requires the presence of auxiliary enzymes, such as ∆3, ∆2 enoyl-CoA isomerase, 2,4-dienoyl-CoA reductase, ∆3,5, and ∆2,4-dienoyl-CoA isomerase (Figure 7). During the developmental stages, most gene families had one or two transcripts with the highest expression in the S4 stage, such as OE6A055102 (LACS), OE6A056163 (ACX), OE6A036171 (MFP), OE6A006809, OE6A055936 (KAT), OE6A072054 (DCI), OE6A015040, and OE6A106050 (ECI), suggesting that FA degradation is highly active at the late developmental stages. This is in accordance with the changes in FA content during olive fruit ripening (Figure 1).
LACSs play an important role in FA synthesis and catabolism (Figure 5 and Figure 6). Free FAs must be activated by LACSs to participate in the synthesis and degradation of TAGs. A total of 13 transcripts of LACS were found from the transcriptome analysis in the present study. They exhibited different expression patterns during the olive fruit maturation stages of S1–S5 (Figure 8a). Phylogenetic analysis showed that at least two homologs existed in the five LACS groups in Arabidopsis (Figure 8b). The transcripts of OE6A001151 and OE6A070068 clustered with AtLACS1/2, and OE6A006252 and OE6A095994 clustered with AtLACS8. The transcripts of OE6A102185, OE6A007296, and OE6A034515 clustered with AtLACS6/7. Interestingly, the transcripts of OE6A012372 and OE6A055102 clustered with AtLACS9, and the trends in their expression levels were consistent with the change in oil content. Meanwhile, the expression level of OE6A055102 was significantly higher than that of the other genes from S2. In eukaryotes, LACSs exist mainly in the form of a family, and its different members have different roles in fatty acid metabolism. Nine LACS genes have been identified in Arabidopsis. LACS1 and LACS2 are involved in the synthesis of wax and cutin [38,39]. The Arabidopsis endoplasmic reticulum LACS1 and LACS4 and the plastid LACS9 produce a large amount of acyl-CoA required for TAG assembly. LACS1 and LACS9 participate in the biosynthesis of seed oil [39]. They are consistent with the result that the transcripts of OE6A012372 and OE6A055102 clustered with AtLACS9, and their expression trends of were similar to those in TAG content, indicating that the two transcripts play crucial roles in oil synthesis (Figure 8). The transcripts of OE6A034515 and OE6A007296, encoding LACS6 and LACS7, respectively, reached the highest expression in the last stage, suggesting that these two transcripts may participate in oil degradation, which is consistent with a previous study that found that LACS6 and LACS7 were located in the peroxisome and participated in the fatty acid β-oxidation pathway [40].

4. Conclusions

In this study, integrated analysis, full-length transcriptome, and FA metabolism analysis provides improved insight into FA metabolism pathways during olive fruit maturation. The high expression of most genes related to pyruvate synthesis and the high transcription level of ACCase were positively correlated with the de novo synthesis of fatty acids. Multiple expression patterns of the LACS family and the synergistic effect of DGAT and PDAT promoted TAG assembly. The perfect coordination of high-expression SAD and low-expression FAD promoted the high accumulation of oleic acid in olive fruits. This study helps to further elucidate the molecular mechanism of fatty acid synthesis and degradation during fruit ripening and provides more information for selection of the appropriate fruit-harvesting period and improvement of the oil content and fatty acid composition of fruits.

Supplementary Materials

The following are available online at https://www.mdpi.com/article/10.3390/f12121773/s1, Figure S1: Correlation assessment and principal component analysis of five stages (S1–S5), Figure S2: Genome mapping and transcriptional regulation of olive, Figure S3: Putative genes of FAD (a) and SAD (b) identified at the developing stages of olive fruit, Figure S4: Dynamic changes in SADs/FATBs during olive fruit maturation, Table S1. Differential expressed genes associated with FA synthesis in plastids at different stages.

Author Contributions

G.R. and J.Z. designed the study; G.R. and L.X. collected samples needed for transcriptome sequencing profiling; Y.L. and X.L. performed and accomplished the classification of the different expression genes; L.X. and L.G. analyzed data and wrote the manuscript. All authors have read and agreed to the published version of the manuscript.

Funding

This research was funded by the National Key R&D Program of China (2018YFD1000603-3) and Fundamental Research Funds for the Central Non-profit Research Institution of the Chinese Academy of Forestry (CAFYBB2021QC001).

Institutional Review Board Statement

Not applicable.

Informed Consent Statement

Not applicable.

Data Availability Statement

The RNA sequence (ISO-Seq and RNA-Seq) raw data were deposited in the NCBI Sequence Read Archive as follows: Stage 1 (S1) by RNA-seq: SRR8446454; Stage 2 (S2) by RNA-seq: SRR8446455; Stage 3 (S3) by RNA-seq: SRR8446452; Stage 4 (S4) by RNA-seq: SRR8446453; Stage 5 (S5) by RNA-seq: SRR8446451; ISOseq of fruits_Mix (1–2 K): SRR8606699; ISOseq of fruits_Mix (2–3 K):SRR8606700; ISOseq of fruits_Mix (3–6 K): SRR8606701. The transcript fasta file and functional annotation (transcripts data.zip) were public on the Figshare (DOI: 10.6084/m9.figshare.14069216).

Acknowledgments

We thank Bionovogene Co., Ltd., Suzhou, China for statistical data analysis.

Conflicts of Interest

The authors declare no conflict of interest.

References

  1. Rosa, R.D.L.; Belaj, A.; Mérida, A.M.; Trelles, O.; López, C.B. Development of EST-derived SSR Markers with Long-core Repeat in Olive and Their Use for Paternity Testing. J. Am. Soc. Hortic. Sci. 2013, 138, 290–296. [Google Scholar] [CrossRef]
  2. Diez, C.M.; Trujillo, I.; Martinez-Urdiroz, N.; Barranco, D.; Rallo, L.; Marfil, P.; Gaut, B.S. Olive domestication and diversification in the Mediterranean Basin. New Phytol. 2015, 206, 436–447. [Google Scholar] [CrossRef] [PubMed]
  3. Gavriilidou, V.; Boskou, D. Chemical interesterification of olive-tristearin blends for margarines. Int. J. Food Sci. Technol. 2007, 26, 451–456. [Google Scholar] [CrossRef]
  4. Parvini, F.; Sicardo, M.D.; Hosseini-Mazinani, M.; Martinez-Rivas, J.M.; Hernandez, M.L. Transcriptional Analysis of Stearoyl-Acyl Carrier Protein Desaturase Genes from Olive (Olea europaea) in Relation to the Oleic Acid Content of the Virgin Olive Oil. J. Agric. Food Chem. 2016, 64, 7770–7781. [Google Scholar] [CrossRef] [PubMed]
  5. Ben Brahim, S.; Kelebek, H.; Ammar, S.; Abichou, M.; Bouaziz, M. LC-MS phenolic profiling combined with multivariate analysis as an approach for the characterization of extra virgin olive oils of four rare Tunisian cultivars during ripening. Food Chem. 2017, 229, 9–19. [Google Scholar] [CrossRef]
  6. Cruz, F.; Julca, I.; Gomez-Garrido, J.; Loska, D.; Marcet-Houben, M.; Cano, E.; Galan, B.; Frias, L.; Ribeca, P.; Derdak, S.; et al. Genome sequence of the olive tree, Olea europaea. GigaScience 2016, 5, 29. [Google Scholar] [CrossRef]
  7. Dabbou, S.; Chaieb, I.; Rjiba, I.; Issaoui, M.; Echbili, A.; Nakbi, A.; Gazzah, N.; Hammami, M. Multivariate Data Analysis of Fatty Acid Content in the Classification of Olive Oils Developed Through Controlled Crossbreeding. J. Am. Oil Chem. Soc. 2011, 89, 667–674. [Google Scholar] [CrossRef]
  8. Flores, G.; Blanch, G.P.; del Castillo, M.L.R. Effect of postharvest methyl jasmonate treatment on fatty acid composition and phenolic acid content in olive fruits during storage. J. Sci. Food Agric. 2017, 97, 2767–2772. [Google Scholar] [CrossRef]
  9. Cheng, C.; Wang, D.; Xia, H.; Wang, F.; Yang, X.; Pan, D.; Wang, S.; Yang, L.; Lu, H.; Shu, G.; et al. A comparative study of the effects of palm olein, cocoa butter and extra virgin olive oil on lipid profile, including low-density lipoprotein subfractions in young healthy Chinese people. Int. J. Food Sci. Nutr. 2019, 70, 355–366. [Google Scholar] [CrossRef]
  10. Bates, P.D.; Stymne, S.; Ohlrogge, J. Biochemical pathways in seed oil synthesis. Curr. Opin. Plant. Biol. 2013, 16, 358–364. [Google Scholar] [CrossRef] [Green Version]
  11. Lung, S.-C.; Weselake, R.J. Diacylglycerol acyltransferase: A key mediator of plant triacylglycerol synthesis. Lipids 2006, 41, 1073–1088. [Google Scholar] [CrossRef] [PubMed]
  12. Contreras, C.; Mariotti, R.; Mousavi, S.; Baldoni, L.; Torres, M. Characterization and validation of olive FAD and SAD gene families: Expression analysis in different tissues and during fruit development. Mol. Biol. Rep. 2020, 47, 1–11. [Google Scholar] [CrossRef] [PubMed]
  13. Zhang, Z.; Wei, X.; Liu, W.; Min, X.; Jin, X.; Ndayambaza, B.; Wang, Y. Genome-wide identification and expression analysis of the fatty acid desaturase genes in Medicago truncatula. Biochem. Biophys. Res. Commun. 2018, 499, 361–367. [Google Scholar] [CrossRef]
  14. Chia, T.Y.; Pike, M.J.; Rawsthorne, S. Storage oil breakdown during embryo development of Brassica napus (L.). J. Exp. Bot. 2005, 56, 1285–1296. [Google Scholar] [CrossRef] [PubMed]
  15. Hernandez, M.L.; Sicardo, M.D.; Martinez-Rivas, J.M. Differential Contribution of Endoplasmic Reticulum and Chloroplast omega-3 Fatty Acid Desaturase Genes to the Linolenic Acid Content of Olive (Olea europaea) Fruit. Plant. Cell Physiol. 2016, 57, 138–151. [Google Scholar] [CrossRef] [PubMed] [Green Version]
  16. Bodoira, R.; Torres, M.; Pierantozzi, P.; Taticchi, A.; Servili, M.; Maestri, D. Oil biogenesis and antioxidant compounds from "Arauco" olive (Olea europaea L.) cultivar during fruit development and ripening. Eur. J. Lipid Sci. Technol. 2015, 117, 377–388. [Google Scholar] [CrossRef]
  17. Graham, I.A. Seed storage oil mobilization. Annu. Rev. Plant. Biol. 2008, 59, 115–142. [Google Scholar] [CrossRef]
  18. Guodong, R.; Jianguo, Z.; Xiaoxia, L.; Ying, L. Identification of putative genes for polyphenol biosynthesis in olive fruits and leaves using full-length transcriptome sequencing. Food Chem. 2019, 300, 125246. [Google Scholar] [CrossRef] [PubMed]
  19. Clark, T.A. Full-Length cDNA Sequencing on the PacBio Sequel Platform. Available online: http://www.pacb.com/applications/rnasequencing/2017 (accessed on 10 December 2015).
  20. Hackl, T.; Hedrich, R.; Schultz, J.; Forster, F. Proovread: Large-scale high-accuracy PacBio correction through iterative short read consensus. Bioinformatics 2014, 30, 392. [Google Scholar] [CrossRef] [Green Version]
  21. Li, B.; Dewey, C.N. RSEM: Accurate transcript quantification from RNA-Seq data with or without a reference genome. BMC Bioinform. 2011, 12, 323. [Google Scholar] [CrossRef] [PubMed] [Green Version]
  22. Varet, H.; Brillet-Gueguen, L.; Coppee, J.Y.; Dillies, M.A. SARTools: A DESeq2- and EdgeR-Based R Pipeline for Comprehensive Differential Analysis of RNA-Seq Data. PLoS ONE 2016, 11, e0157022. [Google Scholar] [CrossRef] [Green Version]
  23. Anders, S.; Huber, W. Differential expression analysis for sequence count data. Genome Biol. 2010, 11, R106. [Google Scholar] [CrossRef] [PubMed] [Green Version]
  24. Peng, L.-X.; Zou, L.; Tan, M.-L.; Deng, Y.-Y.; Yan, J.; Yan, Z.-Y.; Zhao, G. Free amino acids, fatty acids and phenolic compounds in Tartary buckwheat of different hull colour. Czech. J. Food Sci. 2017, 35, 214–222. [Google Scholar] [CrossRef] [Green Version]
  25. Zhou, L.; Wang, H.; Chen, X.; Li, Y.; Hussain, N.; Cui, L.; Wu, D.; Jiang, L. Identification of candidate genes involved in fatty acids degradation at the late maturity stage in Brassica napus based on transcriptomic analysis. Plant. Growth Regul. 2017, 83, 385–396. [Google Scholar] [CrossRef]
  26. Wang, X.; Liang, H.; Guo, D.; Guo, L.; Duan, X.; Jia, Q.; Hou, X. Integrated analysis of transcriptomic and proteomic data from tree peony (P. ostii) seeds reveals key developmental stages and candidate genes related to oil biosynthesis and fatty acid metabolism. Hortic. Res. 2019, 6, 111. [Google Scholar] [CrossRef] [Green Version]
  27. Weselake, R.J.; Taylor, D.C.; Rahman, M.H.; Shah, S.; Laroche, A.; McVetty, P.B.E.; Harwood, J.L. Increasing the flow of carbon into seed oil. Biotechnol. Adv. 2009, 27, 866–878. [Google Scholar] [CrossRef]
  28. Thelen, J.J.; Ohlrogge, J.B. Both antisense and sense expression of biotin carboxyl carrier protein isoform 2 inactivates the plastid acetyl-coenzyme A carboxylase in Arabidopsis thaliana. Plant. J. 2002, 32, 419–431. [Google Scholar] [CrossRef]
  29. Huang, J.; Zhang, T.; Zhang, Q.; Chen, M.; Wang, Z.; Zheng, B.; Xia, G.; Yang, X.; Huang, C.; Huang, Y. The mechanism of high contents of oil and oleic acid revealed by transcriptomic and lipidomic analysis during embryogenesis in Carya cathayensis Sarg. BMC Genom. 2016, 17, 113. [Google Scholar] [CrossRef] [Green Version]
  30. Wu, G.Z.; Xue, H.W. Arabidopsis beta-ketoacyl-[acyl carrier protein] synthase i is crucial for fatty acid synthesis and plays a role in chloroplast division and embryo development. Plant. Cell 2010, 22, 075564. [Google Scholar] [CrossRef] [Green Version]
  31. Gupta, M.; Dekelver, R.C.; Palta, A.; Clifford, C.; Petolino, J.F. Oil Modification via Transcriptional Activation of Canola KASII Using an Engineered Zinc Finger Transcription Factor. Vitr. Cell. Dev. Biol. Anim. 2012, 48, 25. [Google Scholar]
  32. Herńndez, M.L.; Padilla, M.A.N.; Mancha, M.; Martínez-Rivas, J.M. Expression Analysis IdentifiesFAD2-2as the Olive Oleate Desaturase Gene Mainly Responsible for the Linoleic Acid Content in Virgin Olive Oil. J. Agric. Food Chem. 2009, 57, 6199–6206. [Google Scholar] [CrossRef] [PubMed]
  33. Moreno-Perez, A.J.; Venegas-Caleron, M.; Vaistij, F.E.; Salas, J.J.; Larson, T.R.; Garces, R.; Graham, I.A.; Martinez-Force, E. Reduced expression of FatA thioesterases in Arabidopsis affects the oil content and fatty acid composition of the seeds. Planta 2012, 235, 629–639. [Google Scholar] [CrossRef] [PubMed]
  34. Salas, J.J.; Ohlrogge, J.B. Characterization of substrate specificity of plant FatA and FatB acyl-ACP thioesterases. Arch. Biochem. Biophys. 2002, 403, 25–34. [Google Scholar] [CrossRef]
  35. Bonaventure, G.; Salas, J.; Pollard, J.; Michael, R.; Ohlrogge, J. Disruption of the FATB Gene in Arabidopsis Demonstrates an Essential Role of Saturated Fatty Acids in Plant Growth. Plant. Cell 2003, 15, 1020–1033. [Google Scholar] [CrossRef] [Green Version]
  36. Janssen, J.H.; Spoelder, J.; Koehorst, J.J.; Schaap, P.J.; Barbosa, M.J. Time-dependent transcriptome profile of genes involved in triacylglycerol (TAG) and polyunsaturated fatty acid synthesis in Nannochloropsis gaditana during nitrogen starvation. J. Appl. Phycol. 2020, 32, 1153–1164. [Google Scholar] [CrossRef] [Green Version]
  37. Dahlqvist, A.; Stahl, U.; Lenman, M.; Banas, A.; Lee, M.; Sandager, L.; Ronne, H.; Stymne, S. Phospholipid:diacylglycerol acyltransferase: An enzyme that catalyzes the acyl-CoA-independent formation of triacylglycerol in yeast and plants. Proc. Natl. Acad. Sci. USA 2000, 97, 6487–6492. [Google Scholar] [CrossRef] [Green Version]
  38. Lu, S.; Song, T.; Kosma, D.K.; Parsons, E.P.; Rowland, O.; Jenks, M.A. Arabidopsis CER8 encodes LONG-CHAIN ACYL-COA SYNTHETASE 1 (LACS1) that has overlapping functions with LACS2 in plant wax and cutin synthesis. Plant. J. 2009, 59, 553–564. [Google Scholar] [CrossRef]
  39. Zhao, L.; Katavic, V.; Li, F.; Haughn, G.W.; Kunst, L. Insertional mutant analysis reveals that long-chain acyl-CoA synthetase 1 (LACS1), but not LACS8, functionally overlaps with LACS9 in Arabidopsis seed oil biosynthesis. Plant. J. 2010, 64, 1048–1058. [Google Scholar] [CrossRef]
  40. Fulda, M.; Schnurr, J.; Abbadi, A.; Heinz, E.; Browse, J. Peroxisomal Acyl-CoA Synthetase Activity Is Essential for Seedling Development in Arabidopsis thaliana. Plant. Cell 2004, 16, 394–405. [Google Scholar] [CrossRef] [Green Version]
Figure 1. Observation and measurement of FAs and TAGs during the developmental period of olive fruit. (a) The content of FAs at five time points during olive fruit development (S1–S5). Olive fruits are harvested 50 days after flower (DAF, immature stage) and then every 30 days until 170 DAF (mature stage). Values in μg/g FW (fresh weight) (mean ± SD, n = 3). (b) The FA content percentage at five developmental stages of olive fruit (S1–S5), respectively. C16:0, palmitic acid; C16:1, hexadecenoic acid; C18:0, stearic acid; C18:1, oleic acid; C18:2, linoleic acid; C18:3, linolenic acid. Other represents the percentage of content for remaining fatty acids in total fatty acids.
Forests 12 01773 g001
Figure 2. The contents of six main FAs during olive fruit maturation. The dynamic changes six main fatty acids at the five stages of olive fruit development. Values in μg/g FW (fresh weight) (mean ± SD, n = 3). The different lowercase letters on the column represent significant differences (p < 0.05).
Forests 12 01773 g002
Figure 3. Functional classification of the KEGG annotations of the unigenes in olive fruit during development. The top enriched KEGG pathways of the olive DEGs from S1 vs. S2, S2 vs. S3, S3 vs. S4, and S4 vs. S5. The pathways marked by red boxes represent FA metabolism-related processes. The red dots mark the pathways related to carbohydrate metabolism and secondary metabolism. The asterisk indicates a significant difference, p value < 0.001.
Forests 12 01773 g003
Figure 4. Biosynthesis of pyruvate in olive and the DEGs involved in the glycolysis pathway at five developmental stages of olive fruit (S1–S5). (a) Transcript abundance profiles of the genes involved in the glycolysis pathway. The underlined genes represent the isoenzymes in the plastid. Numbers in brackets represent the number of gene copies in olive. (b) DEGs involved in the glycolysis pathway at five developmental stages. PGM, phosphoglucomutase; HXK, hexokinase; GPI, glucose-6-phosphate isomerase; PFK, phosphofructokinase; FBA, fructose 1,6 bisphosphate aldolase; GAPDH, glyceraldehyde phosphate dehydrogenase; PGK, phosphoglycerate kinase; GPMA, 2,3-bisphosphoglycerate phosphoglyceromutase; ENO, enolase; PK, phosphoenolpyruvate kinase; PPDK, pyruvate phosphate dikinase. The green and negative numbers represent the fold change of upregulated genes during fruit maturation, and the red and positive values represent fold change of downregulated genes during fruit maturation. The red asterisk represents the rate-limiting enzyme.
Forests 12 01773 g004
Figure 5. The differential transcription associated with FA and TAG biosynthesis during olive fruit maturation. Number in bracket means the numbers of gene copies. C16:0, palmitic acid; C16:1, hexadecenoic acid; C18:0, stearic acid; C18:1, oleic acid; C18:2, linoleic acid; C18:3, linolenic acid. TAG: triacylglycerol; ACCase, acetyl-CoA carboxylase; BCCP, carboxylated biotin carrier protein; BC, biotin carboxylase; CT, carboxyltransferase; MAT, malonyl-CoA ACP transacylase; KAS, ketoacyl-ACP synthase; KAR, ketoacyl-ACP reductase; HAD, hydroxyacyl-ACP dehydrase; EAR, enoyl-ACP reductase; SAD, stearoyl-ACP desaturase; FAD, fatty acid desaturase; FATA/B, acyl-ACP thioesterase A/B; PCH, palmitoyl-CoA hydrolase; GPAT, glycerol-3-phosphate acyltransferase; LPAAT, 1-acylglycerol-3-phosphate acyltransferase; PAP, phosphatidic acid phosphatase; DGAT1/2, acyl-CoA: diacylglycerol acyltransferase 1/2; PDAT, phospholipid:diacylglycerol acyltransferase; LPCAT, Acyl-CoA:lysophosphatidylcholine acyltransferase; PLA2, phospholipase A2.
Forests 12 01773 g005
Figure 6. Expression levels of the genes involved in β-oxidation pathways during olive maturation. LACS 6/7, long-chain acyl-CoA synthetase 6/7; ACX, acyl-CoA oxidase; MFP Hydratase/DH, multifunctional protein hydratase/dehydrogenase; KAT, 3-ketoacyl-CoA thiolase.
Forests 12 01773 g006
Figure 7. Expression levels of main genes involved in the degradation of unsaturated fatty acids (UFA) during olive maturation. ECI, enoyl-CoA isomerase; DECR, 2,4-dienoyl-CoA reductase; DCI, ∆3,5, ∆2,4-dienoyl-CoA isomerase.
Forests 12 01773 g007
Figure 8. Putative genes of LACS identified in the developing stages of olive fruit. (a) Heatmap of LACS expression levels at different developmental stages. (b) Cluster analysis of olive LACS unigenes and homologs from different species. Cq, Chenopodium quinoa; Pt, Populus trichocarpa; At, Arabidopsis thaliana. The MEGA 7.0 program was used to construct a neighbor-joining tree based on the LACS protein sequences from these four species. There were 1000 bootstrap replicates. The olive LACS proteins have been divided into five categories.
Forests 12 01773 g008
Table 1. Summary and genome mapping of the PacBio Sequel Single-Molecule Real-time sequencing.
Summary of Sequence
Subreads base (G)10.55
Average subreads length (bp)1791
Consensus reads187,517
Total error-corrected consensus reads186,150
Circular consensus sequence (CCSs)492,350
Full-length non chimera (FLNC) reads399,263
Total mapped of GMAP on cultivar Farga175,700 (94.39%)
Table 2. The clean reads of Illumina-seq for mapping full-length transcript isoform from the sample of each developmental stage.
SampleTotal ReadsTotal MappedUnmappedMultiple MappedUniquely Mapped
S1260,230,962237,461,682 (91.25%)22,769,280 (8.75%)29,826,494 (11.46%)19,259,528 (7.40%)
S2331,998,532303,326,286 (91.36%)28,672,246 (8.64%)34,811,070 (10.49%)18,038,372 (5.43%)
S3306,350,130280,941,378 (91.71%)25,408,752 (8.29%)36,341,656 (11.86%)18,510,870 (6.04%)
S4333,794,400312,544,680 (93.63%)21,249,720 (6.37%)34,543,262 (10.35%)17,451,618 (5.23%)
S5264,183,768241,789,036 (91.52%)22,394,732 (8.48%)31,835,116 (12.05%)18,850,240 (7.14%)
Table 3. DEGs associated with TAG synthesis at different stages.
Candidate GenesS1 vs. S2S2 vs. S3S3 vs. S4S4 vs. S5Gene Name
OE6A0027532.0107 LPAAT
OE6A0201694.19 −3.2021LPAAT
OE6A007392−1.5115 PDAT1
OE6A093626 −1.9341 DGAT
OE6A108115 DGAT
OE6A1195971.8299−1.9289 DGAT
OE6A030092−2.1724 DGAT
OE6A1022511.6139 LPCAT
OE6A111035−1.2815−1.1866 LPCAT
Note: A strict criterion of a p value < 0.05 and|log2 (fold change)| > 1was used as the threshold to select the significant differences in gene expression. The mark of vs. indicates the relative expression ratio of the front stage to the back stage between two adjacent developmental stages. The negative and positive values show the fold change that genes were upregulated and downregulated to during olive fruit development, respectively.
Publisher’s Note: MDPI stays neutral with regard to jurisdictional claims in published maps and institutional affiliations.

