Article

Estimating the Potential Impacts of Climate Change on the Spatial Distribution of Garuga forrestii, an Endemic Species in China

1
CAS Key Laboratory of Plant Germplasm Enhancement and Specialty Agriculture, Wuhan Botanical Garden, Chinese Academy of Sciences, Wuhan 430074, China
2
Center of Conservation Biology, Core Botanical Gardens, Chinese Academy of Sciences, Wuhan 430074, China
3
University of Chinese Academy of Sciences, Beijing 100049, China
4
Department of Plant Biology, University of Ilorin, Ilorin 1515, Nigeria
5
Centre for Integrative Conservation, Xishuangbanna Tropical Botanical Garden, Chinese Academy of Sciences, Menglun 666303, China
6
Sino-African Joint Research Center, Chinese Academy of Sciences, Wuhan 430074, China
7
Key Laboratory for Plant Diversity and Biogeography of East Asia, Kunming Institute of Botany, Chinese Academy of Sciences, Kunming 650201, China
8
Rare Plants Research Institute of Yangtze River, Three Gorges Corporation, Yichang 443133, China
*
Authors to whom correspondence should be addressed.
Forests 2021, 12(12), 1708; https://doi.org/10.3390/f12121708
Submission received: 8 November 2021 / Revised: 1 December 2021 / Accepted: 2 December 2021 / Published: 6 December 2021
(This article belongs to the Special Issue Modelling Forest Ecosystems)

Abstract

:
Understanding how species have adapted and responded to past climate provides insights into the present geographical distribution and may improve predictions of how biotic communities will respond to future climate change. Therefore, estimating the distribution and potentially suitable habitats is essential for conserving sensitive species such as Garuga forrestii W.W.Sm., a tree species endemic to China. The potential climatic zones of G. forrestii were modelled in MaxEnt software using 24 geographic points and nine environmental variables for the current and future (2050 and 2070) conditions under two climate representative concentration pathways (RCP4.5 and RCP8.5) scenarios. The resulting ecological niche models (ENMs) demonstrated adequate internal assessment metrics, with all AUC and TSS values being >0.79 and a pROC of >1.534. Our results also showed that the distribution of G. forrestii was primarily influenced by temperature seasonality (% contribution = 12%), elevation (% contribution = 27.5%), and precipitation of the wettest month (% contribution = 35.6%). Our findings also indicated that G. forrestii might occupy an area of 309,516.2 km2 in southwestern China. We note that the species has a potential distribution in three provinces, including Yunnan, Sichuan, and Guangxi. A significant decline in species range is observed under the future worst case of high-emissions scenario (RCP8.5), with about 19.5% and 20% in 2050 and 2070, respectively. Similarly, higher elevations shift northward to southern parts of Sichuan province in 2050 and 2070. Thus, this study helps highlight the vulnerability of the species, response to future climate and provides an insight to assess habitat suitability for conservation management.

1. Introduction

Biodiversity loss has been attributed to important factors such as anthropogenic activities (e.g., overexploitation and over-utilization), natural ecological disaster events, the spread of invasive species and climate change [1,2]. The role of climate as a driving force that influences species distribution has been well documented [3]. Recently, climatic change has substantially influenced species distribution and has affected many organisms with different geographical distributions and altered ecological processes [4,5]. Specifically, there is concern that these changes caused by climatic fluctuations and anthropogenic-induced activities will increase extinction risks in one of six species [6]. Because of this, it is crucial to know the impacts of climate on the spatial distribution of endangered, endemic and range-restricted plants, ascertain the threat and develop suitable integrated conservation plans [7,8,9,10].
Ecological niche modelling (ENMs) tools are one method for assessing the potential effects of climate change on species geographic distributions [11,12,13]. ENMs are essential for determining shifts in the ecological niche of species. These tools use machine-learning and statistical approaches by relating geo-referenced occurrence data and environmental variables to project the fundamental ecological niche and predict the probability of habitat suitability of a species [14]. In addition, for future climate scenarios, one can then use the essential environmental variables of the species to make spatial predictions about the potential distributions under changing conditions [15]. ENMs are applicable to a wide range of levels of biological entities (species, both aquatic and terrestrial) at different geographic scales [16,17]. They have also been used widely by evolutionary biologists in phylogeographic studies [18], conservationists in conservation biology [19], and ecologists in hypotheses testing about species [20].
Many modelling algorithms have been developed for this purpose, including the maximum entropy (MaxEnt). This ENM tool appraises the ecological niche of species using the location of maximum entropy distributions, suitable for presence data (only), and it is not affected by a small sample size [21,22,23]. Recent advances in ecological niche modelling are particularly relevant for identifying hotspot regions and potential climatically suitable habitats for species at different taxonomic ranks with conservation priorities, e.g., threatened, endangered and/or endemic [24,25,26].
Garuga forrestii W.W.Sm. belongs to the family Burseraceae (the incense or torchwood family) and is an endemic plant species in China (Figure 1). The species is distributed in Southwest Sichuan, and Yunnan where it grows in the Jinsha River, Bianjiang, and the Red river valleys. It is found in sparse forests in the dry, hot valley (habitats) along uneven altitudes from 700 m to 2400 m above sea level [27]. Morphologically, it is a deciduous tree of about ≥15 m, with compound and broad leaves. Flowering is usually in April, and fruiting is from May–November [28]. It has white flowers about ca. 3 mm long, the fruit shape is nearly ovate, 0.7–1 cm long, 0.6–0.8 cm in diameter. The great use of the species has been reported in folk medicine in China. For example, it has been used to treat opacities in conjunctivitis, stomachic and cooling agents, asthma, and management of diabetes. Additionally, this species has been utilized for the treatment of obesity, splenomegaly, pulmonary infections and to promote healing of wounds, bone fractures, scabies or itchiness, boils, abscesses, fungal diseases and as an antimalarial [29,30], and for its phytochemicals [31]. Excerpts from previous studies create the impression of a much-limited distribution range of G. forrestii in China [32]. In addition, the dearth of data on the distribution patterns of this endemic species might inversely present its actual conservation status in its known distribution range. This could be why the current conservation status is the Least Concern on the IUCN red list [33], thus exemplifying the need for a detailed study of this plant species to forecast the range and for the development of suitable conservation plans in China.
In this study, we applied the MaxEnt algorithm to examine the potential impacts of environmental variables on the distribution of G. forrestii in China under the current and future (2050–2070) climatic conditions. We aimed to (i) assess the potential of climate change on the distribution of G. forrestii, (ii) identify key environmental variables that mostly predict its distribution, (iii) assess its potential distribution under various climate change scenarios, (iv) explore the patterns of niche shifts and range delimitation and (v) predict climatically suitable hotspot regions for the conservation of G. forrestii in China.

2. Materials and Methods

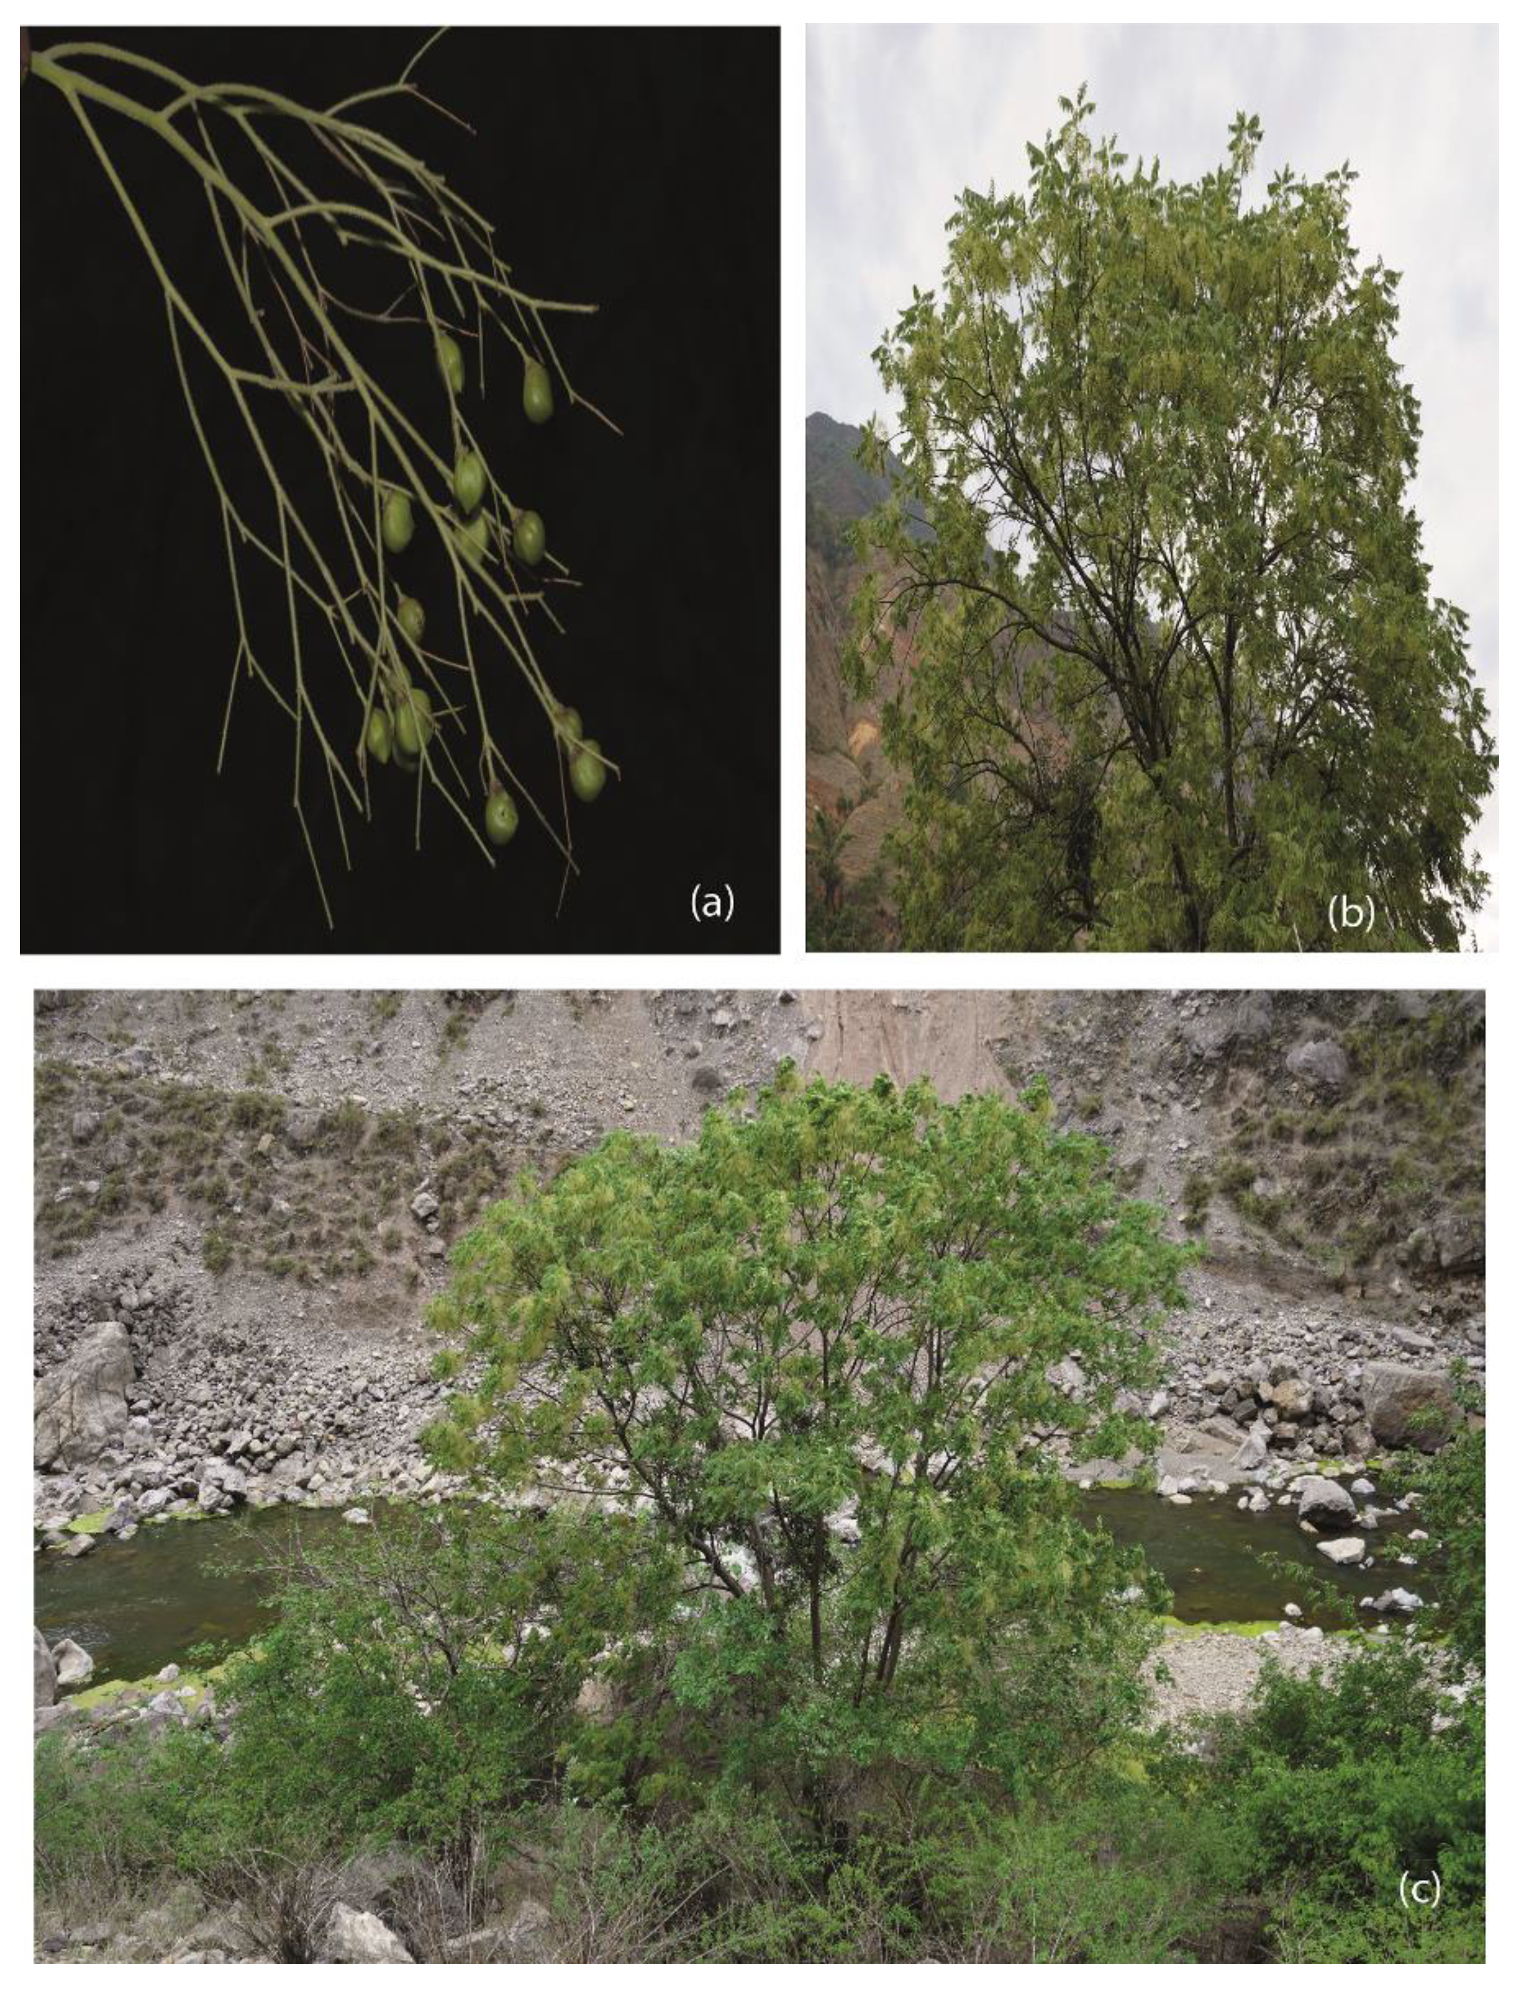
2.1. Study Area and Species Occurrence Records

G. forrestii is distributed in Guangxi, Sichuan, and Yunnan, with geographical coordinates of 100–108° E, 21–30° N. Yunnan has the most extensive distribution range around the hot-dry valley in Yuanjiang, Yunnan province. Most tree species in the study area are deciduous and are drought and hot tolerant, and the vegetation is classified as a semi-savanna [32]. For species occurrence and geographic distribution, we compiled data for the focal species from two sources: our field surveys and the Global Biodiversity Information Facility (https://www.gbif.org/). We used the keyword “Garuga forrestii” to search on GBIF (accessed on 16 September 2021) [34]. ENMs built from publicly available data sources can reach high accuracy [35]; however, there are a lot of possible drawbacks (e.g., coordinate imprecision and geographic biases) [36]. As a result, we kept those records that were reported to at least four decimal digits (accuracy of around 1 km) and eliminated redistributed and duplicated entries. We thinned the cleaned the remaining occurrence records at a 10 km resolution using the “spThin” v. 0.1.0 package in R v 3.6 [37] to reduce the impacts of spatial bias by uneven sampling [38]. We also employed kernel density estimations to detect and exclude outlying occurrences because the distribution range of our target species was uneven [39]. We used a broad bandwidth (about 111 km at the equator) and deleted records with a kernel density estimate of 0.05 to maximize the number of occurrences for model development and calibration. The remaining 24 records were used for model calibration and evaluation in the subsequent analyses (Figure 2, Table S1). Finally, the accessible area for Garuga forestii, M, was determined in ArcGIS v. 10.5 using a 150 km circular buffer, and only regions that overlapped the China mainland area were clipped.

2.2. Climate Data Acquisition and Processing

Climate data were obtained from the Worldclim2.1 database (http://www.worldclim.org; accessed on 16 September 2021) [40]. We downloaded 19 bioclimatic variables and an elevation layer using the 2.5 arc-minutes resolution. The potential evapotranspiration (PET) and aridity index (AI) were obtained from the CGIAR-CSI Global database (https://cgiarcsi.community/data/global-aridity-and-pet-database/; accessed on 23 November 2021) and added to the variables set since over large spatial scales, humidity influences the distribution of plants [41]. Together with the occurrence points, the potential distribution regions for G. forrestii in China were clipped to the extent of M for model calibration. Bioclimatic variables Bio 8, Bio 9, Bio 18 and Bio 19 have been reported to cause odd spatial artefacts in species distribution modelling and were, therefore, excluded from further analyses [42,43]. Moreover, since environmental variables are usually spatially correlated, Pearson’s correlation analysis was conducted in ENMTools v1.0 at a threshold of 0.7 [44,45] to avoid multicollinearity. Finally, nine environmental variables were selected for the MaxEnt model development and calibration (Tables S1 and S2).

2.3. Modeling Procedure and Performance Evaluation

The modelling of G. forrestii distribution in China was performed using MaxEnt v.3.4.4 [14] based on the species occurrence records and environmental variables. We used default parameters, except the number of background points = 10,000, and the algorithm runs at a number of iterations = 5000. Data partition was carried out by allocating 80% for model training and 20% for testing, then replicating the model runs 20 times. Jackknife tests were implemented to determine the most critical variables influencing the distribution of G. forrestii [14]. To evaluate the model performance, we used the area under the curve (AUC) values of the receiving operator characteristics (ROC) [46], the True Skill Statistics (TSS = sensitivity + specificity—1) [47,48], and a partial ROC (pROC) in R [49]. A higher AUC value obtained from the test points indicates that a model can better differentiate between conditions at occurrence and background localities [50]. The threshold-independent metric test AUC has been extensively used to evaluate MaxEnt model accuracy; AUC < 0.8—poor performance, between 0.8 and 0.9—moderate performance, and >0.9—excellent performance. The TSS was calculated using the R code MaxEnt TSS calculations (https://github.com/KarlssonCatharina/MaxEnt_TSS_calculations; accessed on 20 December 2020). In addition, to convert the logistic output files into presence-absence binary data (1/0), we used the ten-percentile training presence test omission threshold (E = 10%) [51,52].
To simulate the potential future distribution of G. forrestii and to account for the volatility related to regulatory impacts on the amount of current and future greenhouse emissions, we used two representative concentration pathways (RCPs) under climate change scenarios, one representing a best case, low-emissions scenario (RCP4.5), and another representing a worst case, high-emissions scenario (RCP8.5). We used the model outputs of one global circulation model (GCM): the National Center for Atmospheric Research’s (NCAR) Community Climate System Model v4 (CCSM4) (https://www.cesm.ucar.edu/models/ccsm4.0/; accessed on 10 January 2021) [53] of the climate projections from the Coupled Model Intercomparison Project Phase 5 (CMIP5) for two time periods; 2050 (average for 2061–2080) and 2070 (average for 2061–2080) [54]. All these layers had a spatial resolution of 2.5arcmin. We computed the mobility-oriented parity (MOP) metric as an alternative measure of uncertainty [55]. This metric (MOP) identifies locations where predictions were made based on model extrapolation. Under both scenarios, the median expected output produced from 20 replications of each period (2050 and 2070) was utilized for interpretation, and MOP estimates were computed to identify extrapolative regions.

2.4. Distribution Changes under Different Climatic Scenarios

The binary maps for the current and future periods were used to assess changes in habitat suitability for G. forrestii. We used SDMToolbox in ArcGIS v.10.5 to accomplish this analysis [56]. All maps presented in Figure 2, Figure 3, Figure 4, Figure 5 and Figure 6 were generated using ArcGIS v10.5.

3. Results

3.1. Evaluation of Model Performance and Variable Contribution

The results of the model for the G. forrestii were reliable following the AUC and TSS values (>0.79) and pROC (>1.5340), indicating a good prediction (Table 1, Figure S1). The nine environmental variables contributed differently to the distribution of G. forrestii. Bio4 (% contribution = 35.6% and Permutation importance = 16.7%), elevation (% contribution = 27.5% and Permutation importance = 42.7%), and Bio13 (% contribution = 12% and Permutation importance = 6.3%) were the three most significant environmental variables for the model forecasts, and their cumulative contribution was 75.1% of the total contribution (Table 2). The jackknife test revealed that when the variables PET, Bio7, and Bio4 were employed independently to estimate the potential distribution of G. forrestii under current conditions, they produced substantial gains (Figure S2). The response curves of the selected environmental variables showed that G. forrestii occurs mainly in areas with an elevation between 650 and 2500 m asl; PET between 1150 and 1600; AI between 0 and 9000; precipitation of driest quarter between 18 and 70 mm; precipitation seasonality between 40 and 120 mm; precipitation of the wettest month between 75 and 500 mm, whereas the annual temperature range was approximately −12.6–37.9 °C; an isothermality of between 40 and 44.

3.2. Current and Conditions of the Potential Distribution of G. forrestii

We conducted modelling and prediction under current and future climatic scenarios. As shown in Figure 3, our result represents our projections of suitable habitat for Garuga forrestii under current climate conditions, whereas Figure 4 represents future climate conditions. Our projections suggest that a considerable portion of the Yunnan region and southern Sichuan are appropriate habitats for G. forrestii. These regions correspond to most of the observed occurrences for the species. The total area representing the potential distribution of G. forrestii is 309,516.2 km2 (Table 3).

3.3. Future Climate Conditions of the Potential Distribution of G. forrestii

Under future climate change scenarios, the potential distribution for G. forrestii will decrease according to the model predictions (Figure 5). The forecasts for G. forrestii under RCP scenarios indicate a variety of distribution patterns and constant appropriate range shrinkage (Table 3). According to the model forecasts, the appropriate range of this species might decrease from 13.76% (RCP4.5 2070 scenario) to 19.99% (RCP8.5 2070 scenario). Under all RCP scenarios, we projected that environmental conditions suited for G. forrestii would shift to higher elevations and northward to southern parts of Sichuan province in 2050 and 2070 (Figure 5). In the western region of Guangxi, the potential distribution of G. forrestii will increase under RCP8.5 in 2050 and 2070. Results of the MOP analysis demonstrated that strict extrapolative regions in future estimates based on RCP4.5 and RCP8.5 scenarios in 2050 and 2070 occurred mainly in areas unsuitable for future distribution of G. forrestii (Figure 6).

4. Discussion

This study shows that ENMs are reliable tools to investigate and understand the factors influencing the potential distribution of species across levels [57,58]. The precise predictions of species diversity and composition are necessary for developing strategic management policies and conservation actions to avert biodiversity loss and related crises [59]. Over the last decade, many predictions have been made using this system for many organisms to assess the impact of climate change on biodiversity [60,61]. ENM studies rely on the widely adopted 19 bioclimatic variables from WorldClim—Global Climate Data as the key environmental factors for predicting habitat suitability, the spread of invasive species and species abundance distributions. Moreover, several new guidelines for appropriate niche model development have been made lately, including adequate thinning of occurrence data and sampling bias correction [38,62], consideration of a species’ accessible area for (M) [63] and use of multiple statistical criteria for variable selection [62,64]. In this study, we adequately followed the suggestions and produced robust models for G. forrestii, and the selected nine key environmental variables significantly improved model accuracy. Furthermore, for all the scenarios, the average AUC and TSS values were greater than 0.79, with a pROC above 1.5, indicating high confidence in the reliability of the models (Table 1). The MOP analysis revealed that our future models performed satisfactorily, with extrapolation occurring only in small areas outside the projected suitable ranges.
Based on the results, we found that the model can accurately define G. forrestii distribution in the known areas of occurrence. The most suitable habitat is mainly dispersed in the Jinsha river valley through Yunnan and Sichuan and the red river valley in Yunnan. These areas are characterized by high elevation, specifically together with the upper stream of the Jinshajiang. The results are consistent with the report on “The Subtropical Vegetation of Southwestern China” [32]. The river valleys (Sichuan and Yunnan) are classified under the savanna ecosystems. It experiences a hot-dry climate due to mountains’ rain-shadow effect, such as monsoon rainfall obstruction from the Indian Ocean by the Ailao Mountains and Wuliang Mountains, resulting in a hot-dry climate throughout the year [65], and valley-type savanna. They have a distinct six-month dry season; as a result, plant species in these savannas ecosystems have to adapt and tolerate different forms of drought with low or high temperatures and extreme irradiance across different seasons [66].
One of the main concerns in ecology and evolution is determining which environmental factor is responsible for shaping and maintaining a species geographical distribution. According to our analysis of the current distribution of G. forrestii, we observed that climate variables strongly influence species habitat distribution. Out of the nine environmental variables, elevation, temperature seasonality (Bio 4) and precipitation of the wettest month (Bio 13) accounted for about 75% of the total contribution in shaping the distribution of G. forrestii. Furthermore, the contribution rate of elevation was among the highest contributors to the modelled distribution of our focal species. This finding is consistent with Ranjitkar et al. [67], that changes in suitable habitats all over the distribution range in Yunnan were mainly associated with an altitudinal shift. In this case, G. forrestii inhabits forests with a wide distribution in Yunnan and a broad elevation range (700–2400 m a.s.l). Our result also agreed with [68] on the contributory influence of elevation to ENMs.
Our future forecasts revealed that the habitats suitable for G. forrestii distribution are threatened by anthropogenic activities and climate change. Although some parts of the entire area were deemed suitable in the current conditions, some regions were further reduced under the climate change scenarios. Specifically, the predictions indicated that climate change would cause about 17% net loss of suitable habitats in the study area under RCP4.5 in 2050 and about 20% under RCP8.5 in 2070 (Figure 5, Table 3). By the end of this century, global warming may result in a rise in temperature of 2–4 °C and hence an increased risk of heat stress and decline in species richness [69]. In the river valleys, the temperature rose significantly since 1961–2010, with a yearly temperature increase rate of 0.19 °C per decade, and in 1991–2010, annual temperature increase rate of 0.40 °C per decade [70]. The future climate scenarios used in this study estimated range shrinkage. Drought becomes more likely as temperatures rise, increasing the chance of extinction. A study on the western Australian flora predicted similar patterns, suggesting that increasing climate instability and stress associated with drought from climate change will be the chief determinant of species losses [71]. In 2050 and 2070, under both climate change scenarios, the potential distributions of G. forrestii shifted northward to southern sections of Sichuan province, in locations with higher precipitation and valleys at higher altitudes.

Insights into the Conservation of G. forrestii

It is clear that the environmental variables (both climatic and non-climatic) will have potential impacts on G. forrestii. The roles and impacts of anthropogenic activities contribute towards shaping biodiversity patterns and habitat loss in this region and could threaten the existence of G. forrestii species, despite it being listed as a species of “Least Concern” under the IUCN Red List of Threatened Species. There is a need to establish a more well-designed and integrated protection system, reinforce the protection of genetic diversity and devote more resources to propagating citizen science and environmental education in this region [72]. Furthermore, the hotspots regions in the future regions could be recommended for the in situ conservation programmes for the species.

5. Conclusions

Our study predicted the potential distribution of G. forrestii for the current and future (2050 and 2070) based on two climate change scenarios (RCP4.5 and RCP8.5). As the most suitable habitat, Yunnan is one of the biodiversity hotspots in China, with diverse and great species richness. However, the loss of biodiversity experienced is due to different factors brought about by climate change. Our results showed that the potential distribution area of suitable habitats for G. forrestii continues to decrease with the changing climate in the future.
This study is unique in that it defines ideal growing regions for G. forrestii. As a result, the maps generated could be considered baseline information for the focal species. This species would require an all-inclusive conservation strategy to maintain its current status as a “Least Concern” and avert its possible extinction in the future. Such conservation strategies would necessitate collaborative efforts between various stakeholders, e.g., the forest departments, government agencies, research institutes, as well as the active participation of the locals.

Supplementary Materials

The following are available online at https://www.mdpi.com/article/10.3390/f12121708/s1, Table S1: Occurrences used in building models for Garuga forrestii, Table S2: A Pearson’s Correlation (r = 0.7) matrix of the variables used in modelling the distribution of Garuga forrestii in MaxEnt, Figure S1: AUC results of the current distribution for Garuga forrestii, Figure S2: Jackknife tests for the potential distribution of Garuga forrestii under the current climate scenario.

Author Contributions

Conceptualization, B.B.T., H.W. and T.D.; methodology, B.B.T., B.K.N. and X.Z.; modelling and formal analysis, B.K.N.; investigation, and resources, X.Z. and H.Z.; data curation, H.Z., X.Z. and T.K.; writing—original draft preparation, B.B.T.; writing—review and editing, B.B.T. and B.K.N.; project administration, H.W.; funding acquisition, G.-Y.H. and T.D. All authors have read and agreed to the published version of the manuscript.

Funding

This study was supported by the Second Tibetan Plateau Scientific Expedition and Research program (2019QZKK0502), the Strategic Priority Research Program of the Chinese Academy of Sciences (XDA20050203), the Key Projects of the Joint Fund of the National Natural Science Foundation of China (U1802232).

Institutional Review Board Statement

Not applicable.

Informed Consent Statement

Not applicable.

Data Availability Statement

The data presented in this study are available in the Supplementary Data Section.

Acknowledgments

Our appreciation is expressed to Oyetola O. Oyebanji (KIB) and Dossa, G.G.O. (XTBG) for valuable comments.

Conflicts of Interest

The authors declare no conflict of interest.

References

  1. Singh, V.; Shukla, S.; Singh, A. The principal factors responsible for biodiversity loss. Open J. Plant Sci. 2021, 6, 011–014. [Google Scholar]
  2. Habibullah, M.S.; Din, B.H.; Tan, S.-H.; Zahid, H. Impact of climate change on biodiversity loss: Global evidence. Environ. Sci. Pollut. Res. 2021, 6, 011–014. [Google Scholar] [CrossRef]
  3. MacArthur, R.H. Geographical Ecology: Patterns in the Distribution of Species; Princeton University Press: Princeton, NJ, USA, 1984. [Google Scholar]
  4. Mantyka-Pringle, C.S.; Martin, T.; Rhodes, J.R. Interactions between climate and habitat loss effects on biodiversity: A systematic review and meta-analysis. Glob. Change Biol. 2012, 18, 1239–1252. [Google Scholar] [CrossRef] [Green Version]
  5. Newbold, T. Future effects of climate and land-use change on terrestrial vertebrate community diversity under different scenarios. Proc. R. Soc. B 2018, 285, 20180792. [Google Scholar] [CrossRef]
  6. Urban, M.C. Accelerating extinction risk from climate change. Science 2015, 348, 571–573. [Google Scholar] [CrossRef] [Green Version]
  7. Behroozian, M.; Ejtehadi, H.; Peterson, A.T.; Memariani, F.; Mesdaghi, M. Climate change influences on the potential distribution of Dianthus polylepis Bien. ex Boiss. (Caryophyllaceae), an endemic species in the Irano-Turanian region. PLoS ONE 2020, 15, e0237527. [Google Scholar] [CrossRef] [PubMed]
  8. Wagensommer, R.P.; Perrino, E.V.; Silletti, G.N. Carex phyllostachys CA Mey. (Cyperaceae) new for Italy and phytogeographical considerations. Phyton 2014, 54, 215–222. [Google Scholar]
  9. Garza, G.; Rivera, A.; Barrera, C.S.V.; Martinez-Ávalos, J.G.; Dale, J.; Arroyo, T.P.F. Potential Effects of Climate Change on the Geographic Distribution of the Endangered Plant Species Manihot walkerae. Forests 2020, 11, 689. [Google Scholar] [CrossRef]
  10. Ngarega, B.K.; Masocha, V.F.; Schneider, H. Forecasting the effects of bioclimatic characteristics and climate change on the potential distribution of Colophospermum mopane in southern Africa using Maximum Entropy (Maxent). Ecol. Inform. 2021, 65, 101419. [Google Scholar] [CrossRef]
  11. Peterson, A.T.; Soberón, J.; Pearson, R.G.; Anderson, R.P.; Martínez-Meyer, E.; Nakamura, M.; Araújo, M.B. Chapter Seven. Modeling Ecological Niches. In Ecological Niches and Geographic Distributions (MPB-49); Princeton University Press: Princeton, NJ, USA, 2011; pp. 97–137. [Google Scholar]
  12. Thuiller, W.; Albert, C.; Araújo, M.B.; Berry, P.; Cabeza, M.; Guisan, A.; Hickler, T.; Midgley, G.; Paterson, J.; Schurr, F.M.; et al. Predicting global change impacts on plant species’ distributions: Future challenges. Perspect. Plant Ecol. Evol. Syst. 2008, 9, 137–152. [Google Scholar] [CrossRef]
  13. Salako, G.; Oyebanji, O.O.; Olagunju, T.E.; Howe, G.T. Potential impact of climate change on the distribution of some selected legumes in Cameroon and adjoining Nigeria border. Afr. J. Ecol. 2021, 59, 959–975. [Google Scholar] [CrossRef]
  14. Phillips, S.J.; Anderson, R.P.; Schapire, R.E. Maximum entropy modeling of species geographic distributions. Ecol. Model. 2006, 190, 231–259. [Google Scholar] [CrossRef] [Green Version]
  15. Thomas, C. Climate, climate change and range boundaries. Divers. Distrib. 2010, 16, 488–495. [Google Scholar] [CrossRef]
  16. Robinson, N.M.; Nelson, W.A.; Costello, M.J.; Sutherland, J.E.; Lundquist, C.J. A Systematic Review of Marine-Based Species Distribution Models (SDMs) with Recommendations for Best Practice. Front. Mar. Sci. 2017, 4, 194. [Google Scholar] [CrossRef] [Green Version]
  17. Oyebanji, O.O.; Salako, G.; Nneji, L.; Oladipo, S.; Bolarinwa, K.; Chukwuma, E.; Ayoola, A.; Olagunju, T.; Ighodalo, D.; Nneji, I. Impact of climate change on the spatial distribution of endemic legume species of the Guineo-Congolian forest, Africa. Ecol. Indic. 2021, 122, 107282. [Google Scholar] [CrossRef]
  18. Mohn, R.A.; Oleas, N.H.; Smith, A.B.; Swift, J.F.; Yatskievych, G.A.; Edwards, C.E. The phylogeographic history of a range disjunction in eastern North America: The role of post-glacial expansion into newly suitable habitat. Am. J. Bot. 2021, 108, 1042–1057. [Google Scholar] [CrossRef]
  19. Nzei, J.M.; Ngarega, B.K.; Mwanzia, V.M.; Musili, P.M.; Wang, Q.-F.; Chen, J.-M. The past, current, and future distribution modeling of four water lilies (Nymphaea) in Africa indicates varying suitable habitats and distribution in climate change. Aquat. Bot. 2021, 173, 103416. [Google Scholar] [CrossRef]
  20. Ahmed, N.; Atzberger, C.; Zewdie, W. Species Distribution Modelling performance and its implication for Sentinel-2-based prediction of invasive Prosopis juliflora in lower Awash River basin, Ethiopia. Ecol. Process. 2021, 10, 8. [Google Scholar] [CrossRef]
  21. Merow, C.; Smith, M.J.; Silander, J.A., Jr. A practical guide to MaxEnt for modeling species’ distributions: What it does, and why inputs and settings matter. Ecography 2013, 36, 1058–1069. [Google Scholar] [CrossRef]
  22. Fois, M.; Fenu, G.; Cuena-Lombraña, A.; Cogoni, D.; Bacchetta, G. A practical method to speed up the discovery of unknown populations using Species Distribution Models. J. Nat. Conserv. 2015, 24, 42–48. [Google Scholar] [CrossRef]
  23. Pearson, R.G.; Raxworthy, C.J.; Nakamura, M.; Peterson, A.T. Predicting species distributions from small numbers of occurrence records: A test case using cryptic geckos in Madagascar. J. Biogeogr. 2007, 34, 102–117. [Google Scholar] [CrossRef]
  24. Erfanian, M.B.; Sagharyan, M.; Memariani, F.; Ejtehadi, H. Predicting range shifts of three endangered endemic plants of the Khorassan-Kopet Dagh floristic province under global change. Sci. Rep. 2021, 11, 9159. [Google Scholar] [CrossRef]
  25. Zizka, A.; Azevedo, J.A.R.; Leme, E.; Neves, B.; Da Costa, A.F.; Caceres, D.; Zizka, G. Biogeography and conservation status of the pineapple family (Bromeliaceae). Divers. Distrib. 2020, 26, 183–195. [Google Scholar] [CrossRef]
  26. Rej, J.E.; Joyner, T.A. Niche modeling for the genus Pogona (Squamata: Agamidae) in Australia: Predicting past (late Quaternary) and future (2070) areas of suitable habitat. PeerJ 2018, 6, e6128. [Google Scholar] [CrossRef] [Green Version]
  27. Smith, W.W. eFloras. Garuga forrestii. Notes Roy. Bot. Gard. Edinburgh. 1921, 13, 162. Available online: http://www.efloras.org/florataxon.aspx?flora_id=2&taxon_id=242323081 (accessed on 14 October 2021).
  28. Smith, W.W. EncyclopediaofLife. Garuga forrestii. Available online: https://eol.org/pages/2906865 (accessed on 17 October 2021).
  29. Shirwaikar, A.; Rajendran, K.; Barik, R. Effect of aqueous bark extract of Garuga pinnata Roxb. in streptozoto-cin-nicotinamide induced type-II diabetes mellitus. J. Ethnopharmacol. 2006, 107, 285–290. [Google Scholar] [CrossRef]
  30. Achmad, F.H.; Aty, W.; Arannya, P.D.; Nike, F.; Lidya, T.; Indah, S.T. In Vitro Antimalarial Activity Screening of Several Indonesian Plants Using HRP2 Assay. Int. J. Pharm. Pharm. Sci. 2014, 6, 125–128. [Google Scholar]
  31. Yin, S.W.; He, X.M.; Wang, B.G.; Xiao, Y.A. Chemical constituents from the twigs of Garuga forrestii. J. Trop. Subtrop. Bot. 2008, 16, 46–50. [Google Scholar]
  32. Tang, C.Q. Semi-Savannas in Hot-Dry Valleys. In The Subtropical Vegetation of Southwestern China: Plant Distribution, Diversity and Ecology; Springer: Dordrecht, The Netherlands, 2015; pp. 165–184. [Google Scholar]
  33. Hon, Y.; Botanic Gardens Conservation International (BGCI) & IUCN SSC Global Tree Specialist Group. Garuga forrestii. The IUCN Red List of Threatened Species 2019. Available online: https://www.iucnredlist.org/species/152839038/152839040 (accessed on 14 October 2021).
  34. GBIF. Occurrence Download. 2021, The Global Biodiversity Information Facility. Available online: https://doi.org/10.15468/dl.qfaum6 (accessed on 16 September 2021).
  35. Jackson, M.M.; Gergel, S.E.; Martin, K. Citizen science and field survey observations provide comparable results for map-ping Vancouver Island White-tailed Ptarmigan (Lagopus leucura saxatilis) distributions. Biol. Conserv. 2015, 181, 162–172. [Google Scholar] [CrossRef]
  36. Beck, J.; Böller, M.; Erhardt, A.; Schwanghart, W. Spatial bias in the GBIF database and its effect on modeling species’ geographic distributions. Ecol. Inform. 2014, 19, 10–15. [Google Scholar] [CrossRef]
  37. Aiello-Lammens, M.E.; Boria, R.A.; Radosavljevic, A.; Vilela, B.; Anderson, R.P. spThin: An R package for spatial thinning of species occurrence records for use in ecological niche models. Ecography 2015, 38, 541–545. [Google Scholar] [CrossRef]
  38. Boria, R.A.; Olson, L.E.; Goodman, S.M.; Anderson, R.P. Spatial filtering to reduce sampling bias can improve the performance of ecological niche models. Ecol. Model. 2014, 275, 73–77. [Google Scholar] [CrossRef]
  39. Gomes, V.H.; Ijff, S.D.; Raes, N.; Amaral, I.L.; Salomão, R.; Coelho, L.D.S.; Matos, F.D.D.A.; Castilho, C.V.; Filho, D.D.A.L.; López, D.C.; et al. Species Distribution Modelling: Contrasting presence-only models with plot abundance data. Sci. Rep. 2018, 8, 1003. [Google Scholar] [CrossRef]
  40. Fick, S.E.; Hijmans, R.J. WorldClim 2: New 1-km spatial resolution climate surfaces for global land areas. Int. J. Climatol. 2017, 37, 4302–4315. [Google Scholar] [CrossRef]
  41. Quan, C.; Han, S.; Utescher, T.; Zhang, C.; Liu, Y.-S. (Validation of temperature–precipitation based aridity index: Paleoclimatic implications. Palaeogeogr. Palaeoclim. Palaeoecol. 2013, 386, 86–95. [Google Scholar] [CrossRef]
  42. Ashraf, U.; Peterson, A.T.; Chaudhry, M.N.; Ashraf, I.; Saqib, Z.; Rashid Ahmad, S.; Ali, H. Ecological niche model comparison under different climate scenarios: A case study of Olea spp. in Asia. Eco-sphere 2017, 8, e01825. [Google Scholar] [CrossRef]
  43. Bede-Fazekas, Á.; Somodi, I. The way bioclimatic variables are calculated has impact on potential distribution models. Methods Ecol. Evol. 2020, 11, 1559–1570. [Google Scholar] [CrossRef]
  44. Graham, M.H. Confronting Multicollinearity in Ecological Multiple Regression. Ecology 2003, 84, 2809–2815. [Google Scholar] [CrossRef] [Green Version]
  45. Warren, D.L.; Matzke, N.J.; Cardillo, M.; Baumgartner, J.B.; Beaumont, L.J.; Turelli, M.; Glor, R.E.; Huron, N.A.; Simões, M.; Iglesias, T.L.; et al. ENMTools 1.0: An R package for comparative ecological biogeography. Ecography 2021, 44, 504–511. [Google Scholar] [CrossRef]
  46. Phillips, S.J.; Dudík, M. Modeling of species distributions with Maxent: New extensions and a comprehensive evaluation. Ecography 2008, 31, 161–175. [Google Scholar] [CrossRef]
  47. Allouche, O.; Tsoar, A.; Kadmon, R. Assessing the accuracy of species distribution models: Prevalence, kappa and the true skill statistic (TSS). J. Appl. Ecol. 2006, 43, 1223–1232. [Google Scholar] [CrossRef]
  48. Liu, C.; White, M.; Newell, G. Measuring and comparing the accuracy of species distribution models with presence-absence data. Ecography 2011, 34, 232–243. [Google Scholar] [CrossRef]
  49. Peterson, A.T.; Papeş, M.; Soberon, J. Rethinking receiver operating characteristic analysis applications in ecological niche modeling. Ecol. Model. 2008, 213, 63–72. [Google Scholar] [CrossRef]
  50. Muscarella, R.; Galante, P.J.; Soley-Guardia, M.; Boria, R.A.; Kass, J.M.; Uriarte, M.; Anderson, R.P. ENM eval: An R package for conducting spatially independent evaluations and estimating optimal model complexity for Maxent ecological niche models. Methods Ecol. Evol. 2014, 5, 1198–1205. [Google Scholar] [CrossRef]
  51. Guisan, A.; Thuiller, W.; Zimmermann, N.E. Habitat Suitability and Distribution Models: With Applications in R.; Cambridge University Press: Cambridge, UK, 2017. [Google Scholar]
  52. Liu, C.; Newell, G.; White, M. On the selection of thresholds for predicting species occurrence with presence-only data. Ecol. Evol. 2016, 6, 337–348. [Google Scholar] [CrossRef] [Green Version]
  53. Gent, P.R.; Danabasoglu, G.; Donner, L.J.; Holland, M.M.; Hunke, E.C.; Jayne, S.; Lawrence, D.; Neale, R.B.; Rasch, P.J.; Vertenstein, M.; et al. The Community Climate System Model Version. J. Clim. 2011, 24, 4973–4991. [Google Scholar] [CrossRef]
  54. Collins, M.; Knutti, R.; Arblaster, J.; Dufresne, J.L.; Fichefet, T.; Friedlingstein, P.; Gao, X.; Gutowski, W.J.; Johns, T.; Krinner, G.; et al. Long-Term Climate Change: Projections, Commitments and Irreversibility. In Climate Change 2013-The Physical Science Basis: Contribution of Working Group I to the Fifth Assessment Report of the Intergovernmental Panel on Climate Change; Cambridge University Press: Cambridge, UK, 2013; pp. 1029–1136. [Google Scholar]
  55. Owens, H.; Campbell, L.P.; Dornak, L.L.; Saupe, E.; Barve, N.; Soberon, J.; Ingenloff, K.; Lira-Noriega, A.; Hensz, C.M.; Myers, C.E.; et al. Constraints on interpretation of ecological niche models by limited environmental ranges on calibration areas. Ecol. Model. 2013, 263, 10–18. [Google Scholar] [CrossRef]
  56. Brown, J.L. SDM toolbox: A python-based GIS toolkit for landscape genetic, biogeographic and species distribution model analyses. Methods Ecol. Evol. 2014, 5, 694–700. [Google Scholar] [CrossRef]
  57. Ellis, C.J. Predicting the biodiversity response to climate change: Challenges and advances. Syst. Biodivers. 2011, 9, 307–317. [Google Scholar] [CrossRef]
  58. Pearson, R.G.; Dawson, T.P. Predicting the impacts of climate change on the distribution of species: Are bioclimate envelope models useful? Glob. Ecol. Biogeogr. 2003, 12, 361–371. [Google Scholar] [CrossRef] [Green Version]
  59. Pinto-Ledezma, J.N.; Cavender-Bares, J. Predicting species distributions and community composition using satellite remote sensing predictors. Sci. Rep. 2021, 11, 16448. [Google Scholar] [CrossRef]
  60. Bosso, L.; Luchi, N.; Maresi, G.; Cristinzio, G.; Smeraldo, S.; Russo, D. Predicting current and future disease outbreaks of Diplodia sapinea shoot blight in Italy: Species distribution models as a tool for forest management planning. For. Ecol. Manag. 2017, 400, 655–664. [Google Scholar] [CrossRef]
  61. Kafash, A.; Ashrafi, S.; Ohler, A.; Yousefi, M.; Malakoutikhah, S.; Koehler, G.; Schmidt, B.R. Climate change produces winners and losers: Differential responses of amphibians in mountain forests of the Near East. Glob. Ecol. Conserv. 2018, 16, e00471. [Google Scholar] [CrossRef]
  62. Warren, D.L.; Wright, A.N.; Seifert, S.N.; Shaffer, H.B. Incorporating model complexity and spatial sampling bias into ecological niche models of climate change risks faced by 90 California vertebrate species of concern. Divers. Distrib. 2014, 20, 334–343. [Google Scholar] [CrossRef]
  63. Barve, N.; Barve, V.; Jiménez-Valverde, A.; Lira-Noriega, A.; Maher, S.; Townsend Peterson, A.; Soberon, J.; Villalobos, F. The crucial role of the accessible area in ecological niche modeling and species distribution modeling. Ecol. Model. 2011, 222, 1810–1819. [Google Scholar] [CrossRef]
  64. Feng, X.; Park, D.S.; Liang, Y.; Pandey, R.; Papeş, M. Collinearity in ecological niche modeling: Confusions and challenges. Ecol. Evol. 2019, 9, 10365–10376. [Google Scholar] [CrossRef] [PubMed] [Green Version]
  65. Wu, Z.; Zhu, Y.; Jiang, H. The Vegetation of Yunnan; Science Press: Beijing, China, 1987; p. 781. [Google Scholar]
  66. Zhu, J.-J.; Zhang, J.-L.; Liu, H.-C.; Cao, K.-F. Photosynthesis, non-photochemical pathways and activities of antioxidant enzymes in a resilient evergreen oak under different climatic conditions from a valley-savanna in Southwest China. Physiol. Plant. 2009, 135, 62–72. [Google Scholar] [CrossRef]
  67. Ranjitkar, S.; Sujakhu, N.M.; Lu, Y.; Wang, Q.; Wang, M.; He, J.; Mortimer, P.E.; Xu, J.; Kindt, R.; Zomer, R. Climate modelling for agroforestry species selection in Yunnan Province, China. Environ. Model. Softw. 2016, 75, 263–272. [Google Scholar] [CrossRef]
  68. Keppel, G.; Robinson, T.P.; Wardell-Johnson, G.W.; Yates, C.J.; Van Niel, K.P.; Byrne, M.; Schut, A.G. A low-altitude mountain range as an important refugium for two narrow endemics in the Southwest Australian Floristic Region biodiversity hotspot. Ann. Bot. 2016, 119, 289–300. [Google Scholar] [CrossRef] [Green Version]
  69. Corlett, R.T. Impacts of warming on tropical lowland rainforests. Trends Ecol. Evol. 2011, 26, 606–613. [Google Scholar] [CrossRef] [PubMed]
  70. Zhen-Feng, M.; Jia, L.; Shu-Qun, Y. Climate Change in Southwest China during 1961–2010: Impacts and Adaptation. Adv. Clim. Chang. Res. 2013, 4, 223–229. [Google Scholar] [CrossRef]
  71. Fitzpatrick, M.C.; Gove, A.D.; Sanders, N.J.; Dunn, R.R. Climate change, plant migration, and range collapse in a global biodiversity hotspot: The Banksia (Proteaceae) of Western Australia. Glob. Chang. Biol. 2008, 14, 1337–1352. [Google Scholar] [CrossRef]
  72. Qian, L.-S.; Chen, J.-H.; Deng, T.; Sun, H. Plant diversity in Yunnan: Current status and future directions. Plant Divers. 2020, 42, 281–291. [Google Scholar] [CrossRef] [PubMed]
Figure 1. Landscape and botanical features of Garuga forrestii in China: (a) fruits; (b,c) trees in bloom and tree form in Yunnan.
Forests 12 01708 g001
Figure 2. Map showing the current occurrence records and elevation of the study area and the areas accessible (M) to Garuga forrestii through natural dispersal.
Forests 12 01708 g002
Figure 3. Predicted habitat suitability of Garuga forrestii under current climatic conditions.
Forests 12 01708 g003
Figure 4. Predicted habitat suitability of Garuga forrestii under future climatic conditions—(a) RCP4.5 scenario (2050), (b) RCP8.5 scenario (2050), (c) RCP4.5 scenario (2070) and (d) RCP8.5 scenario (2070).
Forests 12 01708 g004
Figure 5. Predicted shifts of ranges in habitat suitability of Garuga forrestii as projected by MaxEnt models between current and future climate scenarios. (a) RCP4.5 scenario (2050), (b) RCP8.5 scenario (2050), (c) RCP4.5 scenario (2070) and (d) RCP8.5 scenario (2070). Green shows areas that will become suitable in the future; blue areas are expected to remain unchanged under future climates. In contrast, the red regions are expected to become unsuitable in the future.
Forests 12 01708 g005
Figure 6. Changes in strictly extrapolative areas under future climate change of Garuga forrestii for (a) RCP4.5 scenario (2050), (b) RCP8.5 scenario (2050), (c) RCP4.5 scenario (2070) and (d) RCP8.5 scenario (2070). Colour shades indicate the level of agreement of strictly extrapolative areas. Blue shows areas extending outside the suitable areas, green denotes the unsuitable areas, orange indicates the suitable areas and red shows the areas lost in the suitable range.
Forests 12 01708 g006
Table 1. Environmental variables and their percent contributions and permutation importance used in building the final MaxEnt models for Garuga forrestii.
VariableDescription% ContributionPermutation Importance
Bio3Isothermality (BIO2/BIO7) (×100)9.212.6
Bio4Temperature Seasonality (standard deviation × 100)35.6 *16.7 *
Bio7Temperature Annual Range (BIO5-BIO)0.30.3
Bio13Precipitation of Wettest Month12 *6.3 *
Bio15 Precipitation Seasonality (Coefficient of Variation)1.52.9
Bio17Precipitation of Driest Quarter10.29.1
ElevAltitude (m)27.5 *42.7 *
PETPotential Evapotranspiration1.72.8
AIAridity Index27
* Variable with highest contribution and importance.
Table 2. Model evaluation statistics of the mean AUC, TSS and pROC. Standard deviation in parentheses.
PeriodCurrentRCP4.5RCP8.5
2050207020502070
AUC (SD)0.932 (0.016)0.939 (0.019)0.943 (0.012)0.941 (0.017)0.937 (0.019)
TSS0.8350.7960.8420.8810.857
pROC1.620 (0.004)1.583 (0.005)1.534 (0.003)1.592 (0.005)1.609 (0.004)
10 PTP0.24480.23710.25190.28240.2721
AUC—Area under the curve, SD—Standard deviation, pROC-partial Receiver operating curve, 10PTP—10 Percentile Training Presence Threshold.
Table 3. Estimated range change for Garuga forrestii under RCP4.5 and RCP8.5 for 2050 and 2070.
ScenarioStable Range ExpansionRange Contraction
Area (km2)%Area (km2)%Area (km2)%
Current309,516.2
RCP4.5 2050256,691.2282.935013.571.6252,825.0317.07
RCP4.5 2070266,948.8886.257337.882.3742,567.3613.76
RCP8.5 2050249,430.1880.594168.381.3560,086.0719.41
RCP8.5 2070247,643.7380.005032.781.6261,872.5219.99
Publisher’s Note: MDPI stays neutral with regard to jurisdictional claims in published maps and institutional affiliations.

