Article

Highlighting Complex Long-Term Succession Pathways in Mixed Forests of the Pacific Northwest: A Markov Chain Modelling Approach

1
Institute for Multidisciplinary Applied Biology (IMAB), Department of Sciences, Public University of Navarre (UPNA), 31006 Pamplona, Spain
2
Faculty of Forestry, University of British Columbia, Vancouver, BC VT6 1Z4, Canada
*
Author to whom correspondence should be addressed.
Deceased.
Forests 2021, 12(12), 1770; https://doi.org/10.3390/f12121770
Submission received: 26 October 2021 / Revised: 2 December 2021 / Accepted: 9 December 2021 / Published: 14 December 2021
(This article belongs to the Special Issue Modelling Forest Ecosystems)

Abstract

:
Forest succession is an ecological phenomenon that can span centuries. Although the concept of succession was originally formulated as a deterministic sequence of different plant communities by F. Clements more than a century ago, nowadays it is recognized that stochastic events and disturbances play a pivotal role in forest succession. In spite of that, forest maps and management plans around the world are developed and focused on a unique “climax” community, likely due to the difficulty of quantifying alternative succession pathways. In this research, we explored the possibility of developing a Markov Chain model to study multiple pathway succession scenarios in mixed forests of western red cedar, hemlock and Pacific silver fir on northern Vancouver Island (western Canada). We created a transition matrix using the probabilities of change between alternative ecological stages as well as red cedar regeneration. Each ecological state was defined by the dominant tree species and ages. Our results indicate that, compared to the traditional Clementsian, deterministic one-pathway succession model, which is unable to replicate current stand distribution of these forests in the region, a three-pathway stochastic succession model, calibrated by a panel of experts, can mimic the observed landscape distribution among different stand types before commercial logging started in the region. We conclude that, while knowing the difficulty of parameterizing this type of models, their use is needed to recognize that for a given site, there may be multiple “climax” communities and hence forest management should account for them.

1. Introduction

Forest succession is an ecological phenomenon that, while having been long recognized, is still hard to adequately characterize and integrate into management practices [1]. After many decades of research, the mechanisms underlying species replacement and successional change in plant communities are still fiercely debated [2]. Forest succession depends on how communities change over time, what type of disturbances occur, the relative role of early- and late-colonizing species, and life-history characteristics of plant species [3]. In particular, there has been a recognition that spatial scale is an important factor in forest succession [4]. In addition, long periods are usually needed to appreciate and document vegetation changes in forest ecosystems. Both facts together indicate that studying forest succession empirically becomes complex [5].
When studying forest succession, the complexity is further increased due to the importance of random or fortuitous events, such as the occurrence of stand-replacing disturbances (i.e., wildfires, windstorms) or the stochastic nature of seed distribution, seedling survival and tree establishment [6]. However, despite recognizing that forest succession mechanisms have a stochastic nature, in many regions around the world, ecological zonation and mapping are carried out only with a focus on climax communities. This somehow ignores that such ecological classification implicitly assumes a Clementsian (non-stochastic) succession process [7]. When large time and spatial scales are considered, random events are less important [8]. Therefore, ecological classification and mapping of large regions may not be much influenced by the underlying assumptions of stochastic vs. non-stochastic succession patterns [9]. However, understanding the relative importance of such processes becomes much more imperative when ecological classification and mapping of climax communities are used as the benchmark for sustainable forest management plans.
One of the main features of sustainable forest management is to maintain forests and their associated ecological values inside their natural variability ranges, which are defined by historical observations [10]. To do so, successional mechanisms should be accurately understood [11], and its stochastic nature embraced. This is particularly important when managing mixed forests, as their successional processes are influenced by intra- and inter-specific competition and species-specific features [12].
As understanding of successional processes expanded, alternatives to deterministic (Clementsian) successional models were created [13,14,15]. These alternative models were based on the stochastic nature of both ecological disturbances and forest regeneration processes. Such models inherently accept that there is not a fixed climax community, but several potential climax communities that may be present in the same region. These alternatives depend on a chain of stochastic events that happened in the past and influenced current vegetation distribution. Hence, a useful tool to explore the alternative climax communities that could appear in a given region are stochastic succession models [16], such as Markov Chain models.
A Markov Chain model consists of a set of ecological states and a set of transitions between these states. Each transition has an associated probability of occurrence. The transition probabilities are summarized in what is called a transition matrix [17] (Figure 1). Therefore, in a first-order Markov Chain model, the ecological state of an ecosystem depends only on the previous state.
The transitions between ecological states define the distribution of the states in the next time interval or computational iteration. Compared to other process-based approaches to model forest succession at landscape level (e.g., FATES [18], FORMIND [19], LANDIS-II [20], Forest Vegetation Simulator [21]), Markov Chain models stand out for their simplicity, as there are no ecophysiological parameters that need to be estimated, only probabilities for transitioning between ecological states. Hence, Markovian models do not involve an explicit recognition of the mechanisms or the determinants of the ecological transitions. They are purely based on estimates of the probabilities that any given state will transform into different ecological states over the next iteration of the model (Figure 1). They are, therefore, empirically based models [22,23]. In addition, Markov Chain models can be formally studied with probability theory, as they simulate environmental changes that are inherently a sequence of conditional probabilities.
However, Markov Chain models are not adequate for simulating systems in which there are a multitude of different states (such as complex landscapes), as the transition matrix quickly becomes too complex. Similarly, if the time interval is too short, Markov Chain models are not appropriate because the transitions in short time spans cannot always be considered random, but rather deterministically related in time [24]. Therefore, Markov Chain models are ideal to simulate changes in vegetation dynamics of systems that involve a low number of possible ecological states over long periods. Such a feature makes these models ideal to explore the successional mechanisms that may have created the pre-logging landscape in a relatively homogeneous region such as the mixed temperate conifer forests on northern Vancouver Island (western Canada).
In this region, forest management plans must be based on the ecological classification map of British Columbia [6]. On northern Vancouver Island, difficulties for regenerating stands after clearcutting have been routinely reported for decades by logging companies in mixed old growth forests of western red cedar (Thuja plicata Donn ex D. Don) and western hemlock (Tsuga heterophylla (Raf.) Sarge), usually abbreviated as CH in Canadian forestry literature (from cedar-hemlock). However, such issues have not been reported in nearby sites with western hemlock mixed with Pacific silver fir (Abies amabilis Douglas ex J. Forbes) sites, usually abbreviated as HA (from Hemlock-Amabilis fir) [25,26].
The relationships between these stand types have been studied for over 40 years [27], usually from the perspective of converting CH sites into HA stands by means of forest management. The assumption was that CH and HA sites are found in similar sites due to successional processes. This assumption was originally supported by observations of the landscape mosaic created by the distribution of these sites on mesic and mesotrophic sites, which shows sharp boundaries between stand types [25]. Based on this working hypothesis, during the 1980s and early 1990s the Salal Cedar Hemlock Integrated Research Program (SCHIRP) was managed by the British Columbia Ministry of Forests and Range.
Over time, several explanations have been offered for the coexistence of these forest types. Lewis’ [27] original hypothesis followed a traditional Clementsian model in which HA sites evolve into CH in absence of disturbance. After Lewis’ hypothesis was formulated, differences in humus forms between stand types due to poor drainage were described [28]. Then, differences between sites in terms of nutrient availability were reported [29], and later on, differences among sites in soil oxygen availability were detected [30,31]. However, there has been no conclusive evidence of differences among stand types due to parent material, soil chemistry or topography [32,33,34]. Nevertheless, further studies provided evidence that multiple stable forest types (stand replacing) could develop in the same site, depending on the combination of disturbance intensity, timing and stand composition [16,26].
All these evidences point to the fact that dominant tree species influence site properties, rather than the opposite. Based on this, an alternative multiple pathway succession model was suggested [26]. Unfortunately, the ecological and management implications of such model have not been tested yet in a formal manner.
Our initial hypothesis is that a multiple pathway succession model for these forests is a better representation of natural successional processes than a deterministic Clementsian model. To test this hypothesis, a Markov Chain model was developed to describe the main states of the CH-HA system and their relative distribution in the landscape. The objective of this work was to clarify the key processes involved in the HA to CH transition as described in previous research [16,26,33,34], and to explore the sensitivity of the conceptual model presented by [26] to assumptions about transition probabilities. First, the model is described and values for the transition probabilities are proposed. Then, the model is used to examine several sets of probabilities to infer the combination that might better mimic the regional stand type distribution observed before logging started. The current distribution is the result of natural disturbances and succession processes taking place over the past 3000 years.
Hence, the purpose of this paper is not to provide a definitive or numerical validation of the conceptual model presented by [26], neither to provide a calibrated model for accurate quantitative assessments of current landscape dynamics. Rather, our objective is to explore what are the key ecological processes that dominate the complex natural stochastic successional processes in this region. In other words, through a sensitivity analysis, we aim to explore what are the “bottlenecks” in the transition from HA to CH and what probabilities of these key transitions would be consistent with the scarce historical evidence available [35] on the historical patterns of colonization by CH stands of zonal sites on northern Vancouver Island.

2. Materials and Methods

2.1. Region Description

The study area is located between the towns of Port McNeill and Port Hardy, on northern Vancouver Island (British Columbia, western Canada; Figure 2). The area is classified as the very wet maritime subzone of the Coastal Western Hemlock biogeoclimatic zone (CWH) [36]. The climate in this region is maritime, with cool moist summers and mild winters. Most precipitation (~65%) occurs as rain between October and February, reaching ~1700 mm/year. Daily average temperatures range from 2.4 °C in January to 13.8 °C in August, with a mean annual temperature of 7.9 °C. Geologically, the surface material is deep unconsolidated morainal and fluvial outwash materials, overlying sedimentary Cretaceous rocks and relatively soft volcanic materials [25].
Vegetation distribution is mostly influenced by bedrock type and topography. The dominant ecological disturbances are windstorms, as wildfires are almost non-existent or have return times from several centuries to millennia [37,38]. Forests are dominated by western hemlock, Pacific silver fir, and western red cedar, sometimes appearing lodgepole pine (Pinus contorta var. contorta Doug.) on poorly drained sites and Sitka spruce (Picea sitchensis (Bong.) Carr.) on the coast. Natural forests in this region mostly belong to two types: secondary mixed forests of western hemlock and Pacific silver fir (HA), and old growth western red cedar stands in which western hemlock is present (CH) [25].
On northern Vancouver Island, about 100,000 hectares (29% of the forested area) is currently occupied by cedar-hemlock (CH) stands [29]. These stands are usually uneven-aged, dominated by old western hemlock and western red cedar trees [25]. The canopy is vertically heterogeneous and relatively open, allowing enough light penetration to support a vigorous shrub layer dominated by salal (Gaultheria shallon Pursh), a tall ericaceous shrub [31].
Figure 2. Region of study in northern Vancouver Island (black rectangle), and its location in the western coast of Canada.
Forests 12 01770 g002
Stands dominated by Hemlock-Amabilis fir (HA) account for approximately 50% of forest surface in the region (175,000 ha). This stand type is usually fully stocked with a closed, vertically uniform canopy that only allows a small fraction of light to reach the ground. Stands are dominated by tall Pacific silver (amabilis) fir and slender western hemlock trees, with a minor presence of western red cedar. Stand-replacing windthrows are more likely as HA stands become old. In fact, most of the HA stands in the study area were established following a catastrophic windstorm in 1906, although both younger and older HA stands can be found disseminated across the landscape [25].

2.2. Succesion Models

In the Clementsian deterministic succession model (as formulated by Lewis), young HA stands composed of hemlock and fir reach the stem exclusion phase (sensu [39]). Then, the gaps formed by wind allow the establishment of red cedar seedlings, creating the hemlock-amabilis fir (cedar) stand type, or HA(C). As trees age, the old growth phase of original HA stands becomes a mixture of cedar-hemlock (CH) and Hemlock-Amabilis fir (HA). As old trees are infected by dwarf mistletoe (Arceuthobium spp. M. Bieb), their susceptibility to wind increases and eventually a self-maintaining CH stand develops in the absence of intense stand-replacing windstorms (Figure 3).
In the proposed stochastic multiple pathway model [26], succession is also determined by wind frequency and intensity, but also by the presence of western red cedar seedlings above a certain threshold in HA stands, and with an important presence of salal and dwarf mistletoe (Figure 4). When a given site starts as a young HA forest, if there is no red cedar recruitment (or seedlings do not survive), the stand can become first mature and then old growth HA in the continued absence of windstorms (Figure 4). However, if red cedar seedlings survive, but account for less than 15% of the stand basal area, the stand will become young and then mature HA(C) (Figure 4). On the other hand, if there are disturbances, the stand can develop towards a CH stand. However, if there is a strong regeneration of red cedar in the HA stand (more than 15% of the basal area composed by red cedar saplings), the stand may become a mature, and eventually old growth, CH stand. Windstorms could move old growth stands back into young CH stands (Figure 4), but once a site is a CH stand, it is unlikely to return to HA through natural disturbance, as western red cedar seedlings will establish vigorously under other trees [26].
This stochastic model is implemented here as a Markov Chain model (Figure 5), composed by a series of successional states corresponding to the different possible stand types. Ecosystem stages are defined based on the dominant species, the dominant stand age and the presence of red cedar regeneration (Table 1). The transformation of one ecological stage to another one is called a transition (Table 2), and each transition is defined by the probability that such transformation may happen. In Markov Chain models, these probabilities are required input parameters. We assume a first-order model (the future state only depends on the present) and an ergodic structure in which transition probabilities are constant through space and time [40].
Figure 4. Alternative, multiple-pathway succession process proposed by [26] for zonal sites on northern Vancouver Island. Adapted with permission from Ref [41]. © 2004 Prentice Hall.
Forests 12 01770 g004
Table 1. Ecological stages (stand types by stand age) in which the forest can be in a given time.
AcronymEcosystem Stage (Stand Type)
HAyWestern hemlock—Pacific silver fir young stands (stand age < 100 years)
HAmWestern hemlock—Pacific silver fir mature stands (stand age 100–200 years)
HAoWestern hemlock—Pacific silver fir old-growth stands (stand age > 200 years)
HA(C)yWestern hemlock—Pacific silver fir young stand (stand age < 100 years) with ≤ 15% basal area as red cedar regeneration
HA(C)mWestern hemlock—Pacific silver fir mature stands (stand age 100–200 years) with ≤ 15% basal area as red cedar regeneration
HA(C)oWestern hemlock—Pacific silver fir old growth stands (stand age > 200 years) with ≤ 15% basal area as red cedar regeneration
CHyRed cedar—Western hemlock young stands (stand age < 100 years)
CHmRed cedar—Western hemlock mature stands (stand age 100–200 years)
CHoRed cedar—Western hemlock old growth stands (stand age > 200 years)
Table 2. Different transitions used to simulate the chain of stochastic events. For their location in the model, see Figure 5.
TransitionEvent
P1HAy will blow down to become HAy; otherwise becomes HAm
P2HAy and HAm will have no red cedar regeneration after windthrow, therefore they become HAy
P3HAy will have >0 but ≤15% stand basal area of red cedar regeneration windthrow and become HA(C)y
P4HAm will blow down to become HAy; otherwise become HAo
P5HAm will undergo gap formation
P6HAm will have >0 but ≤15% stand basal area red cedar regeneration windthrow and become HA(C)y
P7HAo will undergo gap formation
P8HAo gaps will have no red cedar regeneration and remain HAo
P9HAo gaps will recruit red cedar and become HA(C)m.
P10HAo gaps will recruit red cedar and become HA(C)o
P11HAo will blow down and become HAy
P12HA(C)y will blow down and remain HA(C)y
P13HA(C)y will recruit > 15% red cedar after blow down and become CHy
P14HA(C)m will blow down
P15HA(C)m undergoes gap formation
P16HA(C)m will blow down and become HA(C)y
P17HA(C)m will blow down, recruit > 15% basal area of red cedar and become CHy
P18HAo will undergo gap formation
P19HA(C)o remains HA(C)o after gap formation
P20HA(C)o recruits > 15% red cedar after gap formation and becomes CHo
P21HA(C)o will blow down and become HA(C)y
P22HA(C)y, HA(C)m and HA(C)o all lose their red cedar regeneration and become HAy after windthrow
P23HAy and HAm recruit > 15% basal area of red cedar after windthrow and become CHy
P24CHy will blow down
P25CHm will blow down
P26CHy and CHm will become CHy after windthrow
P27CHo undergoes gap formation and remains CHo
P28CHo will blow down
The model is constructed around three major successional pathways, as suggested by [26] (Figure 5). The model can also be considered as containing the Clementsian model, as the CHo (the climax stage in the Clementsian model; Figure 3), it is also the point of convergence of the pathways 1 and 2 through the transitions P10 and P20 (Figure 4 and Figure 5). The ecosystem stages are connected among them depending on the chain of events (Table 2) that happened during stand development, such events are defined as stochastic, and are dependent on a series of probabilities.
Figure 5. States and transitions of the multiple pathway hypothesis of succession in zonal sites on northeastern Vancouver Island. Adapted with permission from Ref [26]. © 2014 the Authors.
Forests 12 01770 g005
The key probabilities included in the model are particularized for stand type, generating the transition list in Table 2. Probabilities are defined as follows:
  • WindSusc: Probability that a stand will suffer stand-replacing wind disturbance during a major wind event.
  • Cinv≤15: Probability that red cedar regeneration will account for ≤15% basal area of the stand following stand-replacing wind disturbance.
  • Cinv>15: Probability that red cedar regeneration will account for >15% basal area of the stand following stand-replacing wind disturbance.
  • Csuc≤15: Probability that red cedar will regenerate ≤15% basal area of the stand during post wind disturbance succession.
  • Csuc>15: Probability that red cedar will regenerate >15% basal area of the stand during post wind disturbance succession.
  • Gap: Probability that major wind disturbance will result in gap formation rather than stand replacement, mostly due to mistletoe weakening tree stems.
  • CinvGap≤15: Probability that red cedar will regenerate ≤15% basal area of the gap area following gap creation.
  • CinvGap>15: Probability that red cedar will regenerate >15% basal area of the gap area following gap creation.
The user initializes the model by indicating the initial proportion of the region occupied by each ecological stage (stand type) 3000 years before commercial logging started. The user can initiate the model from any desired starting state. This is defined in the model with a given value of the parameter Init for each stand type identified in the conceptual model (Table 1, Figure 4). In our case, for all the model runs described below, initial conditions were the same, as it was assumed that the zonal sites were occupied equally by HAy, HAm and HAo, each covering 33.3% of the area at the beginning of the simulations. Preliminary tests indicated very low model sensitivity to these proportions, as after a few iterations any given combination of initial HA stand types reached very similar results.
The model is parameterized with the probabilities of regeneration of red cedar, taking into account the availability of seed, broken branches, layering or fallen trees that provide vegetative regeneration development, light availability and the relative shade tolerance of red cedar germinants and vegetative regeneration. This set of probabilities constitutes the transition matrix that parameterizes a Markov Chain model. The probabilities of the different transitions were initially based on field data [25,26,33,34] and through consultation with a panel composed by local experts. The expert panel had proven field experience on wind, regeneration ecology and management of these forests, and they all are well-respected scientists and professional foresters in British Columbia (western Canada) (see the composition of the panel in Acknowledgements).
After initialization, the model iterates over 30 time steps of 100 years each (the time for a stand to develop old growth attributes), for a total of 3000 years (approximately the period before present over which CH has been displacing the HA forest on zonal sites; [35]). The result is the proportion of the landscape occupied by each stand type, for different probabilities of major wind events (return periods) varying from once every 100 years (P(wind) = 1), to no wind events (P(wind) = 0).

3. Results

3.1. Testing the Clementsian Model

In the first run, we tested the traditional Clementsian model, in which there is only one successional pathway, and the common assumption that red cedar seedlings are fully shade tolerant. To reflect this in the model parameters, we defined HAy, HAm and HAo all as susceptible to windthrow (WindSusc = 0.8, 1.0 and 0.5, respectively) with little cedar recruitment after windthrow (Cinv≤15% = 0.05, 0.05, 0.05, respectively, for each stand age). HAm and HAo are invaded by red cedar during succession (Cinv>15% = 0.5 and 0.8, respectively). HA(C)y, HA(C)m and HA(C)o have the same susceptibility to windthrow as their HA equivalents (without cedar), and the same probability for vigorous red cedar recruitment (Csuc>15%). Dwarf mistletoe has a vigorous presence and produces gap formation in HAo (Gap = 1), causing vigorous red cedar invasion (CinvGap>15% = 1) (Table 3).
When calibrated for the Clementsian succession, the model estimates a landscape largely dominated by CHm stands, accounting for about 70% of the landscape in any windthrow return period (Figure 6). Old growth cedar-hemlock forests (CHo) would occupy 20% of the landscape with any kind of wind regime, and old growth hemlock-fir forests (HAo) would be present in only about 10% as long as some wind events happen, even with very low frequency (Figure 6). This situation is very different from the reported landscape composition on northern Vancouver Island before logging started, which was composed approximately by 40% CH stands [35].

3.2. Base Case of the Multiple Pathway Model

Based on data and hypotheses developed by Weber et al. [26], the model was parameterized as a base case for the alternative multiple pathway model (Table 4). In this case, there was no linearity in the succession through different stand types. If there are no wind events (P(wind) = 0), the model predicts that 100% of the zonal sites will be HAo after 3000 years (Figure 7). The fact that such wind events have occurred at various frequencies over this period and that not all the zonal sites were HAo when commercial logging started, rendered the left end of Figure 7 unrealistic. However, it can be seen how wind event frequency is one of the major drivers of change in the model, with landscape moving from being dominated by HAo to CHo as stand-replacing wind frequency increases (Figure 7).
Table 4. Probability values used to define the transitions in the scenario of base case of multiple pathway model.
Stand TypeInitWindSuscCinv≤15Cinv>15Csuc≤15Csuc>15GapCinvGap≤15CinvGap>15
HAy0.330.50.080.000000
HA(C)y0.000.50.200.810000
CHy0.000.00.001.001000
HAm0.331.00.080.000100
HA(C)m0.001.00.200.800110
CHm0.000.00.001.000101
HAo0.330.60.080.000100
HA(C)o0.000.60.200.800110
CHo0.000.00.001.000101
Figure 7. Landscape fraction (%) occupied by different stand types when the model is calibrated for the base case, after 3000 years of iterations for different probabilities (return periods) of windstorms.
Forests 12 01770 g007

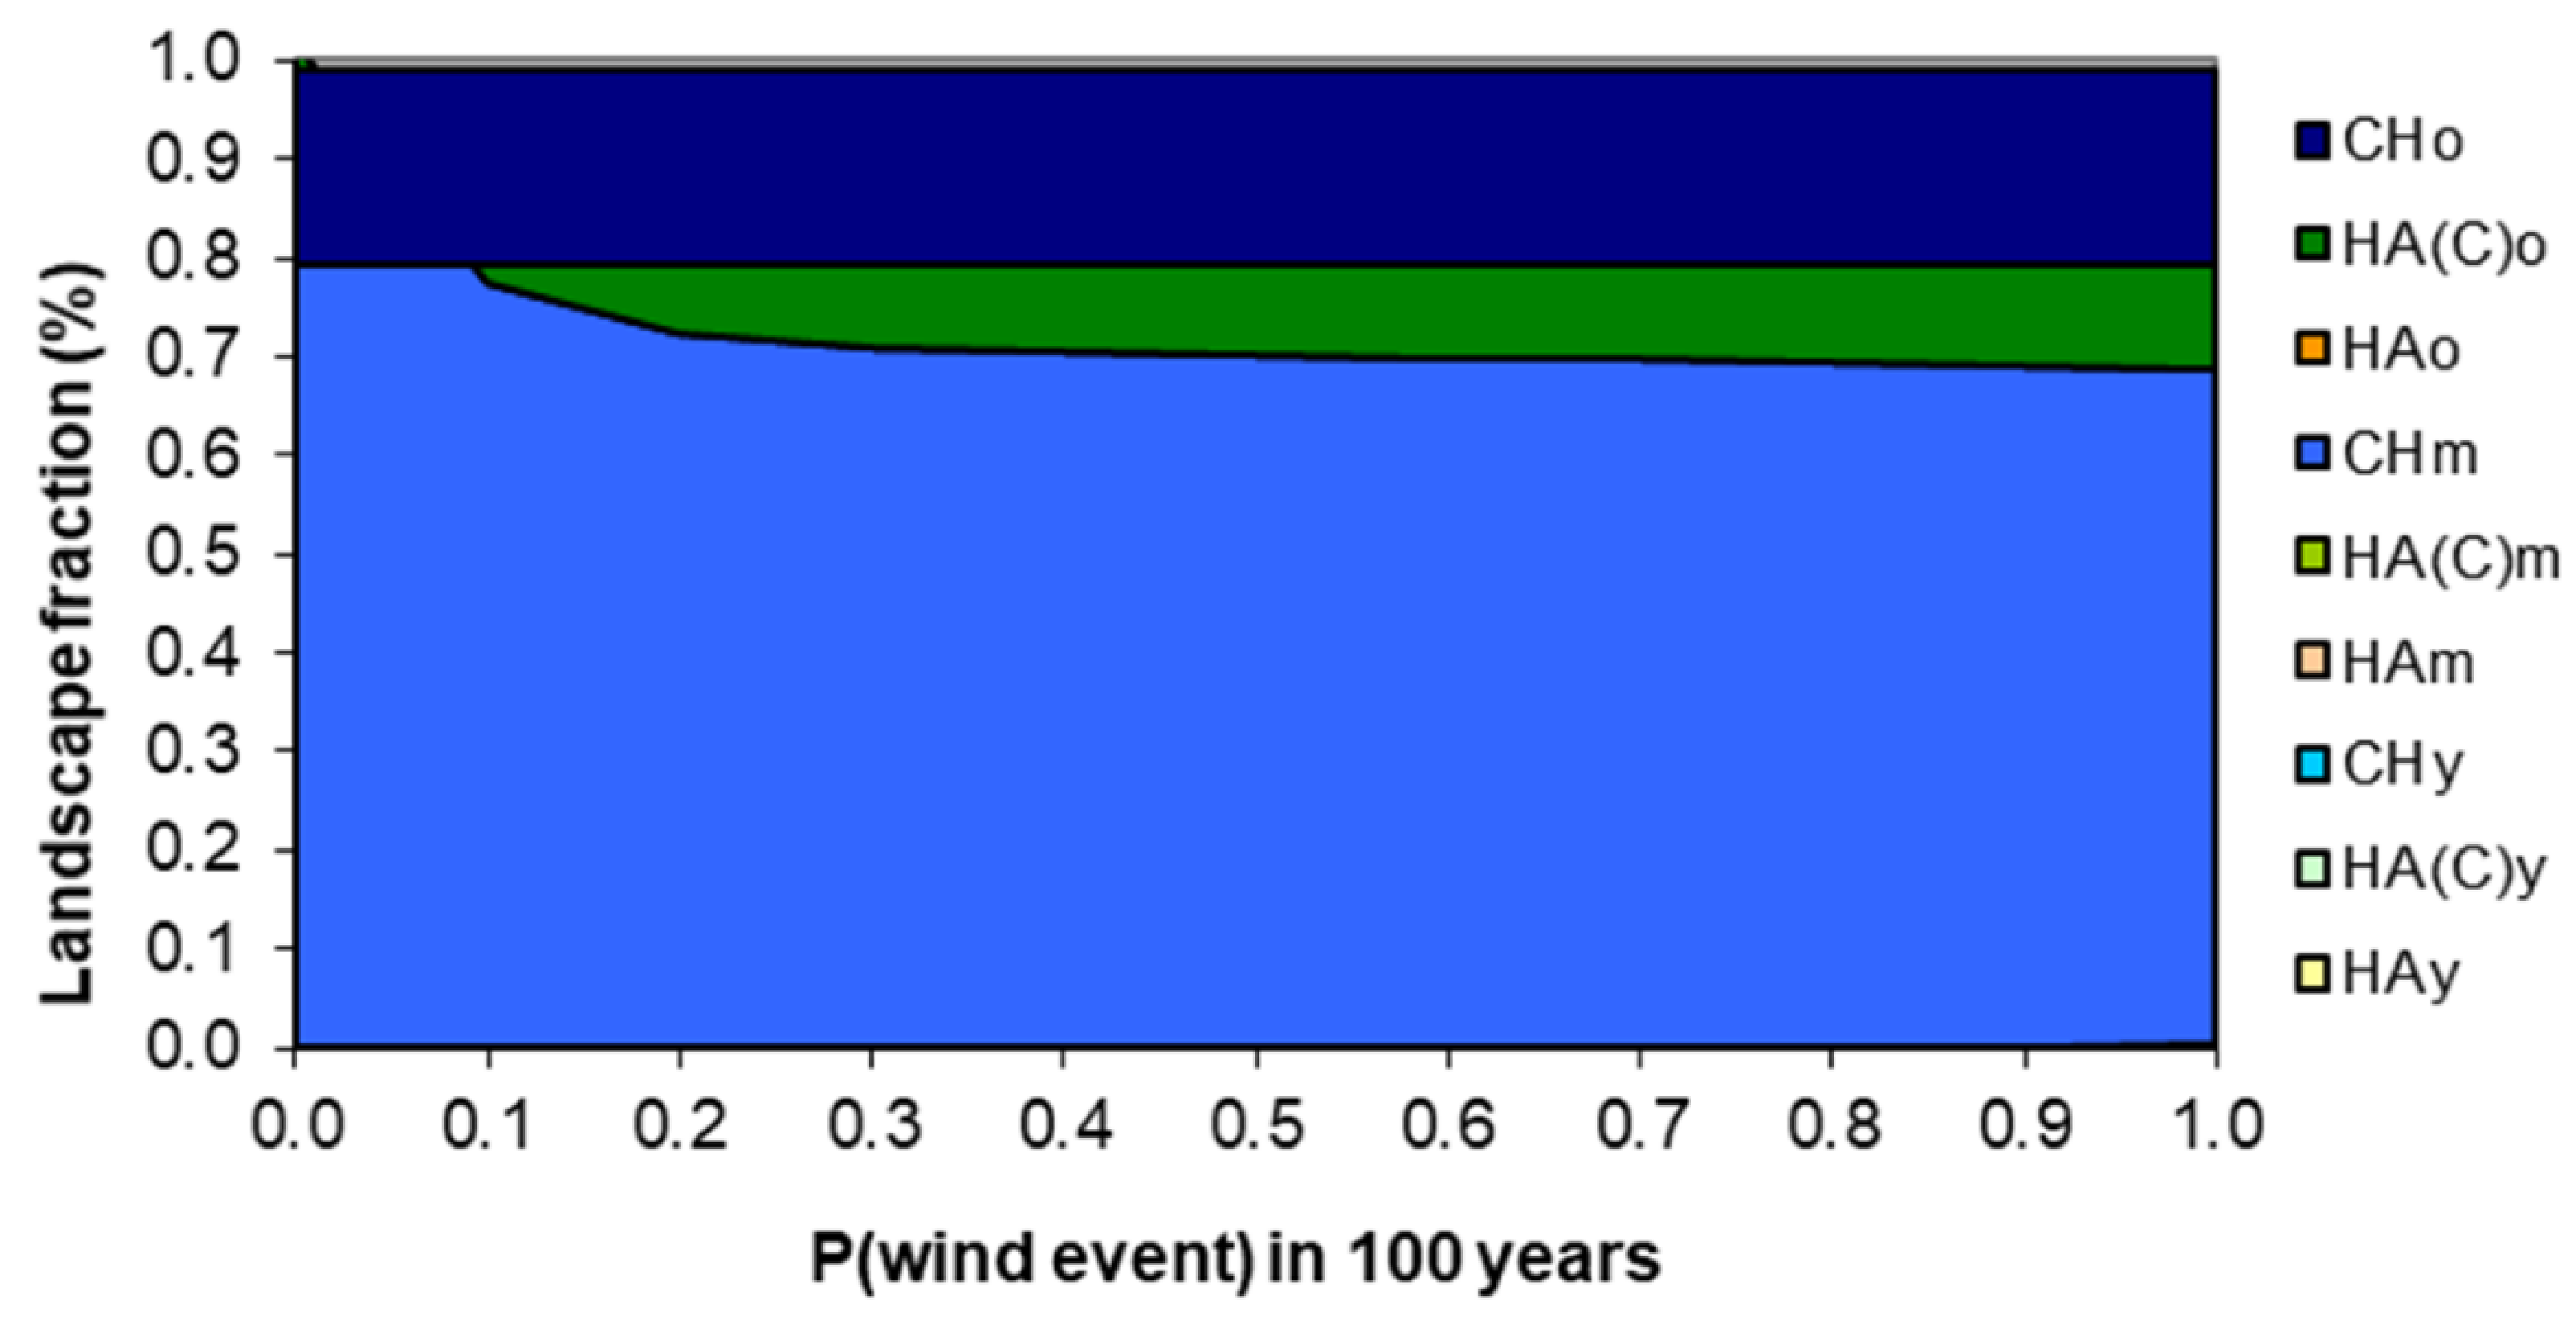
3.3. Model Sensitivity to Susceptibility to Stand-Replacing Events

According to both the Clementsian and multiple-pathway models, the wind plays a major role in the transition from HA to CH. This is not simply due to the removal of western hemlock overstory, which releases a red cedar understory that was present before the disturbance (as assumed in the Clementsian model), but also because stand-replacing windstorms enable shade-intolerant red cedar germinates to establish after the disturbance [33]. It also creates a supply of broken branches that can become sources for vegetative reproduction. Wind disturbance is then a necessary component of the transition from HA to CH. If the susceptibility of the stands to a stand-replacing wind damage is reduced by half (WindSusc values divided by 2, Table 4), the predicted outcome is a reduction in the probability of dominance by CHo stands (Figure 8A).
As expected, such results are more in line with the conceptual multiple pathway model. If P(wind) nears one, the composition of the landscape changes from 75% CHo to about 48%, the estimated landscape composition becomes closer to the observed pre-logging values. However, HAo is increased from zero (Figure 7, if P(wind) = 1) to about 18%, higher than the pre-logging condition in the study area (Figure 8A). On the other hand, the landscape fraction dominated by HAy increases only slightly, but that of HAm grows more significantly. Nevertheless, these two categories are still under-represented compared with the observed pre-logging condition in the region. Hence, these results are more realistic than the base case, but still not satisfactory.
Increasing susceptibility to wind in HA stands (WindSusc values 0.7, 0.6 and 0.6 for HAm, HAo and HA(C)o, respectively) significantly reduced the area of HAo (to about 8%) while boosting CHo to unreasonable levels (about 65% of the zonal sites). HAy and HAm are at 15% and 10%) (Figure 8B). The scenarios in Figure 8 emphasize the sensitivity of the model to different probabilities of wind disturbance.
Figure 8. Sensitivity test to explore the role of wind in the transition from HA to CH, showing the fraction (%) occupied by different stand types after 3000 years (30 model iterations) for different probabilities (return periods) of wind storms when susceptibility is reduced to 50% of the base case for all stand types (panel A), or only for HAy and HA(C)y (panel B).
Forests 12 01770 g008

3.4. A Plausible Set of Probabilities

In the final scenario, a panel of local experts from regional research institutions and forestry companies was assembled to agree on a plausible set of probabilities (Table 5).
Applying the probabilities suggested by the panel, HAo goes to zero if P(wind) equals one (Figure 9) as in the base case, because the probability that HAy and HAm stands will not suffer stand replacing wind disturbance before they are old enough to enter the next age class is very low. HAy and HAm are at 30% and 18%, compared with 12% and 8% in the base case. This reflects the lower probability that HAy and HAm would be invaded by red cedar to become HA(C)y and HA(C)m.

4. Discussion

4.1. The Clementsian Model

The original deterministic succession model [27] was based only on wind as the driver of ecological succession. Consequently, it assumed that HA stands would become CH stands as the shade-tolerant red cedar seedlings are established under hemlock and Pacific silver fir trees, unless a stand-replacing windstorm reinitiates the succession process. In essence, this is the same theory of a unique climax community [42]. As stated by this theory, the presence of stand-replacing windstorms with moderate frequency (approximately every 100 to 200 years, which translates into the Markov Chain model as P(wind) from 0.5 to 1.0), is assumed to maintain HA stands, as windthrows create even-aged, dense, fast-growing mixed stands of Pacific silver fir and hemlock. Such dense stands are too dark for red cedar seedlings to establish due to their slower growth compared to other tree species. In addition, intense growth competition makes these dense HA stands susceptible to stand-replacing windthrows due to their structure and species mechanical features. In contrast, red cedar-hemlock stands (CH) seem to resist better stand-replacing windstorms, as red cedar foliage and branch architecture can stand higher wind speeds without breaking [43]. Hence, CH stands are quite difficult to convert back to HA by means of regular windstorms.
As a corollary of the monoclimax succession model, old hemlock-fir stands (HAo) should exist only as a transition state from a young HA stand to a CH stand. This could only happen if HAo stands have a high presence of red cedar seedlings and saplings in the understory layers. In addition, HAo should not become a self-replacing hemlock-dominated climax. This transitional ecological state is assumed to occur when HA stands age, and gaps develop in the canopy. This results in light levels high enough to allow the establishment of red cedar seedlings, as well as Pacific silver fir and hemlock seedlings, together with salal shrubs, in the understory re-initiation phase (sensu [39]), even though red cedar seedlings are not truly shade-tolerant, see [26,44]. When calibrated for this monoclimax, our model seems to capture well this expected situation, in which most of the landscape should be dominated by CHm or CHo, and only about 10% of the landscape is comprised of HA(C)o (Figure 6). However, this situation is far from the original landscape distribution observed in the region, which accounts for about HA stands representing 40% of the total forest area [25]. Hence, while our model shows its utility to provide quantitative assessments of the Clementsian succession model at landscape level, it also demonstrates that such model is too simplistic to capture the actual natural dynamics of these ecosystem types, likely as some other stochastic factors are not accounted for.

4.2. Plausibility of the Multiple Pathway Succession Model

One of the main advantages of Markov Chain models is their capacity to aggregate very complex information in few parameters (the probabilities in the transition matrix), which allows us to simulate the consequences of the transformations between different ecological states, even when the underlying ecological processes taking place in such transitions are not fully understood [15]. An acceptable successional theory for this area must explain how red cedar has been able to colonize nearly half the zonal portions of the landscape, given the relative shade intolerance of red cedar germinants and the lack of evidence that HA stands are actually being actively colonized by red cedar. In fact, Ref. [35] suggested that landscape distribution rates have not been constant, and that red cedar may have gained its present landscape distribution relatively rapidly.
While the assertion that CH and HA stands occur on the same or different site conditions is still being investigated [30], it is clear that both stand types can be found on the same sites. Hence, our assumption is that the difference between HA and CH is not primarily a consequence of different site types, but that successional processes in these stand types have been mostly unaltered in the last centuries. We must highlight that we are not trying to explain here the current distribution of HA and CH forests, which may have been recently altered by forest management, but the distribution that those stand types reached naturally by the time they started to be managed over the last century. Hence, to understand the complex pathways that these stand types may have followed through the historical successional process, we should highlight the different key determinants of succession in the target region.
Light and shade tolerance (the focus of most successional models, as originally described by Clements), are clearly of great importance. The difficulty lies in understanding the multiple determinants of shade tolerance. When light is abundant [15,17], as in stand edges or canopy gaps that receive lateral light, Pacific silver fir and hemlock seedlings dominate the regeneration [33]. Western red cedar, which has been usually accepted as one of the most shade tolerant tree species in these forests, was found to be capable of surviving and growing slowly in the shade when equipped with secondary foliage, but was not as well adapted as silver fir to survive right after germinating [34]. In addition, HA stands seem to lack of arbuscular mycorrhizas, which prevents red cedar germinates from forming the symbiosis needed to gather enough nutrients to develop secondary foliage and hence become shade tolerant [34]. Nevertheless, there is no question that the fundamental driver of tree species succession in HA stands is closely related to light competition [25]. However, those factors are not sufficient to explain the observed successional patterns.
Another aspect is the role of wind at these stands. The density and structure of HA stands younger than 100 years old renders them susceptible to stand-replacing wind disturbances [45]. As an example of the prevalence of such disturbances, three major windstorm events have occurred on Vancouver Island and the neighboring Olympic Peninsula (Washington, USA) over the past century [46,47].
However, wind disturbance does not result, on its own, in HA stands transitioning to CH forests. There has to be red cedar regeneration in response to the opportunity created by the wind. This can be seen in our third test, which kept wind susceptibility values the same as in the base case. Red cedar regeneration probabilities resulted in about 48% CHo compared with approximately 75% in the base case. Clearly, regeneration of red cedar is key for the transition from HA to CH, so the sensitivity of the model to regeneration probability is high. Previous research supports our results regarding CH establishment after major disturbances [33,48,49,50]. Such recruiting success following disturbances is not only a matter of seedling establishment, but also of suppressed individuals being present in the pre-disturbance stand understory [51], and becoming released following windthrow. This phenomena as a successional mechanism could also account for red cedar tree establishment in the HA stands [52,53].
In addition, previous research has shown that, while red cedar saplings taller than 1.3 m are more shade tolerant than hemlock saplings from vegetative regeneration origin [54,55,56,57], survival for red cedar seedlings during the first years after germination is still lower than for Pacific silver fir or hemlock in young HA stands [33]. This relative shade intolerance of red cedar seedlings indicates that red cedar has a specific regeneration niche (sensu [57]), a fact that could reduce its ability to colonize HA stands.
Our Markov Chain model is designed to test the conceptual successional model proposed by [26] by incorporating the stochasticity inherent to large-scale disturbances combined with life history features of the major tree species. Our model supports the statement that HA stands become CH forests because a regeneration niche for red cedar is created in HA stands by disturbances [33,48,49]. With appropriate conditions, such as high red cedar seed production and favorable winds, significant amounts of red cedar will be established. This combination of events may be highly variable, as red cedar tends to produce large seed crops only every four or more years [58]. Even though, red cedar seedlings have to compete with hemlock and fir seedlings. Within two years of germination red cedar seedlings are less competitive than hemlock and amabilis fir in HAy [33]. However, young HA stands with significant amounts of red cedar in the intermediate and co-dominant tree layer are present, but infrequent on the landscape (B. Gilbert, personal observation). These observations suggest that the relative abundance and timing of seed rain of each species is key to determining tree species dominance in any site. This phenomenon is captured by our model, as shown by its high sensitivity to the probability of red cedar regeneration. These observations further indicate that the Clementsian model is too simplistic, and a more complex model is better suited to emulate or study the complexity of the regeneration processes in these stands [59,60].
The Markov Chain model sensitivity to windthrow frequency and seedling establishment suggests that stand history is the most important determinant of current tree species composition in young stands, as is noticed in other forests around the world [61,62,63]. However, plant life history features are important at landscape scales, as the longevity of red cedar and its resistance to windthrow and dwarf mistletoe appears to make it a superior competitor over the long term. Similarly, amabilis fir high shade tolerance seems to produce a long-term shift in HA stands from hemlock to fir dominance, if not affected by windstorms. Finally, although it was previously believed that the establishment of salal happened only in combination with succession from HA to CH ecosystems [25], the latest research indicates that it may be based only on light availability [64], which increases in all stand types as they age.

4.3. Evaluation of the Model

If the Markov Chain model presented here is valid, there should be a progressive increase in the area of mature and old CH. This is in fact suggested by the pollen and genetic records from the region [35,65]. Due to this temporal variation in stand type ratios over the last millennia, there is no way of validating this model outside of a detailed history of past stand and landscape disturbances, which unfortunately is not available. In addition, due to the permanent stochasticity of ecological processes, there is no “correct” landscape ratio to be compared with the model´s predictions, as the real landscape have always been fluctuating [66]. Therefore, one way to evaluate forest successional models such as this one is by projecting long periods of forest change and then comparing the proportion of each ecological stage estimated by the model with those of the distribution observed in the field [67], an approach used since the early development of successional Markovian models [68].
At this region, the mean size of forest patches was found to be 10.8 ha, with 81% of these sites being young HA stands (<100 years) of windthrow origin and 19% classified as HA old forest [10]. While HA stands occupy about 50% of northern Vancouver Island (~175,000 hectares), only 2000 to 3000 hectares are simultaneously at any given time in some type of intermediate state between HA and CH (i.e., HA(C)). This is only 1–2% of the current HA stands extension [27]. Hebda [69] presented an estimation of forest development on northern Vancouver Island following de-glaciation based on pollen analysis from sites on the Nahwitti Lowland, just west of Port McNeil (Figure 2). The analysis indicated that conifers of the Cupressaceae family have been widespread on northern Vancouver Island only recently, a fact also confirmed by genetic markers [66]. Thus, red cedar has only been dominant on northeastern Vancouver Island for approximately 3000 years, while hemlock has been a feature of this landscape for approximately 9000 years [35,69]. If CH stands have been spreading uniformly across the landscape for the most recent 3000-year period, then the rate of spread would amount to about 1000 hectares per century across the area that was not converted back to HA stands. These rates are captured by our model when using the parameter calibration set suggested by the expert panel.
It is recognized that Markov Chain successional models are able to predict changes in species abundance, but they require a deep knowledge of successional patterns and the probabilities for transitioning between different ecological stages [17]. In particular, a potential limitation to a mechanistic interpretation of the ecological transitions arises from the assumption that in first-order Markov models (such as the one presented here) the transition towards the future stage depends only on the present stage. As the importance of ecological legacies could be high in some situations [70], this assumption needs further tests [17]. However, our Markov Chain model also complies with the ergodic property of this type of model, in which the succession will ultimately converge towards an inherent final stage [14], somehow emulating the climax community in Clementsian succession. In the suggested model such ergodic maximum is also the CHo stand type, but the key difference is the existence of random mechanisms (i.e., stand-replacing windstorms), which ensures that at any given time, only a fraction of the landscape is composed by CHo stands, as observed in the region.

4.4. Management Implications

When evaluating our model we also have to keep in mind that two major current disturbances on Vancouver Island forests (management and fire) have not been considered. This is because we wanted to understand the natural, long-term successional mechanisms that have generated the pre-logging conditions reported in the region [25]. In addition, for these specific sites, stand-replacing fires seem to be very infrequent, or even not present for several millennia, as recorded in charcoal sediments [37,38]. However, if both fire and management were included in the model, in one hand the complexity would increase greatly, as the number of possible ecological stages would be multiplied. This would make even more complicated to gather information on the transition probabilities to accurately parameterize the model. On the other hand, it is expected that the landscape proportion occupied by old growth stands (both CHo and HAo) would be reduced. In parallel, a rise in landscape occupied by HAy and HAm would happen, because of stands regenerating in conditions that would make red cedar regeneration difficult.
In spite of that, our multiple pathway succession model challenges the current use of biogeoclimatic classifications as base for forest management regulations, as stochasticity in ecological process also has an important role [71,72]. The main consequence of our findings is that a mosaic of old growth stand types (HAo, CHo) should be maintained and the HAo should not be considered as transitional phase towards CHo, as HAo can in fact become stand-replacing. Then, management operations in current HA sites should prevent the early establishment of red cedar seedlings (present either as suppressed saplings or as seeds arriving from neighboring CH stands). In addition, HA sites should be particularly preserved in those topographic locations where windstorms could be less severe, or they would be substituted by HA(C), and eventually by CH stands.
In spite of that, we should also recognize that the historical CH expansion [35,65] has likely not ended. Therefore, in the very long term, it is also expected that HA sites will become a relict. Hence, forest management that aims to maintain natural succession patterns [73] has the complicated task of maintaining current HA and CH distributions, but at the same time allowing the slow but relentless natural substitution of these communities.

5. Conclusions

Our forest succession model for this area suggests that infrequent disturbances relative to the duration of the current bioclimatic era are responsible for maintaining a non-equilibrium distribution of stands across the landscape. With long-lived species like red cedar and changes in global climate, successional theories incorporating species composition relative to climate change may become more important. Our lack of understanding of the processes that lead to current species distributions is problematic. The possibly unique interactions between disturbances and species’ autoecology for a given area suggest that understanding of successional trends needs to be area specific. Northeastern Vancouver Island’s bioclimatic eras since the last glaciation have ranged in duration from 1800 to 4000 years (mean = 2800 years), with the current bioclimatic era beginning 3000 ybp [69], coinciding with the onset of CH expansion. The Markov Chain model presented here can predict the theoretical course of succession, the ratio between its final stages, and the mean time it would take to reach the final stage(s) under the hypothesis of invariance. It thus gives geobotanic knowledge in a quantitative form, capable of being used for prediction [59]. The transition matrix model developed in this study demonstrates that a Clementsian, linear succession model cannot explain the trends in species establishment currently seen on the landscape. In addition, our model suggests that the transition from HA to CH can only occur when there is stand replacing disturbance. Our model is consistent with the observed site differences and multiple pathways of succession reported for these sites, and indicates that forest management should account for the co-existence of several potential “climax” communities in the same site.

Author Contributions

Conceptualization, J.P.K. and A.W.; methodology, J.P.K. and A.W.; resources, A.W.; writing—original draft preparation, J.A.B., Y.-H.L. and J.P.K.; writing—review and editing, J.A.B. and Y.-H.L. All alive authors have read and agreed to the published version of the manuscript.

Funding

This research was funded by the SCHIRP, Western Forest Products, and Natural Sciences and Engineering Research Council of Canada.

Institutional Review Board Statement

Ethical review and approval were waived for this study, as it was considered that the panel members were not the object of the research and they only provided their opinions in the curse of their regular professional duties.

Informed Consent Statement

Not applicable.

Data Availability Statement

The stochastic model can be obtained free of charge in the format of a Microsoft Excel © file by contacting the authors.

Acknowledgments

This paper is dedicated to the memories of Adrian Weber and J.P. (Hamish) Kimmins. Thanks are also due to Marco Albani, who supported Arian Weber to create the preliminary versions of the model. We also want to thank the members of the expert panel, composed by scientists (Steve Mitchell, Gordon Weetman, John Barker, Karel Klinka, Cindy Prescott, Terry Lewis) and forest managers (Bill Beese, Dave Mogensen) all of them experts in the ecology and management of northern Vancouver Island forests.

Conflicts of Interest

The authors declare no conflict of interest.

References

  1. Spies, T.A.; Hessburg, P.F.; Skinner, C.N.; Puettmann, K.J.; Reilly Matthew, J.; Davis, R.J.; Kertis, J.A.; Long, J.W.; Shaw, D.C. Chapter 3: Old growth, disturbance, forest succession, and management in the area of the Northwest Forest Plan. In Synthesis of Science to Inform Land Management within the Northwest Forest Plan Area; General Technical Report PNW-GTR-966; Spies, T.A., Stine, P.A., Gravenmier, R., Long, J.W., Reilly, M.J., Eds.; U.S. Department of Agriculture, Forest Service, Pacific Northwest Research Station: Portland, OR, USA, 2018; pp. 95–243. [Google Scholar]
  2. Pandolfi, J.M. Succession. In Encyclopedia of Ecology; Jorgensen, S.E., Fath, B., Eds.; Academic Press: Oxford, UK, 2008; pp. 3416–3424. [Google Scholar]
  3. Finegan, B. Forest succession. Nature 1984, 312, 109–114. [Google Scholar] [CrossRef]
  4. Hall, F.G.; Botkin, D.B.; Strebel, D.E.; Woods, K.D.; Goetz, S.J. Large-scale patterns of forest succession as determined by remote sensing. Ecology 1991, 72, 628–640. [Google Scholar] [CrossRef]
  5. Prach, K.; Ujházy, K.; Knopp, V.; Fanta, J. Two centuries of forest succession, and 30 years of vegetation changes in permanent plots in an inland sand dune area, The Netherlands. PLoS ONE 2021, 16, e0250003. [Google Scholar] [CrossRef] [PubMed]
  6. Campbell, E.M.; Saunders, S.C.; Coates, K.D.; Meidinger, D.V.; MacKinnon, A.; O’Neill, G.A.; MacKillop, D.J.; DeLong, S.C.; Morgan, D.G. Ecological Resilience and Complexity: A Theoretical Framework for Understanding and Managing British Columbia’s Forest Ecosystems in a Changing Climate; Forest Science Program Technical Report 055; BC Ministry of Forests and Range: Victoria, BC, Canada, 2009. [Google Scholar]
  7. Connell, J.H.; Slatyer, R.O. Mechanisms of Succession in Natural Communities and Their Role in Community Stability and Organization. Am. Nat. 1977, 111, 1119–1144. [Google Scholar] [CrossRef]
  8. Fresco, L.O.; Kroonenberg, S.B. Time and spatial scales in ecological sustainability. Land Use Policy 1992, 9, 155–168. [Google Scholar] [CrossRef]
  9. Turner, M.G.; Romme, W.H.; Gardner, R.H.; O’Neill, R.V.; Kratz, T.K. A revised concept of landscape equilibrium: Disturbance and stability on scaled landscapes. Landsc. Ecol. 1993, 8, 213–227. [Google Scholar] [CrossRef]
  10. Perera, A.H.; Buse, L.J. Emulating Natural Disturbance in Forest Management: An Overview. In Emulating Natural Forest Landscape Disturbances: Concepts and Applications; Perera, A.H., Buse, L.J., Webe, M.G., Eds.; Columbia University Press: New York, NY, USA, 2004; pp. 1–7. [Google Scholar]
  11. Keane, R.E.; Hessburg, P.F.; Landres, P.B.; Swanson, F.J. The use of historical range and variability (HRV) in landscape management. For. Ecol. Manag. 2009, 258, 1025–1037. [Google Scholar] [CrossRef]
  12. Blanco, J.A.; González de Andrés, E.; San Emeterio, L.; Lo, Y.H. Modelling mixed forest stands: Methodological challenges and approaches. In Advanced Modelling Techniques Studying Global Changes in Environmental Sciences; Park, Y.S., Lek, S., Baehr, C., Jorgensen, S.E., Eds.; Elsevier: Amsterdam, The Netherlands, 2015; pp. 186–223. ISBN 978-0-444-63-536-5. [Google Scholar]
  13. Van Hulst, R. On the dynamics of vegetation: Markov chains as models of succession. Vegetatio 1979, 40, 3–14. [Google Scholar] [CrossRef]
  14. Usher, M.B. Modelling ecological succession, with particular reference to Markovian models. Vegetatio 1981, 46, 11–18. [Google Scholar] [CrossRef]
  15. Baltzer, H. Markov Chain models for vegetation dynamics. Ecol. Model. 2000, 126, 139–154. [Google Scholar]
  16. Weber, A.; Leckie, S.; Kimmins, J.P.; Gilbert, B.; Blanco, J.A.; Lo, Y.H. Survival and growth as measures of shade tolerance of planted western redcedar, western hemlock and amabilis fir seedlings in hemlock-fir forests of northern Vancouver Island. For. Ecol. Manag. 2017, 386, 13–21. [Google Scholar] [CrossRef] [Green Version]
  17. Liénard, J.; Florescu, I.; Strigul, N. An appraisal of the classic forest succession paradigm with the Shade Tolerance Index. PLoS ONE 2015, 10, e01117138. [Google Scholar] [CrossRef] [Green Version]
  18. Koven, C.D.; Knox, R.G.; Fisher, R.A.; Chambers, J.Q.; Christoffersen, B.O.; Davies, S.J.; Detto, M.; Dietze, M.C.; Faybishenko, B.; Holm, J.; et al. Benchmarking and parameter sensitivity of physiological and vegetation dynamics using the Functionally Assembled Terrestrial Ecosystem Simulator (FATES) at Barro Colorado Island, Panama. Biogeosciences 2020, 17, 3017–3044. [Google Scholar] [CrossRef]
  19. Rödig, E.; Cuntz, M.; Heinke, J.; Rammig, A.; Huth, A. Spatial heterogeneity of biomass and forest structure of the Amazon rain forest: Linking remote sensing, forest modelling and field inventory. Glob. Ecol. Biogeogr. 2017, 26, 1292–1302. [Google Scholar] [CrossRef]
  20. Wei, X.; Larsen, C.P.S. Assessing the minimum number of time since last fire sample-points required to estimate the fire cycle: Influences of fire rotation length and study area scale. Forests 2018, 9, 708. [Google Scholar] [CrossRef] [Green Version]
  21. Dixon, G.E. Essential FVS: A User’s Guide to the Forest Vegetation Simulator; Internal Rep.; U.S. Department of Agriculture, Forest Service, Forest Management Service Center: Fort Collins, CO, USA, 2002; 226p. [Google Scholar]
  22. Blanco, J.A.; Ameztegui, A.; Rodríguez, F. Modelling Forest Ecosystems: A crossroad between scales, techniques and applications. Ecol. Model. 2020, 425, 109030. [Google Scholar] [CrossRef]
  23. Kimmins, J.P.; Blanco, J.A.; Seely, B.; Welham, C.; Scoullar, K. Forecasting Forest Futures: A Hybrid Modelling Approach to the Assessment of Sustainability of Forest Ecosystems and Their Values; Earthscan Ltd.: London, UK, 2010; 281p, ISBN 978-1-84407-922-3. [Google Scholar]
  24. Delsole, T. A Fundamental Limitation of Markov Models. J. Atmos. Sci. 2000, 57, 2158–2168. [Google Scholar] [CrossRef]
  25. Prescott, C.E.; Weetman, G. Salal Cedar Hemlock Integrated Research Program: A Synthesis; Faculty of Forestry, University of British Columbia: Vancouver, BC, Canada, 1994; 85p. [Google Scholar]
  26. Weber, A.; Kimmins, J.H.; Gilbert, B.; Lo, Y.-H.; Blanco, J.A. Multiple-pathway succession in coastal Tsuga heterophylla, Thuja plicata, and Abies amabilis forests on northeastern Vancouver Island, British Columbia. Can. J. For. Res. 2014, 44, 1145–1155. [Google Scholar] [CrossRef]
  27. Lewis, T. Ecosystems of the Port McNeill Block (Block 4) of Tree Farm License 25; Western Forest Products: Vancouver, BC, Canada, 1982. [Google Scholar]
  28. DeMontigny, L.E. An Investigation into the Factors Contributing to the Growth Check of Conifer Regeneration on Northern Vancouver Island. Ph.D. Thesis, The University of British Columbia, Vancouver, BC, Canada, 1992. [Google Scholar]
  29. Prescott, C.E.; Sajedi, T. The role of salal in forest regeneration problems in coastal British Columbia: Problem or symptom? For. Chron. 2008, 84, 29–36. [Google Scholar] [CrossRef] [Green Version]
  30. Sajedi, T.; Prescott, C.E.; Seely, B.; Lavkulich, L.M. Relationships among soil moisture, aeration and plant communities in natural and harvested coniferous forests in coastal British Columbia, Canada. J. Ecol. 2012, 100, 605–618. [Google Scholar] [CrossRef]
  31. Prescott, C.E.; Nery, V.; Van Niejenhuis, A.; Sajedi, T.; Marshall, P. Nutrition management of cedar and hemlock plantations in coastal British Columbia. New For. 2013, 44, 769–784. [Google Scholar] [CrossRef]
  32. Keenan, R.J.; Prescott, C.E.; Kimmins, J.H. Mass and nutrient content of woody debris and forest floor in western red cedar and western hemlock forests on northern Vancouver Island. Can. J. For. Res. 1993, 23, 1052–1059. [Google Scholar] [CrossRef]
  33. Weber, A.; Gilbert, B.; Kimmins, J.P.; Prescott, C.E. Factors limiting the early survivorship of Thuja plicata on northern Vancouver Island, British Columbia. Can. J. For. Res. 2003, 33, 854–861. [Google Scholar] [CrossRef] [Green Version]
  34. Weber, A.; Karst, J.; Gilbert, B.; Kimmins, J.P. Thuja plicata exclusion in ectomycorrhiza-dominated forests: Testing the role of inoculum potential of arbuscular mycorrhizal fungi. Oecologia 2004, 143, 148–156. [Google Scholar] [CrossRef]
  35. Hebda, R.J. British Columbia vegetation and climate history with focur on 6 ka BP. Géograp. Phys. Quatern. 1995, 49, 55–79. [Google Scholar] [CrossRef] [Green Version]
  36. Pojar, J.; Klinka, K.; Meidinger, D. Biogeoclimatic ecosystem classification in British Columbia. For. Ecol. Manag. 1987, 22, 119–154. [Google Scholar] [CrossRef]
  37. Gavin, D.G.; Brubaker, L.B.; Lertzman, K.P. An 1800-year record of the spatial and temporal distribution of fire from the west coast of Vancouver Island, Canada. Can. J. For. Res. 2003, 33, 573–586. [Google Scholar] [CrossRef]
  38. Gavin, D.G.; Hallett, D.J.; Hu, F.S.; Lertzman, K.P.; Prichard, S.J.; Brown, K.J.; Lynch, J.A.; Bartlein, P.; Peterson, D.L. Forest fire and climate change in western North America: Insights from sediment charcoal records. Front. Ecol. Environ. 2007, 5, 499–506. [Google Scholar] [CrossRef]
  39. Oliver, C.; Larson, B. Forest Stand Dynamics; Wiley: New York, NY, USA, 1996; p. 544. [Google Scholar]
  40. Usher, M.B. Markovian Approaches to Ecological Succession. J. Anim. Ecol. 1979, 48, 413. [Google Scholar] [CrossRef]
  41. Kimmins, J.P. Forest Ecology, 3rd ed.; Prentice Hall: Upper Saddle River, NJ, USA, 2004; p. 611. [Google Scholar]
  42. Clements, F.E. Plant Succession: Analysis of the Development of Vegetation; Carnegie Institution of Washington Publication Sciences: Washington, DC, USA, 1916; Volume 242, pp. 1–512. [Google Scholar]
  43. Rudnicki, M.; Mitchell, S.J.; Novak, M.D. Wind tunnel measurements of crown streamlining and drag relationships for three conifer species. Can. J. For. Res. 2004, 34, 666–676. [Google Scholar] [CrossRef]
  44. Klinka, K.; Brisco, D. Silvics and Silviculture of Coastal Western Redcedar: A Literature Review. B.C. Min. For. Range, For. Sci. Prog., Victoria, B.C. Spec. Rep. Ser. 11. 2009. Available online: www.for.gov.bc.ca/hfd/pubs/Docs/Srs/Srs11.htm (accessed on 11 December 2021).
  45. Mitchell, S.J. Wind as a natural disturbance agent in forests: A synthesis. Int. J. For. Res. 2012, 86, 147–157. [Google Scholar] [CrossRef] [Green Version]
  46. Franklin, J.F.; Spies, T.A.; Swanson, F.J. Setting the Stage: Vegetation Ecology and Dynamics. In People, Forests, and Change; Olson, D.H., Van Horne, B., Eds.; Island Press: Washington, DC, USA, 2017. [Google Scholar] [CrossRef]
  47. Beese, W.J.; Rollerson, T.P.; Peters, C.M. Quantifying wind damage associated with variable retention harvesting in coastal British Columbia. For. Ecol. Manag. 2019, 443, 117–131. [Google Scholar] [CrossRef]
  48. Feller, M.; Klinka, K. Seedfall, seed germination, and initial survival and growth of seedlings of Thuja Plicata in southwestern British Columbia. Northwest Sci. 1998, 72, 157–169. [Google Scholar]
  49. Daniels, L.; Marshall, P.; Carter, R.; Klinka, K. Age structure of Thuja plicata in the tree layer of old-growth stands near Vancouver, BC. Northwest Sci. 1995, 69, 175–183. [Google Scholar]
  50. Daniels, L.D. Western redcedar population dynamics in old-growth forests: Contrasting ecological paradigms using tree rings. For. Chron. 2003, 79, 517–530. [Google Scholar] [CrossRef] [Green Version]
  51. Messier, C.; Doucet, R.; Ruel, J.C.; Claveau, Y.; Kelly, C.; Lechowicz, M. Functional ecology of advance regeneration in relation to light in boreal forests. Can. J. For. Res. 1999, 29, 812–823. [Google Scholar] [CrossRef]
  52. Parish, R.; Antos, J.A. Structure and dynamics of an ancient montane forest in coastal British Columbia. Oecologia 2004, 141, 562–576. [Google Scholar] [CrossRef]
  53. Antos, J.A.; Filipescu, C.N.; Negrave, R.W. Ecology of western redcedar (Thuja plicata): Implications for management of a high-value multiple-use resource. For. Ecol. Manag. 2016, 375, 211–222. [Google Scholar] [CrossRef]
  54. Carter, R.; Klinka, K. Variation in shade tolerance of Douglas fir, western hemlock, and western red cedar in coastal British Columbia. For. Ecol. Manag. 1992, 55, 87–105. [Google Scholar] [CrossRef]
  55. Kobe, R.; Coates, K.D. Models of sapling mortality as a function of growth to characterize interspecific variation in shade tolerance of eight tree species of northwestern British Columbia. Can. J. For. Res. 1997, 27, 227–236. [Google Scholar] [CrossRef]
  56. Khan, S.; Rose, R.; Haase, D.; Sabin, T. Effects of shading on morphology, chlorophyll concentration, and chlorophyll flourescence of four Pacific Northwest conifer species. New Forest. 2000, 19, 171–186. [Google Scholar] [CrossRef]
  57. Grubb, P.J. The Maintenance of Species-Richness in Plant Communities: The Importance of the Regeneration Niche. Biol. Rev. 1977, 52, 107–145. [Google Scholar] [CrossRef]
  58. Gashwiler, J.S. Seed fall of three conifers in west central Oregon. For. Sci. 1969, 15, 290–295. [Google Scholar]
  59. Blanco, J.A.; Welham, C.; Kimmins, J.P.; Seely, B.; Mailly, D. Guidelines for modeling natural regeneration in boreal forests. For. Chron. 2009, 85, 427–439. [Google Scholar] [CrossRef]
  60. Kimmins, J.P.; Blanco, J.A.; Seely, B.; Welham, C.; Scoullar, K. Complexity in Modeling Forest Ecosystems; How Much is Enough? For. Ecol. Manag. 2008, 256, 1646–1658. [Google Scholar] [CrossRef]
  61. Janda, P.; Bače, R.; Trotsiuk, V.; Mikoláš, M.; Nagel, T.; Seidel, R.; Mrhalová, H.; Morrisey, R.C.; Matějů, L.; Lábusová, J.; et al. The historical disturbance regime of mountain Norway spruce forests in the Western Carpathians and its influence on current forest structure and composition. For. Ecol. Manag. 2017, 388, 67–78. [Google Scholar] [CrossRef] [Green Version]
  62. Johnstone, J.F.; Allen, C.D.; Franklin, J.F.; Frelich, L.E.; Harvey, B.J.; Higuera, P.; Mack, M.C.; Meentemeyer, R.K.; Metz, M.R.; Perry, G.L.; et al. Changing disturbance regimes, ecological memory, and forest resilience. Front. Ecol. Environ. 2016, 14, 369–378. [Google Scholar] [CrossRef]
  63. Johnston, J.D.; Dunn, C.J.; Vernon, M.J.; Bailey, J.D.; Morrissette, B.A.; Morici, K.E. Restoring historical forest conditions in a diverse inland Pacific Northwest landscape. Ecosphere 2018, 9, e02400. [Google Scholar] [CrossRef]
  64. Messier, C. Effects of neutral shade and growing media on growth, biomass and competitive ability of Gaultheria shallon. Can. J. Bot. 1992, 70, 2271–2276. [Google Scholar] [CrossRef]
  65. O’Connell, L.M.; Ritland, K.; Thompson, S.L. Patterns of post-glacial colonization by western redcedar (Thuja plicata, Cupressaceae) as revealed by microsatellite markers. Botany 2008, 86, 194–203. [Google Scholar] [CrossRef]
  66. Donato, D.C.; Halofsky, J.S.; Reilly, M.J. Corralling a black swan: Natural range of variation in a forest landscape driven by rare, extreme events. Ecol. Appl. 2020, 30, e02013. [Google Scholar] [CrossRef]
  67. Shugart, H.H.; West, D.C. Development of an Appalachian Deciduous Forest Succession Model and its Application to Assessment of the Impact of the Chestnut Blight. J. Environ. Manag. 1977, 5, 161–179. [Google Scholar]
  68. Horn, H.S. Succession. In Theoretical Ecology: Principles and Applications; May, R.M., Ed.; Blackwell Scientific Publishers: Oxford, UK, 1976; pp. 187–204. [Google Scholar]
  69. Hebda, R.J. Late-glacial and postglacial vegetation history at Bear Cove Bog, northeast Vancouver Island, British Columbia. Can. J. Bot. 1983, 61, 3172–3192. [Google Scholar] [CrossRef]
  70. Blanco, J.A. Forests may need centuries to recover their original productivity after continuous intensive management: An example from Douglas-fir. Sci. Total. Environ. 2012, 437, 91–103. [Google Scholar] [CrossRef] [Green Version]
  71. Haeussler, S. Rethinking biogeoclimatic ecosystem classification for a changing world. Environ. Rev. 2011, 19, 254–277. [Google Scholar] [CrossRef]
  72. Logofet, D.O.; Lesnaya, E.V. The Mathematics of Markov Models: What Markov Chains Can Really Predict in Forest Successions. Ecol. Modell. 2000, 126, 285–298. [Google Scholar] [CrossRef]
  73. Kimmins, J.P. Emulation of natural forest disturbance. What does this mean. In Emulating Natural Forest Landscape Disturbances: Concepts and Applications; Perera, A.H., Buse, L.J., Webe, M.G., Eds.; Columbia University Press: New York, NY, USA, 2004; pp. 8–28. [Google Scholar]
Figure 1. Diagram of a hypothetical Markov Chain model simulating forest stand dynamics. Black ovals represent four phases in stand dynamic in which the forest can be at a given moment. Blue and red arrows show the possible transitions between states. The probability of each transition is denoted as Pij, being i the present stage and j the future stage. All the probabilities together create M (the transition matrix). In a deterministic (Clementisan) model, all the probabilities in red (corresponding to transitions marked by red arrows) have a value of one, and the rest a value of zero.
Forests 12 01770 g001
Figure 3. Forest succession on northern Vancouver Island forests, in which frequency and intensity of wind disturbance rules the deterministic (Clementsian) model (Elaborated upon data from [26]). Adapted with permission from Ref [26]. © 2014, the Authors.
Forests 12 01770 g003
Figure 6. Landscape fraction (%) occupied by different stand types with the Markov chain model calibrated to follow the Clementsian model after 3000 years (30 iterations) for different probabilities (return periods) of wind storms.
Forests 12 01770 g006
Figure 9. Model calibrated with the opinion of the expert panel, showing the fraction (%) occupied by different stand types after 3000 years (30 model iterations) for different probabilities (return periods) of wind storms.
Forests 12 01770 g009
Table 3. Probability values used to define the transitions in the scenario of Clementsian succession.
Stand TypeInitWindSuscCinv≤15Cinv>15Csuc≤15Csuc>15GapCinvGap≤15CinvGap>15
HAy0.330.80.050.1000.00.00
HA(C)y0.000.80.050.2000.00.00
CHy0.000.01.000.1010.20.00
HAm0.331.00.050.5010.20.01
HA(C)m0.001.00.050.1010.20.11
CHm0.000.01.000.1010.20.81
HAo0.330.50.050.8011.01.01
HA(C)o0.000.50.050.8011.00.01
CHo0.000.01.000.1010.20.81
Table 5. Probability values used in the scenario based on opinions from a panel of local experts.
Stand TypeInitWindSuscCinv≤15Cinv>15Csuc≤15Csuc>15GapCinvGap≤15CinvGap>15
HAy0.330.50.040.000000
HA(C)y0.000.50.100.810000
CHy0.000.00.001.001000
HAm0.331.00.040.000100
HA(C)m0.001.00.100.800110
CHm0.000.00.001.000101
HAo0.330.60.040.000100
HA(C)o0.000.60.100.000110
CHo0.000.00.001.000101
Publisher’s Note: MDPI stays neutral with regard to jurisdictional claims in published maps and institutional affiliations.

