
Land Use and Land Cover Changes in the Diversity and Life Zone for Uncontacted Indigenous People: Deforestation Hotspots in the Yasuní Biosphere Reserve, Ecuadorian Amazon

 ,
,  ,
,  ,
,  and
and
Abstract
:1. Introduction
2. Materials and Methods
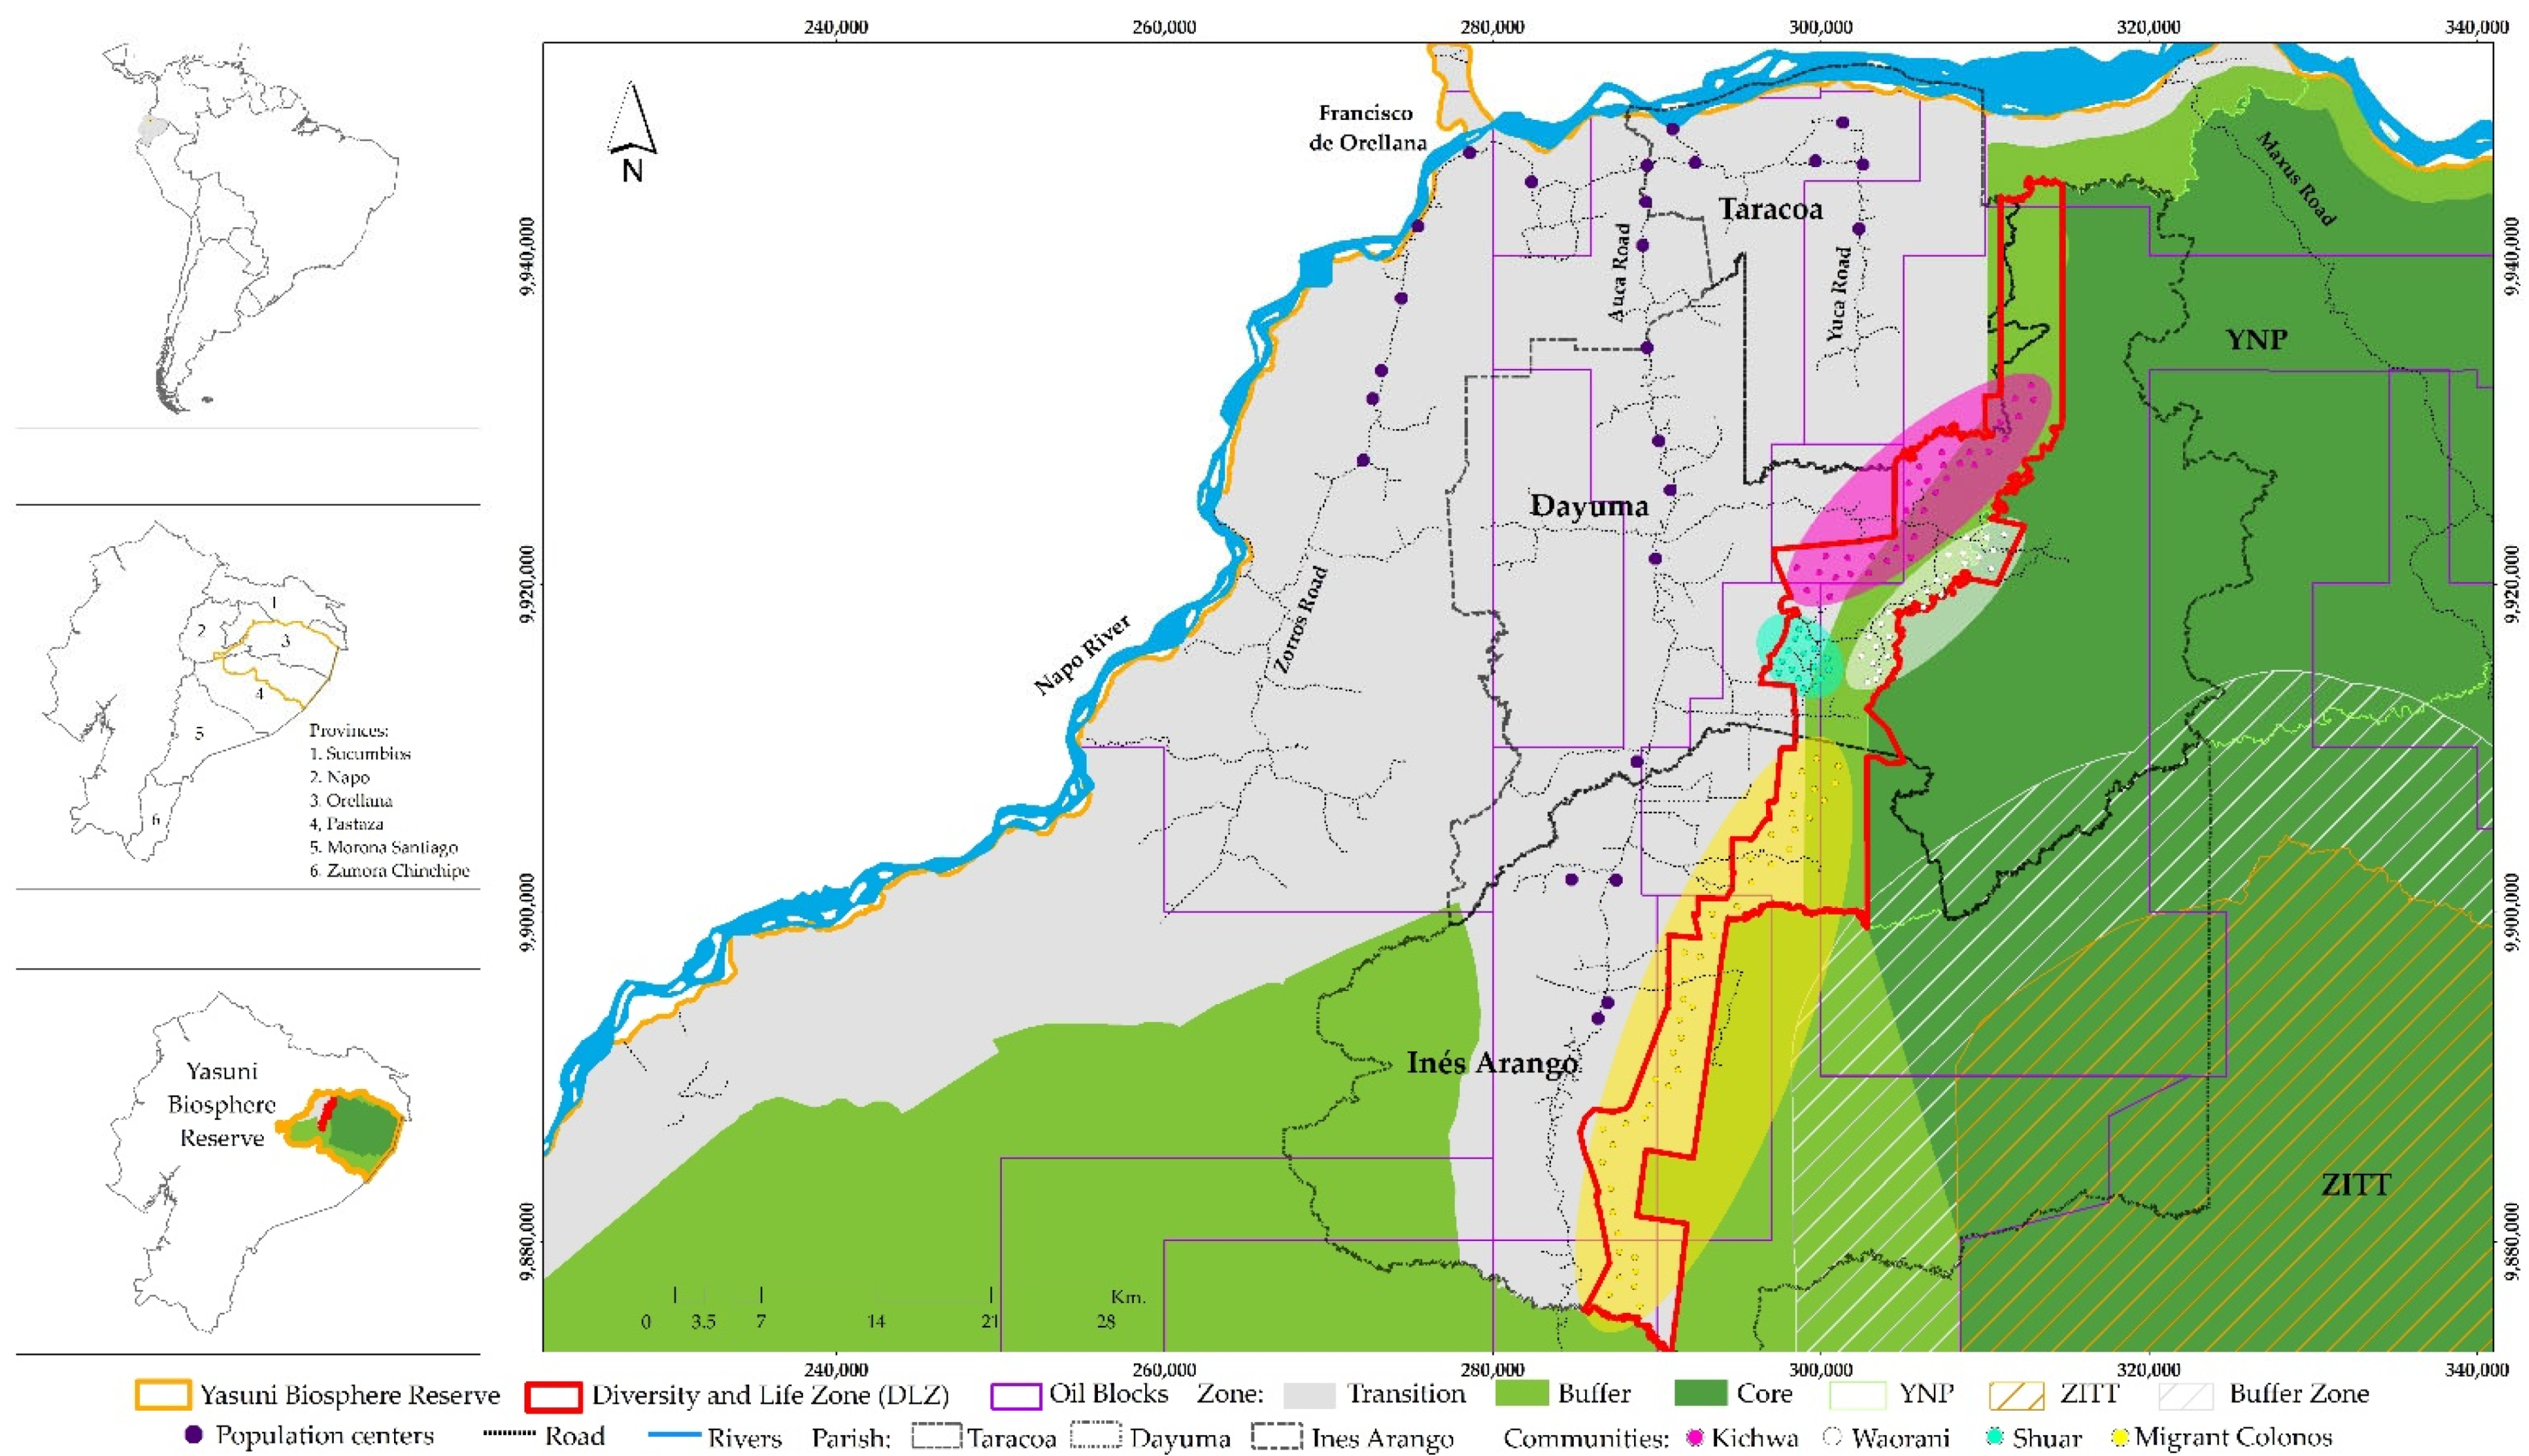
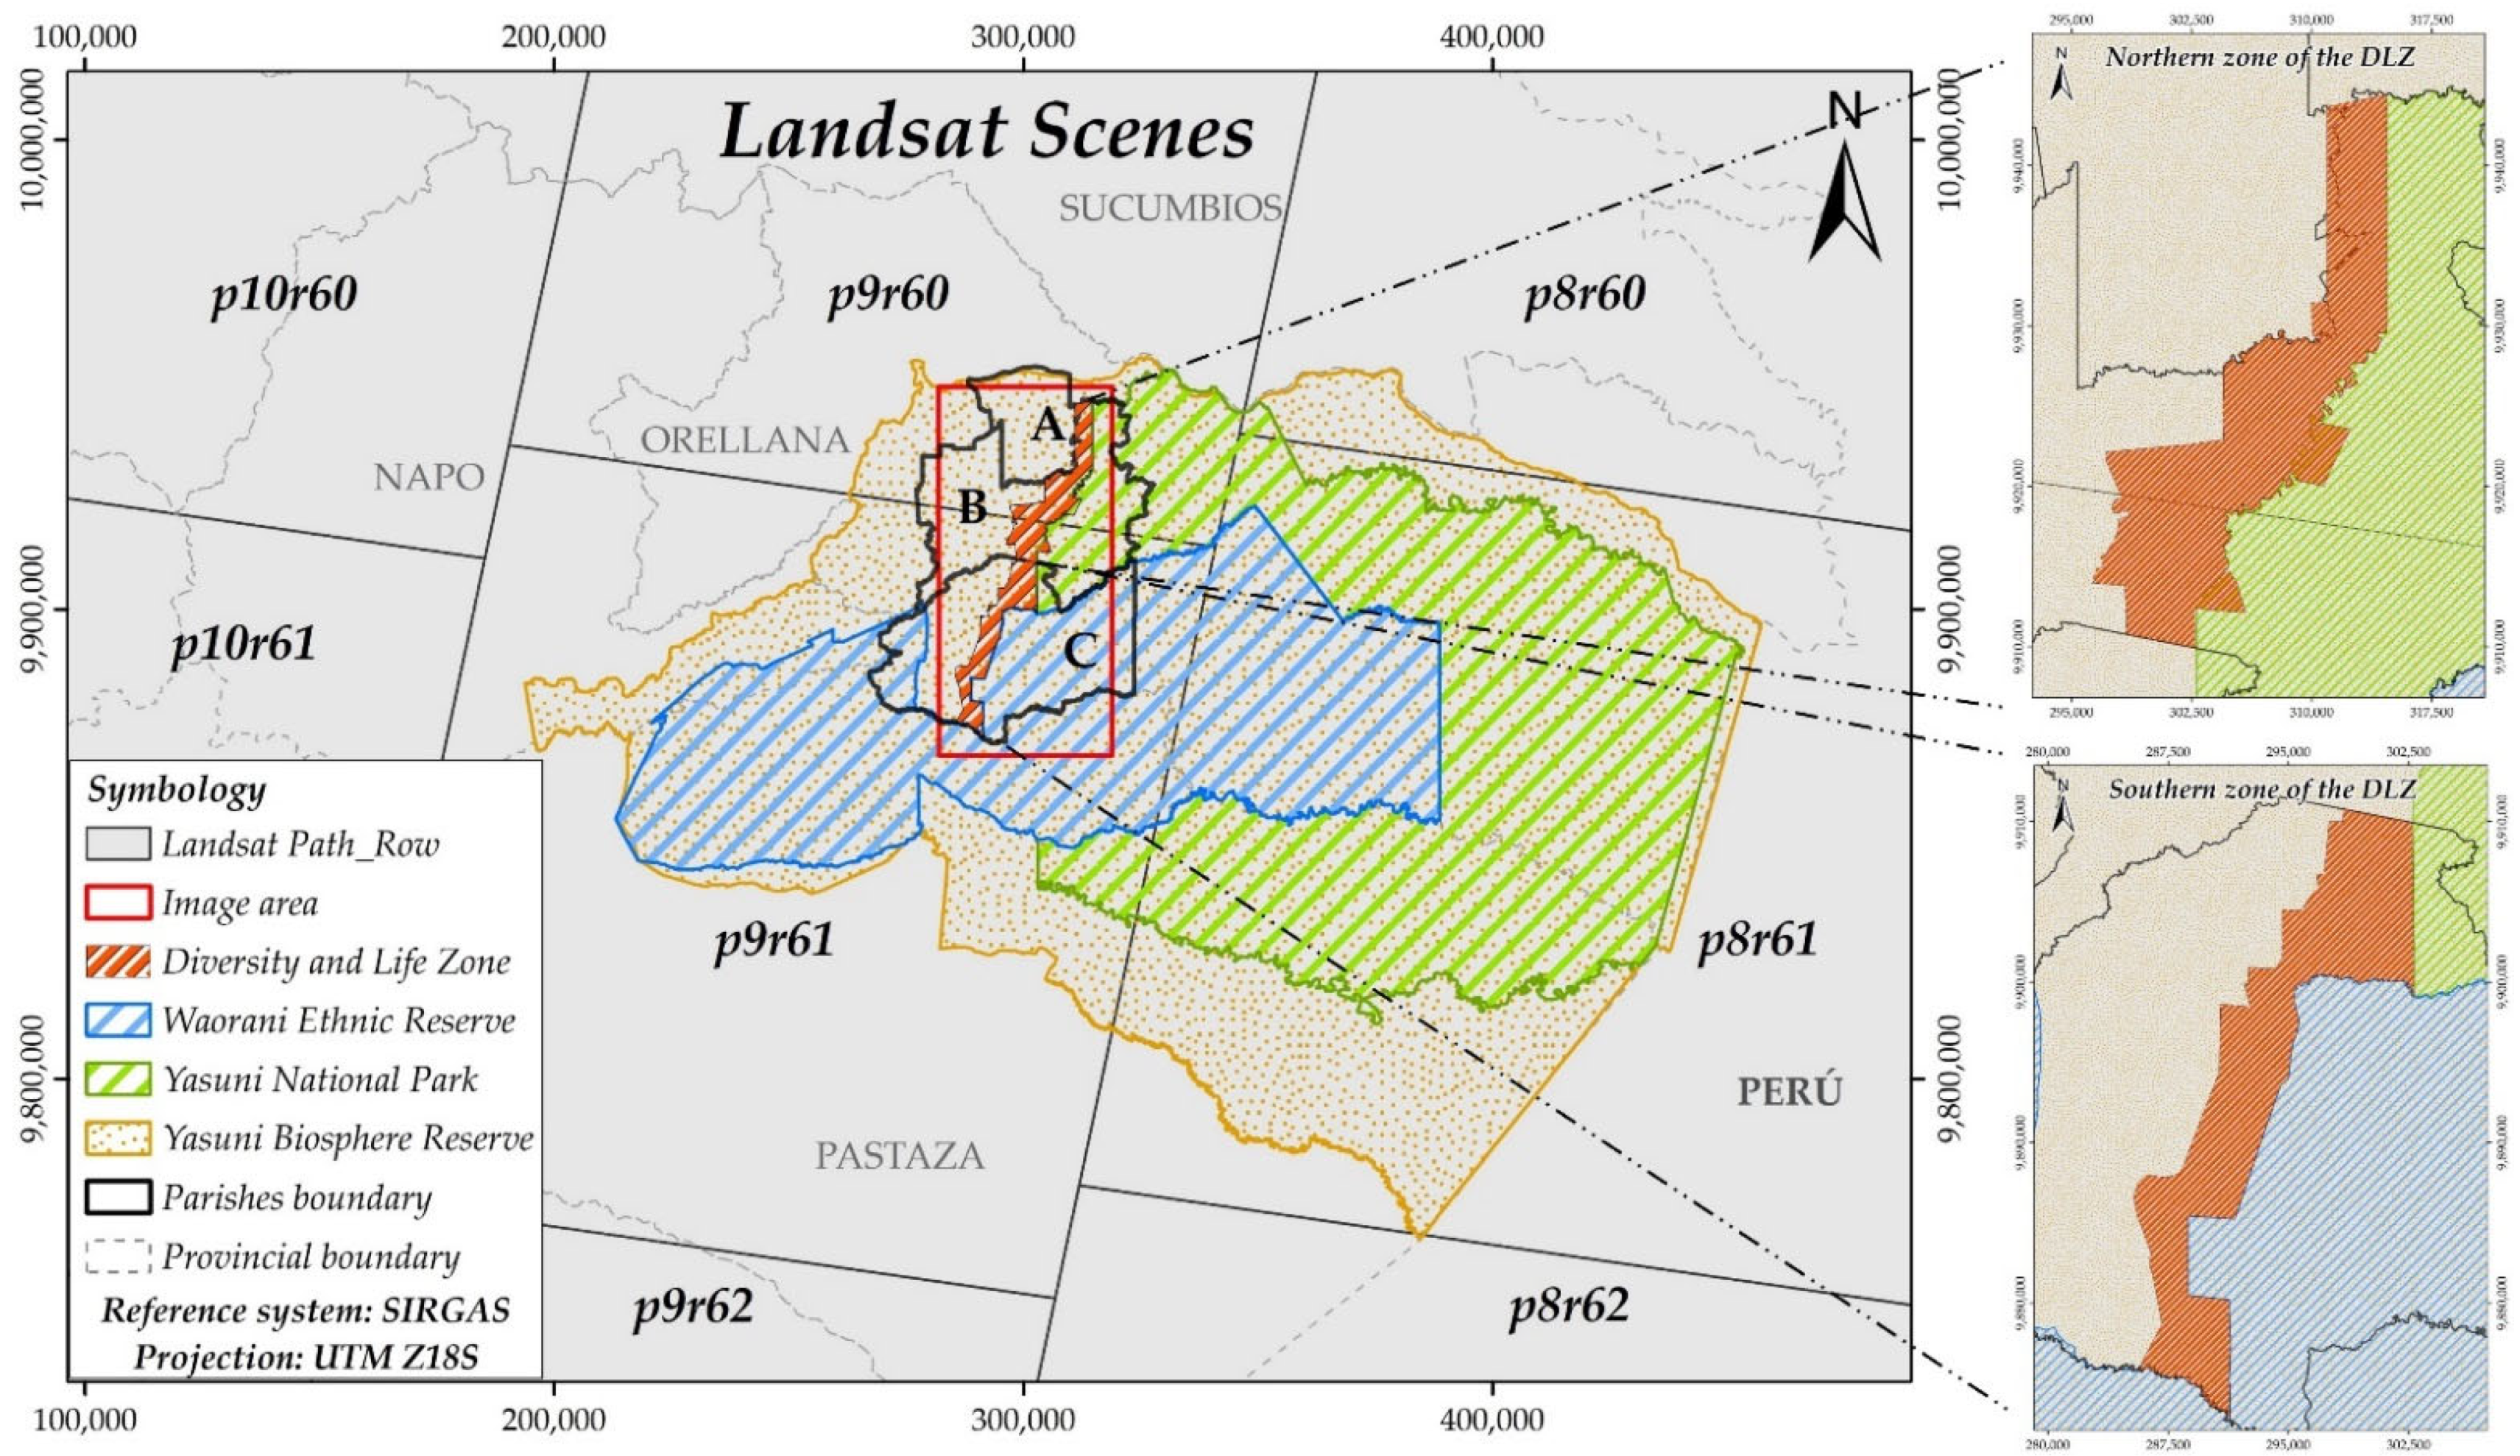
2.1. Study Area
2.2. Classification and Detection of Changes in the DLZ
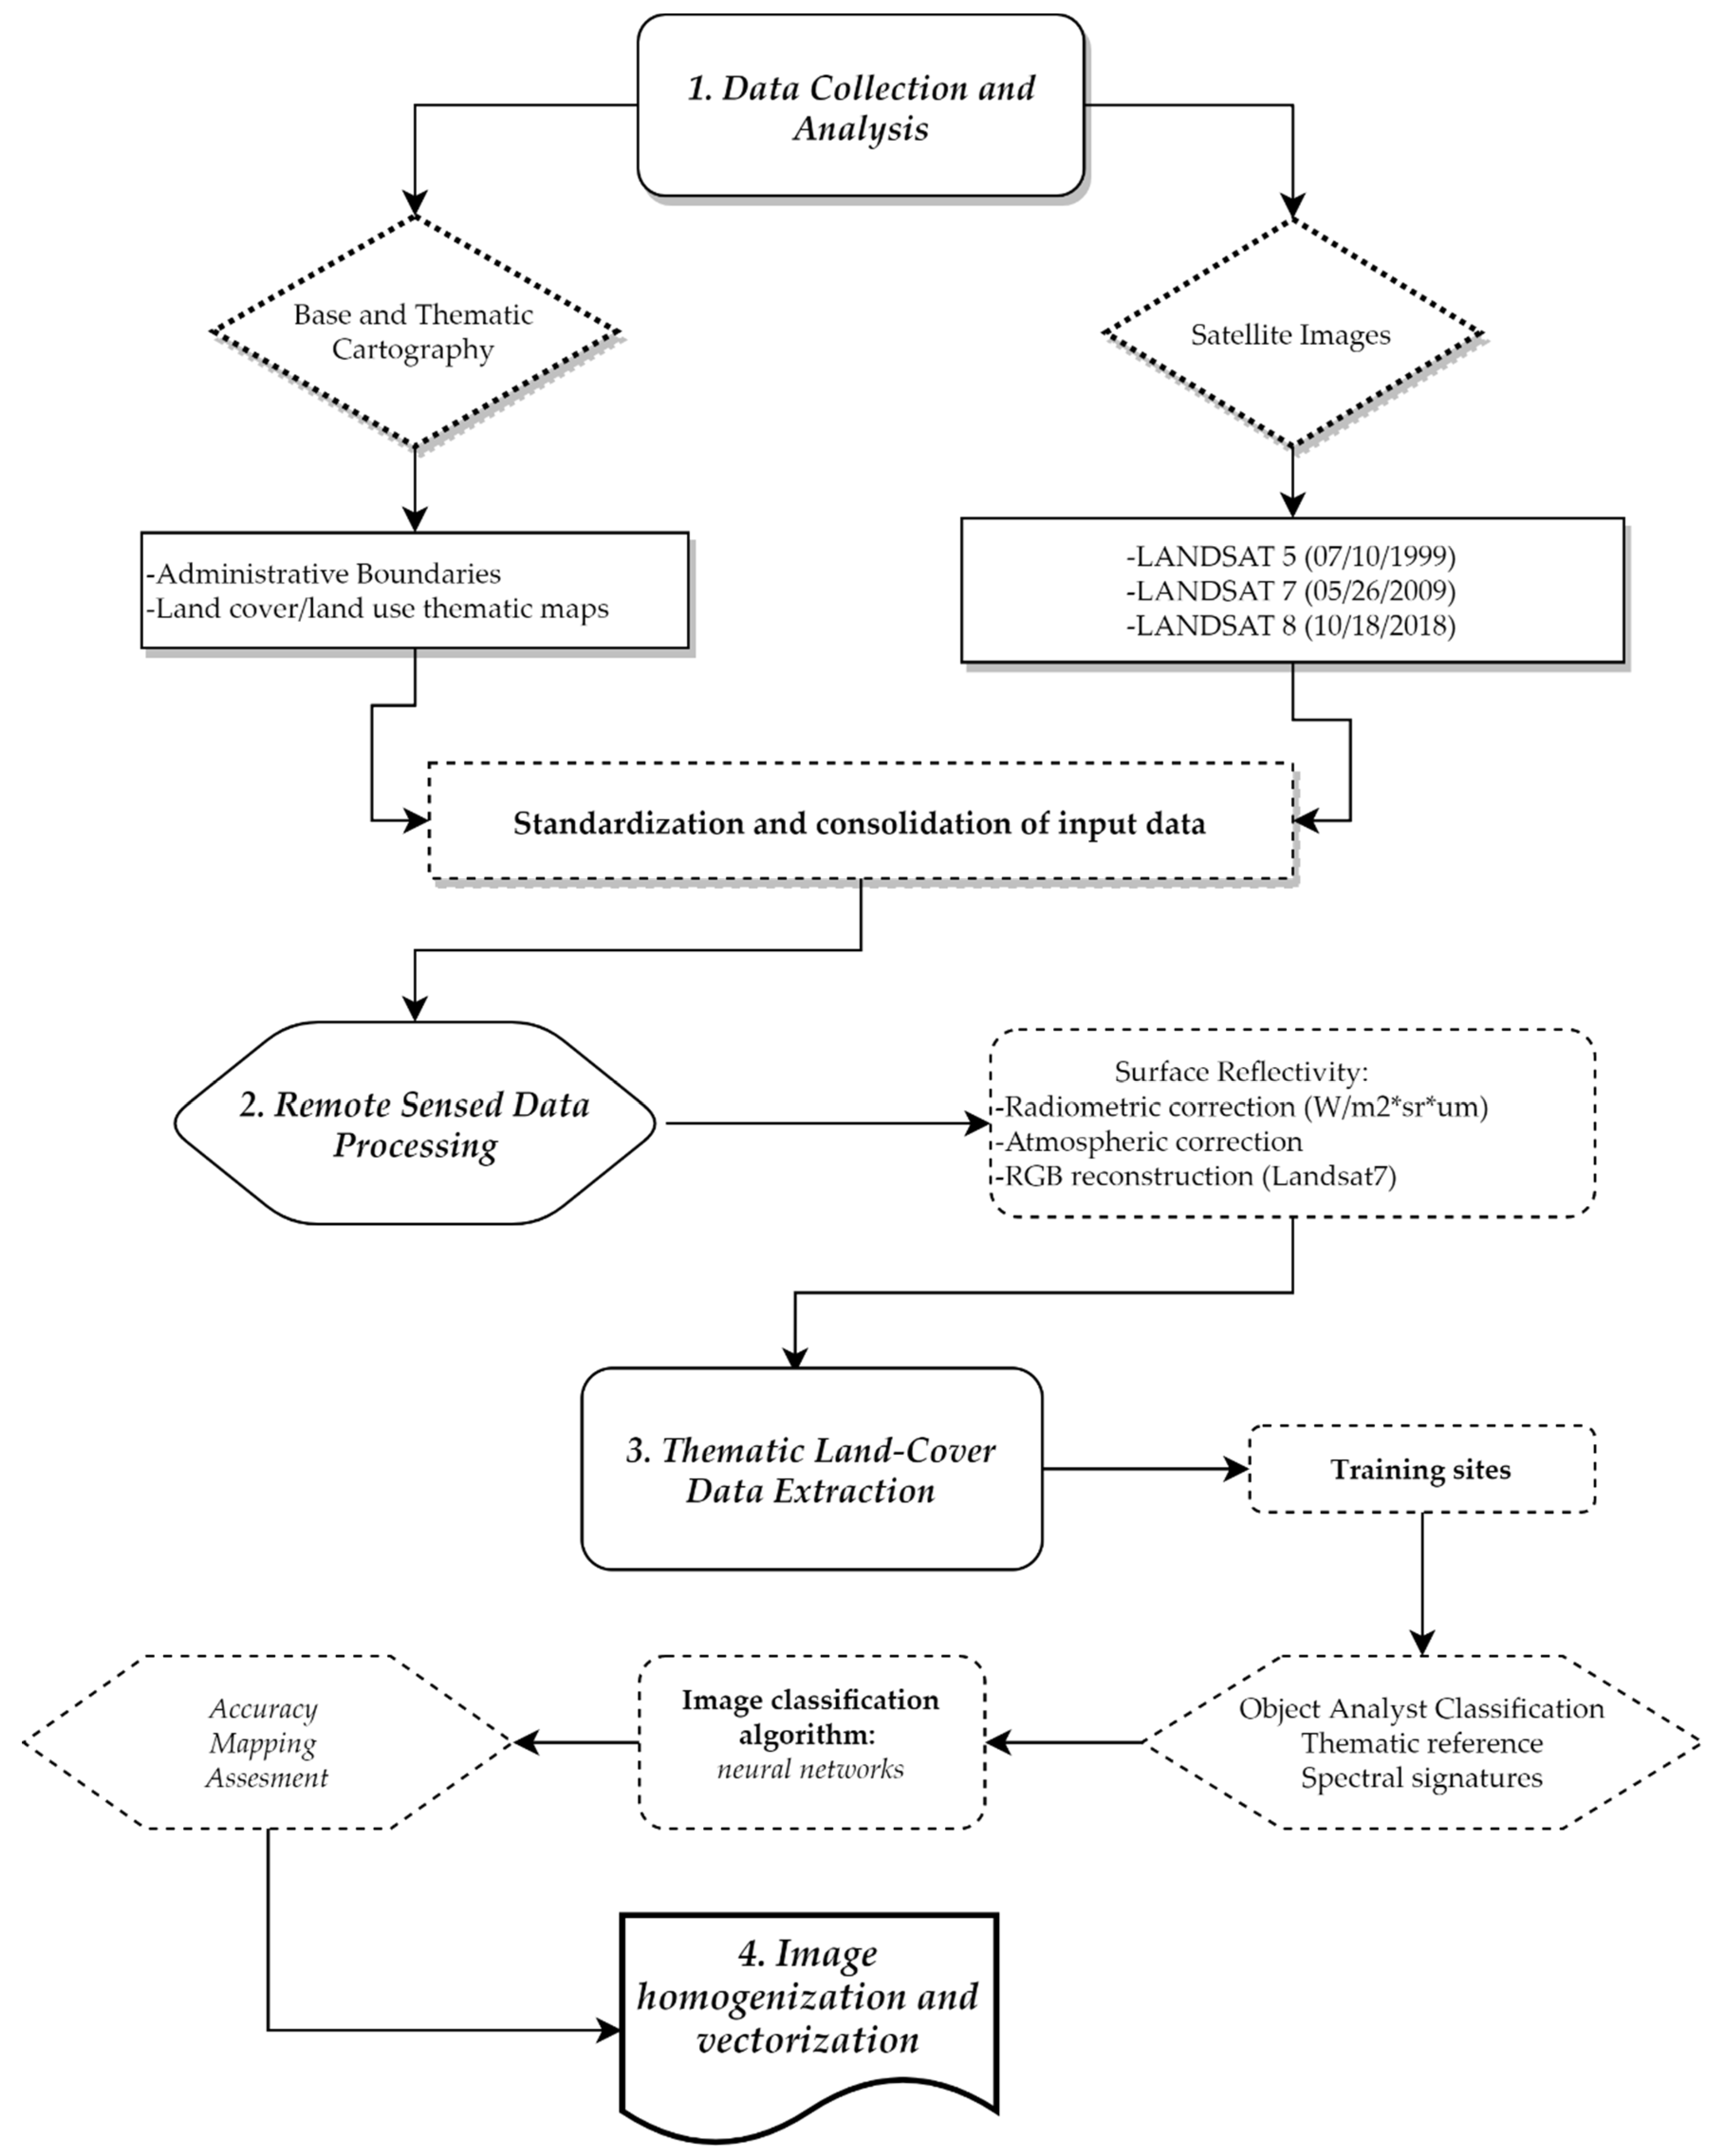
2.2.1. Data Collection and Analysis
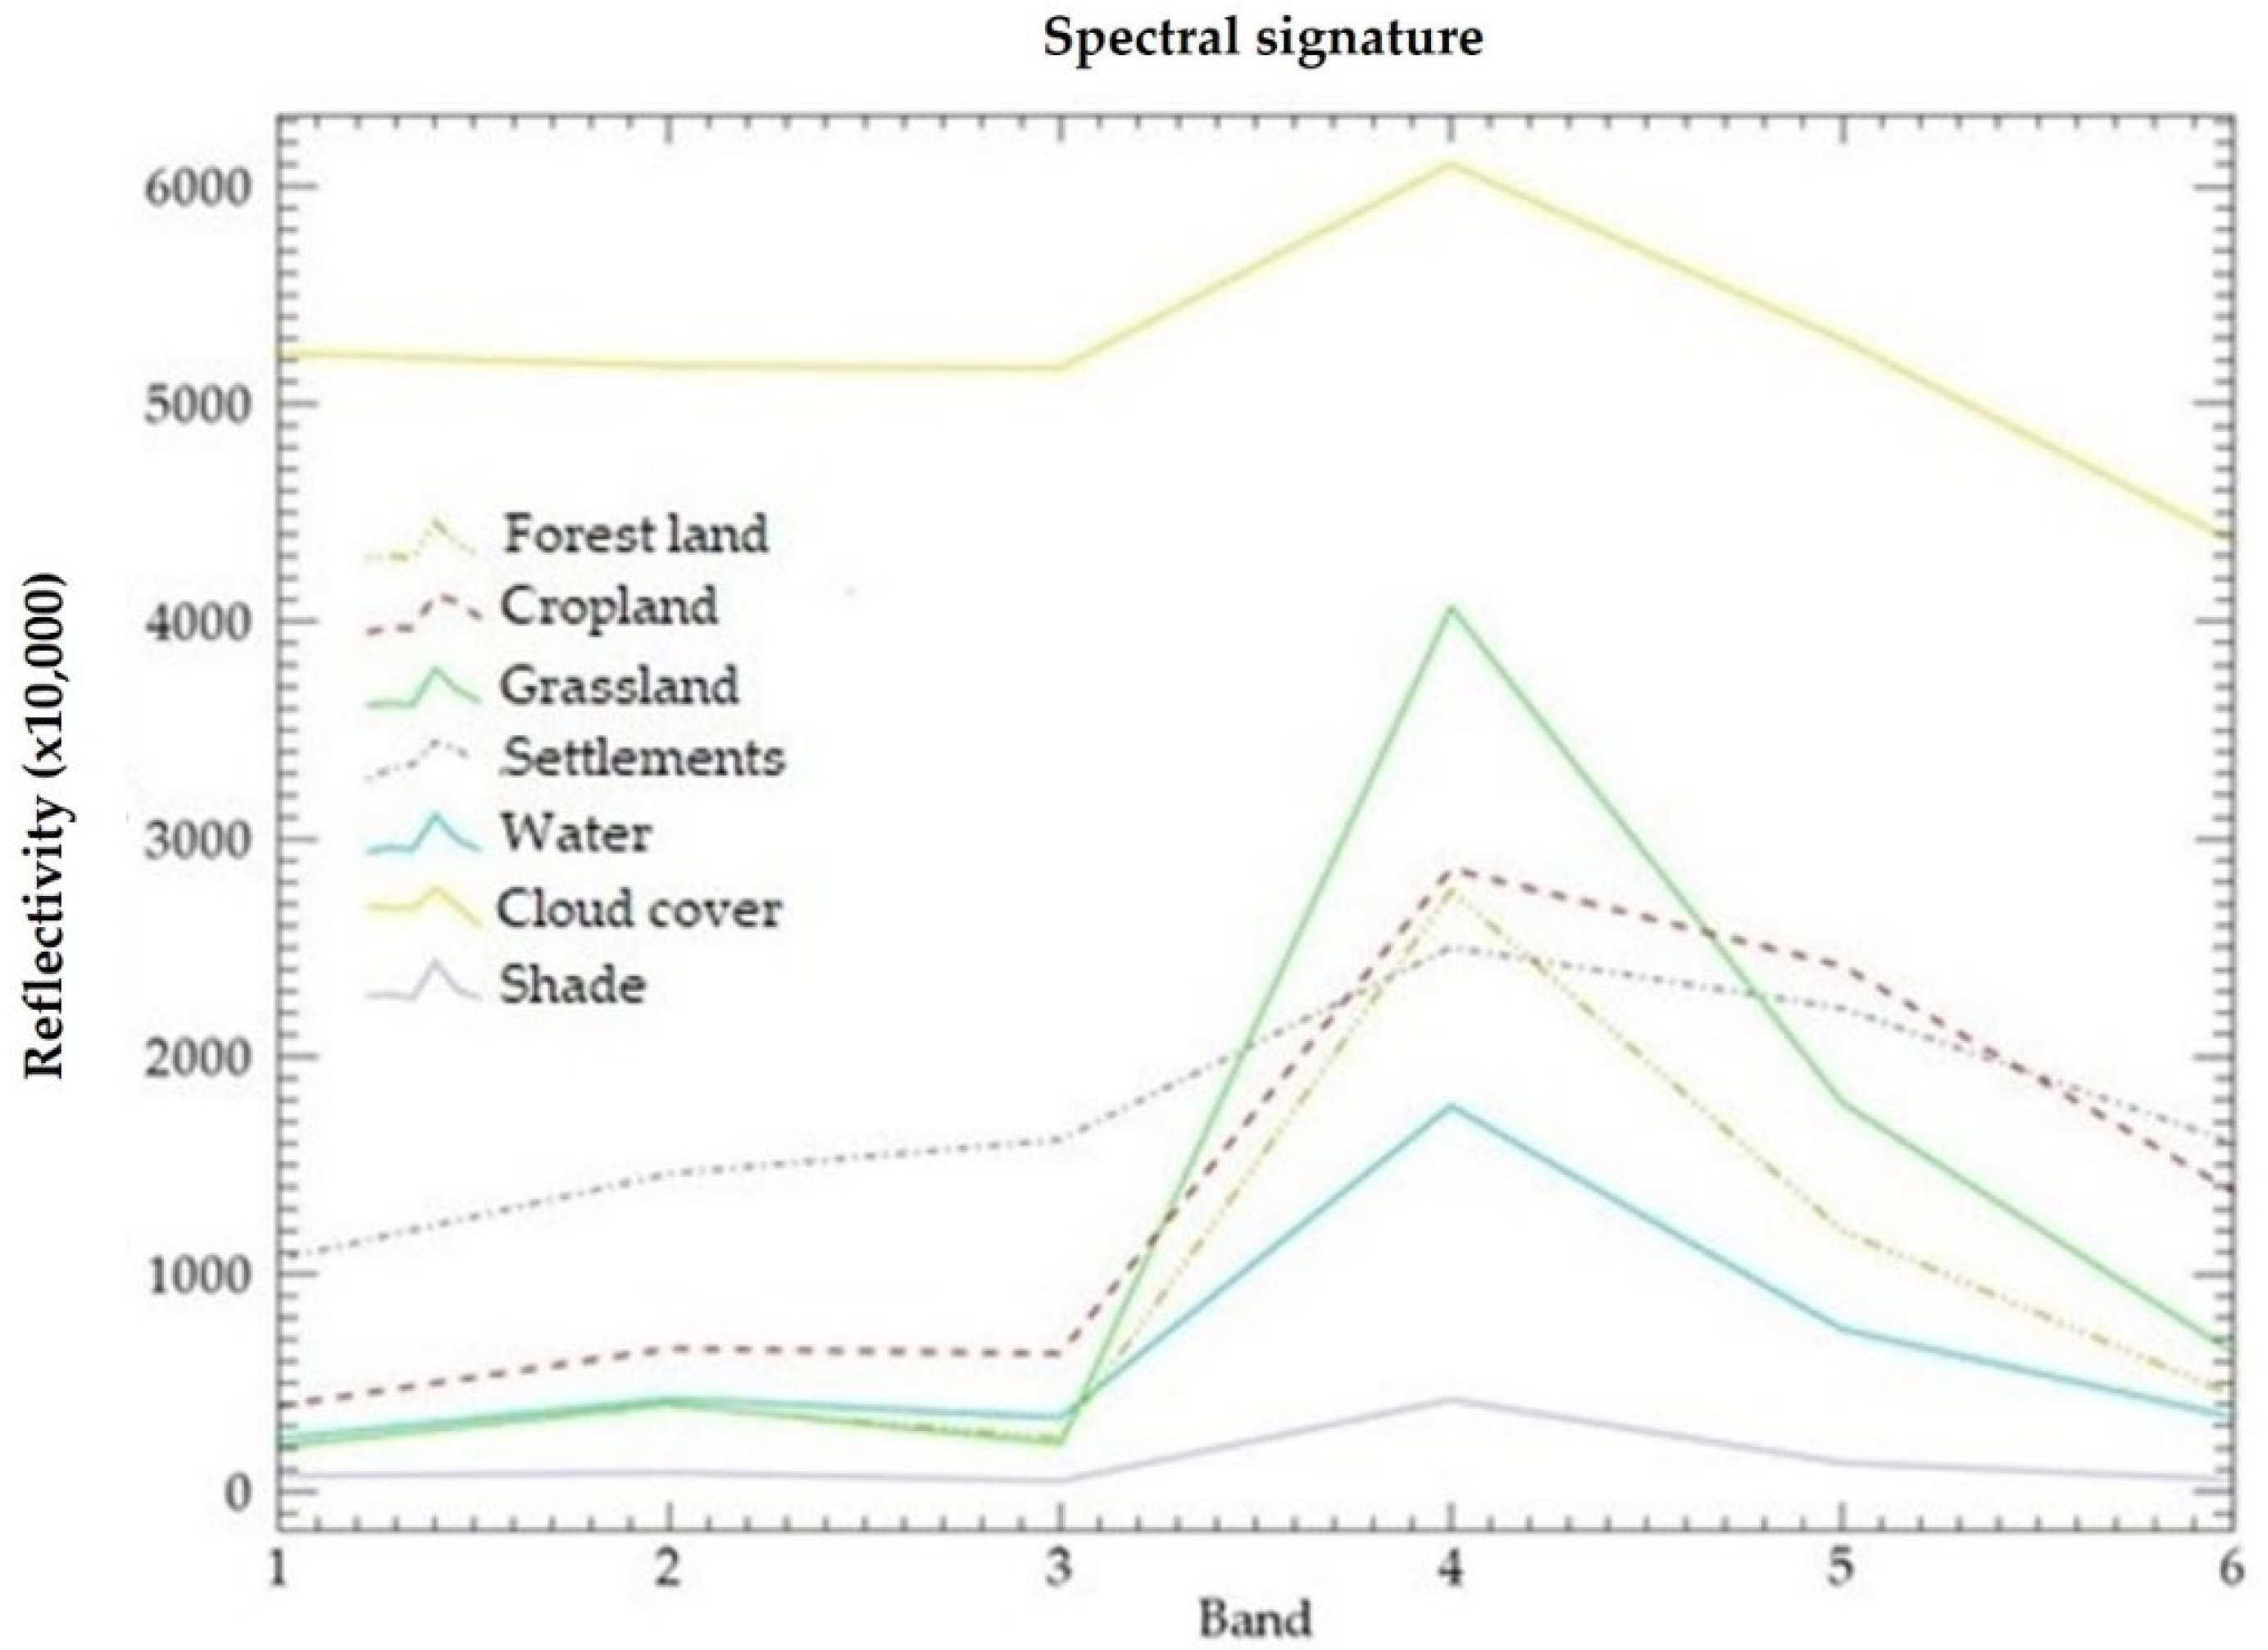
2.2.2. Data Processing for Remote Sensing
2.2.3. Thematic Land Cover
2.2.4. Homogenization and Vectorization of Images
3. Results and Discussion
3.1. Land Use and Land Cover (LULC) in the Life and Diversity Zone (1999–2018)
3.1.1. Validation of Classifications
3.1.2. Land Use and Landcover Change (LULC)
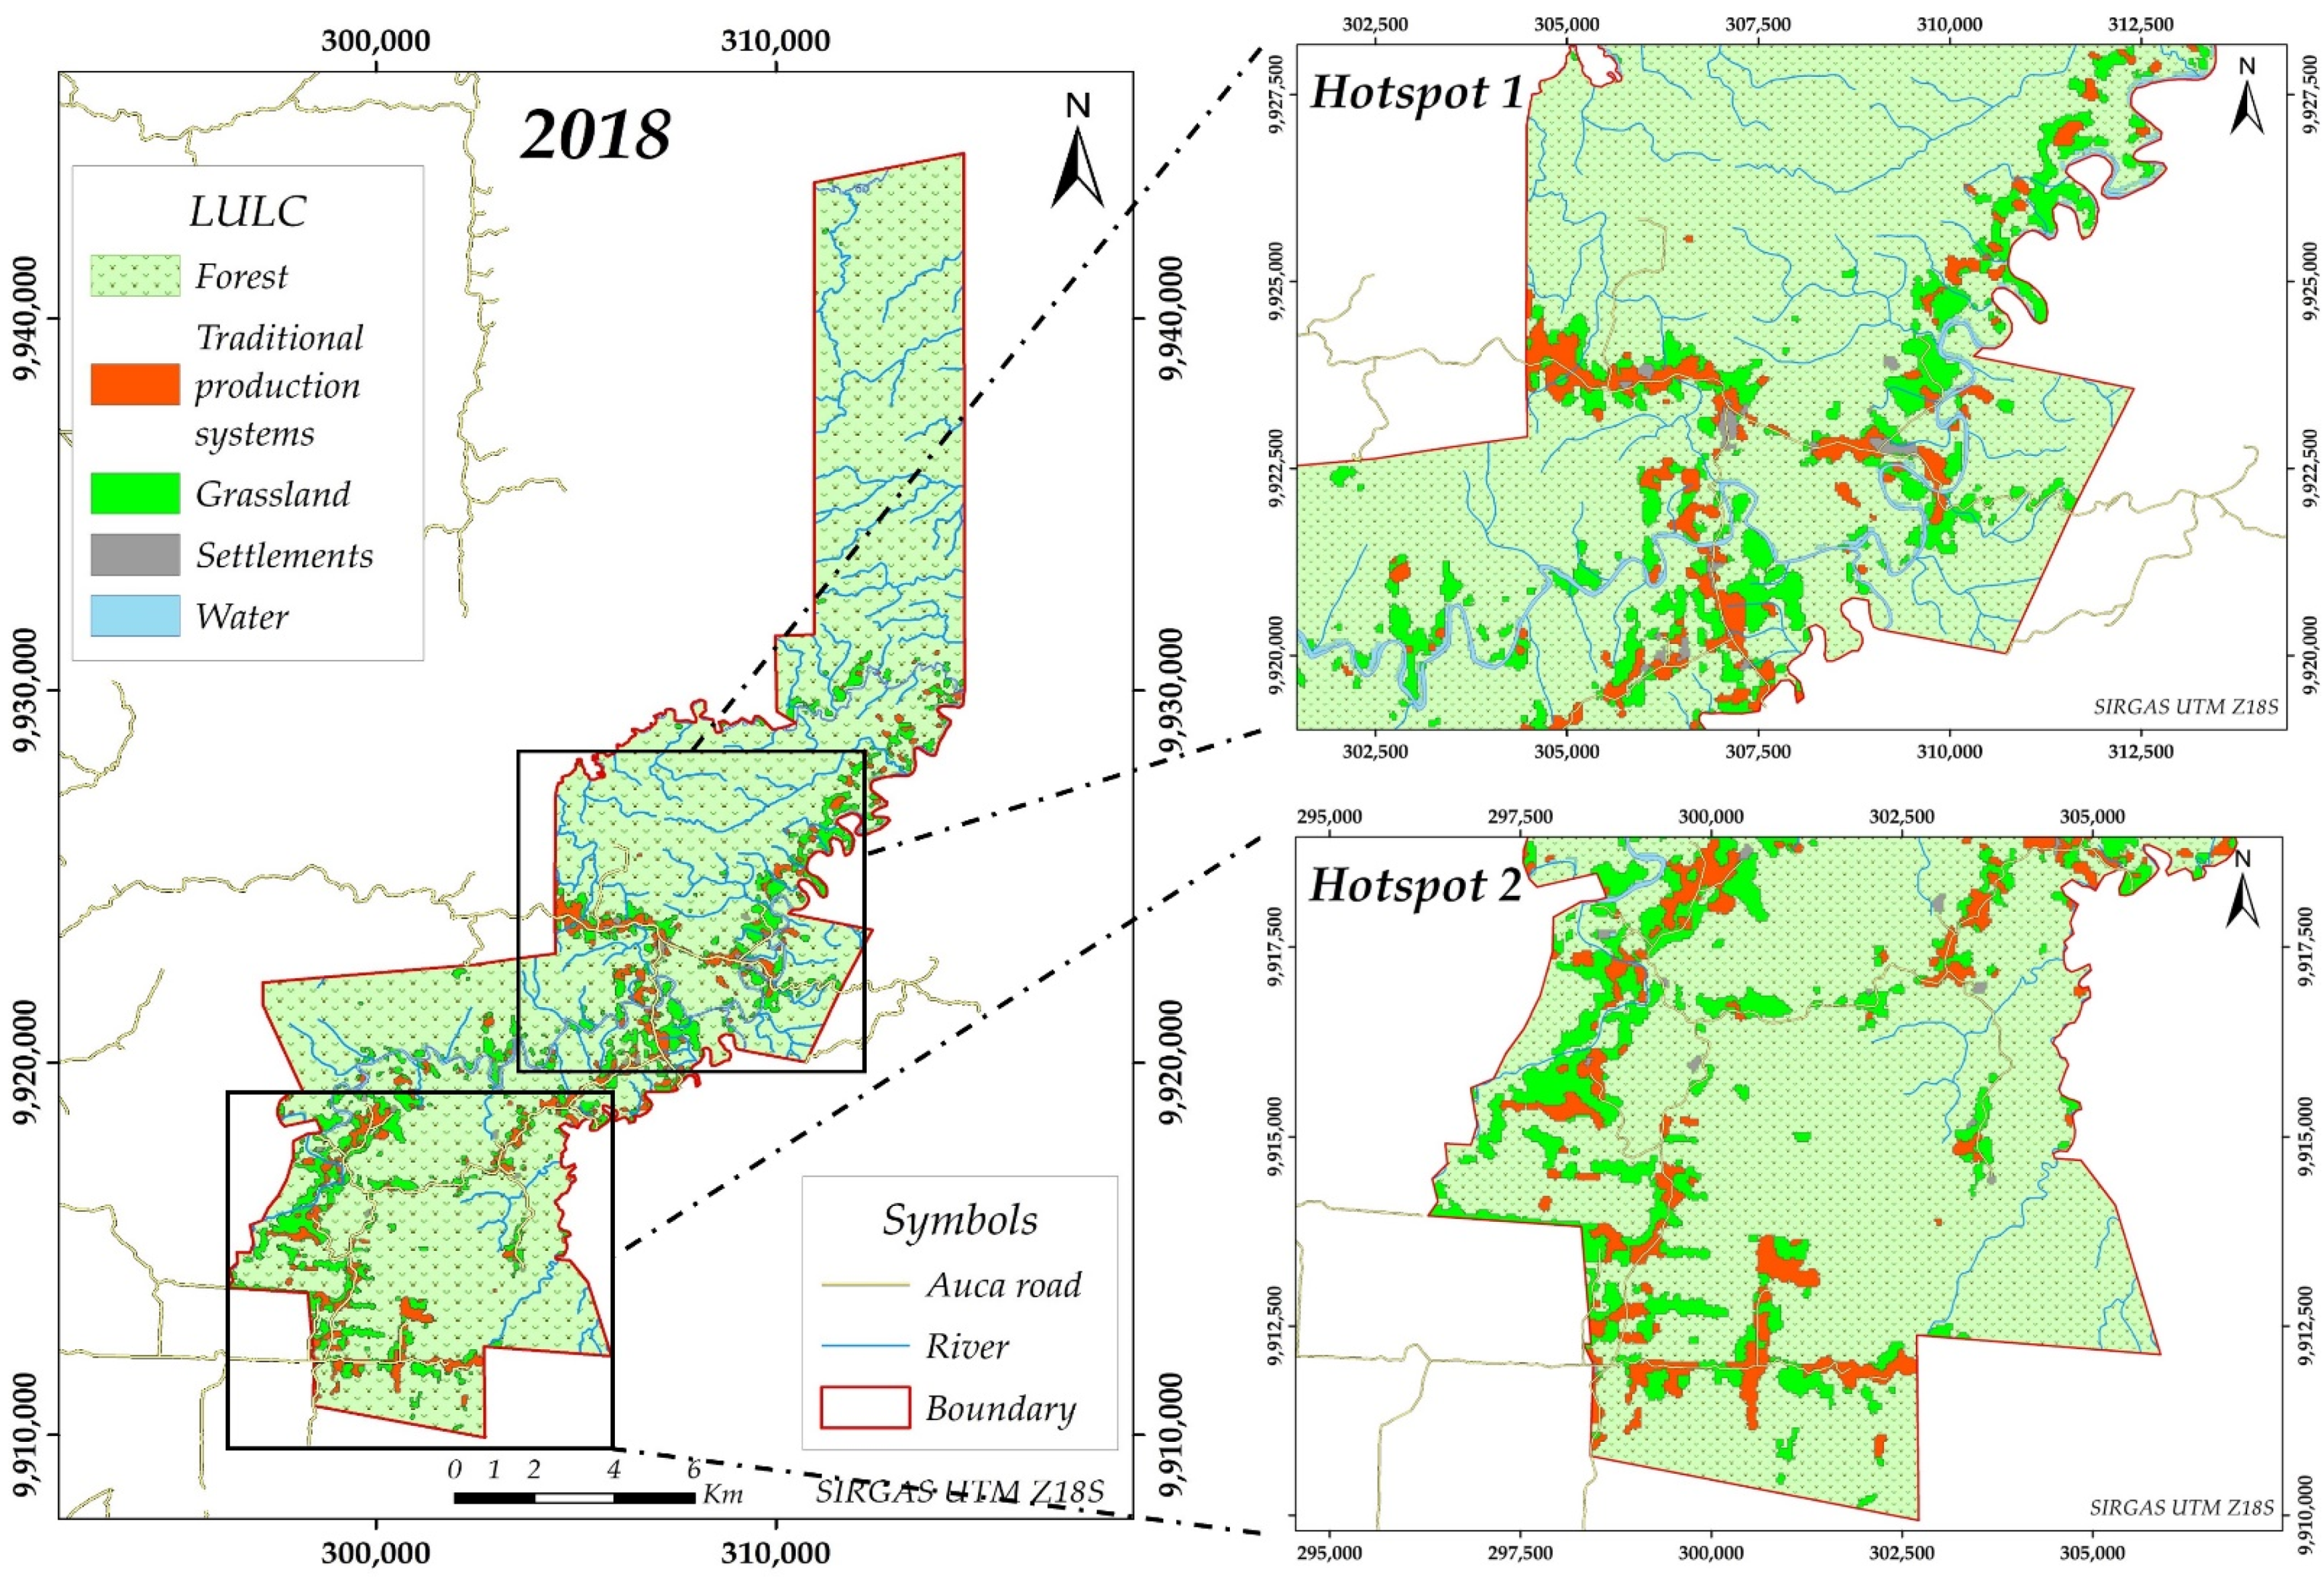
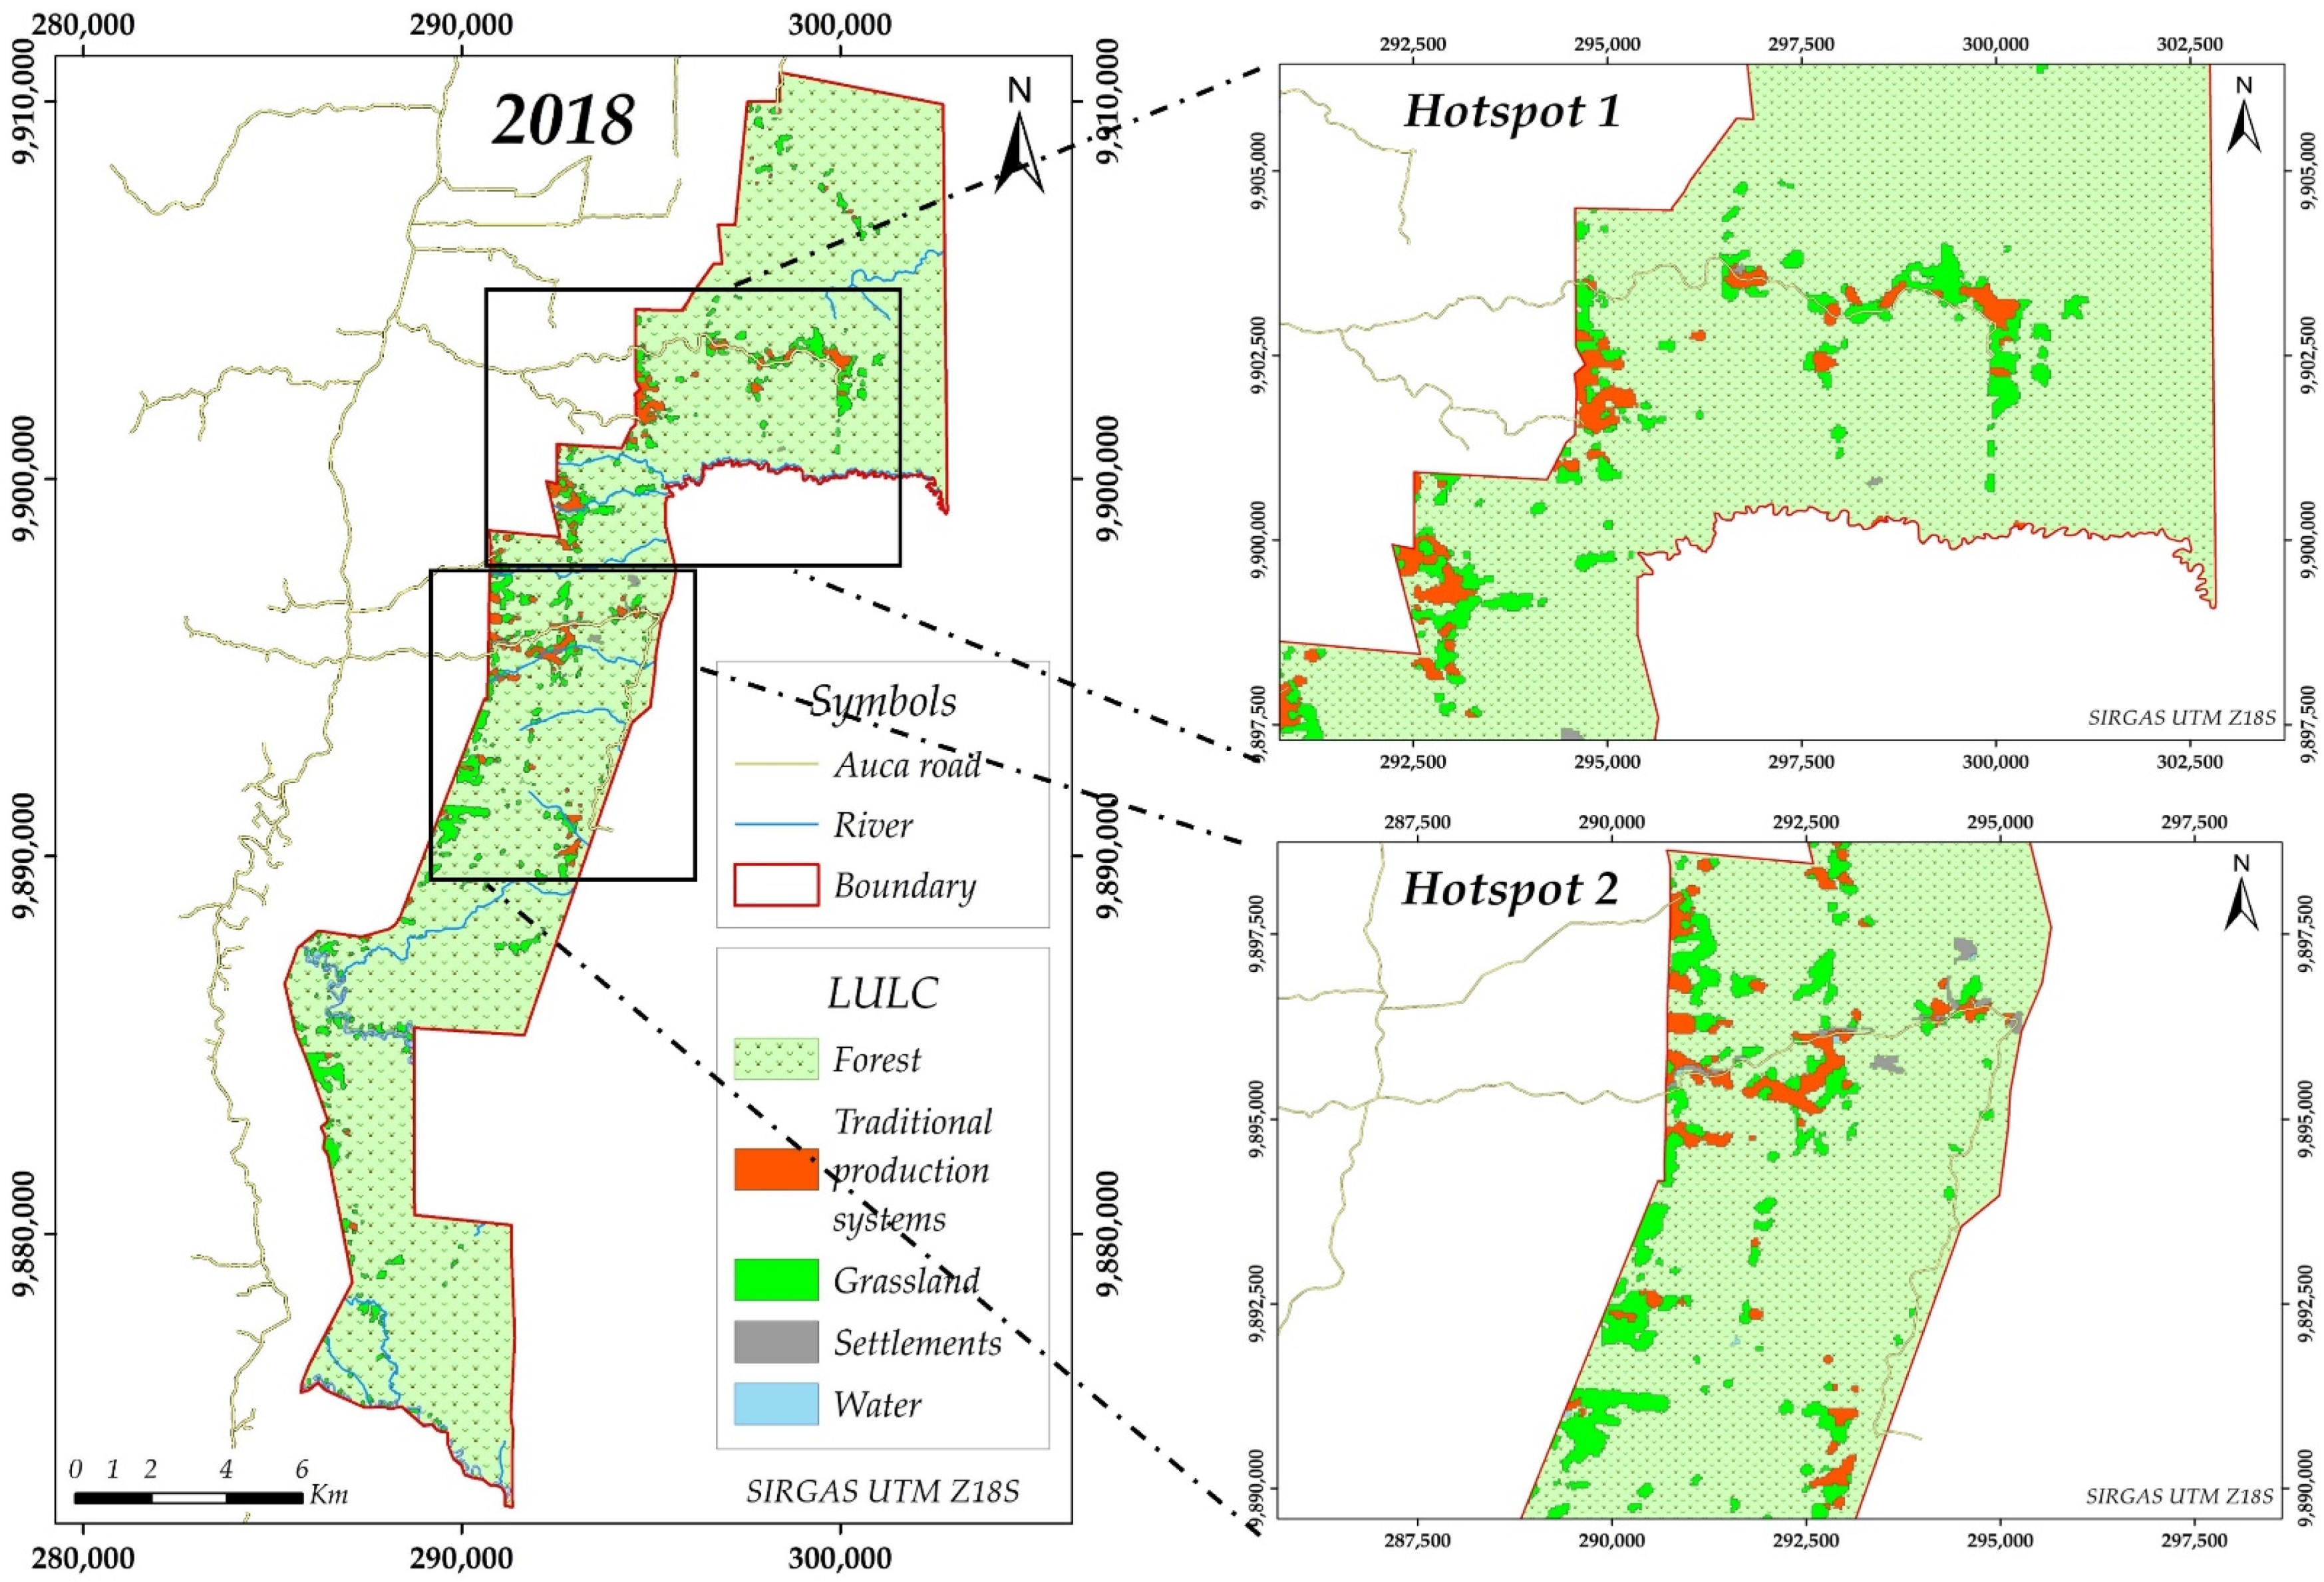
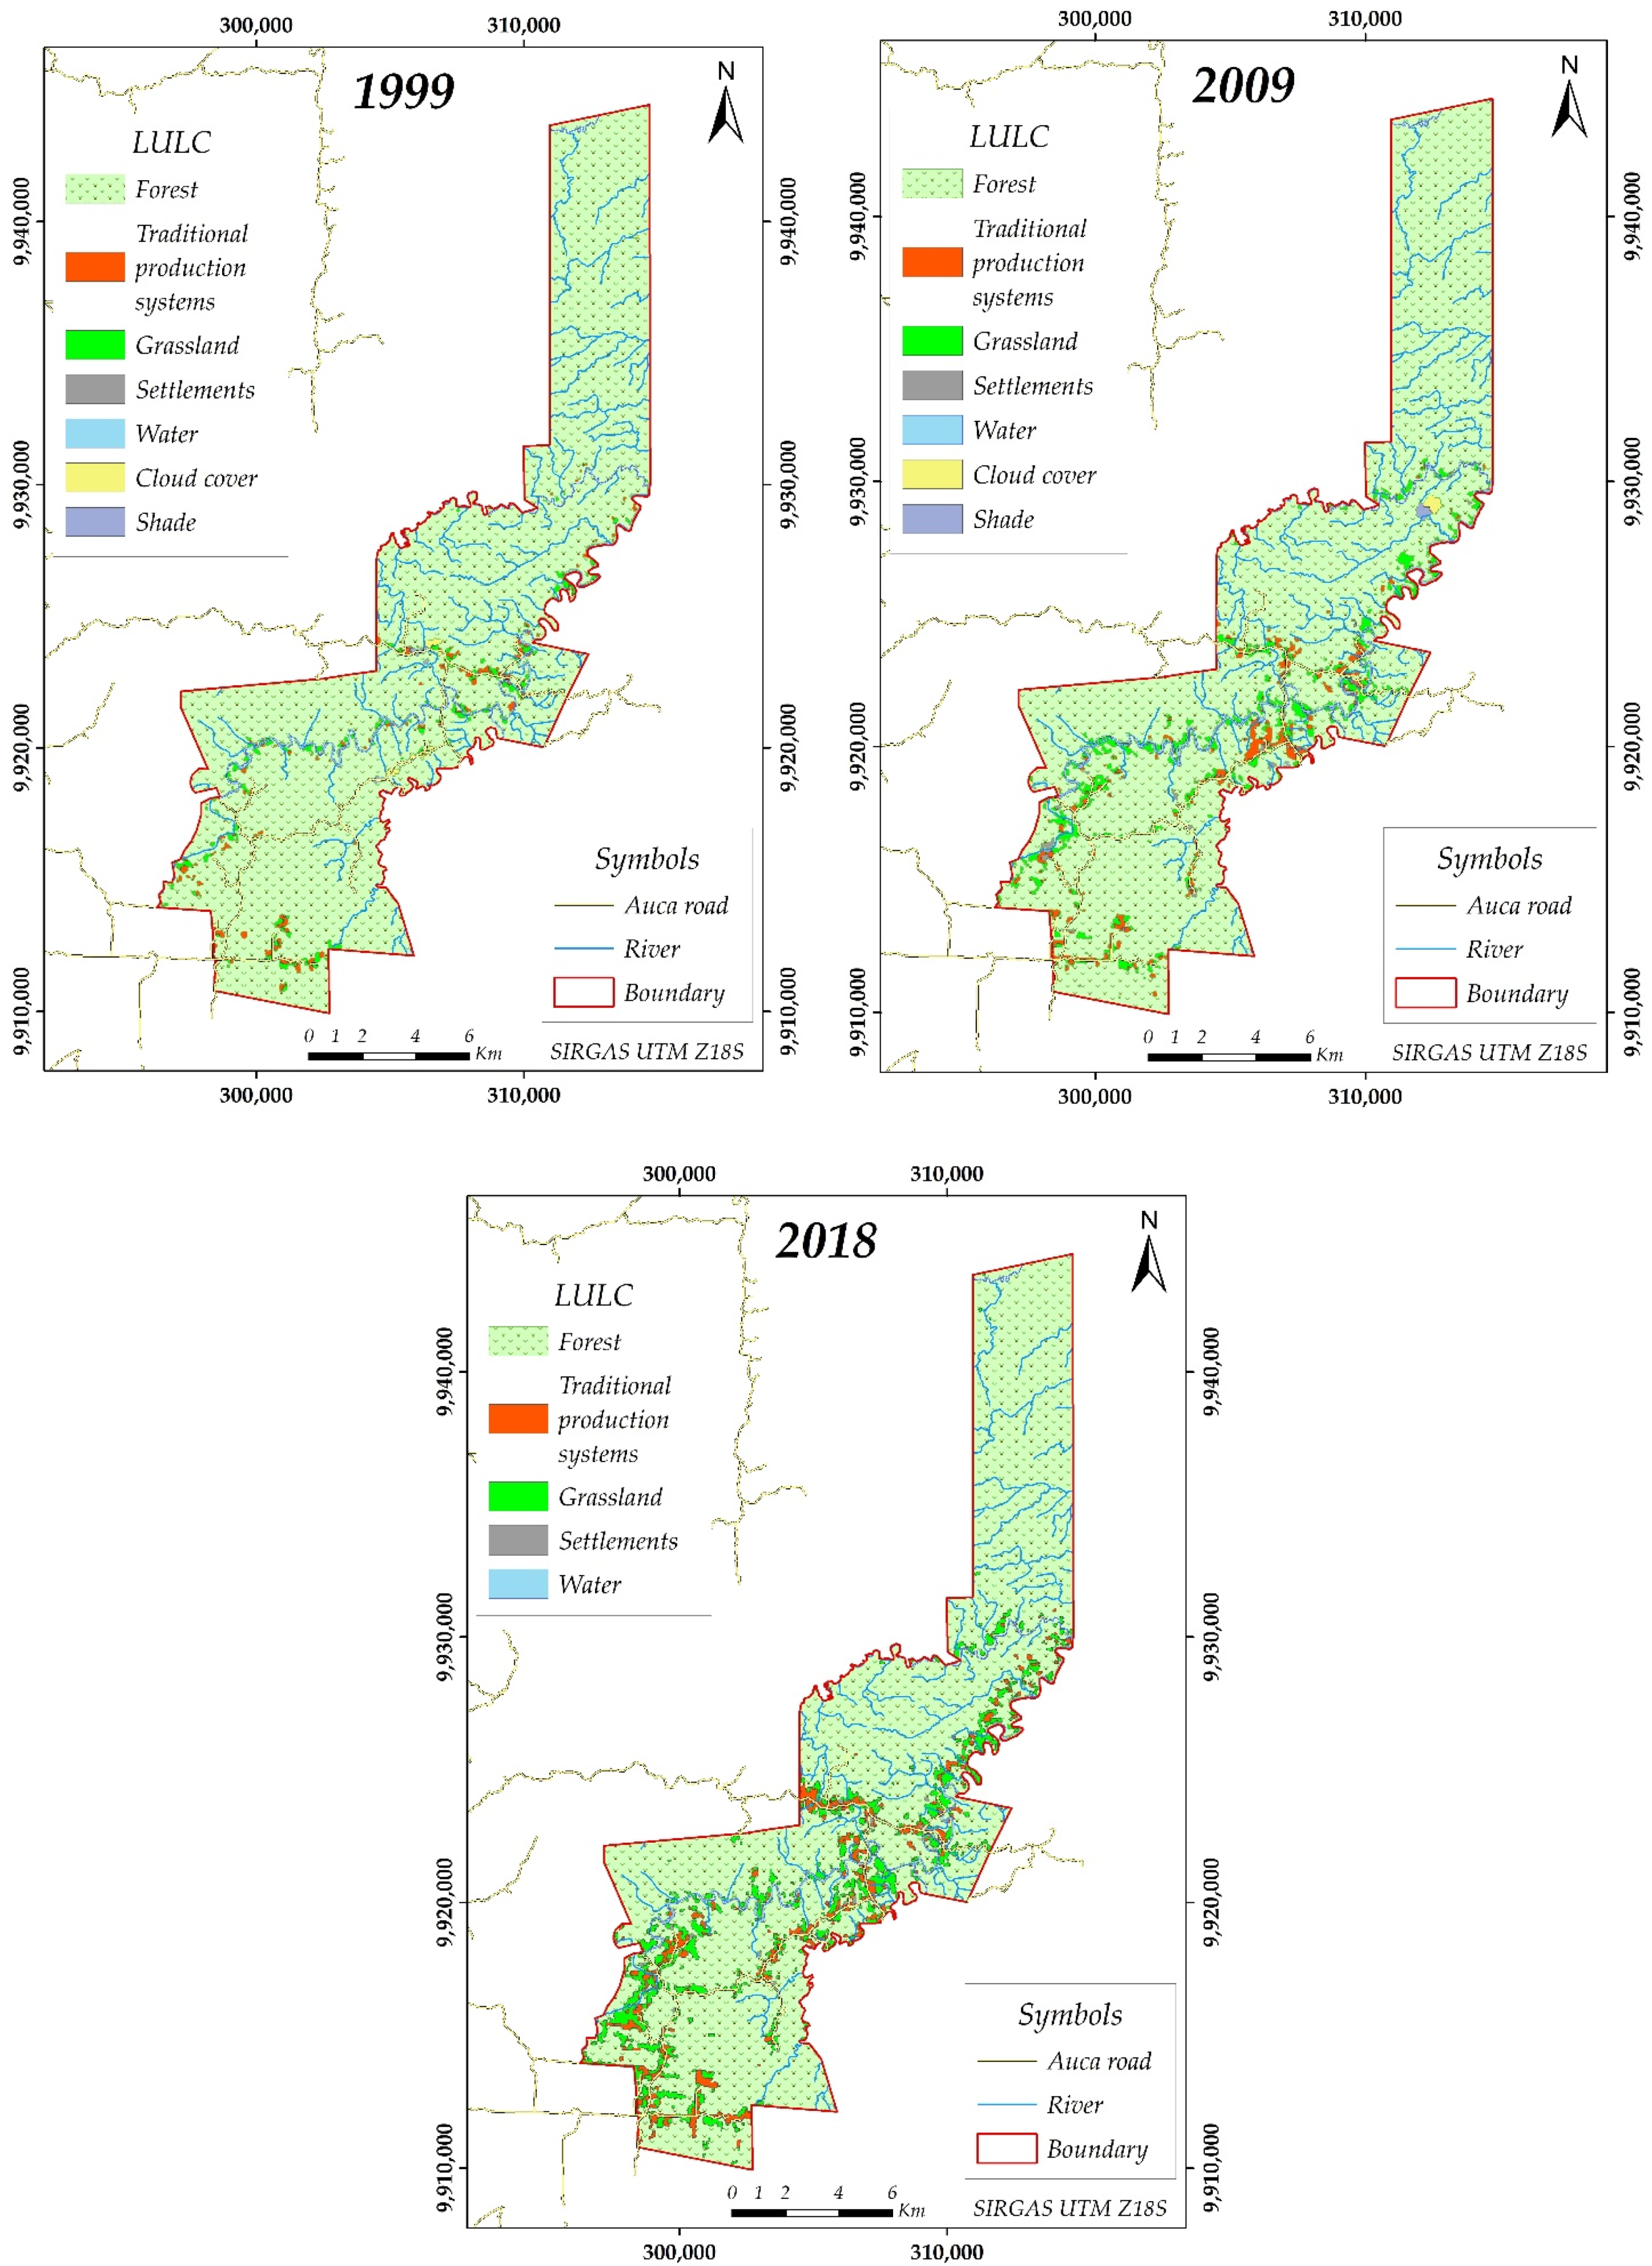
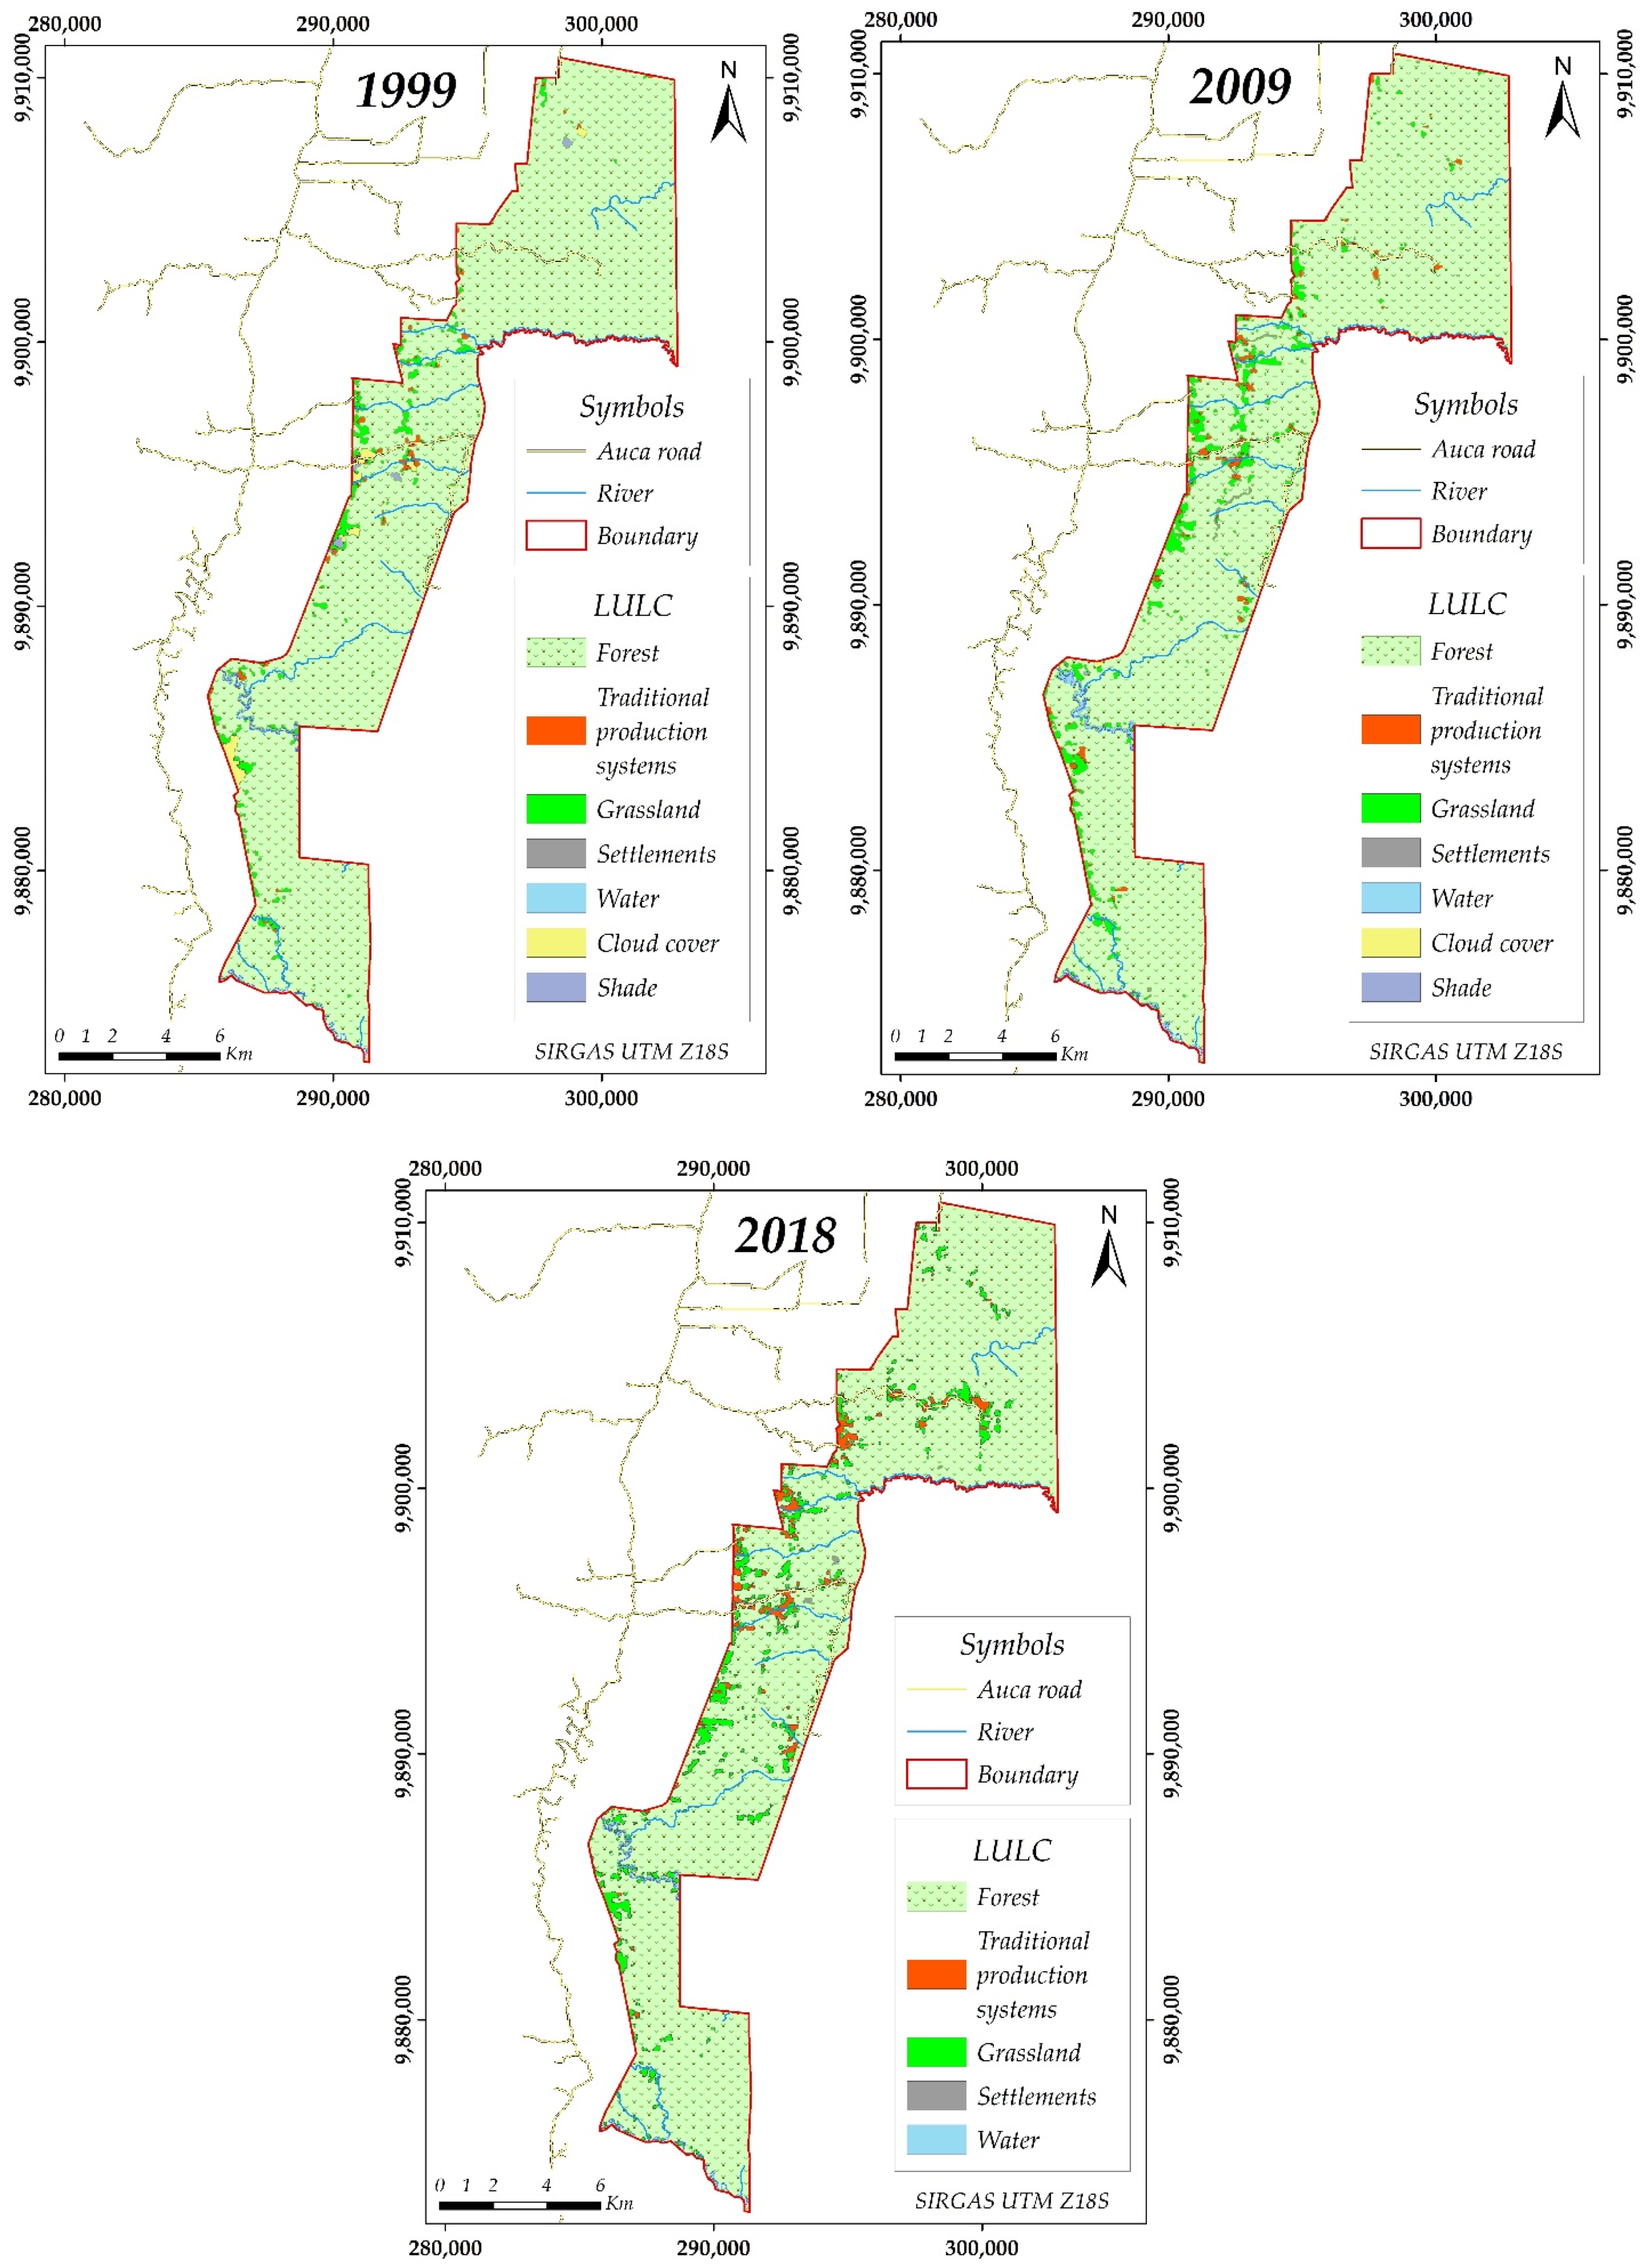
3.1.3. Hotspots of LULC within the DLZ
3.1.4. Potential Policy Implications for Sustainable Land Use in the DLZ
4. Conclusions
Author Contributions
Funding
Acknowledgments
Conflicts of Interest
References
- Torres, B.; Andrade, L.; Navarrete, A.T.; Vasco, C.; Robles, M. Cambio de uso del suelo en paisajes agrícolas-forestales: Análisis espacial en cinco comunidades Kichwas de la Región Amazónica Ecuatoriana. Rev. Amaz. Cienc. Tecnol. 2018, 7, 105–118. [Google Scholar]
- Barreto-Álvarez, D.E.; Heredia-Rengifo, M.G.; Padilla-Almeida, O.; Toulkeridis, T. Multitemporal Evaluation of the Recent Land Use Change in Santa Cruz Island, Galapagos, Ecuador. In Conference on Information and Communication Technologies of Ecuador; Springer: Cham, Switzerland, 2020; pp. 519–534. [Google Scholar]
- Lambin, E.F.; Geist, H.J.; Lepers, E. Dynamics of land-use and land-cover change in tropical regions. Annu. Rev. Environ. Resour. 2003, 28, 205–241. [Google Scholar] [CrossRef] [Green Version]
- Armenteras, D.; Murcia, U.; González, T.M.; Barón, O.J.; Arias, J.E. Scenarios of land use and land cover change for NW Amazonia: Impact on forest intactness. Glob. Ecol. Conserv. 2019, 17, e00567. [Google Scholar] [CrossRef]
- Haindongo, P.N.; Kalumba, A.M.; Orimoloye, I.R. Local people’s perceptions about Land Use Cover Change (LULCC) for sustainable human wellbeing in Namibia. GeoJournal 2020, 1–15. [Google Scholar] [CrossRef]
- Lu, D.; Li, G.; Moran, E.; Hetrick, S. Spatiotemporal analysis of land-use and land-cover change in the Brazilian Amazon. Int. J. Remote. Sens. 2013, 34, 5953–5978. [Google Scholar] [CrossRef] [Green Version]
- Halmy, M.W.A.; Gessler, P.E.; Hicke, J.A.; Salem, B.B. Land use/land cover change detection and prediction in the north-western coastal desert of Egypt using Markov-CA. Appl. Geogr. 2015, 63, 101–112. [Google Scholar] [CrossRef]
- Wang, C.; Yang, Y. An overview of farmers’ livelihood strategy change and its effect on land use/cover change in developing countries. Prog. Geogr. 2012, 31, 792–798. [Google Scholar]
- Bruijnzeel, L.A. Hydrological functions of tropical forests: Not seeing the soil for the trees? Agric. Ecosyst. Environ. 2004, 104, 185–228. [Google Scholar] [CrossRef]
- Akinyemi, F.O. Vegetation Trends, Drought Severity and Land Use-Land Cover Change during the Growing Season in Semi-Arid Contexts. Remote Sens. 2021, 13, 836. [Google Scholar] [CrossRef]
- Foley, J.A.; De Fries, R.; Asner, G.P.; Barford, C.; Bonan, G.; Carpenter, S.R.; Stuart Chapin, F.; Coe, M.T.; Daily, G.C.; Gibbs, H.K.; et al. Global consequences of land use. Science 2005, 309, 570–574. [Google Scholar] [CrossRef] [Green Version]
- Hansen, M.C.; Potapov, P.V.; Moore, R.; Hancher, M.; Turubanova, S.A.; Tyukavina, A.; Thau, D.; Stehman, S.V.; Goetz, S.J.; Thomas, R.; et al. High-resolution global maps of 21st-century forest cover change. Science 2013, 342, 850–853. [Google Scholar] [CrossRef] [PubMed] [Green Version]
- Searchinger, T.D.; Wirsenius, S.; Beringer, T.; Dumas, P. Assessing the efficiency of changes in land use for mitigating climate change. Nature 2018, 564, 249–253. [Google Scholar] [CrossRef]
- Gerssen-Gondelach, S.J.; Lauwerijssen, R.B.; Havlík, P.; Herrero, M.; Valin, H.; Faaij, A.P.; Wicke, B. Intensification pathways for beef and dairy cattle production systems: Impacts on GHG emissions, land occupation and land use change. Agric. Ecosyst. Environ. 2017, 240, 135–147. [Google Scholar] [CrossRef]
- Lal, R.; Kimble, J.M.; Stewart, B.A. (Eds.) Global Climate Change and Tropical Ecosystems, 1st ed.; CRC Press: Boca Raton, FL, USA, 2000. [Google Scholar] [CrossRef]
- Llerena-Montoya, S.; Velastegui-Montoya, A.; Zhirzhan-Azanza, B.; Herrera-Matamoros, V.; Adami, M.; de Lima, A.; Moscoso-Silva, F.; Encalada, L. Multitemporal analysis of land use and land cover within an oil block in the Ecuadorian Amazon. ISPRS Int. J. Geo-Inf. 2021, 10, 191. [Google Scholar] [CrossRef]
- Mena, C.F.; Walsh, S.J.; Frizzelle, B.G.; Xiaozheng, Y.; Malanson, G.P. Land use change on household farms in the Ecuadorian Amazon: Design and implementation of an agent-based model. Appl. Geogr. 2011, 31, 210–222. [Google Scholar] [CrossRef] [PubMed] [Green Version]
- Vanacker, V.; Molina, A.; Torres, R.; Calderon, E.; Cadilhac, L. Challenges for research on global change in mainland Ecuador. Neotrop. Biodivers. 2018, 4, 114–118. [Google Scholar] [CrossRef] [Green Version]
- Noh, J.K.; Echeverria, C.; Kleemann, J.; Koo, H.; Fürst, C.; Cuenca, P. Warning about conservation status of forest ecosystems in tropical Andes: National assessment based on IUCN criteria. PLoS ONE 2020, 15, e0237877. [Google Scholar] [CrossRef]
- UN. Good Practice Guidance for Assessing UN Sustainable Development Goal Indicator 15.3.1: Proportion of Land That Is Degraded over Total Land Area. Annex 1: Land Cover and Land Cover Change 2017. Available online: https://unstats.un.org/unsd/envaccounting/ceea/meetings/twelfth_meeting/UNCCD_Annex1_Landcover_20170421.pdf (accessed on 1 January 2020).
- Nepal, P.; Khanal, N.R.; Zhang, Y.; Paudel, B.; Liu, L. Land use policies in Nepal: An overview. Land Degrad. Dev. 2020, 31, 2203–2212. [Google Scholar] [CrossRef]
- Yu, W.; Zang, S.; Wu, C.; Liu, W.; Na, X. Analyzing and modeling land use land cover change (LUCC) in the Daqing City, China. Appl. Geogr. 2011, 31, 600–608. [Google Scholar] [CrossRef]
- Joshi, P.K.; Kumar, M.; Paliwal, A.; Midha, N.; Dash, P.P. Assessing impact of industrialization in terms of LULC in a dry tropical region (Chhattisgarh), India using remote sensing data and GIS over a period of 30 years. Environ. Monit. Assess. 2009, 149, 371–376. [Google Scholar] [CrossRef]
- Gomes, L.C.; Bianchi, F.J.; Cardoso, I.M.; Fernandes Filho, E.I.; Schulte, R.P. Land use change drives the spatio-temporal variation of ecosystem services and their interactions along an altitudinal gradient in Brazil. Landsc. Ecol. 2020, 35, 1571–1586. [Google Scholar] [CrossRef]
- Mataveli, G.A.; Chaves, M.E.; Brunsell, N.A.; Aragão, L.E. The emergence of a new deforestation hotspot in Amazonia. Perspect. Ecol. Conserv. 2021, 19, 33–36. [Google Scholar]
- Lambin, E.F. Global land-use and land-cover change: What have we learned so far? Glob. Chang. News 2001, 46, 27–30. [Google Scholar]
- Dos Santos, J.Y.G.; Montenegro, S.M.G.L.; da Silva, R.M.; Santos, C.A.G.; Quinn, N.W.; Dantas, A.P.X.; Neto, A.R. Modeling the impacts of future LULC and climate change on runoff and sediment yield in a strategic basin in the Caatinga/Atlantic forest ecotone of Brazil. Catena 2021, 203, 105308. [Google Scholar] [CrossRef]
- Dosdogru, F.; Kalin, L.; Wang, R.; Yen, H. Potential impacts of land use/cover and climate changes on ecologically relevant flows. J. Hydrol. 2020, 584, 124654. [Google Scholar] [CrossRef]
- Smith, P.; House, J.I.; Bustamante, M.; Sobocká, J.; Harper, R.; Pan, G.; Oeste, P.C.; Clark, J.M.; Adhya, T.; Rumpel, C.; et al. Global change pressures on soils from land use and management. Glob. Chang. Biol. 2016, 22, 1008–1028. [Google Scholar] [CrossRef] [PubMed]
- Said, M.Y.; Naini, I.; Douglis, C.; Opio, C.; Gerber, P. Sustaining Communities, Livestock and Wildlife. A Guide to Participatory Land-Use Planning; FAO: Roma, Italy, 2009. [Google Scholar]
- Bilsborrow, R.E.; Barbieri, A.F.; Pan, W. Changes in population and land use over time in the Ecuadorian Amazon. Acta Amaz. 2004, 34, 635–647. [Google Scholar] [CrossRef]
- Barbieri, A.F.; Bilsborrow, R.E.; Pan, W.K. Farm household lifecycles and land use in the Ecuadorian Amazon. Popul. Environ. 2005, 27, 1–27. [Google Scholar] [CrossRef]
- Bates, D.C. Environmental refugees? Classifying human migrations caused by environmental change. Popul. Environ. 2002, 23, 465–477. [Google Scholar] [CrossRef]
- Rudel, T.K.; Bates, D.; Machinguiashi, R. A tropical forest transition? Agricultural change, out-migration, and secondary forests in the Ecuadorian Amazon. Ann. Assoc. Am. Geogr. 2002, 92, 87–102. [Google Scholar] [CrossRef]
- Bremner, J.; Lu, F. Common property among indigenous peoples of the Ecuadorian Amazon. Conserv. Soc. 2006, 4, 499–521. [Google Scholar]
- Saqalli, M.; Béguet, E.; Maestripieri, N.; Garine, E.D. "Somos Amazonia" a New Inter-indigenous Identity in the Ecuadorian Amazonia: Beyond a Tacit jus aplidia of Ecological Origin? Perspect. Geo. 2020, 25, 12–34. [Google Scholar] [CrossRef]
- Heredia, M.; Bravo, C.; Torres, B.; Alemán, R. Innovación para el fortalecimiento de capacidades sobre sostenibilidad de los recursos naturales en poblaciones indígenas y mestizas–colonas: Reserva de Biosfera Yasuní. Rev. Ibérica Sist. Tecnol. Inf. 2020, E25, 103–116. [Google Scholar]
- Heredia, M.; Falconí, A.K.; Barreto, D.; Amores, K.; Jamil, H.; Torres, B. Conductas sustentables sobre el marco de evaluación SAFA-FAO: Un aporte para poblaciones rurales vulnerables de la Amazonía. Rev. Ibérica Sist. Tecnol. Inf. 2020, E33, 312–326. [Google Scholar]
- Vasco, C.; Bilsborrow, R.; Torres, B.; Griess, V. Agricultural land use among mestizo colonist and indigenous populations: Contrasting patterns in the Amazon. PLoS ONE 2018, 13, e0199518. [Google Scholar] [CrossRef]
- Vasco, C.; Valdiviezo, R.; Hernández, H.; Tafur, V.; Eche, D.; Jácome, E. Empleo no agrícola, tala de Forest lands y uso de recursos naturales: Evidencia de la Amazonía ecuatoriana. Sustainability 2020, 12, 4515. [Google Scholar] [CrossRef]
- Torres, B.; Vasco, C.; Günter, S.; Knoke, T. Determinants of Agricultural Diversification in a Hotspot Area: Evidence from Colonist and Indigenous Communities in the Sumaco Biosphere Reserve, Ecuadorian Amazon. Sustainability 2018, 10, 1432. [Google Scholar] [CrossRef] [Green Version]
- Heredia, M.; Díaz-Ambrona, C.G. Comportamiento demográfico: Dinámico—Probabilístico de los pueblos indígenas en aislamiento de la amazonía ecua toriana. AXIOMA 2019, 20, 25–34. [Google Scholar]
- Wassestorm, R.; Álvarez, K.; Baihua, P.; Kimerling, J.; De Marchi, M.; Pappalardo, S.; Codato, D.; Diantini, A.; Ferrarese, F.; Ponce, P.; et al. Zona Intangible del Yasuní: Entre el Manejo Territorial y la Geografía Imaginada; Abya Yala: Quito, Ecuador, 2018; ISSN 978-9942-09-523-7. [Google Scholar]
- Mena, C.F.; Laso, F.; Martinez, P.; Sampedro, C. Modeling Road building, deforestation and carbon emis sions due deforestation in the Ecuadorian Amazon: The potential impact of oil frontier growth. J. Land Use Sci. 2017, 12, 477–492. [Google Scholar] [CrossRef]
- Diantini, A.; Pappalardo, S.E.; Powers, T.E.; Codato, D.; Fera, G.D.; Heredia-R, M.; Facchinelli, F.; Crescini, E.; Marchi, M.D. Is this a Real Choice? Critical Exploration of the Social License to Operate in the Oil Extraction Context of the Ecuadorian Amazon. Sustainability 2020, 12, 8416. [Google Scholar] [CrossRef]
- Carlson, C.; Ella, V.H. Indigenous Communities versus Oil Companies: Identifying Trends in Tactics and Success of Indigenous-Led Anti-Petroleum Movements in the Ecuadorian Amazon. 2020. Independent Study Project (ISP) Collection. 3322. Available online: https://digitalcollections.sit.edu/isp_collection/3322 (accessed on 15 July 2020).
- Bozigar, M.; Gray, C.L.; Bilsborrow, R.E. Oil extraction and indigenous livelihoods in the Northern Ecuadorian Amazon. World Dev. 2016, 78, 125–135. [Google Scholar] [CrossRef] [PubMed] [Green Version]
- Rivera-Parra, J.L.; Vizcarra, C.; Mora, K.; Mayorga, H.; Dueñas, J.C. Spatial distribution of oil spills in the northeastern Ecuadorian Amazon: A comprehensive review of possible threats. Biol. Conserv. 2020, 252, 108820. [Google Scholar] [CrossRef]
- Lessmann, J.; Fajardo, J.; Muñoz, J.; Bonaccorso, E. Large expansion of oil industry in the Ecuadorian Amazon: Biodiversity vulnerability and conservation alternatives. Ecol. Evol. 2016, 6, 4997–5012. [Google Scholar] [CrossRef] [Green Version]
- Cuesta, F.; Peralvo, M.; Merino-Viteri, A.; Bustamante, M.; Baquero, F.; Freile, J.F.; Priscilla Muriel, P.; Torres-Carvajal, O. Priority areas for biodiversity conservation in mainland Ecuador. Neotrop. Biodivers. 2017, 3, 93–106. [Google Scholar] [CrossRef]
- Espinosa, S.; Celis, G.; Branch, L.C. When roads appear jWaterrs decline: Increased access to an Amazonian wilderness area reduces potential for jWaterr conservation. PLoS ONE 2018, 13, e0189740. [Google Scholar] [CrossRef] [Green Version]
- Veil, J.A.; Puder, M.G.; Elcock, D.; Redweik, R.J., Jr. Un Documento Técnico que Describe el Water Producida a Partir de la Producción de Petróleo Crudo, Gas Natural y Metano de Carbón (No. ANL/EA/RP-112631); Laboratorio Nacional Argonne: Lemont, IL, USA, 2004. [Google Scholar]
- Barraza, F.; Schreck, E.; Lévêque, T.; Uzu, G.; López, F.; Ruales, J.; Prunierd, J.; Marquet, A.; Mauricio, L. Cadmium bioaccumulation and gastric bioaccessibility in cacao: A field study in areas impacted by oil activities in Ecuador. Environ. Pollut. 2017, 229, 950–963. [Google Scholar] [CrossRef] [PubMed]
- Pappalardo, S.E.; De Marchi, M.; Ferrarese, F. Uncontacted Waorani in the Yasuní Biosphere Reserve: Geographical Validation of the Zona Intangible Tagaeri Taromenane (ZITT). PLoS ONE 2013, 8, e66293. [Google Scholar] [CrossRef] [Green Version]
- Holland, M.B.; De Koning, F.; Morales, M.; Naughton-Treves, L.; Robinson, B.E.; Suárez, L. Complex tenure and deforestation: Implications for conservation incentives in the Ecuadorian Amazon. World Dev. 2014, 55, 21–36. [Google Scholar] [CrossRef]
- Bonilla-Bedoya, S.; Estrella-Bastidas, A.; Molina, J.R.; Herrera, M.Á. Socioecological system and potential deforestation in Western Amazon Forest landscapes. Sci. Total Environ. 2018, 644, 1044–1055. [Google Scholar] [CrossRef]
- Presidencia de la Republica de Ecuador. Decreto Ejecutivo No. 552; Registro Oficial: Quito, Ecuador, 1999. [Google Scholar]
- Presidencia de la República de Ecuador. Decreto Ejecutivo No. 2187; Registro Oficial: Quito, Ecuador, 2007. [Google Scholar]
- Eguiguren, M. Línea Histórica del Conflicto de la Franja de Diversidad y Vida del Cantón Francisco de Orellana. Memorias del I Congreso Sobre Pueblos Indígenas Aislados en la Amazonía Ecuatoriana; Universidad Andina Simón Bolívar: Quito, Ecuador, 2017; 213p. [Google Scholar]
- Vargas, G. La Tropicalidad y el Análisis Geográfico; Reflexiones: San Jose, Costa Rica, 2002; Volume 81. [Google Scholar]
- Chuvieco, E. Teledetección Ambiental; Editorial Planeta: Barcelona, Spain, 2010; 591p. [Google Scholar]
- Saldarriaga, L. Reconstrucción de Base de Datos Landsat7 ETM+ SLC-off para Cuantificar, Detectar Cambios y Cartografiar la Cobertura Vegetal del Valle Bajo del río Chira—Perú, Durante el Período 2005–2014. Master’s Thesis, Universidad de Valencia, Valencia, Spain, 2014; 68p. [Google Scholar]
- MAE. Línea Base de Deforestación del Ecuador Continental. 32p. 2012. Available online: http://socioForestland.ambiente.gob.ec (accessed on 1 June 2021).
- IPCC. Guidelines for National Greenhouse Gas Inventories—Volume 4: Agriculture, Land Use and Forestry (AFOLU). 2006. Available online: http://www.ipcc-nggip.iges.or.jp (accessed on 4 May 2021).
- Jensen, J. Introductory Digital Image Processing: A Remote Sensing Perspective; Editorial Prentice Hall: Upper Saddle River, NJ, USA, 1996; 316p. [Google Scholar]
- Kaul, M.; Hill, R.; Walthall, C. Artificial neural networks for corn and soybean yield prediction. Agric. Syst. 2005, 85, 1–18. [Google Scholar] [CrossRef]
- Bocco, M.; Ovando, G.; Sayago, S.; Willington, E. Neural network models for land cover classification from satellite images. Agric. Téc. 2007, 67, 414–421. [Google Scholar] [CrossRef]
- Lencinas, J.; Siebert, A. Relevamiento de Forest lands con información satelital: Resolución espacial y escala. Quebracho 2009, 17, 101–105. [Google Scholar]
- Anderson, J.; Hardy, E.E.; Roach, J.T.; Witmer, R.E. Land Use and Land Cover Classification System for Use with Remote Sensor Data; USGS Professional Paper 964; Government Printing Office: Washington, DC, USA, 1976. [Google Scholar]
- Sloan, S.; Sayer, J.A. Forest Resources Assessment of 2015 shows positive global trends but forest loss and degradation persist in poor tropical countries. For. Ecol. Manag. 2015, 352, 134–145. [Google Scholar] [CrossRef] [Green Version]
- FAO. Global Forest Resources Assessment 2015. How Are the World’s Forests Changing? FAO: Rome, Italy, 2015. [Google Scholar]
- Myers, N. Tropical Forests: The Main Deforestation Fronts. Environ. Conserv. 1993, 20, 9–16. Available online: http://www.jstor.org/stable/44521724 (accessed on 9 November 2020). [CrossRef]
- Taylor, R.; Dudley, N.; Stolton, S.; Shapiro, A. Deforestation Fronts: 11 Places Where Most Forest Loss is Projected between 2010 and 2030. In Proceedings of the XIV World Forestry Congress, Durban, South Africa, 7–11 September 2015. [Google Scholar]
- Morales-Hidalgo, D.; Oswalt, S.N.; Somanathan, E. Status and trends in global primary forest, protected areas, and areas designated for conservation of biodiversity from the Global Forest Resources Assessment 2015. For. Ecol. Manag. 2015, 352, 68–77. [Google Scholar] [CrossRef] [Green Version]
- Cordero Heredia, D.A.; Koeppen, N. Oil Extraction, Indigenous Peoples Living in Voluntary Isolation, and Genocide: The Case of the Tagaeri and Taromenane Peoples. Harv. Hum. Rts. J. 2021, 34, 117. [Google Scholar]
- Kaced, D.; Mejean, R.; Richa, A.; Gaudou, B.; Saqalli, M. PASHAMAMA: An Agricultural Process-Driven Agent-Based Model of the Ecuadorian Amazon. In Multi-Agent-Based Simulation XIX. MABS 2018; Lecture Notes in Computer Science; Davidsson, P., Verhagen, H., Eds.; Springer: Cham, Switzerland, 2019; Volume 11463. [Google Scholar] [CrossRef] [Green Version]
- Houssou, N.L.J.; Cordero, J.D.; Bouadjio-Boulic, A.; Morin, L.; Maestripieri, N.; Ferrant, S.; Belem, M.; Pelaez Sanchez, J.I.; Saenz, M.; Lerigoleur, E.; et al. Synchronizing histories of exposure and demography: The construction of an agent-based model of the Ecuadorian Amazon colonization and exposure to oil pollution hazards. J. Artif. Soc. Soc. Simul. 2019, 1, 22. [Google Scholar] [CrossRef]
- Laurance, W.F.; Lovejoy, T.E.; Vasconcelos, H.L.; Bruna, E.M.; Didham, R.K.; Stouffer, P.C.; Gascon, C.; Bierregaard, O.; Laurance, S.; Sampaio, E. Ecosystem decay of Amazonian Forest fragments: A 22-year investigation. Conserv. Biol. 2002, 16, 605–618. [Google Scholar] [CrossRef] [Green Version]
- Geist, H.J.; Lambin, E.F. Proximate Causes and Underlying Driving Forces of Tropical Deforestation Tropical forests are disappearing as the result of many pressures, both local and regional, acting in various combinations in different geographical locations. BioScience 2002, 52, 143–150. [Google Scholar] [CrossRef]
- Soares-Filho, B.S.; Nepstad, D.C.; Curran, L.M.; Cerqueira, G.; García, G.; Azevedo Ramos, C.; Voll, E.; McDonald, A.; Lefebvre, P.; Schlesinger, P. Modelling conservation in the Amazon basin. Nature 2006, 440, 520–523. [Google Scholar] [CrossRef]
- Rorato, A.C.; Picoli, M.C.; Verstegen, J.A.; Camara, G.; Silva Bezerra, F.G.; SEscada, M.I. Environmental Threats over Amazonian Indigenous Lands. Land 2021, 10, 267. [Google Scholar] [CrossRef]
- Viteri-Salazar, O.; Toledo, L. The expansion of the agricultural frontier in the northern Amazon region of Ecuador, 2000–2011: Process, causes, and impact. Land Use Policy 2020, 99, 104986. [Google Scholar] [CrossRef]
- Junquera, V.; Meyfroidt, P.; Sun, Z.; Latthachack, P.; Grêt-Regamey, A. From global drivers to local land-use change: Understanding the northern Laos rubber boom. Environ. Sci. Policy 2020, 109, 103–115. [Google Scholar] [CrossRef]
- Schüßler, D.; Mantilla-Contreras, J.; Stadtmann, R.; Ratsimbazafy, J.H.; Radespiel, U. Identification of crucial stepping stone habitats for biodiversity conservation in northeastern Madagascar using remote sensing and comparative predictive modeling. Biodivers. Conserv. 2020, 29, 2161–2184. [Google Scholar] [CrossRef] [Green Version]
- Mejia, E.; Pacheco, P.; Muzo, A.; Torres, B. Smallholders and timber extraction in the Ecuadorian Amazon: Amidst market opportunities and regulatory constraints. Int. For. Rev. 2015, 16, 1–13. [Google Scholar] [CrossRef]
- Pacheco, P.; Barry, D.; Cronkleton, P.; Larson, A. The Role of Informal Institutions in the Use of Forest Resources in Latin America; CIFOR: Bogor, Indonesia, 2008. [Google Scholar]
- Nolte, C.; Agrawal, A.; Silvius, K.M.; Soares-Filho, B.S. Governance regime and location influence avoided deforestation success of protected areas in the Brazilian Amazon. Proc. Natl. Acad. Sci. USA 2013, 110, 4956–4961. [Google Scholar] [CrossRef] [Green Version]
- Blackman, A.; Corral, L.; Lima, E.S.; Asner, G.P. Titling indigenous communities protects forests in the Peruvian Amazon. Proc. Natl. Acad. Sci. USA 2017, 114, 4123–4128. [Google Scholar] [CrossRef] [PubMed] [Green Version]
- Gondard, P.; Mazurek, H. 30 años de reforma agrariay colonización en Ecuador (1964–1994): Dinámicas espaciales. Estud. De Geogr. 2001, 10, 15–40. [Google Scholar]
- Puente, M.C. Perdidos Entre las Leyes y Los Árboles. Propiedad y Posesión en un Forest Land Protector Ecuatoriano; Abya Yala: Quito, Ecuador, 2008; p. 144. [Google Scholar]
- Fontaine, G. (Ed.) Petróleo y Desarrollo Sostenible en Ecuador: Las Apuestas; Flacso: Quito, Ecuador, 2004; 2p. [Google Scholar]
- Maldonado-Lince, G. La reforma agraria en el Ecuador, una lucha por la justicia. Nueva Soc. 1979, 41, 14–29. [Google Scholar]
- Viteri-Salazar, O. Evaluación de la Sostenibilidad de los Cultivos de café y Cacao en las Provincias de Orellana y Sucumbios-Ecuador. Ph.D. Thesis, Universitat Autònoma de Barcelona, Barcelona, Spain, 2013. [Google Scholar]
- Walker, R. Mapping process to pattern in the landscape change of the Amazonian frontier. Ann. Assoc. Am. Geogr. 2003, 93, 376–398. [Google Scholar] [CrossRef] [Green Version]
- Vasco, C.; Torres, B.; Jácome, E.; Torres, A.; Eche, D.; Velasco, C. Use of chemical fertilizers and pesticides in frontier areas: A case study in the Northern Ecuadorian Amazon. Land Use Policy 2021, 107, 105490. [Google Scholar] [CrossRef]
- Barraza, F.; Maurice, L.; Uzu, G.; Becerra, S.; López, F.; Ochoa-Herrera, V.; Ruales, J.; Schreck, E. Distribution, contents and health risk assessment of metal (loid) s in small-scale farms in the Ecuadorian Amazon: An insight into impacts of oil activities. Sci. Total Environ. 2018, 622, 106–120. [Google Scholar] [CrossRef]
- Teófilo Pignati, M.; Costa De Souza, L.; de Alcântara Mendes, R.; de Oliveira Lima, M.; Antonio Pignati, W.; Carlos Brito Pezzuti, J. Levels of organochlorine pesticides in Amazon turtle (Podocnemis unifilis) in the Xingu River, Brazil. J. Environ. Sci. Health Part B 2018, 53, 810–816. [Google Scholar] [CrossRef] [PubMed]
- Apeh, C.C. Farmers’ Perception of the Health Effects of Agrochemicals in Southeast Nigeria. J. Health Pollut. 2018, 8, 19. [Google Scholar] [CrossRef] [PubMed] [Green Version]
- Carr, D.L.; Suter, L.; Barbieri, A. Population dynamics and tropical deforestation: State of the debate and conceptual challenges. Popul. Environ. 2005, 27, 89–113. [Google Scholar] [CrossRef] [PubMed] [Green Version]
- Heredia, R.M.; Torres, B.; Cayambe, J.; Ramos, N.; Luna, M.; Diaz-Ambrona, C.G.H. Sustainability Assessment of Smallholder Agroforestry Indigenous Farming in the Amazon: A Case Study of Ecuadorian Kichwas. Agronomy 2020, 10, 1973. [Google Scholar] [CrossRef]
- Barbieri, A.F.; Guedes, G.R.; Dos Santos, R.O. Land use systems and livelihoods in demographically heterogeneous frontier stages in the amazon. Environ. Dev. 2021, 38, 100587. [Google Scholar] [CrossRef]
- Hartter, J.; Ryan, S.J.; MacKenzie, C.A.; Goldman, A.A.; Dowhaniuk, N.; Palace, M.W.; Diem, J.E.; Chapman, C.A. Now there is no land: A story of ethnic migration in a protected area landscape in western Uganda. Popul. Environ. 2015, 36, 452–479. [Google Scholar] [CrossRef]
- Vieilledent, G.; Grinand, C.; Vaudry, R. Forecasting deforestation and carbon emissions in tropical developing countries facing demographic expansion: A case study in M adagascar. Ecol. Evol. 2013, 3, 1702–1716. [Google Scholar] [CrossRef] [Green Version]
- Messina, J.P.; Walsh, S.J. Dynamic Spatial Simulation Modeling of the Population—Environment Matrix in the Ecuadorian Amazon. Environ. Plan. B Plan. Des. 2005, 32, 835–856. [Google Scholar] [CrossRef]
- Monteros, A.I.M. Sociedad Civil y Conflictos Socioambientales por la Tala Ilegal de Madera en el Parque Nacional Yasuní (El Parque Nacional de Rewood, un Modelo a Seguir). Master’s Thesis, FLACSO: Quito, Ecuador, 2010. [Google Scholar]
- Brown, D.; Schreckenberg, K.; Bird, N.; Cerutti, P.; del Gatto, F.; Diaw, C.; Fomété, T.; Luttrell, C.; Navarro, G.; Oberndorf, R.; et al. Legal Timber Verification and Governance in the Forest Sector; Overseas Development Institute: London, UK, 2008; p. 232. [Google Scholar]
- Cano, W.; van de Rijt, A.; de Jong, W.; Pacheco, P. Aprovechamiento y Mercados de la Madera en el Norte Amazónico de Bolivia; CIFOR: Bogor, Indonesia, 2015. [Google Scholar]
- Mejía, E.; Cano, W.; de Jong, W.; Pacheco, P.; Tapia, S.; Morocho, J. Actores, Aprovechamiento de Madera y Mercados en la Amazonía Peruana; CIFOR: Bogor, Indonesia, 2015. [Google Scholar]
- Benayas, J.R.; Martins, A.; Nicolau, J.M.; Schulz, J.J. Abandonment of agricultural land: An overview of drivers and consequences. CAB Rev. Perspect. Agric. Vet. Sci. Nutr. Nat. Resour. 2007, 2, 1–14. [Google Scholar] [CrossRef] [Green Version]
- Söderholm, P.; Svahn, N. Mining, regional development and benefit-sharing in developed countries. Resour. Policy 2015, 45, 78–91. [Google Scholar] [CrossRef]
- Aristide, M.; Moundigbaye, M. Oil and regional development in Chad: Assessment of the impact of the Doba Oil Project on poverty in the host region. Afr. Dev. Rev. 2017, 29, 42–55. [Google Scholar] [CrossRef]
- Shepherd, B. Oil in Uganda: International Lessons for Success; The Royal Institute of International Affairs: London, UK; Available online: https://www.chathamhouse.org/sites/files/chathamhouse/public/Research/Africa/0113pr_ugandaoil.pdf.2013 (accessed on 9 November 2020).
- Salinas Castro, V.; Bilsborrow, R.E.; Gray, C. Cambios socioeconómicos en el siglo XXI en poblaciones indígenas amazónicas: Retos actuales. Estud. Demogr. Urbanos 2020, 35, 83–116. [Google Scholar] [CrossRef] [Green Version]
- Gray, C.; Bilsborrow, R. Stability and change within indigenous land use in the Ecuadorian Amazon. Glob. Environ. Chang. 2020, 63, 102116. [Google Scholar] [CrossRef] [PubMed]
- Pappalardo, S.E. Espansione Della Frontiera Estrattiva e Conflitti Ambientali Nell’area della Riserva Della Biosfera Yasuní: La Via Auca; Cluep, Quaderni di Dottorato: Padova, Italy, 2010; Volume 5, pp. 1–14. [Google Scholar]
- Pappalardo, S. Expansión de la Frontera Petrolera y Conflictos Ambientales en la Amazonía Ecuatoriana: El Caso de la Reserva de Biosfera Yasuní. Ph.D. Thesis, Universidad de Padova, Podova, Italy, 2013. [Google Scholar]
- Frizzelle, B.G.; Walsh, S.J.; Mena, C.F.; Erlien, C.M. Land use change patterns of colonists and indigenous groups in the Northern Ecuadorian Amazon: A comparison of Landsat TM spectral and spatial analyses. In Proceedings of the Annual Meeting of the American Society of Photogrammetry and Remote Sensing, Baltimore, MD, USA, 7 March 2005. [Google Scholar]
- Barbieri, A.F.; Carr, D.L.; Bilsborrow, R.E. Migration within the Frontier: The Second Generation Colonization in the Ecuadorian Amazon. Popul. Res. Policy Rev. 2009, 28, 291–320. [Google Scholar] [CrossRef] [PubMed] [Green Version]
- De Oliveira, G.; Chen, J.M.; Mataveli, G.A.V.; Chaves, M.E.D.; Seixas, H.T.; Cardozo, F.d.S.; Shimabukuro, Y.E.; He, L.; Stark, S.C.; dos Santos, C.A.C. Rapid Recent Deforestation Incursion in a Vulnerable Indigenous Land in the Brazilian Amazon and Fire-Driven Emissions of Fine Particulate Aerosol Pollutants. Forests 2020, 11, 829. [Google Scholar] [CrossRef]
- Rival, L. Huaorani peace: Cultural continuity and negotiated alterity in the Ecuadorian Amazon. Common Knowl. 2015, 21, 270–304. [Google Scholar] [CrossRef]
- Davis, J.; Sellers, S.; Gray, C.; Bilsborrow, R. Indigenous migration dynamics in the ecuadorian Amazon: A longitudinal and hierarchical analysis. J. Dev. Stud. 2017, 53, 1849–1864. [Google Scholar] [CrossRef] [PubMed]
- SENPLADES. Plan Nacional Toda una Visa 2017–2021; Recuperado de Quito: Quito, Ecuador, 2017. [Google Scholar]
- Kansanga, M.M.; Kerr, R.B.; Lupafya, E.; Dakishoni, L.; Luginaah, I. Does participatory farmer-to-farmer training improve the adoption of sustainable land management practices? Land Use Policy 2021, 108, 105477. [Google Scholar] [CrossRef]
- De Koning, F.; Aguiñaga, M.; Bravo, M.; Chiu, M.; Lascano, M.; Lozada, T.; Suarez, L. Bridging the gap between forest conservation and poverty alleviation: The Ecuadorian Socio Forest land program. Environ. Sci. Policy 2011, 14, 531–542. [Google Scholar] [CrossRef]
- MAE. Manual Operativo Reformado Vigente. Acuerdo Ministerial No. 115. 2012. Available online: Documento_Manual-Operativo-Proyecto-Socio-Bosque.pdf (accessed on 5 September 2021).
- Ceddia, M.G.; Sedlacek, S.; Bardsley, N.O.; Gomez-y-Paloma, S.J.G.E.C. Sustainable agricultural intensification or Jevons paradox? The role of public governance in tropical South America. Glob. Environ. Chang. 2013, 23, 1052–1063. [Google Scholar] [CrossRef]


| Mission | Sensor | Bands | Path/Row | Date | Cloud Cover (%) | Training Samples Number |
|---|---|---|---|---|---|---|
| Landsat 5 | ETM+ | 1, 2, 3, 4, 5, 7 | 9/60 & 61 | 10 July 1999 | 10.00 & 7.00 | 2003 |
| Landsat 7 | ETM+ | 1, 2, 3, 4, 5, 7 | 9/60 & 61 | 26 May 2009 | 15.00 & 9.00 | 2314 |
| Landsat 8 | OLI | 2, 3, 4, 5, 6, 7 | 9/60 & 61 | 18 October 2018 | 16.77 & 7.42 | 1876 |
| Class | Description | Example of Aerial View | Training Samples/Year |
|---|---|---|---|
| Forest land | A group of trees, with a minimum canopy cover of 30%, upper stratum height of at least 5 m and with a minimum area of 10,000 m2 (1 ha). | 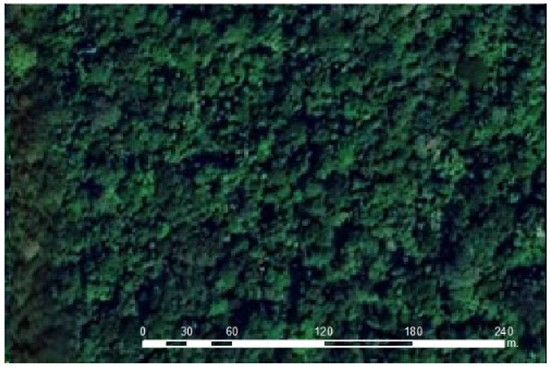 | 685 (1999) 669 (2009) 479 (2018) |
| Cropland (Traditional production system) | Areas under cultivation, such as monocultures and agroforestry systems where the vegetation structure does not meet the definition of forest land. This class also includes areas of planted grassland with mainly livestock uses or which are in a rotational system between grassland and crops. |  | 248 (1999) 340 (2009) 371 (2018) |
| Grassland | Areas that are not considered to be agricultural areas. It also includes areas where the vegetation structure does not meet the definition of forest lands and which are expected to remain so without human intervention. | 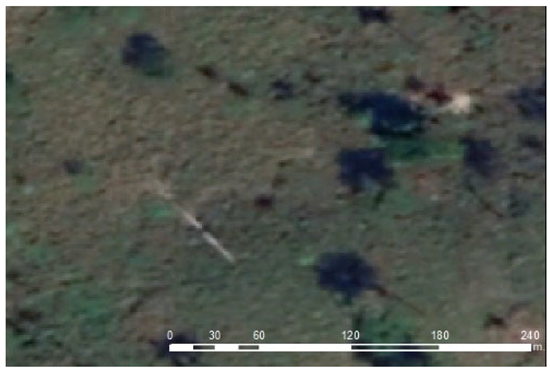 | 222 (1999) 394 (2009) 309 (2018) |
| Settlements | Areas mainly occupied by dwellings and buildings (roads) destined for communities or public services. | 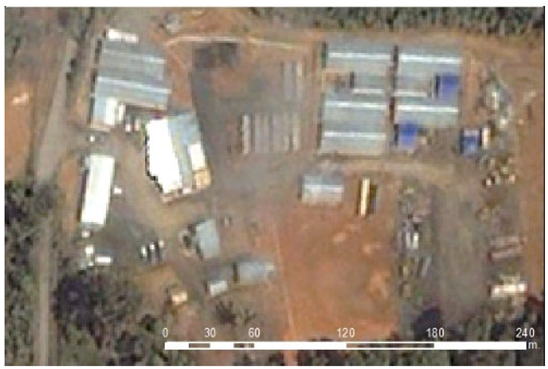 | 129 (1999) 187 (2009) 171 (2018) |
| Water | Area that is covered or saturated with static or moving water, natural or artificial, that rests on the earth’s surface for all or part of the year. | 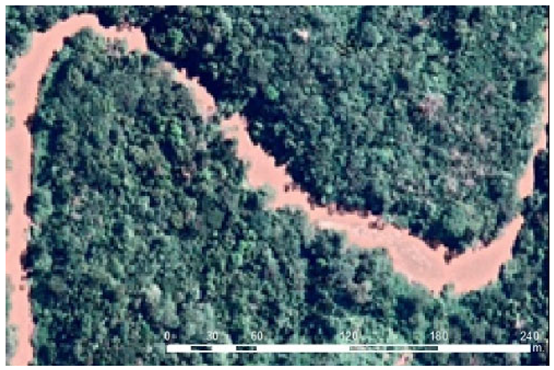 | 138 (1999) 104 (2009) 187 (2018) |
| Class | 1999 | 2009 | 2018 | |||
|---|---|---|---|---|---|---|
| PA (%) | UA (%) | PA (%) | UA (%) | PA (%) | UA (%) | |
| Forest land | 100.00 | 98.48 | 100.00 | 97.94 | 100.00 | 100.00 |
| Traditional production system | 98.83 | 97.13 | 97.40 | 99.47 | 100.00 | 97.78 |
| Grassland | 99.31 | 98.62 | 96.02 | 100.00 | 100.00 | 100.00 |
| Settlements | 96.08 | 98.00 | 96.06 | 92.42 | 96.91 | 100.00 |
| Water | 96.70 | 100.00 | 93.85 | 88.41 | 100.00 | 100.00 |
| Global precision OA (%) | 98.8 | 98.0 | 99.6 | |||
| Concordance (Kappa) | 0.98 | 0.97 | 0.99 | |||
| Class | Area in 1999 | Area in 2009 | Area in 2018 | |||
|---|---|---|---|---|---|---|
| ha | % | ha | % | ha | % | |
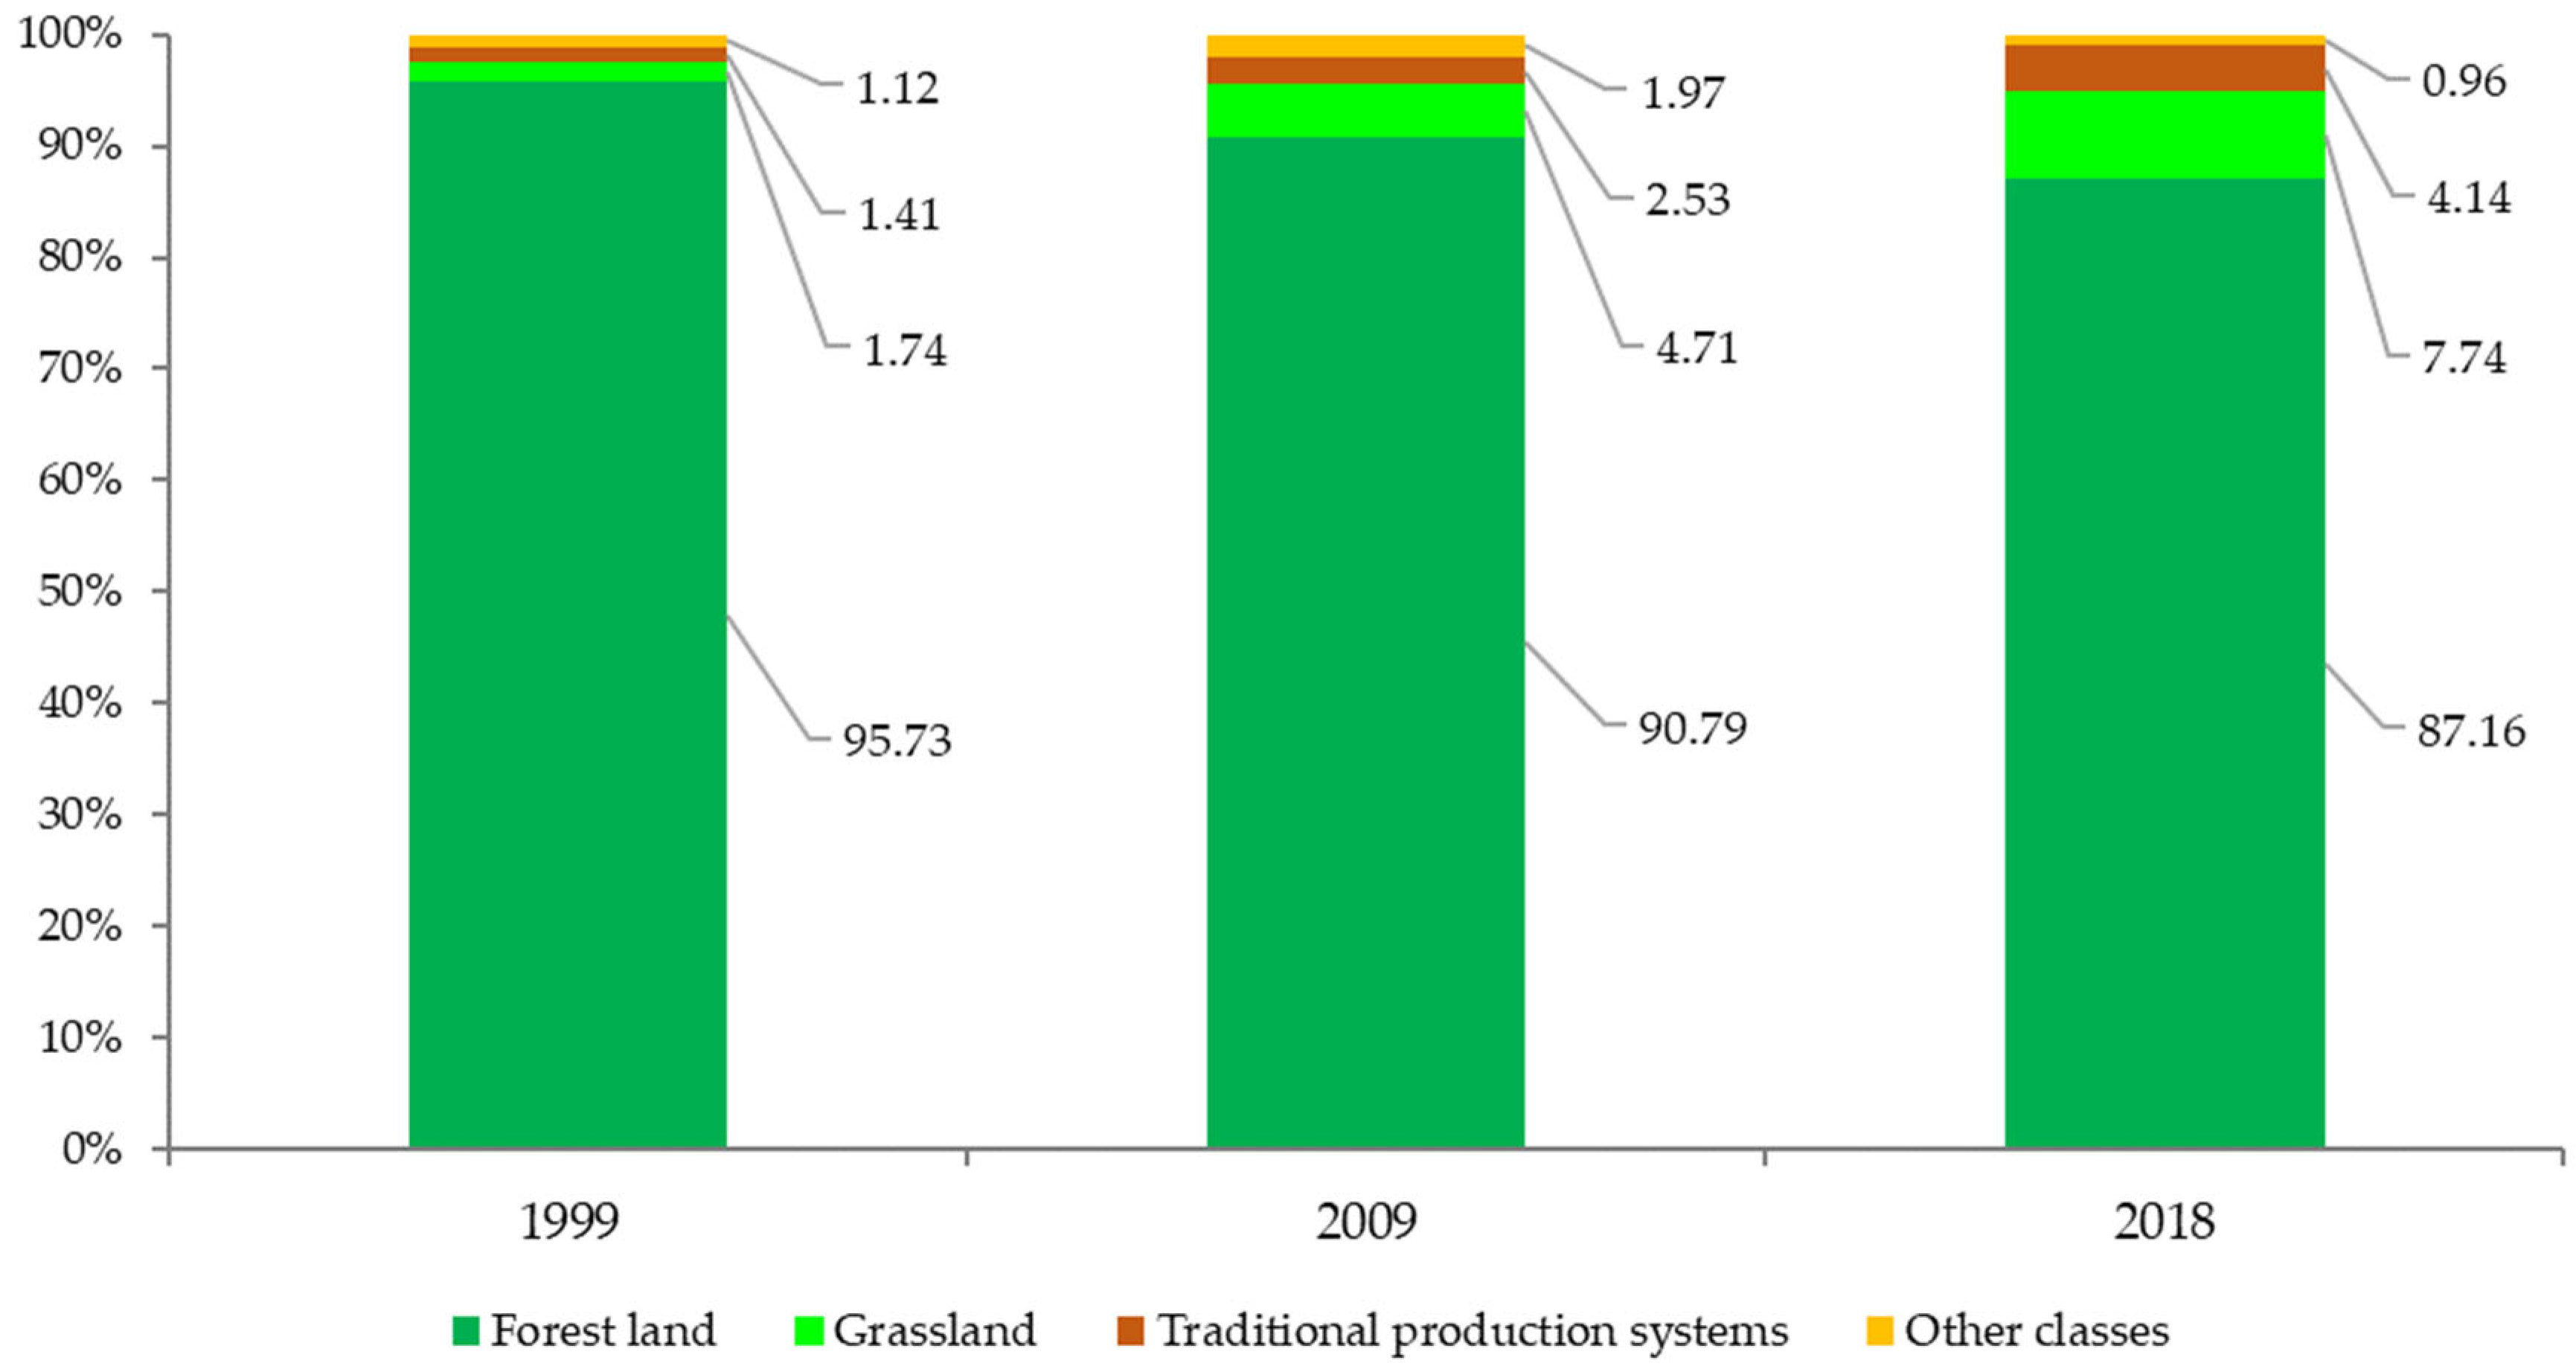
| Forest land | 20,089.97 | 95.73 | 19,052.13 | 90.79 | 18,290.13 | 87.16 |
| Traditional production system | 296.34 | 1.41 | 531.48 | 2.53 | 868.36 | 4.14 |
| Grassland | 365.75 | 1.74 | 989.21 | 4.71 | 1625.22 | 7.74 |
| Settlement | 9.63 | 0.05 | 123.39 | 0.59 | 72.12 | 0.34 |
| Water | 156.67 | 0.75 | 220.05 | 1.05 | 129.49 | 0.62 |
| Cloud cover | 42.66 | 0.20 | 40.92 | 0.20 | 0.00 | 0.00 |
| Shade | 24.30 | 0.12 | 28.14 | 0.13 | 0.00 | 0.00 |
| Total | 20,985.33 | 100.00 | 20,985.33 | 100.00 | 20,985.33 | 100.00 |
| Class | 1999–2009 | 2009–2018 | 1999–2018 | |||
|---|---|---|---|---|---|---|
| Area | Area | Area | ||||
| ha | % | ha | % | ha | % | |
| Forest land | −1037.84 | −4.95 | −762.00 | −3.63 | −1799.84 | −8.58 |
| Traditional production system | 235.14 | 1.12 | 336.87 | 1.61 | 572.02 | 2.73 |
| Grassland | 623.46 | 2.97 | 636.01 | 3.03 | 1259.47 | 6.00 |
| Settlement | 113.76 | 0.54 | −51.27 | −0.24 | 62.49 | 0.30 |
| Water | 63.38 | 0.30 | −90.56 | −0.43 | −27.18 | −0.13 |
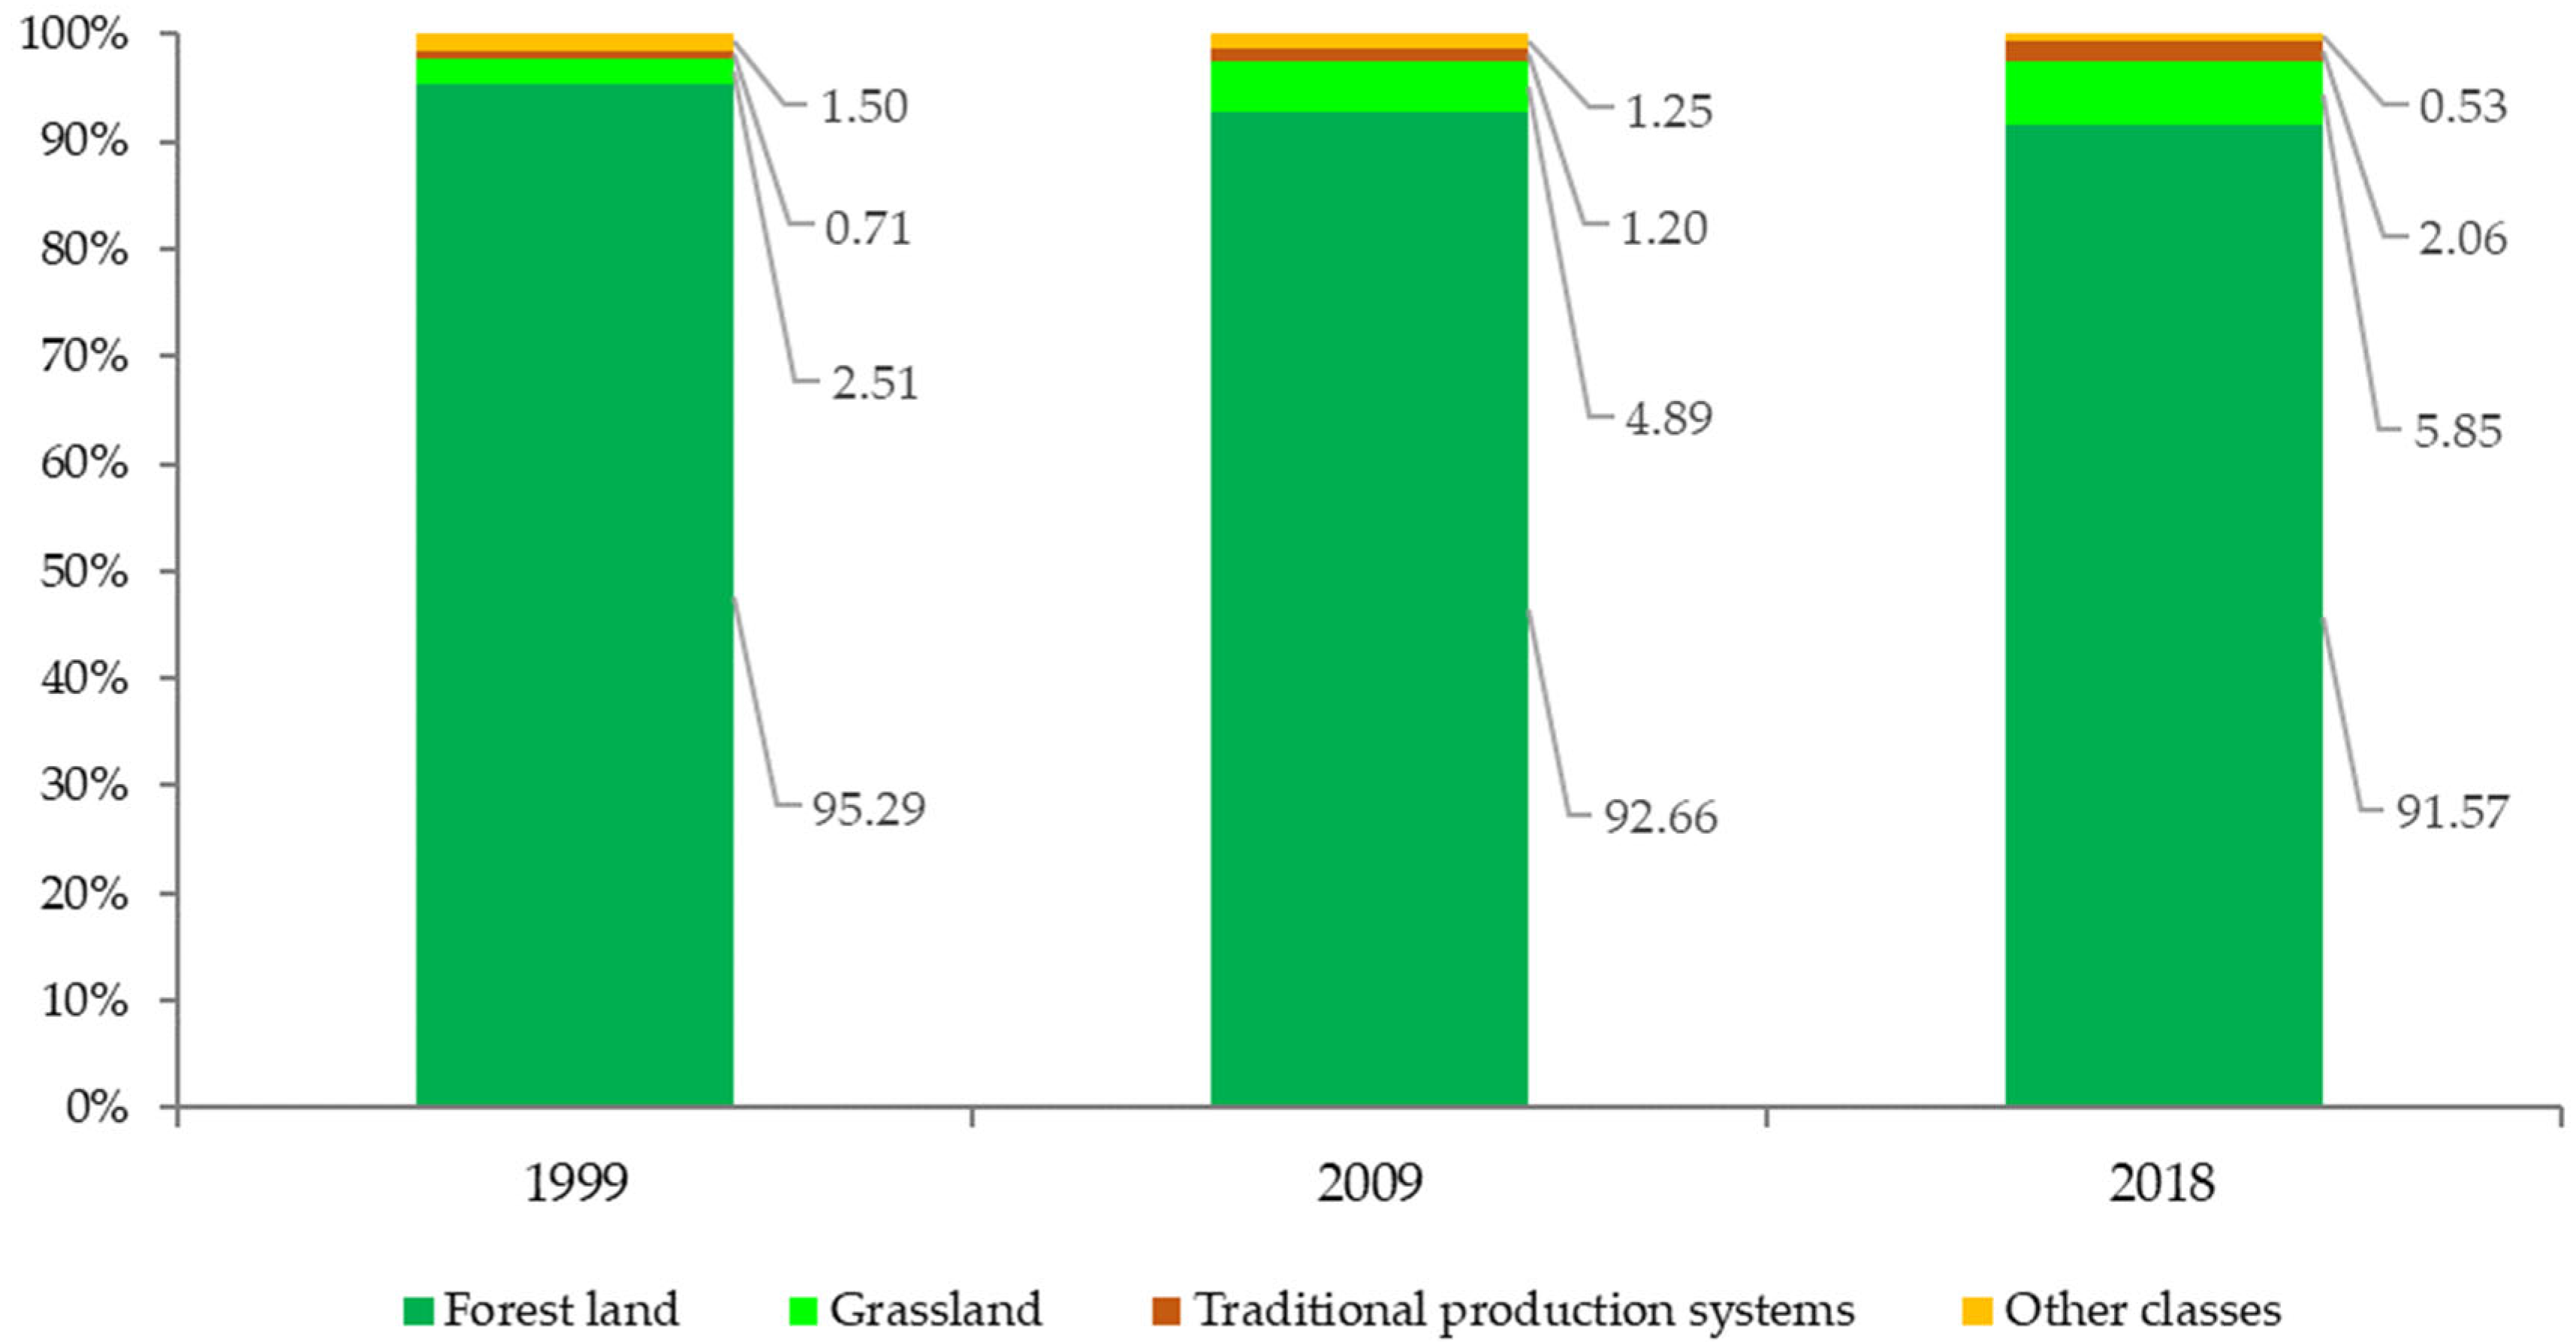
| Area in 1999 | Area in 2009 | Area in 2018 | ||||
|---|---|---|---|---|---|---|
| Class | ha | % | ha | % | ha | % |
| Forest land | 17,030.23 | 95.29 | 16,560.08 | 92.66 | 16,364.74 | 91.57 |
| Traditional production system | 126.11 | 0.71 | 214.83 | 1.20 | 368.25 | 2.06 |
| Grassland | 449.33 | 2.51 | 874.55 | 4.89 | 1045.51 | 5.85 |
| Settlements | 24.21 | 0.14 | 62.21 | 0.35 | 35.16 | 0.20 |
| Water | 54.89 | 0.31 | 151.23 | 0.85 | 58.51 | 0.33 |
| Cloud cover | 150.07 | 0.84 | 6.84 | 0.04 | 0.00 | 0.00 |
| Shade | 37.33 | 0.21 | 2.43 | 0.01 | 0.00 | 0.00 |
| Total | 17,872.17 | 100.00 | 17,872.17 | 100.00 | 17,872.17 | 100.00 |
| Class | 1999–2009 | 2009–2018 | 1999–2018 | |||
|---|---|---|---|---|---|---|
| Area | Area | Area | ||||
| ha | % | ha | % | ha | % | |
| Forest land | −470.15 | −2.24 | −195.35 | −0.93 | −665.50 | −3.17 |
| Traditional production system | 88.72 | 0.42 | 153.43 | 0.73 | 242.14 | 1.15 |
| Grassland | 425.22 | 2.03 | 170.96 | 0.81 | 596.18 | 2.84 |
| Settlement | 38.00 | 0.18 | −27.05 | −0.13 | 10.95 | 0.05 |
| Water | 96.34 | 0.46 | −92.72 | −0.44 | 3.62 | 0.02 |
| Range of Hectares | Quantity (USD) | |
|---|---|---|
| 1 | 20 | 60.00 |
| 1 | 50 | 30.00 |
| 51 | 100 | 20.00 |
| 101 | 500 | 10.00 |
| 501 | 5000 | 5.00 |
| 5001 | 10,000 | 2.00 |
| >10,001 | 0.50 | |
Publisher’s Note: MDPI stays neutral with regard to jurisdictional claims in published maps and institutional affiliations. |
© 2021 by the authors. Licensee MDPI, Basel, Switzerland. This article is an open access article distributed under the terms and conditions of the Creative Commons Attribution (CC BY) license (https://creativecommons.org/licenses/by/4.0/).
Share and Cite
Heredia-R, M.; Torres, B.; Cabrera-Torres, F.; Torres, E.; Díaz-Ambrona, C.G.H.; Pappalardo, S.E. Land Use and Land Cover Changes in the Diversity and Life Zone for Uncontacted Indigenous People: Deforestation Hotspots in the Yasuní Biosphere Reserve, Ecuadorian Amazon. Forests 2021, 12, 1539. https://doi.org/10.3390/f12111539
Heredia-R M, Torres B, Cabrera-Torres F, Torres E, Díaz-Ambrona CGH, Pappalardo SE. Land Use and Land Cover Changes in the Diversity and Life Zone for Uncontacted Indigenous People: Deforestation Hotspots in the Yasuní Biosphere Reserve, Ecuadorian Amazon. Forests. 2021; 12(11):1539. https://doi.org/10.3390/f12111539
Chicago/Turabian StyleHeredia-R, Marco, Bolier Torres, Francisco Cabrera-Torres, Emma Torres, Carlos G. H. Díaz-Ambrona, and Salvatore Eugenio Pappalardo. 2021. "Land Use and Land Cover Changes in the Diversity and Life Zone for Uncontacted Indigenous People: Deforestation Hotspots in the Yasuní Biosphere Reserve, Ecuadorian Amazon" Forests 12, no. 11: 1539. https://doi.org/10.3390/f12111539
APA StyleHeredia-R, M., Torres, B., Cabrera-Torres, F., Torres, E., Díaz-Ambrona, C. G. H., & Pappalardo, S. E. (2021). Land Use and Land Cover Changes in the Diversity and Life Zone for Uncontacted Indigenous People: Deforestation Hotspots in the Yasuní Biosphere Reserve, Ecuadorian Amazon. Forests, 12(11), 1539. https://doi.org/10.3390/f12111539