Article

Relationship between Biomass Burning Emissions and Deforestation in Amazonia over the Last Two Decades

by
Guilherme A. V. Mataveli
1,*,
Gabriel de Oliveira
2,
Hugo T. Seixas
3,
Gabriel Pereira
4,5,
Scott C. Stark
6,
Luciana V. Gatti
7,
Luana S. Basso
7,
Graciela Tejada
7,
Henrique L. G. Cassol
1,
Liana O. Anderson
8 and
Luiz E. O. C. Aragão
1
1
Earth Observation and Geoinformatics Division, National Institute for Space Research, São José dos Campos 12227-010, Brazil
2
Department of Earth Sciences, University of South Alabama, Mobile, AL 36688, USA
3
Center for Environmental Studies and Research, University of Campinas, Campinas 13083-867, Brazil
4
Department of Geosciences, Federal University of São João del-Rei, São João del-Rei 36307-352, Brazil
5
Department of Geography, University of São Paulo, São Paulo 05508-000, Brazil
6
Department of Forestry, Michigan State University, East Lansing, MI 48824, USA
7
Impacts, Adaptation and Vulnerability Division, National Institute for Space Research, São José dos Campos 12227-010, Brazil
8
National Center for Monitoring and Early Warning of Natural Disaster, São José dos Campos 12247-016, Brazil
*
Author to whom correspondence should be addressed.
Forests 2021, 12(9), 1217; https://doi.org/10.3390/f12091217
Submission received: 10 August 2021 / Revised: 26 August 2021 / Accepted: 2 September 2021 / Published: 7 September 2021

Abstract

:
With deforestation and associated fires ongoing at high rates, and amidst urgent need to preserve Amazonia, improving the understanding of biomass burning emissions drivers is essential. The use of orbital remote sensing data enables the estimate of both biomass burning emissions and deforestation. In this study, we have estimated emissions of particulate matter with diameter less than 2.5 µm (PM2.5) associated with biomass burning, a primary human health risk, using the Brazilian Biomass Burning emission model with Fire Radiative Power (3BEM_FRP), and estimated deforestation based on the MapBiomas dataset. Using these estimates, we have assessed for the first time how deforestation drove biomass burning emissions in Amazonia over the last two decades at three scales of analysis: Amazonia-wide, country/state and pixel. Amazonia accounted for 48% of PM2.5 emitted from biomass burning in South America and current deforestation rates have reached values on par with those of the early 21st Century. Emissions and deforestation were concentrated in the Eastern and Central-Southern portions of Amazonia. Amazonia-wide deforestation and emissions were linked through time (R = 0.65). Countries/states with the widest spread agriculture were less likely to be correlated at this scale, likely because of the importance of biomass burning in agricultural practices. Concentrated in regions of ongoing deforestation, in 18% of Amazonia grid cells PM2.5 emissions associated with biomass burning and deforestation were significantly positively correlated. Deforestation is an important driver of emissions in Amazonia but does not explain biomass burning alone. Therefore, future work must link climate and other non-deforestation drivers to completely understand biomass burning emissions in Amazonia. The advance of anthropogenic activities over forested areas, which ultimately leads to more fires and deforestation, is expected to continue, worsening a crisis of dangerous emissions.

1. Introduction

Preserving Amazonia is a global concern. Amazonia forests offer ecosystem services that goes beyond biodiversity; they regulate global temperature, carbon and water cycling, and are crucial for human existence and well-being [1,2,3,4]. However, the capability of Amazonia to offer these ecosystem services is decreasing because of climate change, deforestation and forest degradation [5]. Air pollution from gaseous and particulate emissions associated with biomass burning, which are linked to deforestation (i.e., the conversion of forest areas into another land-use driven by anthropogenic activities), also threaten Amazonia. These emissions impact the atmosphere by increasing air temperature [6], decreasing rainfall [7] and degrading air quality [8]. They also endanger human health, particularly exacerbating or causing a range of respiratory problems [9,10,11,12]. These risks together require urgent efforts to stem Amazonia deforestation [13,14,15], especially because it is currently occurring at alarming rates [16,17,18]. Due to the often-overlooked impact of biomass burning emissions on health, it is essential to develop a detailed understanding of the links between deforestation and biomass burning emissions [12].
After achieving a historical period of reduction in the Brazilian Amazon deforestation from 2004 to 2012 [19], annual deforestation rates (here considered as the conversion of only primary forest areas into another land-use driven by anthropogenic activities) begun to increase due largely to national environmental policy changes, particularly the discontinuation of the Action Plan for the Prevention and Control of Deforestation in the Legal Amazon (PPCDAm) program [15,20]. From 2013 to 2017, the annual deforestation rates in the Brazilian Amazon increased on average 40% in relation to the 2012 deforestation rate, and since 2018 a new deforestation boom has emerged, where the 2018, 2019 and 2020 deforestation rates were, respectively, 65%, 122% and 137% higher than the 2012 deforestation rate [19]. The 2020 deforestation rate (10,851 km2) was the highest of the decade in the Brazilian Amazon [19]. This increased deforestation is threatening private and public forests, including protected areas in the Brazilian Amazon [21,22,23].
With increasing deforestation in Amazonia, there is an expected increase in fire activity and, consequently, biomass burning emissions of trace gases and aerosols that impact climate, air quality and human health. This is because deforestation and fires are often positively correlated in Amazonia and linked mechanistically particularly by the practice of slash-and-burn [22,24,25,26,27]. Deforestation and fire activity were exacerbated during the 2019 Amazonia fire crisis [28], which raised both national and international concerns for reasons including the combination of the COVID-19 pandemic and smoke pollution that endangered all Amazonians [29]. Recent studies reported that fire activity during this crisis was near this Century’s average [30]. However, the potential exacerbating influence of climate conditions on the occurrence of fires (i.e., in hot and dry years) was low for much of Amazonia, which suggests that the spike in Amazonia fires was driven primarily by deforestation [30,31,32]. Silveira et al. [28] analyzed the drivers of the 2019’s fires in the Brazilian Amazon and concluded that fire occurrence in the three previous years, deforestation in 2019 and deforestation in the five previous years all appeared to contribute to this burning crisis.
Therefore, deforestation has a fundamental role in fire activity and, consequently, biomass burning emissions in Amazonia. According to Barlow et al. [27], there are three major types of fire in Amazonia: (i) deforestation fires, ignited to clear primary forests for agriculture, (ii) fires set in areas that have been previously cleared related to land management by smallholders, including indigenous or traditional peoples and (iii) fires that invade standing forests, where repeated events result in more intense fires and wider tree loss. Weak governance is often related to deforestation fires, while climate change makes forests more susceptible to uncontrolled fires [27].
Even considering the importance and impacts of fires, long-term and multi-scale studies for understanding drivers of fire activity, particularly biomass burning emissions, are lacking in Amazonia. Usually, these studies are short-term or limited to small areas [22,26] or are limited to the Brazilian Amazon, not considering the other countries where Amazonia is located [28,33,34,35,36,37].
In this research we have assessed for the first time how deforestation drove biomass burning emissions in Amazonia over the last two decades. By assessing the entire Amazonia, we provide a broad view of the relationship between deforestation and biomass burning emissions, then we present the results at country/state levels, which can support the policy planning for mitigation actions. Finally, we perform a regular grid analysis for identifying hotspot priority areas. Our annual biomass burning emissions estimates cover the period from 2002 to 2020, while annual deforestation estimates were obtained from 2002 to 2018. Biomass burning emissions were estimated using the Brazilian Biomass Burning emission model with Fire Radiative Power (3BEM_FRP) [38], and annual deforestation was estimated based on the MapBiomas Amazonia Land Use and Land Cover (LULC) dataset [39].

2. Materials and Methods
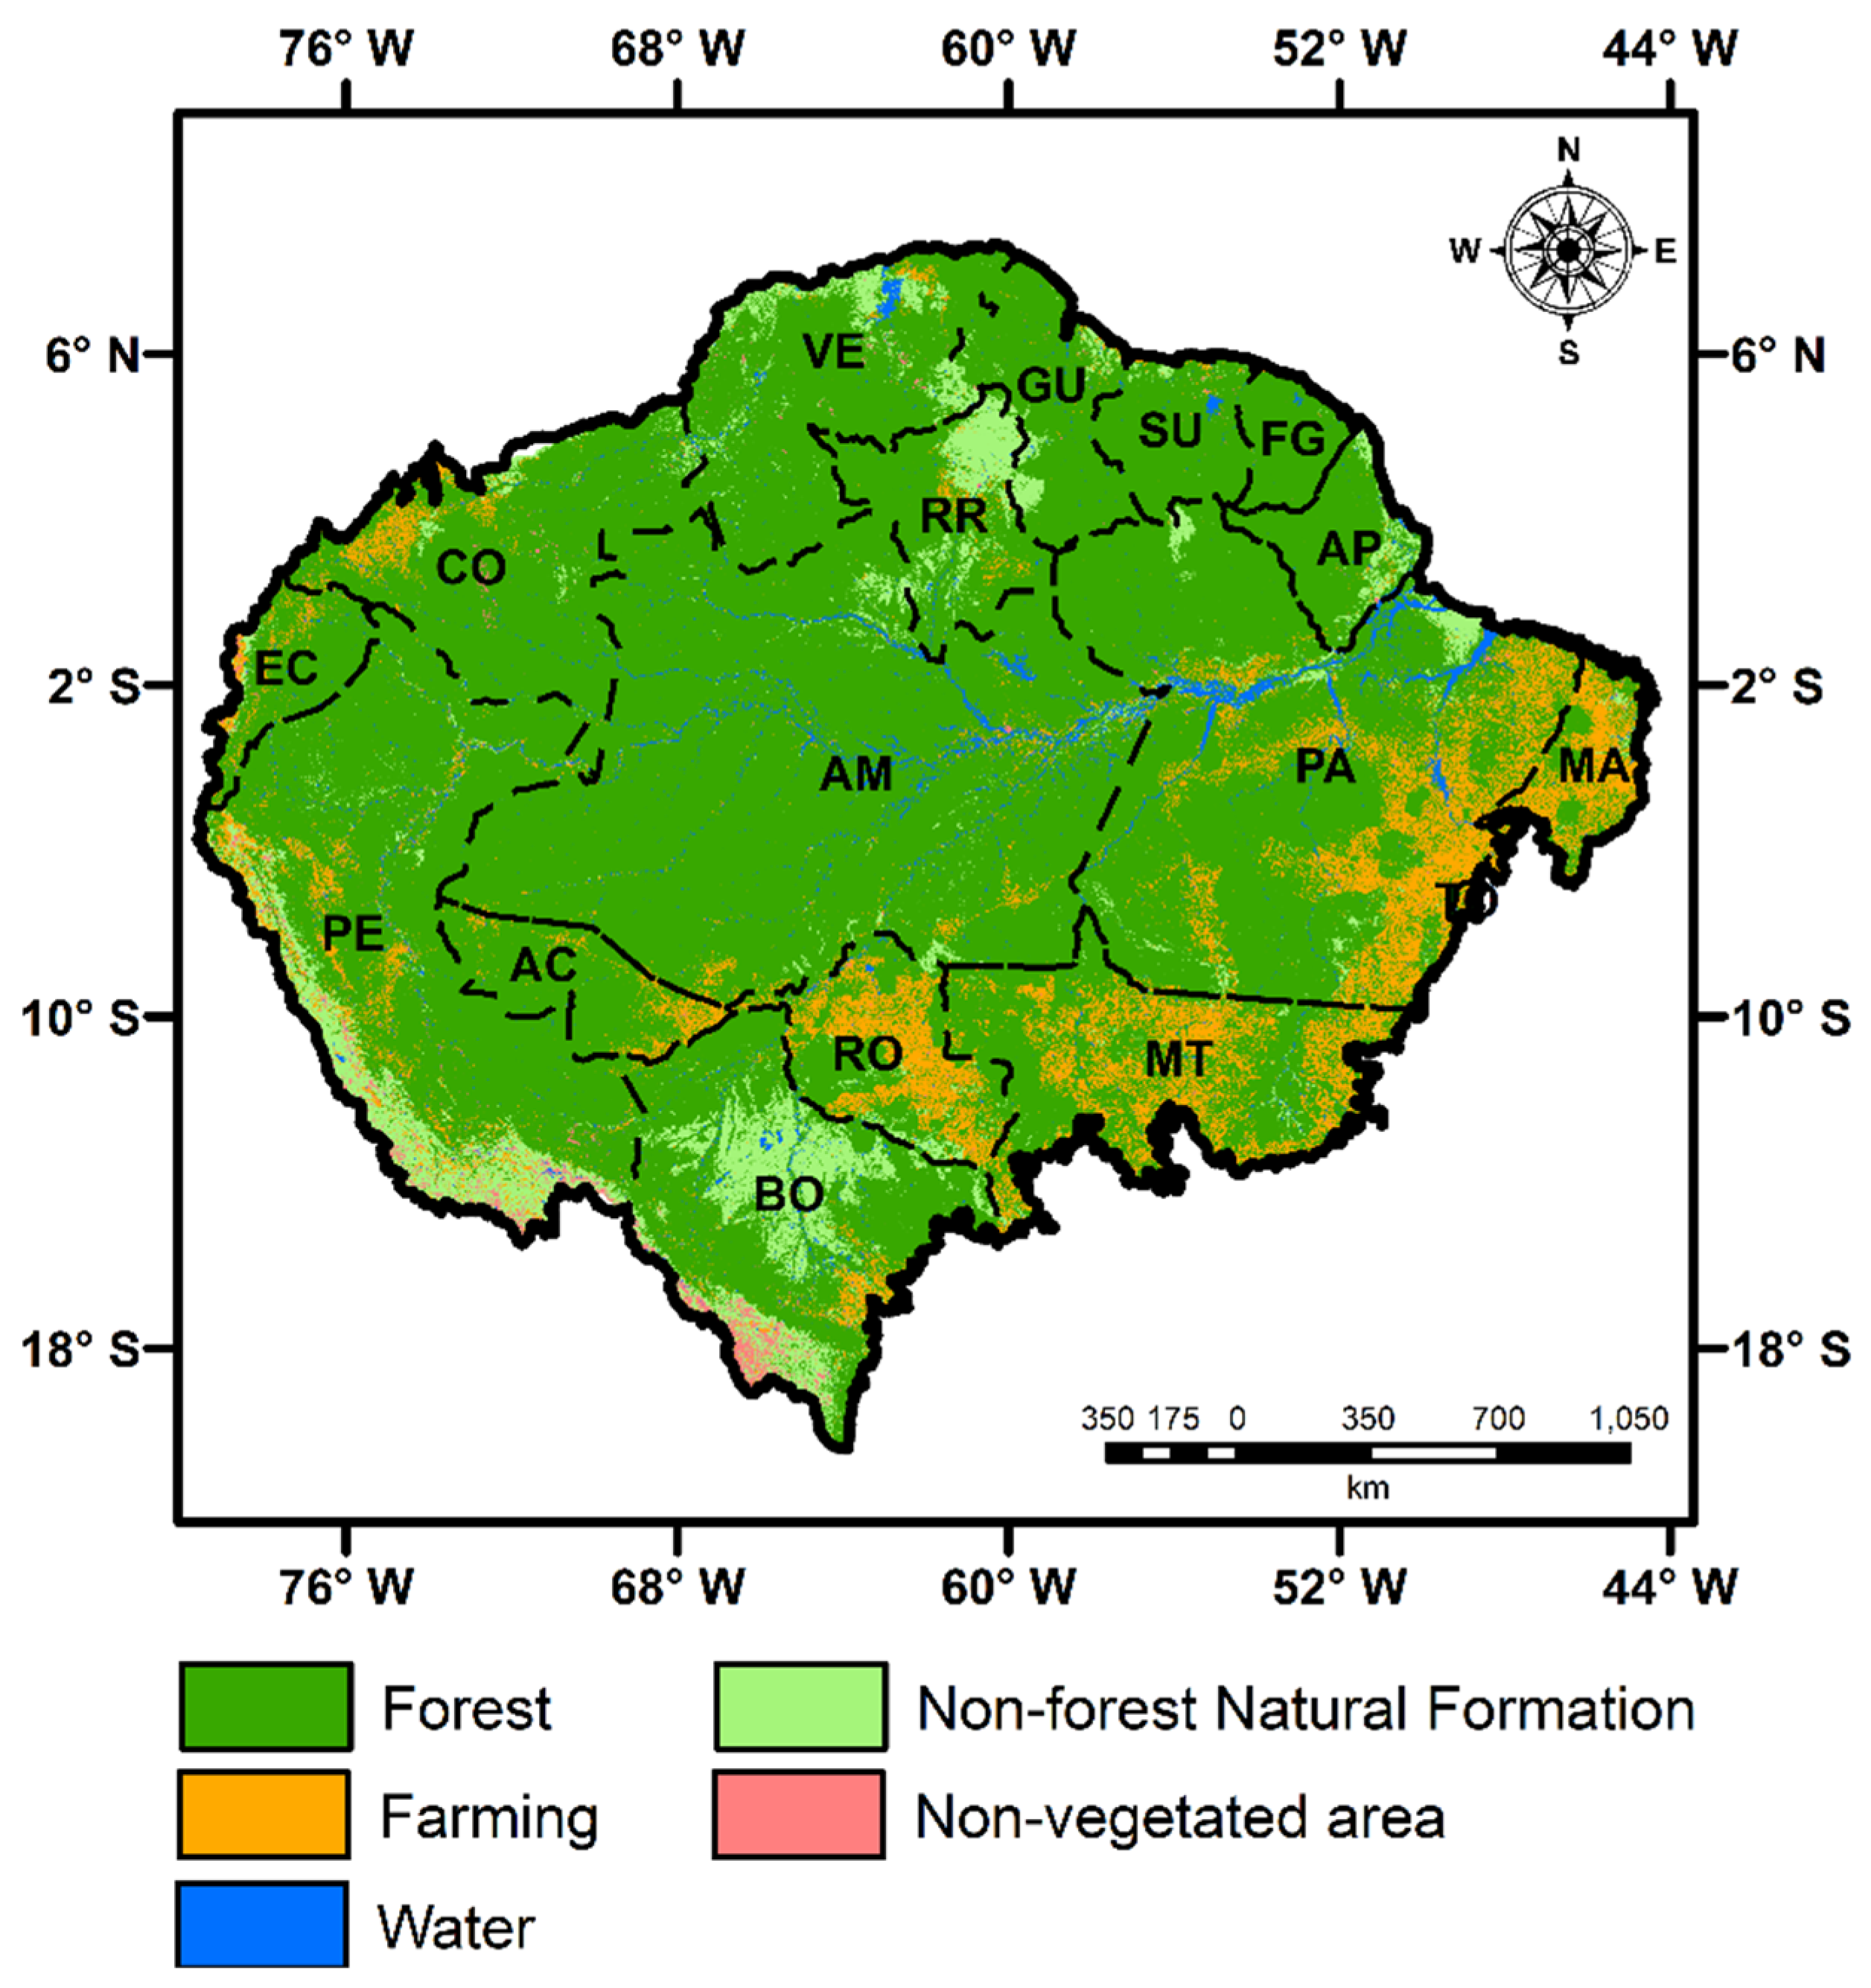
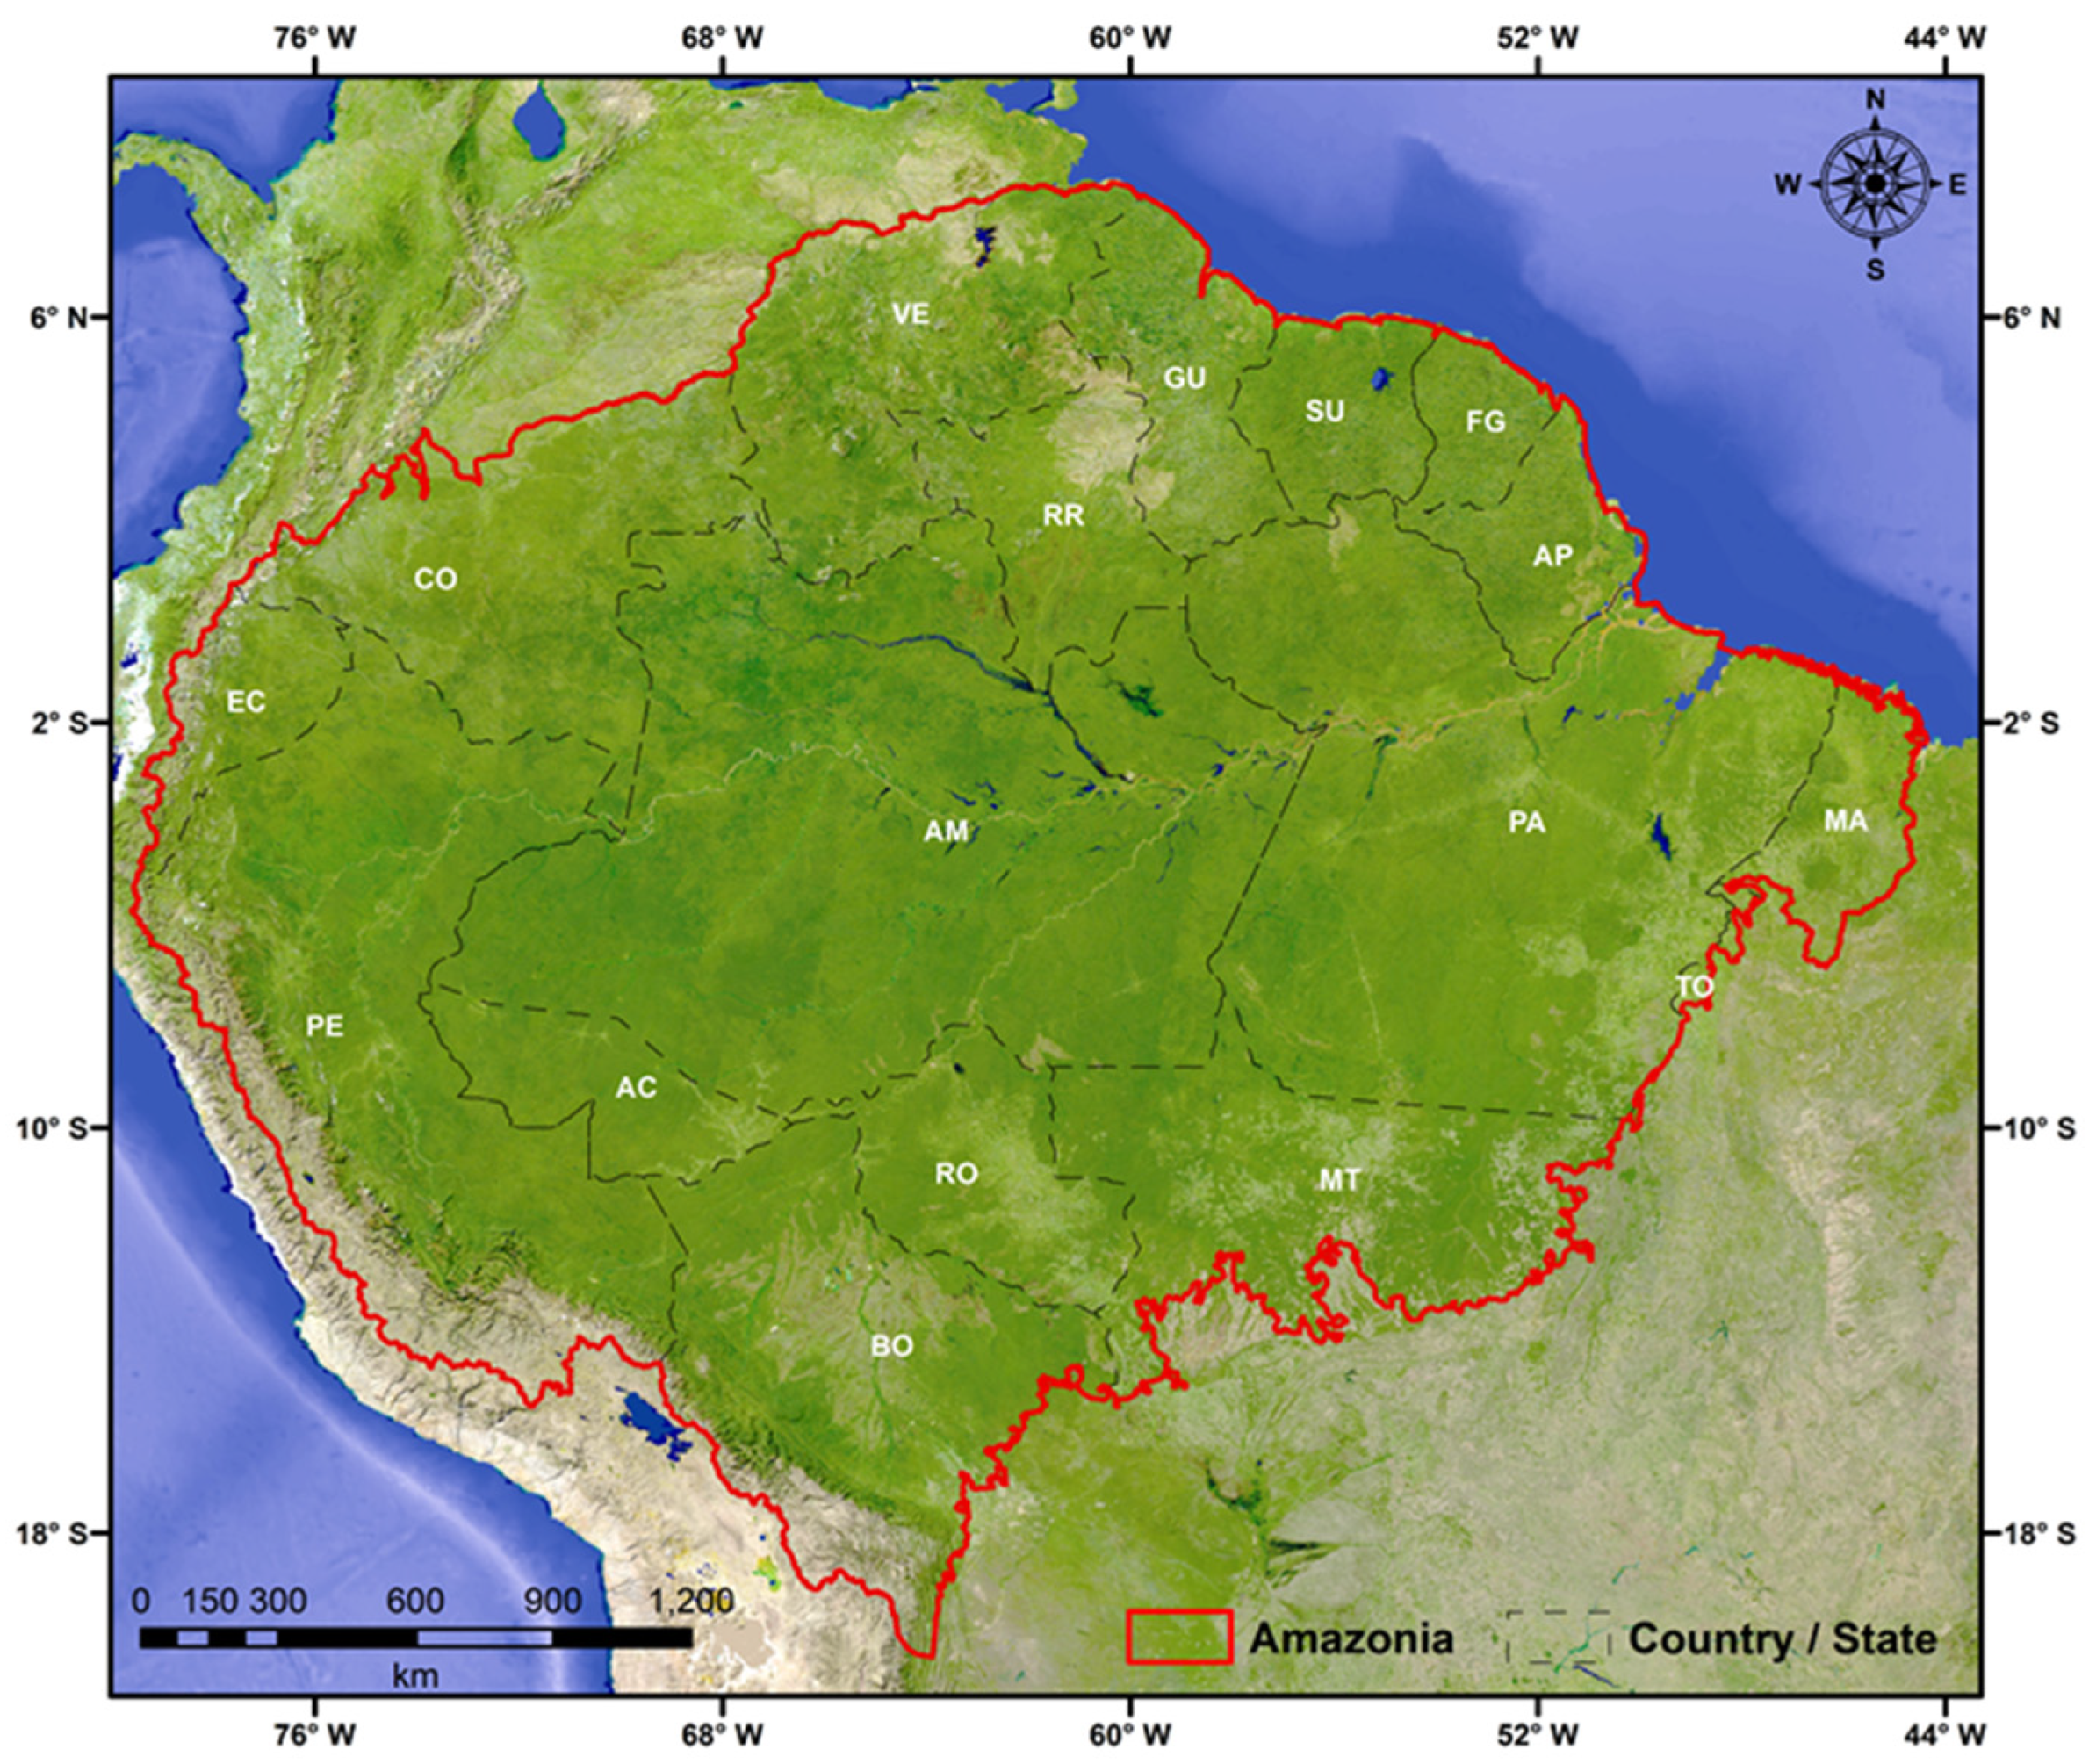
2.1. Study Area

The study area encompasses the entire Amazonia (Figure 1), following the delimitation adopted in the study of Cassol et al. [40]. The total area of Amazonia (7,269,170 km2) is spatially distributed over 9 South American countries. Over the last decades, deforestation has been a major anthropogenic disturbance in Amazonia. Between 1985 and 2018, Amazonia lost approximately 10% of its forested areas [39]. Even so, forested areas still accounted for 80% of Amazonia in 2018 [39].
The country/state-scale delimitation adopted in this study considered initially the 9 countries where Amazonia is located. However, the Brazilian portion of Amazonia corresponds to 58% of this total. In this flank of Amazonia, there is an extensive gradient of rainfall and drought [41], deforestation and fire activity varying widely both spatially and temporally [42]. To avoid generalizations, we have divided the Brazilian portion of Amazonia into the 9 states where it is located (Acre, Amapá, Amazonas, Mato Grosso, Maranhão, Pará, Rondônia, Roraima and Tocantins), which in some cases (e.g., Amazonas) rival in size the largest of other nation’s portion of Amazonia. Therefore, in this study we considered 17 countries/states in Amazonia (Figure 1).

2.2. Biomass Burning Emissions

2.2.1. PM2.5 and the 3BEM_FRP Model

Among the several species of trace gases and aerosols emitted during a burning event, e.g., carbon dioxide (CO2) and carbon monoxide (CO), we chose the species particulate matter with diameter less than 2.5 µm (PM2.5) to characterize biomass burning emissions. This is because PM2.5, which represents a primary human health risk [9] and degrades air quality [8], is considered a good proxy of other species of trace gases and aerosols emitted from biomass burning and has been used in several recent biomass burning emissions characterization studies [22,43,44,45,46]. We have estimated PM2.5 emitted from biomass burning during the 2002–2020 period in Amazonia using the 3BEM_FRP model implemented in the PREP-CHEM-SRC emissions preprocessing tool version 1.8.3 [38].
The 3BEM_FRP model is based on the Fire Radiative Power (FRP) approach to estimate biomass burning emissions [38]. FRP is a measurement of the rate that energy is emitted as electromagnetic radiation during the combustion process and is proportional to the rate of burning biomass [47]. The temporal integration of FRP, Fire Radiative Energy (FRE, defined as the energy emitted as electromagnetic radiation during the entire combustion process), is proportional to the amount of burned biomass and, consequently, to the amount of gases and aerosols emitted from this burned biomass [47].
While global biomass burning inventories are more generic in terms of parametrization, 3BEM_FRP has specific parameters adjusted to the South American continent [48]. Moreover, the current version of 3BEM_FRP has implemented the fire diurnal cycle for each LULC within each South American biome, totalizing 129 average values of fire diurnal cycle that are used when there are only a few observations of a burning event [49]. The adopted LULCs in this implementation were based on the MODIS MCD12Q1 product, following the International Geosphere-Biosphere Program (IGBP) classification scheme [49]. These advantages in comparison to global biomass burning inventories make 3BEM_FRP more suitable for studies conducted in South America and, consequently, Amazonia.
The adopted model to estimate emissions in Amazonia successfully estimated PM2.5 emitted from biomass burning in previous studies conducted in the Brazilian Amazon [22,44,46,50], Brazilian Cerrado [43,45] and over the South American continent [38]. Regarding the accuracy of 3BEM_FRP estimates, Cardozo et al. [50] used a previous version of 3BEM_FRP to validate the model outputs in the state of Rondônia (Brazilian Amazon). Annual estimates overestimated reference data by 5%. The current version of the model was validated using 3BEM_FRP outputs as inputs in aerosol optical depth (AOD) simulations derived from the Brazilian developments on the Regional Atmospheric Modeling System (BRAMS) model [51]. BRAMS simulations during the South American 2020 fire season showed a good agreement with Modern-Era Retrospective analysis for Research and Applications (MERRA-2) and Copernicus Atmosphere Monitoring Service (CAMS) AOD data (R = 0.97) [51]. In this work, the authors also concluded that the new improvements made in 3BEM_FRP better represent biomass burning emissions during large fire events.

2.2.2. Estimate of Biomass Burning Emissions in 3BEM_FRP
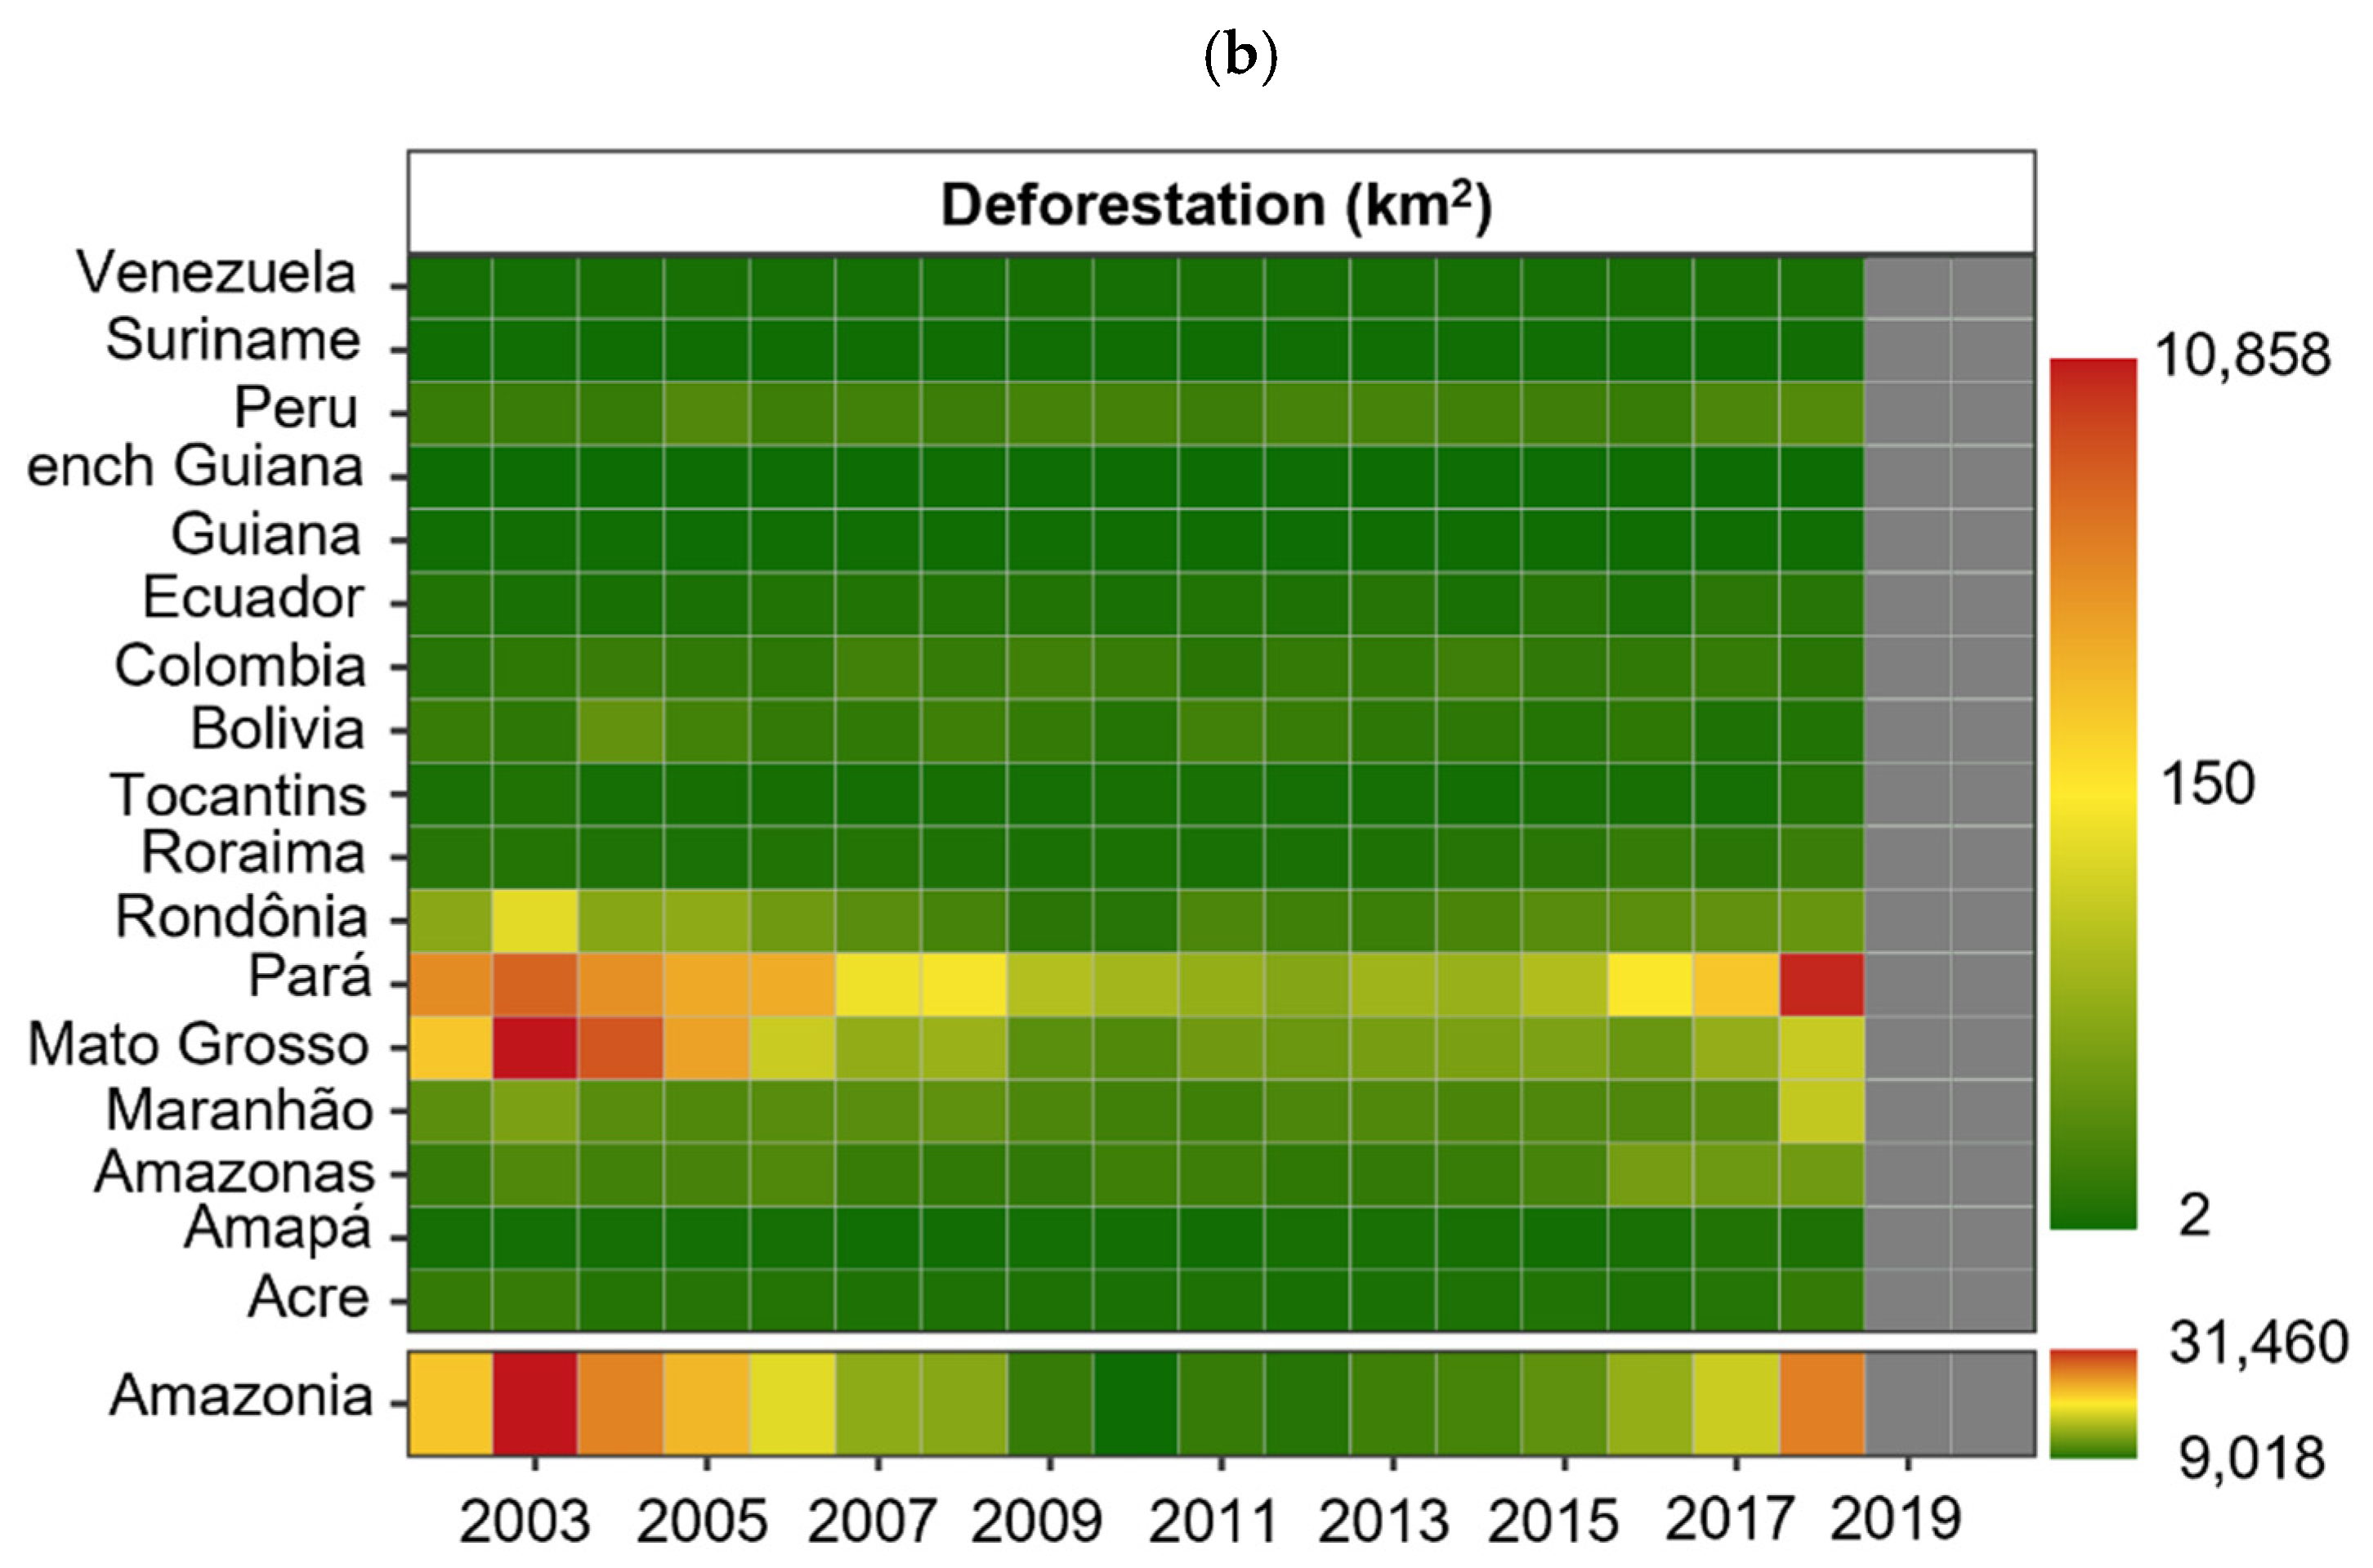
The domain considered in 3BEM_FRP was a regular grid at the spatial resolution of 0.1° over Amazonia (~11 km). The dataset used to generate the biomass burning emissions inventory consisted of the Moderate Resolution Imaging Spectroradiometer (MODIS) sensors active fire products (MOD14 and MYD14) [52], that provide FRP estimates for each active fire detected. Other sources of emissions, such as biogenic and urban, were not considered in this study.
All active fires detected outside the considered domain and those with a detection confidence level below 40% were excluded, a more restrict threshold than the one adopted by Pereira et al. [38]. This exclusion aimed to remove misdetections and inaccurate FRP estimates and accounted for 11.5% of the 5,368,703 active fires detected by MODIS from 2002 to 2020 in Amazonia. If the 50% threshold was adopted, 20.4% of the detected fires would have been excluded. 3BEM_FRP also adopts a correction to minimize the bow-tie effect in MODIS active fires [38]. Moreover, in this initial processing, subroutines of 3BEM_FRP also identified the LULC of each grid cell based on MODIS MCD12Q1 product, estimated the average burning time and calculated the active fire size [38]. Then, the model clustered the FRP values in a defined M × N grid, based on the considered domain and the spatial resolution, resulting in a n-dimension array containing the aggregation of fire’s characteristics (accumulated fire size, satellite pixel size, time in Julian day format, accumulated FRP and number of detected fires) [38,51]:
FRP g rid ( lon ,   lat ,   t ) = γ = α α κ = β β η ( γ , κ ) ξ ( long + γ ,   lat + κ , t )
where the clustered grid is defined to all grid cells where the M × N grid is completely overlapped (lon ε [α, M − α], lat ε [β, N − β]), lon and lat are, respectively, the longitude and latitude of the center of each grid cell, and t is the time step.
Subsequently, the integration of FRP and the emission for a given species, in this case PM2.5, was estimated by [38,51]:
    M [ PM 2.5 ] = [ 1 2 i = 1 n ( FRP n + FRP n + 1 ) ( t n + 1 t n ) ] C e EF [ PM 2.5 ] EF [ TPM ]
where M[PM2.5] is the mass of PM2.5 emitted from biomass burning in each grid cell (kg m−2), n represents the nth sample of a specific regular grid position at a time sequence (t, in seconds), and Ce, in kg of burned biomass per MJ emitted, is the coefficient of emission (that directly relates the integrated FRP to emission [53]). EF[PM2.5], in g of PM2.5 emitted per kg of burned biomass, is the PM2.5 emission factor for the LULC where the grid cell is located, and EF[TPM] is the emission factor for the total particulate matter (g emitted per kg of burned biomass).
If, due to the lack of observations, fire observations in a grid cell are insufficient to estimate the fire diurnal cycle, 3BEM_FRP utilizes a lookup table containing average fire diurnal cycle values for each LULC type within each biome of South America to perform the integration process [49]. Both Ce and EF[PM2.5] are derived from the Fire Energetics and Emissions Research (FEER) product [53]. The PM2.5 emission factors values adopted in 3BEM_FRP for each LULC are described in Table S1. From this table we observe that 3BEM_FRP version 1.8.3 has emission factors adjusted to South America.
Model outputs consisted of daily emissions of PM2.5 resulting from biomass burning at the spatial resolution of 0.1°. These were then aggregated into annual estimates, following the temporal resolution of the deforestation data. Such annual estimates were clipped to the delimitation of each of the 17 countries/states considered in this study to achieve the country/state-scale estimates.
More details on the method applied are described in Mataveli et al. [43], de Oliveira et al. [22] and Mataveli et al. [45] while 3BEM_FRP is fully detailed in Freitas et al. [54], Pereira et al. [38], Santos et al. [49], Mataveli et al. [43] and Pereira et al. [51].

2.3. Deforestation

2.3.1. MapBiomas Amazonia Collection 2.0

Annual deforestation in Amazonia was estimated using the freely available LULC dataset MapBiomas Amazonia Collection 2.0 [39]. MapBiomas annual LULC maps have been successfully used in several recent Amazonian LULC-related studies [55,56,57,58]. This dataset provides annual LULC maps for Amazonia generated at a 30 m spatial resolution based on pixel-by-pixel automatic classification of Landsat images using the machine learning algorithm Random Forest implemented on the Google Earth Engine platform [59]. MapBiomas Amazonia classification scheme level 2 differentiates 5 LULC classes in Amazonia: Forest, Non-natural Forest Formation, Farming, Non-vegetated Area and Water [59].
The accuracy assessment of MapBiomas Amazonia Collection 2.0 was based on ~75,000 samples collected per year from 1985 to 2018 following the Pontius and Millones method [60]. This assessment showed that annual Amazonian LULC maps have an average overall accuracy of 94%, average allocation disagreement of 4% and average area disagreement of 2% [61]. Therefore, MapBiomas Amazonia Collection 2.0 adequately identifies LULC, and, consequently, deforestation in Amazonia. Moreover, this is the only annual LULC dataset made available for the entire Amazonia.

2.3.2. Estimate of Deforestation

The MapBiomas Amazonia Collection 2.0 dataset was downloaded from the Google Earth Engine platform in raster format. Then, a script based on the R programming language was developed to capture the transition of LULC in the study area. The study interval of deforestation, 2002–2018, was determined by the last annual LULC map made by MapBiomas Amazonia Collection 2.0, 2018.
We considered deforestation in the script as all the pixels classified as the Forest LULC in a given year that were then converted to the Farming LULC in the following year. Therefore, both primary and secondary forests were equally treated. On Amazonia and country/state scales, annual deforestation rates consisted of summing the area of all pixels within Amazonia or each one of the 17 countries/states adopted in this study where the aforementioned rule was applicable. For Amazonia deforestation at the pixel scale, we used the same 0.1° regular grid as the biomass burning emission estimates and summed the area of all pixels where deforestation was identified.

2.4. Correlations in Time

Correlations in time between PM2.5 emitted from biomass burning and deforestation in a study unit (e.g., pixel) were quantified as Pearson’s correlation coefficients (R) at the three scales (Amazonia, country/state and pixel). This approach was able to reveal the correlation between fire-related variables and deforestation or climate-related variables in several recent studies [33,62,63,64,65].
Correlations in time were calculated using annual values. Thus, correlations between PM2.5 emitted from biomass burning and deforestation were estimated using 17 pairs of variables (years 2002 to 2018). At the Amazonia and country/state scales, annual emissions and deforestation values were defined as the aggregated values estimated for all grid cells within the Amazonia or each country/state delimitation. At the pixel scale, the originally estimated values were used to calculate the correlations in time. The significance of the correlations described above was tested using the Student t-test with significance level of 5%.

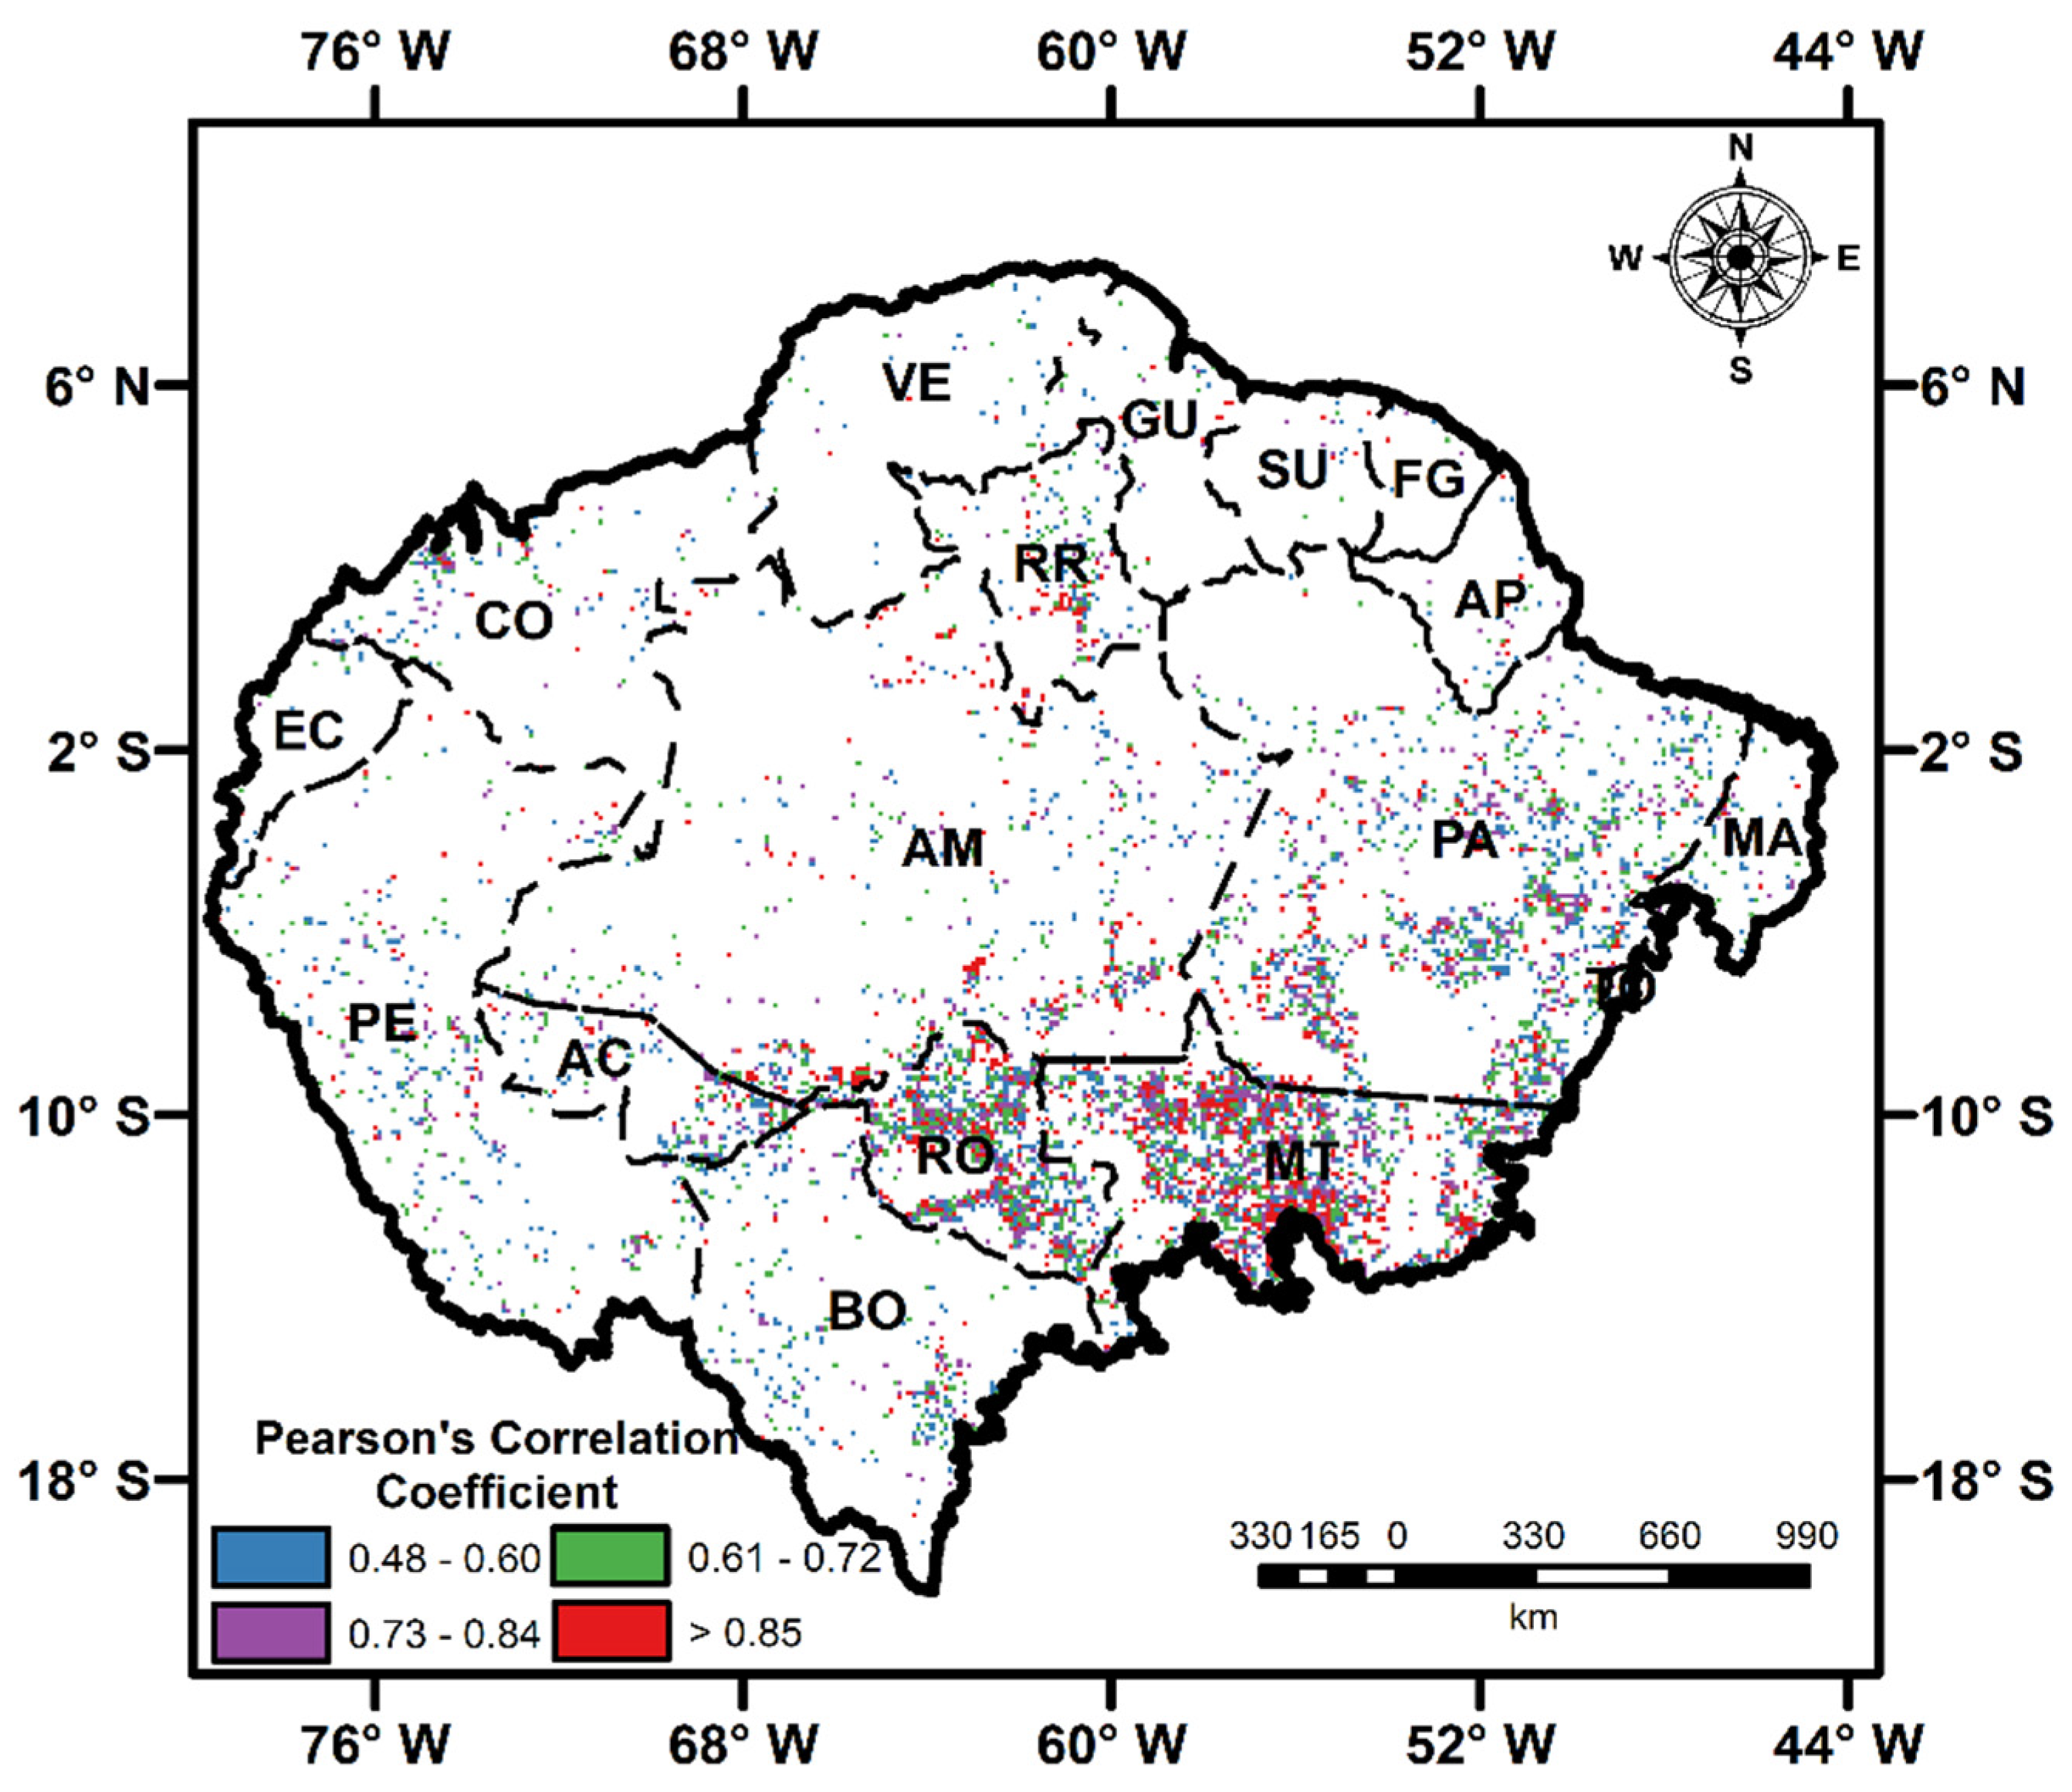
2.5. Time-Lagged Correlations and Correlations in Space

We have also performed other analysis in addition to correlations in time that helped to explain the results obtained for the relationship between biomass burning emissions and deforestation in Amazonia. The first was to calculate time-lagged correlations at grid scale. This is because there is an association between burned areas and previously deforested areas [66], and, therefore, fires can be set in years after deforestation in Amazonia. In this case, for example, the 2018 PM2.5 emitted from biomass burning was correlated to the 2017 deforestation (1-year lag) or the 2016 deforestation (2-years lag). The significance of time-lagged correlations was also tested using the Student t-test with significance level of 5%.
Correlations in space were also calculated. They consisted of calculating the Global Moran´s Index [67] between PM2.5 emitted from biomass burning and deforestation in Amazonia. This index measures the spatial dependence between variables. The more the observation values are influenced by observation values that are geographically close to them (i.e., the more clustered observations are), the greater the spatial correlation [68]. We have considered only three years—highest emission (2004), lowest emission (2009) and closest to the overall average (2017)—to calculate the index in order to not control autocorrelation. Only above-zero emission and deforestation grid cells were considered.
Finally, we have tested if the relationship between PM2.5 emitted from biomass burning and annual deforestation in Amazonia was higher in years of high deforestation. In this analysis, we have also considered only three years—highest emission (2004), lowest emission (2009) and closest to the overall average (2017)—in order to test if R2 values were highest in the year of highest deforestation and lowest in the year of lowest deforestation. Only above-zero emission and deforestation grid cells were considered.

3. Results

The spatial distribution of the annual average PM2.5 emitted from biomass burning in Amazonia is shown in Figure 2a. Higher values of annual average emission occurred in Eastern and Central-Southern Amazonia (Maranhão, Pará, Mato Grosso and Rondônia states and Bolivia). In contrast, lower concentrations were located in the Western and Northern portions of the study area, which are the least human-modified regions of Amazonia.
On average, Amazonian biomass burning emitted 3306 Gg year−1 of PM2.5. The year 2004 had the highest emission of PM2.5 associated with biomass burning in Amazonia during the 2002–2020 interval (6082 Gg), while 2013 had the lowest annual estimate (1403 Gg). The Pará and Mato Grosso states, located in Brazil, had the highest annual average emission of PM2.5 from biomass burning during 2002–2020 (1105 Gg year−1 and 598 Gg year−1, respectively) representing, respectively, 33% and 18% of the Amazonian average PM2.5 emitted from biomass burning (Figure 3a).
Regarding deforestation, we observed that the accumulated deforestation during 2002–2018 was also concentrated in Eastern and Central-Southern Amazonia (Maranhão, Pará, Mato Grosso and Rondônia states) (Figure 2b), especially in the area known as the “Brazilian Arc of Deforestation”. On average, 16,686 km2 year−1 were deforested in Amazonia during 2002–2018. Annual estimates of deforestation in Amazonia reached its peak in 2003 (31,460 km2), decreased annually until reaching the lowest value in 2010 (9019 km2) and started increasing again after this year, reaching 26,663 km2 in 2018 (second highest annual deforestation rate in Amazonia during 2002–2018). Most of deforestation from 2002 to 2018 in Amazonia occurred in the Pará (5554 km2 year−1) and Mato Grosso (3891 km2 year−1) states (Brazil), representing, respectively, 33% and 23% of the Amazonian average deforestation (Figure 3b).
Considering the entire Amazonia, the correlation between annually emitted PM2.5 from biomass burning and annual deforestation was statistically significant (p < 0.05), suggesting that this driver may explain approximately 65% of the PM2.5 emitted from biomass burning (Table 1). At a country/state-scale, we observed distinct patterns with only 7 of the political units evidencing a statistically significant correlation. The highest correlation at a country/state-scale between PM2.5 emitted from biomass burning and deforestation was observed at the Mato Grosso state (R = 0.85, considered a strong correlation), the second-highest Amazonian country/state in terms of both emissions and deforestation (after Pará). In the state with the fourth highest deforestation estimate, Maranhão, where there were high estimates of both deforestation and PM2.5 emitted from biomass burning, surprisingly there was no significant state-level correlation (R = −0.11). The relationship between annual PM2.5 emitted from biomass burning and annual deforestation in all Amazonian countries/states from 2002 to 2018 is shown in Figure S1.
Spatial patterns at a country/state-scale were also identified (Figure 4). Correlations between PM2.5 emitted from biomass burning and deforestation were statistically significant in Northern and Central Amazonian countries/states and non-statistically significant in countries/states located at Western Amazonia and in the transition with the Cerrado biome (Maranhão and Tocantins states).
We identified patterns at the grid scale that are not visible when considering the Amazonia or country/state scales separately (Figure 5). In 18% of the grid cells spatially distributed over Amazonia with above-zero emission, the correlation between annually emitted PM2.5 associated with biomass burning and annual deforestation was statistically significant (p < 0.05). These were especially higher in areas with extensive deforestation shown in Figure 2b. Highest grid cell correlation values were concentrated in the Mato Grosso and Rondônia states, reaching R values higher than 0.90, which is considered a strong correlation. We have also observed several grid cells with statistically significant correlations within countries/states that did not have a significant country/state-scale correlation, especially at Peru, Bolivia, Colombia, Acre and Maranhão.

4. Discussion

A large portion of South American biomass burning emissions during the last two decades occurred in Amazonia. The PM2.5 emitted from biomass burning during the 2002–2017 period in Amazonia represented 48% of the total South American emissions during this observational period [43]. The Brazilian portion of Amazonia had the greatest contribution to the Amazonian emission of PM2.5 from biomass burning between 2002 and 2020, accounting for 76% of total Amazonian emissions. Moreover, 34% of Amazonia 0.1° grid cells emitted PM2.5 associated with biomass burning in 10 or more years during the 2002–2020 period (Figure S2).
Emissions of PM2.5 associated with biomass burning and deforestation concentrated in Eastern and Central-Southern Amazonia (Figure 2). In these portions of Amazonia, there is a greater prevalence of more anthropized areas in the landscape (Figure 6), that is, there is a higher concentration of non-natural LULCs (Farming). Usually, fire activity in Amazonia peaks in areas where LULC changes are under pressure along newly agricultural frontiers, such as the ‘‘Brazilian Arc of Deforestation’’ and Eastern Bolivia [69]. In addition to deforestation fires, land management fires, set to shift cultivation, burn crop residues or to stimulate the regrowth of pastures, are important drivers of biomass burning emissions in these portions of Amazonia. Land management fires—which are not associated with new deforestation—are an especially important driver of biomass burning emissions in the Pará, Mato Grosso, Maranhão and Tocantins states, inserted in the transition between the Amazon and Cerrado biomes. These areas have a higher proportion of land already converted to Farming (Figure 7) and thus agricultural land management fires are more frequent [24,70]. We also note that this transitional portion of Amazonia with the Cerrado biome is naturally more fire-prone as savanna vegetation [70]. A recent study conducted in protected areas located in this transitional zone found a decoupling between PM2.5 emitted from biomass burning and deforestation during the 2002–2019 observational period, suggesting that non-deforestation fires drove fire emissions in this region during the study interval [45].
We found that peaks of biomass burning emissions and deforestation did not occur in the same year in Amazonia (Figure 3). This is in agreement with Lima et al. [66], who identified an association between burned areas and previously deforested areas in the Brazilian Amazon. Fires, indeed, can be set in years following forest clearing. Therefore, given that deforestation was highest in 2003, PM2.5 emissions associated with biomass burning in Amazonia were highest in 2004, followed by 2005. This is better observed in Figure S3, where correlations between annual PM2.5 emitted from biomass burning and annual deforestation lagged in 1 or 2 years were calculated.
Climate conditions also explain the high emission of PM2.5 associated with biomass burning in 2004 and 2005, as an extreme drought event occurred in major portions of Amazonia in these years. Amazonia is becoming more vulnerable to fires associated with these extreme drought events. Three of them occurred in the 21st Century (2004–2005, 2009–2010, 2015–2016), explained by tropical North Atlantic and Pacific sea surface temperature anomalous warming [71,72]. For example, during the 2009–2010 drought, the strongest drought event in Amazonia in this Century, drought-related fires affected more than 27,000 km2 of old-growth forests in the Brazilian Amazon [73]. The area affected was approximately 4 times larger than the deforestation rate of 2010 estimated by the Brazilian official deforestation monitoring program (PRODES) [73]. In 2010, we found that biomass burning emitted 4100 Gg of PM2.5 in Amazonia, an estimate 21% above the average for the 2002–2020 period. On the other hand, the deforestation rate in 2010 was the lowest in the interval we analyzed, just 54% of the 2002 to 2018 average, underscoring the importance of the climate drivers of biomass burning.
Climate conditions also seem to be an extremely important driver of biomass burning emissions in Northern and Western Amazonia. In these regions, we have found a statistically significant correlation with deforestation at country/state-scale only in Suriname and French Guiana (moderate correlation), and a low proportion of statistically significant grid cells in all Western and Northern Amazonia (Figure 4 and Figure 5). In these regions of Amazonia we have small deforestation rates (especially in Peru, which is the third largest Amazonian country/state in terms of area exceeding 1,000,000 km2 where annual average deforestation is only 868 km2, and Ecuador) and also a small proportion of non-natural LULCs (Figure 3 and Figure 7, respectively) with annual precipitation rates exceeding 2300 mm [74]. High precipitation rates tend to reduce the potential for fire ignition and spread by enhancing fuel moisture. There is a clear link between the seasonal variability of fuel moisture and fire occurrence, and a higher/lower probability of vegetation flammability due to shorter/longer dry seasons [75]. We also highlight that the Northern portion of Amazonia also has a larger proportion of flooded areas and flooded forests, which are highly vulnerable in very dry conditions and when burned lead to high tree mortality [76,77].
By considering in our study for the first time multiple study scales, we were able to identify distinct biomass burning emissions patterns and correlation with deforestation in Amazonia. For instance, we note that the Maranhão state, the country/state with the fourth highest annual average deforestation and fifth-highest country/state with highest annual average PM2.5 emitted from biomass burning in Amazonia, was characterized by a high frequency of high PM2.5 emitted from biomass burning and deforestation at the 0.1° scale. While there was no statistical significance at country/state scale (Figure 4), 11% of the grid cells with above-zero emission were significantly correlated, reaching R values of up to 0.92 (Figure 5). In general, countries/states where there was more Farming LULC and thus more fires not linked to deforestation did not evidence emission and deforestation correlations at the country/state scale over the time series (Figure S4). However, several grid cells within these countries/states did display a statistically significant correlation between biomass burning emissions and deforestation. These grid cells are located in areas of undergoing land conversion and, therefore, deforestation fires are more frequent. We note that even at this finest scale, mixed land-use, time lagged effects of prior deforestation (Figure S3) and climatic and vegetation factors that we did not explore likely impacted the emission versus deforestation correlations in time. We also highlight that correlations in space had an expected clustered pattern (Figure S5) and that the relationship between PM2.5 emitted from biomass burning and deforestation was highest in years of higher deforestation (Figure S6).
In a recent study, van Wees et al. [78] found that, on average, 38% ± 9% of global deforestation was associated with fire during the 2003–2018 period. This association varied substantially on regional scale. A statistically decreasing temporal trend in the fraction of fire-related deforestation was found in Amazonia. The authors have linked this decreasing trend to the fact that Amazonia was a deforestation frontier early in the study period. The whole Amazonia correlation in time between annual PM2.5 emitted from biomass burning and deforestation found in our study (R = 0.65) is higher than the one found between fire activity and deforestation in Amazonia in the study of van Wees et al. [78] (44% ± 16%) but is lower than the value recently described for an Amazonian indigenous territory facing a rapid recent deforestation incursion (R = 0.71) [22]. This value is also higher than the one found for the Pará state (R = 0.53), where this indigenous land is located. In another comparison, the highest correlation found at country/state scale (Mato Grosso, R = 0.85) was close to the relationship between biomass burning emissions and deforestation in this state found by van der Werf et al. [79], where 75% of biomass burning emissions were associated with deforestation during 2001–2005. de Oliveira et al. [22] highlighted that deforestation does not always use fire for removing the natural vegetation, and that fire intensity and extent may vary relative to the total area of a pixel, hindering remote sensing-based estimates. Morgan et al. [37] also found an increasing importance of non-deforestation biomass burning emissions drivers in Amazonia, especially biomass burning emissions driven by extreme climate events and warmer conditions.
Finally, it is important to note that, though not quantified, there are uncertainties that conceptually propagate errors in our final estimates of biomass burning emissions. These uncertainties include the omission of small size or low-intensity fires and other fire detection omissions caused by cloud cover or thick smoke in MOD14 and MYD14 active fires products [80]. Cloud obscuration account for an omission rate of approximately 11% of all active fires detected by coarse resolution sensors in Amazonia [81]. Surface characteristics, such as topography and fragmented landscapes, also hinder MODIS active fires detections [82] and consequently our estimates. Estimates are also impacted by the lower sensitivity of MODIS sensors in detecting active fires and accurately estimating FRP at off-nadir viewing angles [80,83]. Moreover, MODIS needs two days to provide a full coverage of equatorial regions, including Amazonia, due to swath gaps between adjacent orbits. This could lead to an underestimation of MODIS monthly FRP by 12.5% [84]. MODIS active fires products location, which in some cases have an error of up to 19% in the Amazon basin [85], is also a potential source of inaccuracies, since several parameters of the model are LULC-based. Accurate and up-to-date vegetation and fire properties, such as emission factors, are also required for more accurate estimates. Recent studies, such as Vernooij et al. [86], have estimated seasonal biomass burning emission factors. If this information becomes available for Amazonia, 3BEM_FRP estimates would be improved. Moreover, the LULC information used in the current version of 3BEM_FRP, derived from the MODIS MCD12Q1 product collection 5.1, is also a potential source of uncertainty [43]. An interesting update in the model is updating the current LULC information of the model to LULC maps based on the MapBiomas dataset.

5. Conclusions

This study estimated for the first time PM2.5 emitted from biomass burning and deforestation and their correlation in Amazonia over two decades (2002 to 2018 or 2020) at three different scales (Amazonia, country/state, or grid cell at the spatial resolution of 0.1°) based on remote sensing data and modelling. To the best of our knowledge these variables were never studied in Amazonia using such a long time series and distinct study scales.
We observed a wide variation in annual estimates of PM2.5 associated with biomass burning and deforestation in Amazonia. While PM2.5 emitted from biomass burning decreased during the 2011–2020 decade, deforestation increased dramatically in Amazonia after 2010, reaching in 2018 a rate observed only at the beginning of the 21st Century. Therefore, deforestation is an important fire driver in Amazonia but does not explain biomass burning emissions alone. This is because the feedbacks between fire (and emissions), vegetation, deforestation and climate often involve complex and non-linear relationships. To understand biomass burning emissions more completely in Amazonia, the influence of climate conditions and extreme climate events are particularly critical as this region is becoming drier and more susceptible to extreme droughts because of climate change. Edaphic conditions, vegetation characteristics in terms of plat traits/community structure, and canopy biophysical canopy structure are also likely critical to understand fire and forest degradation risks in mature tropical forest [87].
The advance of anthropogenic activities over forested areas, which tends to lead to more fires and deforestation, is expected in Amazonia. In this regard, there is an urgent need for a strategic long-term environmental planning agenda that considers sustainable development principles in this highly sensitive region. In addition to the wide range of essential ecosystem services offered by Amazonia and the need for an ‘intact’ functioning climate and atmosphere system linked to Amazonia forests preservation, the human health risks of smoke pollution should also be elevated as a significant motivator for conservation. Indeed, in the midst of a tragic global pandemic (COVID-19) that is impacting Brazil and threatens native peoples of Amazonia particularly, the impact of atmospheric pollution with broad negative respiratory impacts has likely increased negative outcomes (see de Oliveira et al. [29]), highlighting this importance.
Finally, for more accurate estimates of biomass burning emissions in future studies, we suggest updating the current LULC information of 3BEM_FRP, derived from the MODIS MCD12Q1 product collection 5.1, to the MapBiomas LULC data for Amazonia, Brazil, and other areas of South America included in this dataset. We also suggest the inclusion of active fires derived from Visible Infrared Imaging Radiometer Suite (VIIRS) and Geostationary Operational Environmental Satellite-R (GOES-R) when using the 3BEM_FRP model. This inclusion will better represent the fire diurnal cycle in the model [88].

Supplementary Materials

The following are available online at https://www.mdpi.com/article/10.3390/f12091217/s1, Figure S1: Relationship between annual PM2.5 emitted from biomass burning and annual deforestation in the 17 Amazonian countries/states from 2002 to 2018, Figure S2: Number of years when emission of PM2.5 associated with biomass burning was detected in Amazonia during the 2002–2020 period, Figure S3. Pearson’s correlation coefficient between the pair of variables PM2.5 emitted from biomass burning and 1-year lagged deforestation (a), and between PM2.5 emitted from biomass burning and 2-years lagged deforestation (b) in Amazonia. Only statistically significant pixels are shown in this figure, Figure S4. By-year correlations between PM2.5 emitted from biomass burning and deforestation on the country/state level data (a), variance of PM2.5 emitted from biomass burning explained by deforestation (b), slope of PM2.5 emitted from biomass burning vs. deforestation (c). Correlations were best on a log-log not regular scale (heteroskedasticity on the residuals). Ecuador (EC) was a low deforestation outlier and therefore was excluded to focus on the major deforestation countries/states in (d) and (e), Figure S5. Global Moran´s Index representing the correlation in space between PM2.5 emitted from biomass burning and deforestation in Amazonia. We have considered only three years—highest emission (2004), lowest emission (2009), and closest to the overall average (2017)—to calculate the index in order to not control autocorrelation. Only above-zero emission grid cells were considered. Given the z-score of 88.919, there is a less than 1% probability that this clustered pattern could be the result of random chance, Figure S6. Relationship between PM2.5 emitted from biomass burning and deforestation in Amazonia. Only above-zero emission and deforestation grid cells were considered in this figure. We have considered only three years—highest emission (2004), lowest emission (2009), and closest to the overall average (2017)—in order to highlight that R2 values were highest in the year of highest deforestation (2004) and lowest in the year of lowest deforestation (2009), Table S1. Fine particulate matter with diameter less than 2.5 μm (PM2.5) emission factors adopted in previous versions of 3BEM_FRP, in 3BEM_FRP version 1.8.3 when estimating global PM2.5 associated with biomass burning emissions, and in 3BEM_FRP version 1.8.3 when estimating PM2.5 associated with biomass burning in South America.

Author Contributions

Conceptualization, G.A.V.M., G.P., G.d.O. and L.E.O.C.A.; methodology, G.A.V.M., G.P. and H.T.S.; writing—original draft preparation, G.A.V.M., G.d.O. and G.P.; writing—review and editing, S.C.S., L.V.G., L.S.B., G.T., H.L.G.C., L.O.A. and L.E.O.C.A. All authors have read and agreed to the published version of the manuscript.

Funding

This research was funded by São Paulo Research Foundation (FAPESP), grant numbers 2019/25701-8 (G.A.V.M.), 2016/02018-2 (L.V.G.; L.E.O.C.A.), 2018/14006-4 (L.S.B.), 2019/23654-2 (L.S.B.), 2018/18493-7 (G.T.), 2018/14423-4 (H.L.G.C.), 2020/02656-4 (H.L.G.C.) and 2020/08916-8 (L.O.A.). L.E.O.C.A. and L.O.A. were also supported by the National Council for Scientific and Technological Development (CNPq), grant number 314416/2020-0 and 314473/2020-3, respectively. S.C.S. was supported by NSF DEB-1754357, 1950080 and the USDA NIFA (USA). G.P. was supported by CNPq, grant numbers 307004/2020-1 and 441934/2018-8. L.O.A. was supported by MAP-FIRE (IAI-SGP-HW016).

Institutional Review Board Statement

Not applicable.

Informed Consent Statement

Not applicable.

Data Availability Statement

All data used in the current study are available from the corresponding author on request.

Conflicts of Interest

The authors declare no conflict of interest.

References

  1. Lewis, S.L. Tropical forests and the changing earth system. Philos. Trans. R. Soc. B Biol. Sci. 2005, 361, 195–210. [Google Scholar] [CrossRef] [Green Version]
  2. Gibson, L.; Lee, T.M.; Koh, L.P.; Brook, B.; Gardner, T.A.; Barlow, J.; Peres, C.; Bradshaw, C.; Laurance, W.F.; Lovejoy, T.E.; et al. Primary forests are irreplaceable for sustaining tropical biodiversity. Nat. Cell Biol. 2011, 478, 378–381. [Google Scholar] [CrossRef]
  3. Lewis, S.L.; Edwards, D.P.; Galbraith, D. Increasing human dominance of tropical forests. Science 2015, 349, 827–832. [Google Scholar] [CrossRef]
  4. Watson, J.E.M.; Evans, T.; Venter, O.; Williams, B.; Tulloch, A.; Stewart, C.; Thompson, I.; Ray, J.C.; Murray, K.; Salazar, A.; et al. The exceptional value of intact forest ecosystems. Nat. Ecol. Evol. 2018, 2, 599–610. [Google Scholar] [CrossRef]
  5. Gatti, L.V.; Basso, L.S.; Miller, J.B.; Gloor, M.; Domingues, L.G.; Cassol, H.L.G.; Tejada, G.; Aragão, L.; Nobre, C.; Peters, W.; et al. Amazonia as a carbon source linked to deforestation and climate change. Nat. Cell Biol. 2021, 595, 388–393. [Google Scholar] [CrossRef]
  6. Li, F.; Lawrence, D.M.; Bond-Lamberty, B. Impact of fire on global land surface air temperature and energy budget for the 20th century due to changes within ecosystems. Environ. Res. Lett. 2017, 12, 044014. [Google Scholar] [CrossRef]
  7. Fanin, T.; van der Werf, G.R. Precipitation–fire linkages in Indonesia (1997–2015). Biogeosciences 2017, 14, 3995–4008. [Google Scholar] [CrossRef] [Green Version]
  8. Larsen, A.E.; Reich, B.; Ruminski, M.; Rappold, A.G. Impacts of fire smoke plumes on regional air quality, 2006–2013. J. Expo. Sci. Environ. Epidemiol. 2017, 28, 319–327. [Google Scholar] [CrossRef] [PubMed] [Green Version]
  9. Johnston, F.H.; Henderson, S.B.; Chen, Y.; Randerson, J.T.; Marlier, M.; DeFries, R.S.; Kinney, P.; Bowman, D.M.; Brauer, M. Estimated Global Mortality Attributable to Smoke from Landscape Fires. Environ. Health Perspect. 2012, 120, 695–701. [Google Scholar] [CrossRef] [PubMed] [Green Version]
  10. Alves, N.D.O.; Vessoni, A.; Quinet, A.; Fortunato, R.S.; Kajitani, G.S.; Peixoto, M.S.; Hacon, S.D.S.; Artaxo, P.; Saldiva, P.; Menck, C.F.; et al. Biomass burning in the Amazon region causes DNA damage and cell death in human lung cells. Sci. Rep. 2017, 7, 1–13. [Google Scholar] [CrossRef]
  11. Liang, F.; Liu, F.; Huang, K.; Yang, X.; Li, J.; Xiao, Q.; Chen, J.; Liu, X.; Cao, J.; Shen, C.; et al. Long-Term Exposure to Fine Particulate Matter and Cardiovascular Disease in China. J. Am. Coll. Cardiol. 2020, 75, 707–717. [Google Scholar] [CrossRef]
  12. Marlier, M.E.; Bonilla, E.X.; Mickley, L.J. How Do Brazilian Fires Affect Air Pollution and Public Health? GeoHealth 2020, 4, 2020000331. [Google Scholar] [CrossRef]
  13. Simmons, C.S.; Famolare, L.; Macedo, M.N.; Walker, R.T.; Coe, M.; Scheffers, B.; Arima, E.; Munoz-Carpena, R.; Valle, D.; Fraisse, C.; et al. Science in support of Amazonian conservation in the 21st century: The case of Brazil. Biotropica 2018, 50, 850–858. [Google Scholar] [CrossRef]
  14. Hansen, A.J.; Burns, P.; Ervin, J.; Goetz, S.J.; Hansen, M.; Venter, O.; Watson, J.E.M.; Jantz, P.A.; Virnig, A.L.S.; Barnett, K.; et al. A policy-driven framework for conserving the best of Earth’s remaining moist tropical forests. Nat. Ecol. Evol. 2020, 4, 1–8. [Google Scholar] [CrossRef] [PubMed]
  15. Junior, C.H.L.S.; Pessôa, A.C.M.; Carvalho, N.S.; Reis, J.B.C.; Anderson, L.O.; Aragão, L. The Brazilian Amazon deforestation rate in 2020 is the greatest of the decade. Nat. Ecol. Evol. 2021, 5, 144–145. [Google Scholar] [CrossRef]
  16. Kalamandeen, M.; Gloor, E.; Mitchard, E.; Quincey, D.; Ziv, G.; Spracklen, D.; Spracklen, B.; Adami, M.; Aragão, L.; Galbraith, D. Pervasive Rise of Small-scale Deforestation in Amazonia. Sci. Rep. 2018, 8, 1–10. [Google Scholar] [CrossRef] [Green Version]
  17. Turubanova, S.; Potapov, P.V.; Tyukavina, A.; Hansen, M.C. Ongoing primary forest loss in Brazil, Democratic Republic of the Congo, and Indonesia. Environ. Res. Lett. 2018, 13, 074028. [Google Scholar] [CrossRef] [Green Version]
  18. Da Cruz, D.C.; Benayas, J.M.R.; Ferreira, G.; Santos, S.R.; Schwartz, G. An overview of forest loss and restoration in the Brazilian Amazon. New For. 2021, 52, 1–16. [Google Scholar] [CrossRef] [Green Version]
  19. National Institute for Space Research (INPE). Monitoring of the Brazilian Amazon Deforestation by Satellite. Available online: http://terrabrasilis.dpi.inpe.br/app/dashboard/deforestation/biomes/legal_amazon/rates (accessed on 12 April 2021).
  20. West, T.A.; Fearnside, P.M. Brazil’s conservation reform and the reduction of deforestation in Amazonia. Land Use Policy 2021, 100, 105072. [Google Scholar] [CrossRef]
  21. Cabral, A.I.; Saito, C.; Pereira, H.; Laques, A.E. Deforestation pattern dynamics in protected areas of the Brazilian Legal Amazon using remote sensing data. Appl. Geogr. 2018, 100, 101–115. [Google Scholar] [CrossRef]
  22. De Oliveira, G.; Chen, J.M.; Mataveli, G.A.V.; Chaves, M.E.D.; Seixas, H.T.; Cardozo, F.D.S.; Shimabukuro, Y.E.; He, L.; Stark, S.C.; Dos Santos, C.A.C.; et al. Rapid Recent Deforestation Incursion in a Vulnerable Indigenous Land in the Brazilian Amazon and Fire-Driven Emissions of Fine Particulate Aerosol Pollutants. Forests 2020, 11, 829. [Google Scholar] [CrossRef]
  23. Walker, W.S.; Gorelik, S.R.; Baccini, A.; Aragon-Osejo, J.L.; Josse, C.; Meyer, C.; Macedo, M.N.; Augusto, C.; Rios, S.; Katan, T.; et al. The role of forest conversion, degradation, and disturbance in the carbon dynamics of Amazon indigenous territories and protected areas. Proc. Natl. Acad. Sci. USA 2020, 117, 3015–3025. [Google Scholar] [CrossRef] [PubMed] [Green Version]
  24. Pivello, V. The Use of Fire in the Cerrado and Amazonian Rainforests of Brazil: Past and Present. Fire Ecol. 2011, 7, 24–39. [Google Scholar] [CrossRef]
  25. Brando, P.; Macedo, M.; Silvério, D.; Rattis, L.; Paolucci, L.; Alencar, A.; Coe, M.; Amorim, C. Amazon wildfires: Scenes from a foreseeable disaster. Flora-Morphol. Distrib. Funct. Ecol. Plants 2020, 268, 151609. [Google Scholar] [CrossRef]
  26. Silva, C.; Santilli, G.; Sano, E.; Laneve, G. Fire Occurrences and Greenhouse Gas Emissions from Deforestation in the Brazilian Amazon. Remote Sens. 2021, 13, 376. [Google Scholar] [CrossRef]
  27. Barlow, J.; Berenguer, E.; Carmenta, R.; França, F. Clarifying Amazonia’s burning crisis. Glob. Chang. Biol. 2019, 26, 319–321. [Google Scholar] [CrossRef] [Green Version]
  28. Silveira, M.V.F.; Petri, C.A.; Broggio, I.S.; Chagas, G.O.; Macul, M.S.; Leite, C.C.S.S.; Ferrari, E.M.M.; Amim, C.G.V.; Freitas, A.L.R.; Motta, A.Z.V.; et al. Drivers of Fire Anomalies in the Brazilian Amazon: Lessons Learned from the 2019 Fire Crisis. Land 2020, 9, 516. [Google Scholar] [CrossRef]
  29. De Oliveira, G.; Chen, J.M.; Stark, S.C.; Berenguer, E.; Moutinho, P.; Artaxo, P.; Anderson, L.O.; Aragão, L. Smoke pollution’s impacts in Amazonia. Science 2020, 369, 634–635. [Google Scholar] [CrossRef]
  30. Lizundia-Loiola, J.; Pettinari, M.L.; Chuvieco, E. Temporal Anomalies in Burned Area Trends: Satellite Estimations of the Amazonian 2019 Fire Crisis. Remote Sens. 2020, 12, 151. [Google Scholar] [CrossRef] [Green Version]
  31. Cardil, A.; De-Miguel, S.; Silva, C.A.; Reich, P.B.; Calkin, D.; Brancalion, P.H.S.; Vibrans, A.C.; Gamarra, J.G.P.; Zhou, M.; Pijanowski, B.C.; et al. Recent deforestation drove the spike in Amazonian fires. Environ. Res. Lett. 2020, 15, 121003. [Google Scholar] [CrossRef]
  32. Kelley, D.I.; Burton, C.; Huntingford, C.; Brown, M.A.J.; Whitley, R.; Dong, N. Technical note: Low meteorological influence found in 2019 Amazonia fires. Biogeosciences 2021, 18, 787–804. [Google Scholar] [CrossRef]
  33. Fonseca, M.; Anderson, L.O.; Arai, E.; Shimabukuro, Y.E.; Xaud, H.A.M.; Xaud, M.R.; Madani, N.; Wagner, F.H.; Aragão, L. Climatic and anthropogenic drivers of northern Amazon fires during the 2015-2016 El Niño event. Ecol. Appl. 2017, 27, 2514–2527. [Google Scholar] [CrossRef] [PubMed]
  34. van Marle, M.J.E.; Field, R.D.; van der Werf, G.R.; de Wagt, I.A.E.; Houghton, R.A.; Rizzo, L.V.; Artaxo, P.; Tsigaridis, K. Fire and deforestation dynamics in Amazonia (1973-2014). Glob. Biogeochem. Cycles 2017, 31, 24–38. [Google Scholar] [CrossRef] [PubMed] [Green Version]
  35. Silva, C.V.J.; Aragão, L.; Barlow, J.; Espírito-Santo, F.; Young, P.J.; Anderson, L.O.; Berenguer, E.; Brasil, I.; Brown, I.F.; Castro, B.; et al. Drought-induced Amazonian wildfires instigate a decadal-scale disruption of forest carbon dynamics. Philos. Trans. R. Soc. B Biol. Sci. 2018, 373, 20180043. [Google Scholar] [CrossRef] [PubMed] [Green Version]
  36. Fonseca, M.G.; Alves, L.M.; Aguiar, A.P.D.; Arai, E.; Anderson, L.O.; Rosan, T.M.; Shimabukuro, Y.E.; Aragão, L.E.O.E.C.D. Effects of climate and land-use change scenarios on fire probability during the 21st century in the Brazilian Amazon. Glob. Chang. Biol. 2019, 25, 2931–2946. [Google Scholar] [CrossRef] [PubMed]
  37. Morgan, W.T.; Darbyshire, E.; Spracklen, D.V.; Artaxo, P.; Coe, H. Non-deforestation drivers of fires are increasingly important sources of aerosol and carbon dioxide emissions across Amazonia. Sci. Rep. 2019, 9, 1–15. [Google Scholar] [CrossRef] [Green Version]
  38. Pereira, G.; Siqueira, R.; Rosário, N.E.; Longo, K.L.; Freitas, S.R.; Cardozo, F.S.; Kaiser, J.W.; Wooster, M.J. Assessment of fire emission inventories during the South American Biomass Burning Analysis (SAMBBA) experiment. Atmos. Chem. Phys. Discuss. 2016, 16, 6961–6975. [Google Scholar] [CrossRef] [Green Version]
  39. MapBiomas Amazonia. Project MapBiomas-Collection 2.0 of Amazonia Land Cover & Use Map Series. Available online: http://amazonia.mapbiomas.org/en?cama_set_language=en (accessed on 12 April 2021).
  40. Cassol, H.; Domingues, L.; Sanchez, A.; Basso, L.; Marani, L.; Tejada, G.; Arai, E.; Correia, C.; Alden, C.; Miller, J.; et al. Determination of Region of Influence Obtained by Aircraft Vertical Profiles Using the Density of Trajectories from the HYSPLIT Model. Atmosphere 2020, 11, 1073. [Google Scholar] [CrossRef]
  41. Paredes-Trejo, F.; Barbosa, H.A.; Giovannettone, J.; Kumar, T.V.L.; Thakur, M.K.; Buriti, C.D.O. Long-Term Spatiotemporal Variation of Droughts in the Amazon River Basin. Water 2021, 13, 351. [Google Scholar] [CrossRef]
  42. Berenguer, E.; Carvalho, N.; Anderson, L.O.; Aragão, L.; França, F.; Barlow, J. Improving the spatial-temporal analysis of Amazonian fires. Glob. Chang. Biol. 2021, 27, 469–471. [Google Scholar] [CrossRef]
  43. Mataveli, G.A.V.; Silva, M.E.S.; França, D.D.A.; Brunsell, N.A.; De Oliveira, G.; Cardozo, F.D.S.; Bertani, G.; Pereira, G. Characterization and Trends of Fine Particulate Matter (PM2.5) Fire Emissions in the Brazilian Cerrado during 2002–2017. Remote Sens. 2019, 11, 2254. [Google Scholar] [CrossRef] [Green Version]
  44. Da Conceição, K.V.; Chaves, M.E.D.; Mataveli, G.A.V. Land Use and Land Cover Mapping in a Priority Municipality for Deforestation Control Actions in the Amazon using GEOBIA. Rev. Bras. Cartogr. 2020, 72, 574–587. [Google Scholar] [CrossRef]
  45. Mataveli, G.A.V.; Pereira, G.; Chaves, M.E.D.; Cardozo, F.d.S.; Stark, S.C.; Shimabukuro, Y.E.; Aragão, L.; de Oliveira, G.; Chen, J.M. Deforestation and land use and land cover changes in protected areas of the Brazilian Cerrado: Impacts on the fire-driven emissions of fine particulate aerosols pollutants. Remote Sens. Lett 2021, 12, 79–92. [Google Scholar] [CrossRef]
  46. Conceição, K.V.; Chaves, M.E.; Picoli, M.C.; Sánchez, A.H.; Soares, A.R.; Mataveli, G.A.; Silva, D.E.; Costa, J.S.; Camara, G. Government policies endanger the indigenous peoples of the Brazilian Amazon. Land Use Policy 2021, 108, 105663. [Google Scholar] [CrossRef]
  47. Wooster, M.J.; Roberts, G.; Perry, G.; Kaufman, Y.J. Retrieval of biomass combustion rates and totals from fire radiative power observations: FRP derivation and calibration relationships between biomass consumption and fire radiative energy release. J. Geophys. Res. Space Phys. 2005, 110. [Google Scholar] [CrossRef]
  48. Freitas, S.R.; Panetta, J.; Longo, K.M.; Rodrigues, L.F.; Moreira, D.S.; Rosário, N.E.; Dias, P.L.S.; Dias, M.A.F.S.; Souza, E.P.; Freitas, E.D.; et al. The Brazilian developments on the Regional Atmospheric Modeling System (BRAMS 5.2): An integrated environmental model tuned for tropical areas. Geosci. Model Dev. 2017, 10, 189–222. [Google Scholar] [CrossRef] [Green Version]
  49. Santos, P.R.; Pereira, G.; Cardozo, F.d.S.; Mataveli, G.A.V.; Moraes, E.C. Desenvolvimento e implementação do ciclo diurno da queima de biomassa no PREP-CHEM-SRC. Rev. Dep. Geog. 2021, 41, e174236. [Google Scholar] [CrossRef]
  50. Cardozo, F.d.S.; Pereira, G.; Mataveli, G.A.V.; Shimabukuro, Y.E.; Moraes, E.C. Evaluation of 3BEM and 3BEM_FRP Emissions Models in the Rondônia State. Res. Bras. Cart. 2015, 67, 1247–1264. [Google Scholar]
  51. Pereira, G.; Longo, K.M.; Freitas, S.R.; Mataveli, G.; Oliveira, V.J.; Santos, P.R.; Rodrigues, L.F.; Cardozo, F.d.S. Improving the South America wildfires smoke estimates: Assimilation of Polar-orbiting and Geostationary Satellite fire products in the Brazilian Biomass Burning Emission Model (3BEM). Atmos. Environ. 2021. submitted for publication. [Google Scholar]
  52. Giglio, L.; Schroeder, W.; Justice, C.O. The collection 6 MODIS active fire detection algorithm and fire products. Remote Sens. Environ. 2016, 178, 31–41. [Google Scholar] [CrossRef] [Green Version]
  53. Ichoku, C.; Ellison, L. Global top-down smoke-aerosol emissions estimation using satellite fire radiative power measurements. Atmos. Chem. Phys. Discuss. 2014, 14, 6643–6667. [Google Scholar] [CrossRef] [Green Version]
  54. Freitas, S.R.; Longo, K.M.; Alonso, M.F.; Pirre, M.; Marecal, V.; Grell, G.; Stockler, R.; Mello, R.F.; Gácita, M.S. PREP-CHEM-SRC—1.0: A preprocessor of trace gas and aerosol emission fields for regional and global atmospheric chemistry models. Geosci. Model Dev. 2011, 4, 419–433. [Google Scholar] [CrossRef] [Green Version]
  55. Nunes, S.; Oliveira, L.; Siqueira, J.; Morton, D.C.; Souza, C.M. Unmasking secondary vegetation dynamics in the Brazilian Amazon. Environ. Res. Lett. 2020, 15, 034057. [Google Scholar] [CrossRef]
  56. Junior, C.H.S.; Celentano, D.; Rousseau, G.X.; de Moura, E.G.; Varga, I.V.D.; Martinez, C.; Martins, M.B. Amazon forest on the edge of collapse in the Maranhão State, Brazil. Land Use Policy 2020, 97, 104806. [Google Scholar] [CrossRef]
  57. Junior, C.H.L.S.; Heinrich, V.; Freire, A.T.G.; Broggio, I.S.; Rosan, T.M.; Doblas, J.; Anderson, L.O.; Rousseau, G.X.; Shimabukuro, Y.E.; Silva, C.A.; et al. Benchmark maps of 33 years of secondary forest age for Brazil. Sci. Data 2020, 7, 269. [Google Scholar] [CrossRef] [PubMed]
  58. Guerrero, J.V.R.; Escobar-Silva, E.V.; Chaves, M.E.D.; Mataveli, G.A.V.; Bourscheidt, V.; De Oliveira, G.; Picoli, M.C.A.; Shimabukuro, Y.E.; Moschini, L.E. Assessing Land Use and Land Cover Changes in the Direct Influence Zone of the Braço Norte Hydropower Complex, Brazilian Amazonia. Forests 2020, 11, 988. [Google Scholar] [CrossRef]
  59. MapBiomas Amazonia. Project MapBiomas—MapBiomas Amazonia Algorithm Theoretical Basis Document. Available online: http://amazonia.mapbiomas.org/en/atbd-general?cama_set_language=en (accessed on 12 April 2021).
  60. Pontius, R.G., Jr.; Millones, M. Death to Kappa: Birth of quantity disagreement and allocation disagreement for accuracy assessment. Int. J. Remote Sens. 2011, 32, 4407–4429. [Google Scholar] [CrossRef]
  61. MapBiomas Amazonia. Project MapBiomas—MapBiomas Amazonia Accuracy Statistics. Available online: http://mapbiomas-amazonia-site-stg.herokuapp.com/en/exactitud?cama_set_language=en (accessed on 12 April 2021).
  62. Spracklen, D.V.; Garcia-Carreras, L. The impact of Amazonian deforestation on Amazon basin rainfall. Geophys. Res. Lett. 2015, 42, 9546–9552. [Google Scholar] [CrossRef] [Green Version]
  63. Saha, M.V.; Scanlon, T.M.; D’Odorico, P. Suppression of rainfall by fires in African drylands. Geophys. Res. Lett. 2016, 43, 8527–8533. [Google Scholar] [CrossRef]
  64. Alvarado, S.T.; Fornazari, T.; Costola, A.; Morellato, P.; Silva, T. Drivers of fire occurrence in a mountainous Brazilian cerrado savanna: Tracking long-term fire regimes using remote sensing. Ecol. Indic. 2017, 78, 270–281. [Google Scholar] [CrossRef] [Green Version]
  65. de Oliveira-Júnior, J.F.; Teodoro, P.E.; Junior, C.A.D.S.; Baio, F.H.R.; Gava, R.; Capristo-Silva, G.F.; Gois, G.; Filho, W.C.; Lima, M.; Santiago, D.D.B.; et al. Fire foci related to rainfall and biomes of the state of Mato Grosso do Sul, Brazil. Agric. For. Meteorol. 2020, 282–283, 107861. [Google Scholar] [CrossRef]
  66. Lima, A.; Silva, T.S.F.; Aragão, L.E.O.E.C.D.; De Feitas, R.M.; Adami, M.; Formaggio, A.R.; Shimabukuro, Y.E. Land use and land cover changes determine the spatial relationship between fire and deforestation in the Brazilian Amazon. Appl. Geogr. 2012, 34, 239–246. [Google Scholar] [CrossRef]
  67. Moran, P.A.P. The Interpretation of Statistical Maps. J. R. Stat. Soc. Ser. B Methodol. 1948, 10, 243–251. [Google Scholar] [CrossRef]
  68. Xiong, Y.; Li, Y.; Xiong, S.; Wu, G.; Deng, O. Multi-scale spatial correlation between vegetation index and terrain attributes in a small watershed of the upper Minjiang River. Ecol. Indic. 2021, 126, 107610. [Google Scholar] [CrossRef]
  69. Aragão, L.; Malhi, Y.; Roman-Cuesta, R.M.; Saatchi, S.; Anderson, L.; Shimabukuro, Y.E. Spatial patterns and fire response of recent Amazonian droughts. Geophys. Res. Lett. 2007, 34. [Google Scholar] [CrossRef] [Green Version]
  70. Schmidt, I.B.; Eloy, L. Fire regime in the Brazilian Savanna: Recent changes, policy and management. Flora-Morphol. Distrib. Funct. Ecol. Plants 2020, 268, 151613. [Google Scholar] [CrossRef]
  71. Marengo, J.A.; Espinoza, J.C. Extreme seasonal droughts and floods in Amazonia: Causes, trends and impacts. Int. J. Clim. 2016, 36, 1033–1050. [Google Scholar] [CrossRef]
  72. Anderson, L.O.; Neto, G.R.; Cunha, A.P.; Fonseca, M.G.; De Moura, Y.M.; Dalagnol, R.; Wagner, F.H.; Aragão, L.E.O.E.C.D. Vulnerability of Amazonian forests to repeated droughts. Philos. Trans. R. Soc. B Biol. Sci. 2018, 373, 20170411. [Google Scholar] [CrossRef] [PubMed]
  73. Anderson, L.O.; Aragão, L.; Gloor, M.; Arai, E.; Adami, M.; Saatchi, S.S.; Malhi, Y.; Shimabukuro, Y.E.; Barlow, J.; Berenguer, E.; et al. Disentangling the contribution of multiple land covers to fire-mediated carbon emissions in Amazonia during the 2010 drought. Glob. Biogeochem. Cycles 2015, 29, 1739–1753. [Google Scholar] [CrossRef] [Green Version]
  74. Funk, C.; Peterson, P.; Landsfeld, M.; Pedreros, D.; Verdin, J.; Shukla, S.; Husak, G.; Rowland, J.; Harrison, L.; Hoell, A.; et al. The climate hazards infrared precipitation with stations—a new environmental record for monitoring extremes. Sci. Data 2015, 2, 150066. [Google Scholar] [CrossRef] [PubMed] [Green Version]
  75. Chéret, V.; Denux, J.P. Mapping wildfire danger at regional scale with an index model integrating coarse spatial resolution remote sensing data. J. Geophys. Res. Space Phys. 2007, 112. [Google Scholar] [CrossRef] [Green Version]
  76. de Almeida, D.R.A.; Nelson, B.W.; Schietti, J.; Gorgens, E.; Resende, A.; Stark, S.C.; Valbuena, R. Contrasting fire damage and fire susceptibility between seasonally flooded forest and upland forest in the Central Amazon using portable profiling LiDAR. Remote Sens. Environ. 2016, 184, 153–160. [Google Scholar] [CrossRef]
  77. Flores, B.M.; Holmgren, M.; Xu, C.; Van Nes, E.H.; Jakovac, C.C.; Mesquita, R.C.G.; Scheffer, M. Floodplains as an Achilles’ heel of Amazonian forest resilience. Proc. Natl. Acad. Sci. USA 2017, 114, 4442–4446. [Google Scholar] [CrossRef] [Green Version]
  78. van Wees, D.; van der Werf, G.R.; Randerson, J.T.; Andela, N.; Chen, Y.; Morton, D.C. The role of fire in global forest loss dynamics. Glob. Chang. Biol. 2021, 27, 2377–2391. [Google Scholar] [CrossRef] [PubMed]
  79. van der Werf, G.R.; Morton, D.C.; DeFries, R.S.; Giglio, L.; Randerson, J.T.; Collatz, G.J.; Kasibhatla, P.S. Estimates of fire emissions from an active deforestation region in the southern Amazon based on satellite data and biogeochemical modelling. Biogeosciences 2009, 6, 235–249. [Google Scholar] [CrossRef] [Green Version]
  80. Ichoku, C.; Kahn, R.; Chin, M. Satellite contributions to the quantitative characterization of biomass burning for climate modeling. Atmos. Res. 2012, 111, 1–28. [Google Scholar] [CrossRef] [Green Version]
  81. Schroeder, W.; Prins, E.; Giglio, L.; Csiszar, I.; Schmidt, C.; Morisette, J.; Morton, D. Validation of GOES and MODIS active fire detection products using ASTER and ETM+ data. Remote Sens. Environ. 2008, 112, 2711–2726. [Google Scholar] [CrossRef]
  82. Liu, T.; Mickley, L.J.; Marlier, M.E.; DeFries, R.S.; Khan, M.F.; Latif, M.T.; Karambelas, A. Diagnosing spatial biases and uncertainties in global fire emissions inventories: Indonesia as regional case study. Remote Sens. Environ. 2020, 237, 111557. [Google Scholar] [CrossRef]
  83. Wang, J.; Yue, Y.; Wang, Y.; Ichoku, C.; Ellison, L.; Zeng, J. Mitigating Satellite-Based Fire Sampling Limitations in Deriving Biomass Burning Emission Rates: Application to WRF-Chem Model Over the Northern sub-Saharan African Region. J. Geophys. Res. Atmos. 2018, 123, 507–528. [Google Scholar] [CrossRef] [Green Version]
  84. Li, F.; Zhang, X.; Kondragunta, S. Biomass Burning in Africa: An Investigation of Fire Radiative Power Missed by MODIS Using the 375 m VIIRS Active Fire Product. Remote Sens. 2020, 12, 1561. [Google Scholar] [CrossRef]
  85. Hyer, E.J.; Reid, J.S. Baseline uncertainties in biomass burning emission models resulting from spatial error in satellite active fire location data. Geophys. Res. Lett. 2009, 36. [Google Scholar] [CrossRef]
  86. Vernooij, R.; Giongo, M.; Borges, M.A.; Costa, M.M.; Barradas, A.C.S.; van der Werf, G.R. Intraseasonal variability of greenhouse gas emission factors from biomass burning in the Brazilian Cerrado. Biogeosciences 2021, 18, 1375–1393. [Google Scholar] [CrossRef]
  87. Stark, S.C.; Breshears, D.D.; Aragón, S.; Villegas, J.C.; Law, D.J.; Smith, M.N.; Minor, D.M.; De Assis, R.L.; De Almeida, D.R.A.; De Oliveira, G.; et al. Reframing tropical savannization: Linking changes in canopy structure to energy balance alterations that impact climate. Ecosphere 2020, 11, e03231. [Google Scholar] [CrossRef]
  88. Wiggins, E.B.; Soja, A.J.; Gargulinski, E.; Halliday, H.S.; Pierce, R.B.; Schmidt, C.C.; Nowak, J.B.; DiGangi, J.P.; Diskin, G.S.; Katich, J.M.; et al. High Temporal Resolution Satellite Observations of Fire Radiative Power Reveal Link Between Fire Behavior and Aerosol and Gas Emissions. Geophys. Res. Lett. 2020, 47. [Google Scholar] [CrossRef]
Figure 1. Spatial location of Amazonia and the 17 countries/states considered in this study. The base map is a Moderate Resolution Imaging Spectroradiometer (MODIS) MOD09A1 product color composite R6G2B1 for the year 2019. BO = Bolivia, CO = Colombia, EC = Ecuador, FG = French Guiana, GU = Guiana, PE = Peru, SU = Suriname, VE = Venezuela, AC = Acre, AM = Amazonas, AP = Amapá, MA = Maranhão, MT = Mato Grosso, RO = Rondônia, RR = Roraima, PA = Pará and TO = Tocantins.
Forests 12 01217 g001
Figure 2. (a) Annual average of PM2.5 (kg m−2 year−1) emitted from biomass burning in Amazonia during 2002–2020; estimates were obtained using the 3BEM_FRP model, and (b) accumulated deforestation (km2) from 2002 to 2018 in Amazonia; estimates were based on MapBiomas Amazonia Collection 2.0. Both estimates considered the spatial resolution of 0.1°. Zero emission or deforestation grid cells are shown in white. BO = Bolivia, CO = Colombia, EC = Ecuador, FG = French Guiana, GU = Guiana, PE = Peru, SU = Suriname, VE = Venezuela, AC = Acre, AM = Amazonas, AP = Amapá, MA = Maranhão, MT = Mato Grosso, RO = Rondônia, RR = Roraima, PA = Pará and TO = Tocantins.
Forests 12 01217 g002
Figure 3. (a) Annual total PM2.5 emitted from biomass burning (Gg) in Amazonia and in its 17 countries/states during 2002–2020; estimates were obtained using the 3BEM_FRP model, and (b) annual deforestation (km2) in Amazonia and in its 17 countries/states during 2002–2018; estimates were based on MapBiomas Amazonia Collection 2.0.
Forests 12 01217 g003aForests 12 01217 g003b
Figure 4. Significance of the correlation between PM2.5 emitted from biomass burning and deforestation in the Amazonian countries/states. The significance of correlations was tested using the Student t-test with significance level of 5%. BO = Bolivia, CO = Colombia, EC = Ecuador, FG = French Guiana, GU = Guiana, PE = Peru, SU = Suriname, VE = Venezuela, AC = Acre, AM = Amazonas, AP = Amapá, MA = Maranhão, MT = Mato Grosso, RO = Rondônia, RR = Roraima, PA = Pará and TO = Tocantins.
Forests 12 01217 g004
Figure 5. Pearson’s correlation coefficient between the pair of variables PM2.5 emitted from biomass burning and deforestation in Amazonia. We have considered annual estimates during 2002–2018. Only statistically significant pixels are shown in this figure (18% of Amazonia). BO = Bolivia, CO = Colombia, EC = Ecuador, FG = French Guiana, GU = Guiana, PE = Peru, SU = Suriname, VE = Venezuela, AC = Acre, AM = Amazonas, AP = Amapá, MA = Maranhão, MT = Mato Grosso, RO = Rondônia, RR = Roraima, PA = Pará and TO = Tocantins.
Forests 12 01217 g005
Figure 6. Spatial distribution of Land Use and Land Cover categorized by the MapBiomas Amazonia dataset Collection 2.0 in Amazonia for the year 2018. BO = Bolivia, CO = Colombia, EC = Ecuador, FG = French Guiana, GU = Guiana, PE = Peru, SU = Suriname, VE = Venezuela, AC = Acre, AM = Amazonas, AP = Amapá, MA = Maranhão, MT = Mato Grosso, RO = Rondônia, RR = Roraima, PA = Pará and TO = Tocantins.
Forests 12 01217 g006
Figure 7. Quantification of Land Use and Land Cover defined by the MapBiomas Amazonia dataset Collection 2.0 in Amazonia and in its 17 countries/states for the year 2018.
Forests 12 01217 g007
Table 1. Pearson’s correlation coefficient (R) between annual PM2.5 emitted from biomass burning and annual deforestation in Amazonia and in its 17 countries/states. The considered time period was 2002–2018. Statistically significant cases (p < 0.05, Student t-test) are shown in blue and non-statistically significant cases in red. BO = Bolivia, CO = Colombia, EC = Ecuador, FG = French Guiana, GU = Guiana, PE = Peru, SU = Suriname, VE = Venezuela, AC = Acre, AM = Amazonas, AP = Amapá, MA = Maranhão, MT = Mato Grosso, RO = Rondônia, RR = Roraima, PA = Pará and TO = Tocantins.
Pair of
Varibles
AmazoniaVESUPEFGGUECCOBOTORRROPAMTMAAMAPAC
PM2.5x
Deforestation
0.65−0.150.630.350.540.44−0.160.190.27−0.140.540.740.530.85−0.110.55−0.110.41
Publisher’s Note: MDPI stays neutral with regard to jurisdictional claims in published maps and institutional affiliations.

