
Influence of Simulated Nitrogen Deposition on the Soil Seed Bank of a Subtropical Evergreen Broadleaved Forest


Abstract
:1. Introduction
2. Materials and Methods
2.1. Study Site
2.2. Experimental Design and Sampling
2.3. Data Analysis
3. Results
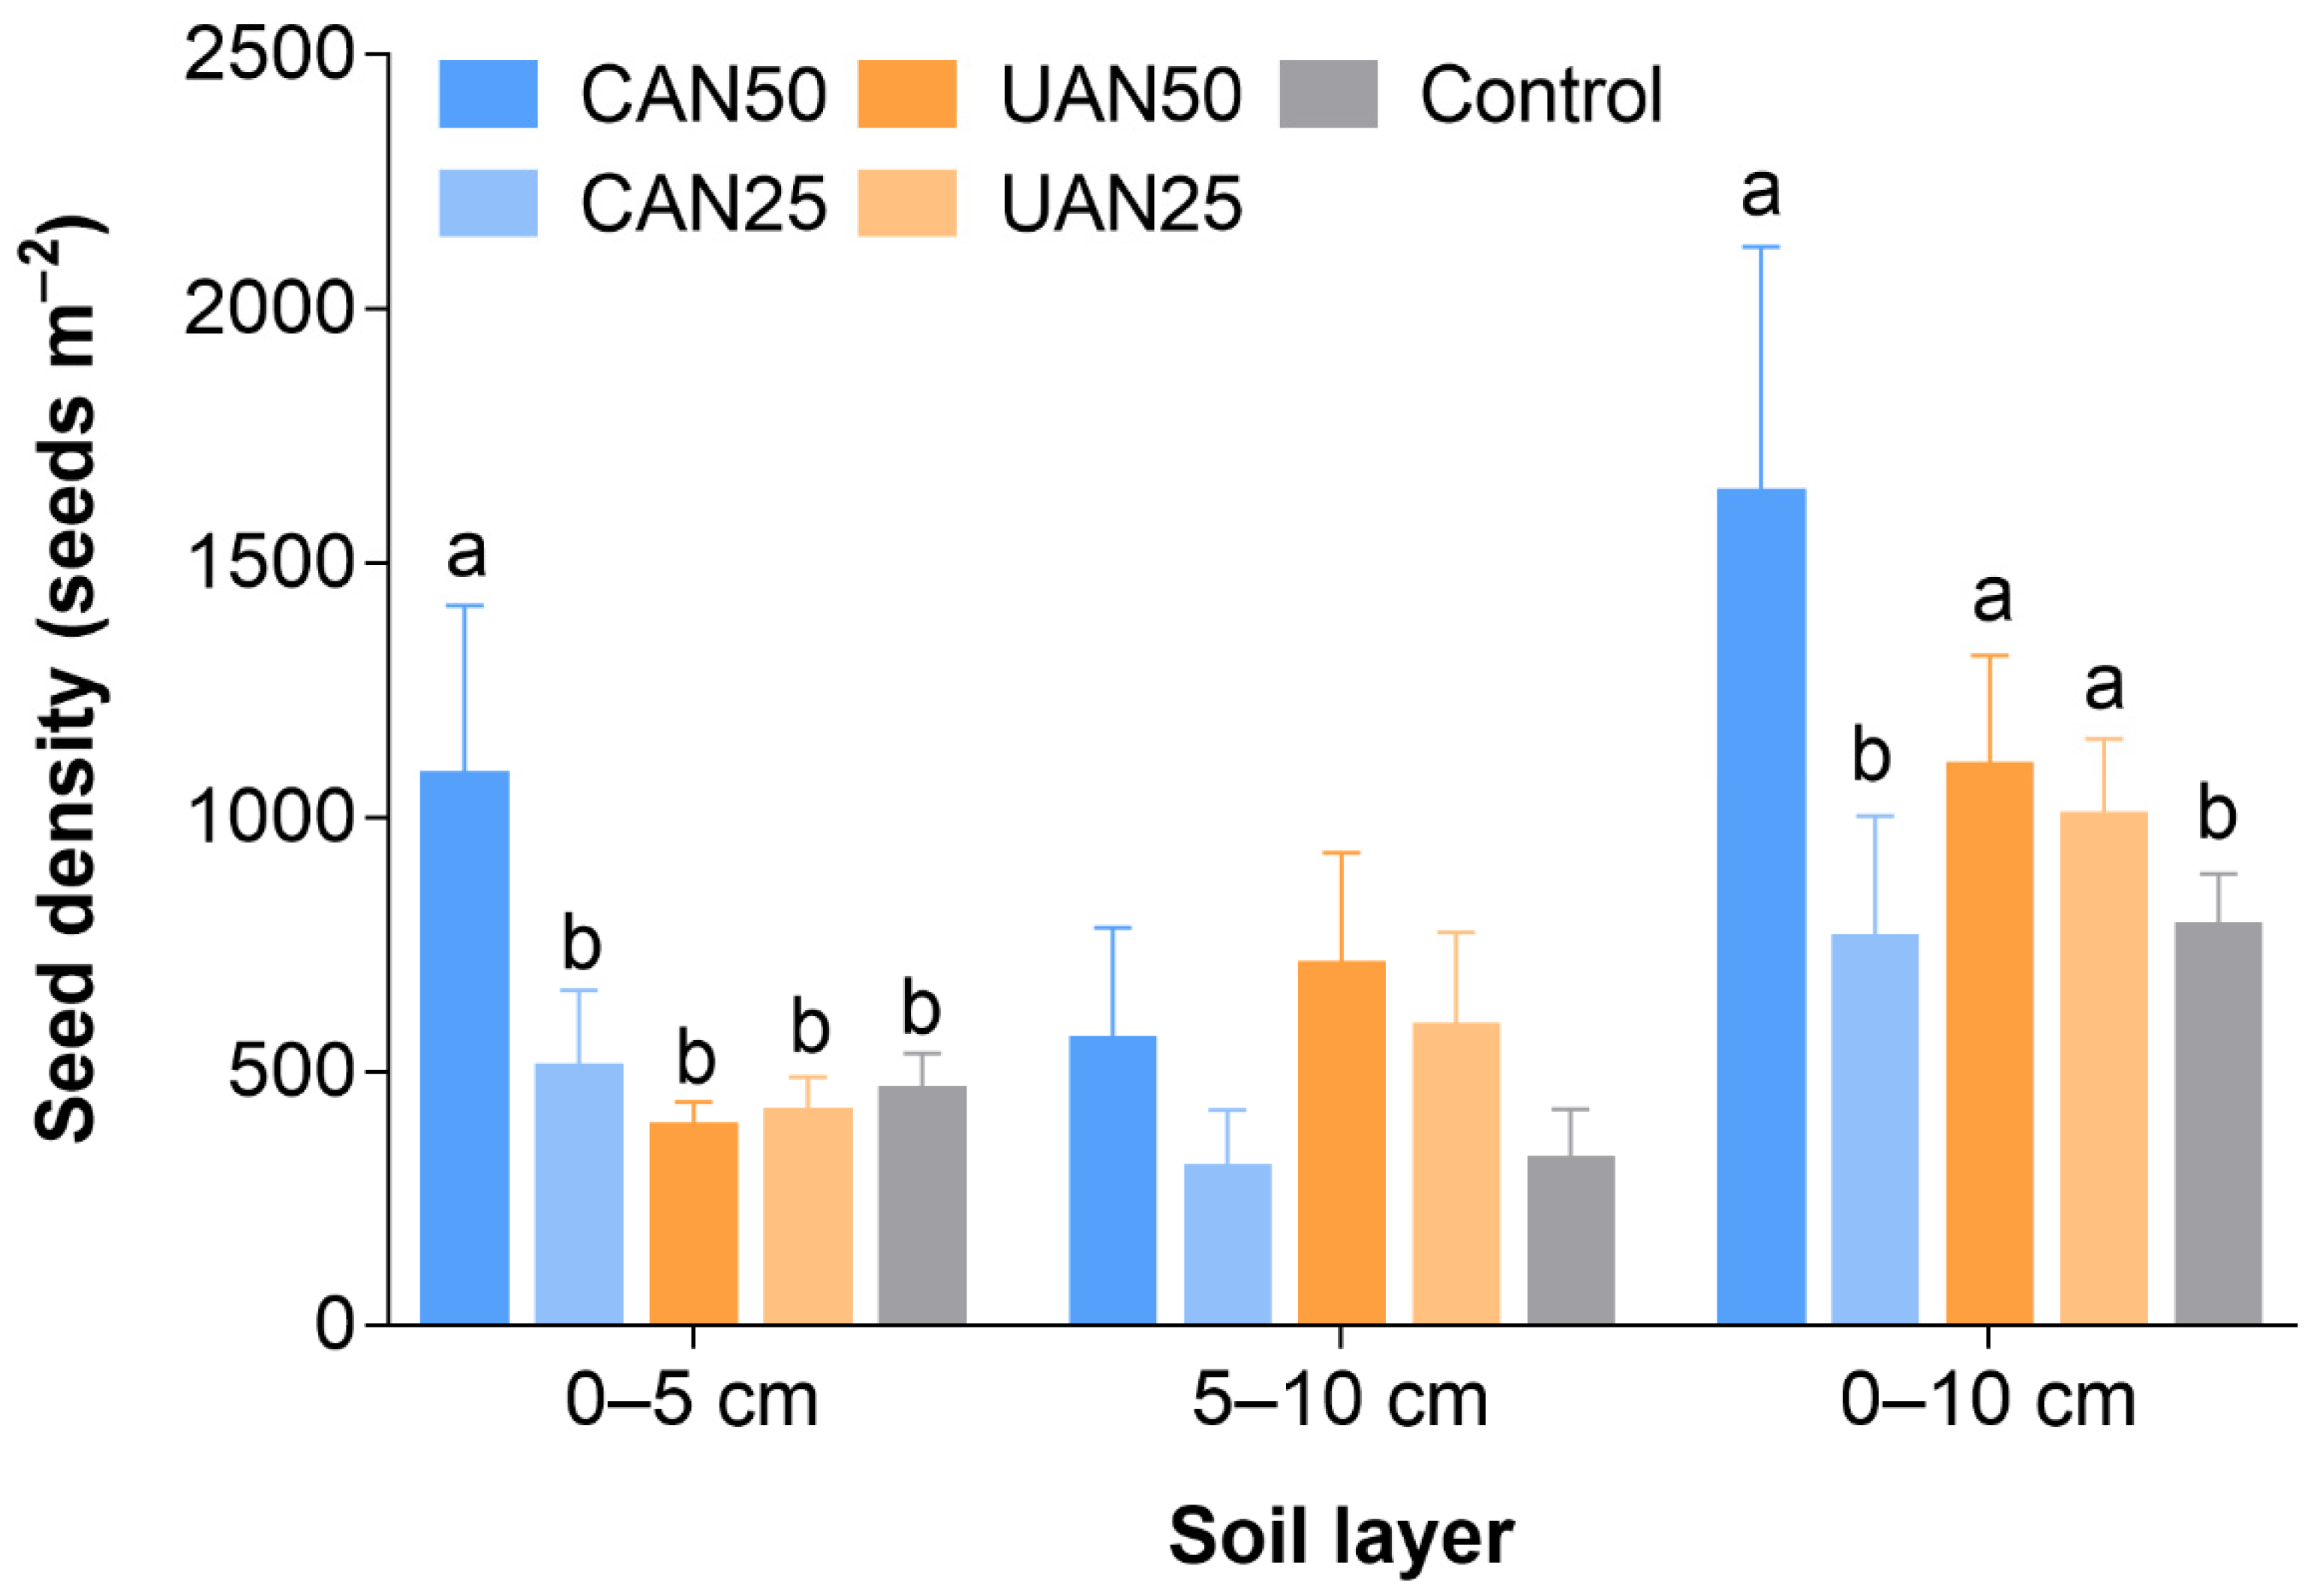
3.1. Seed Density
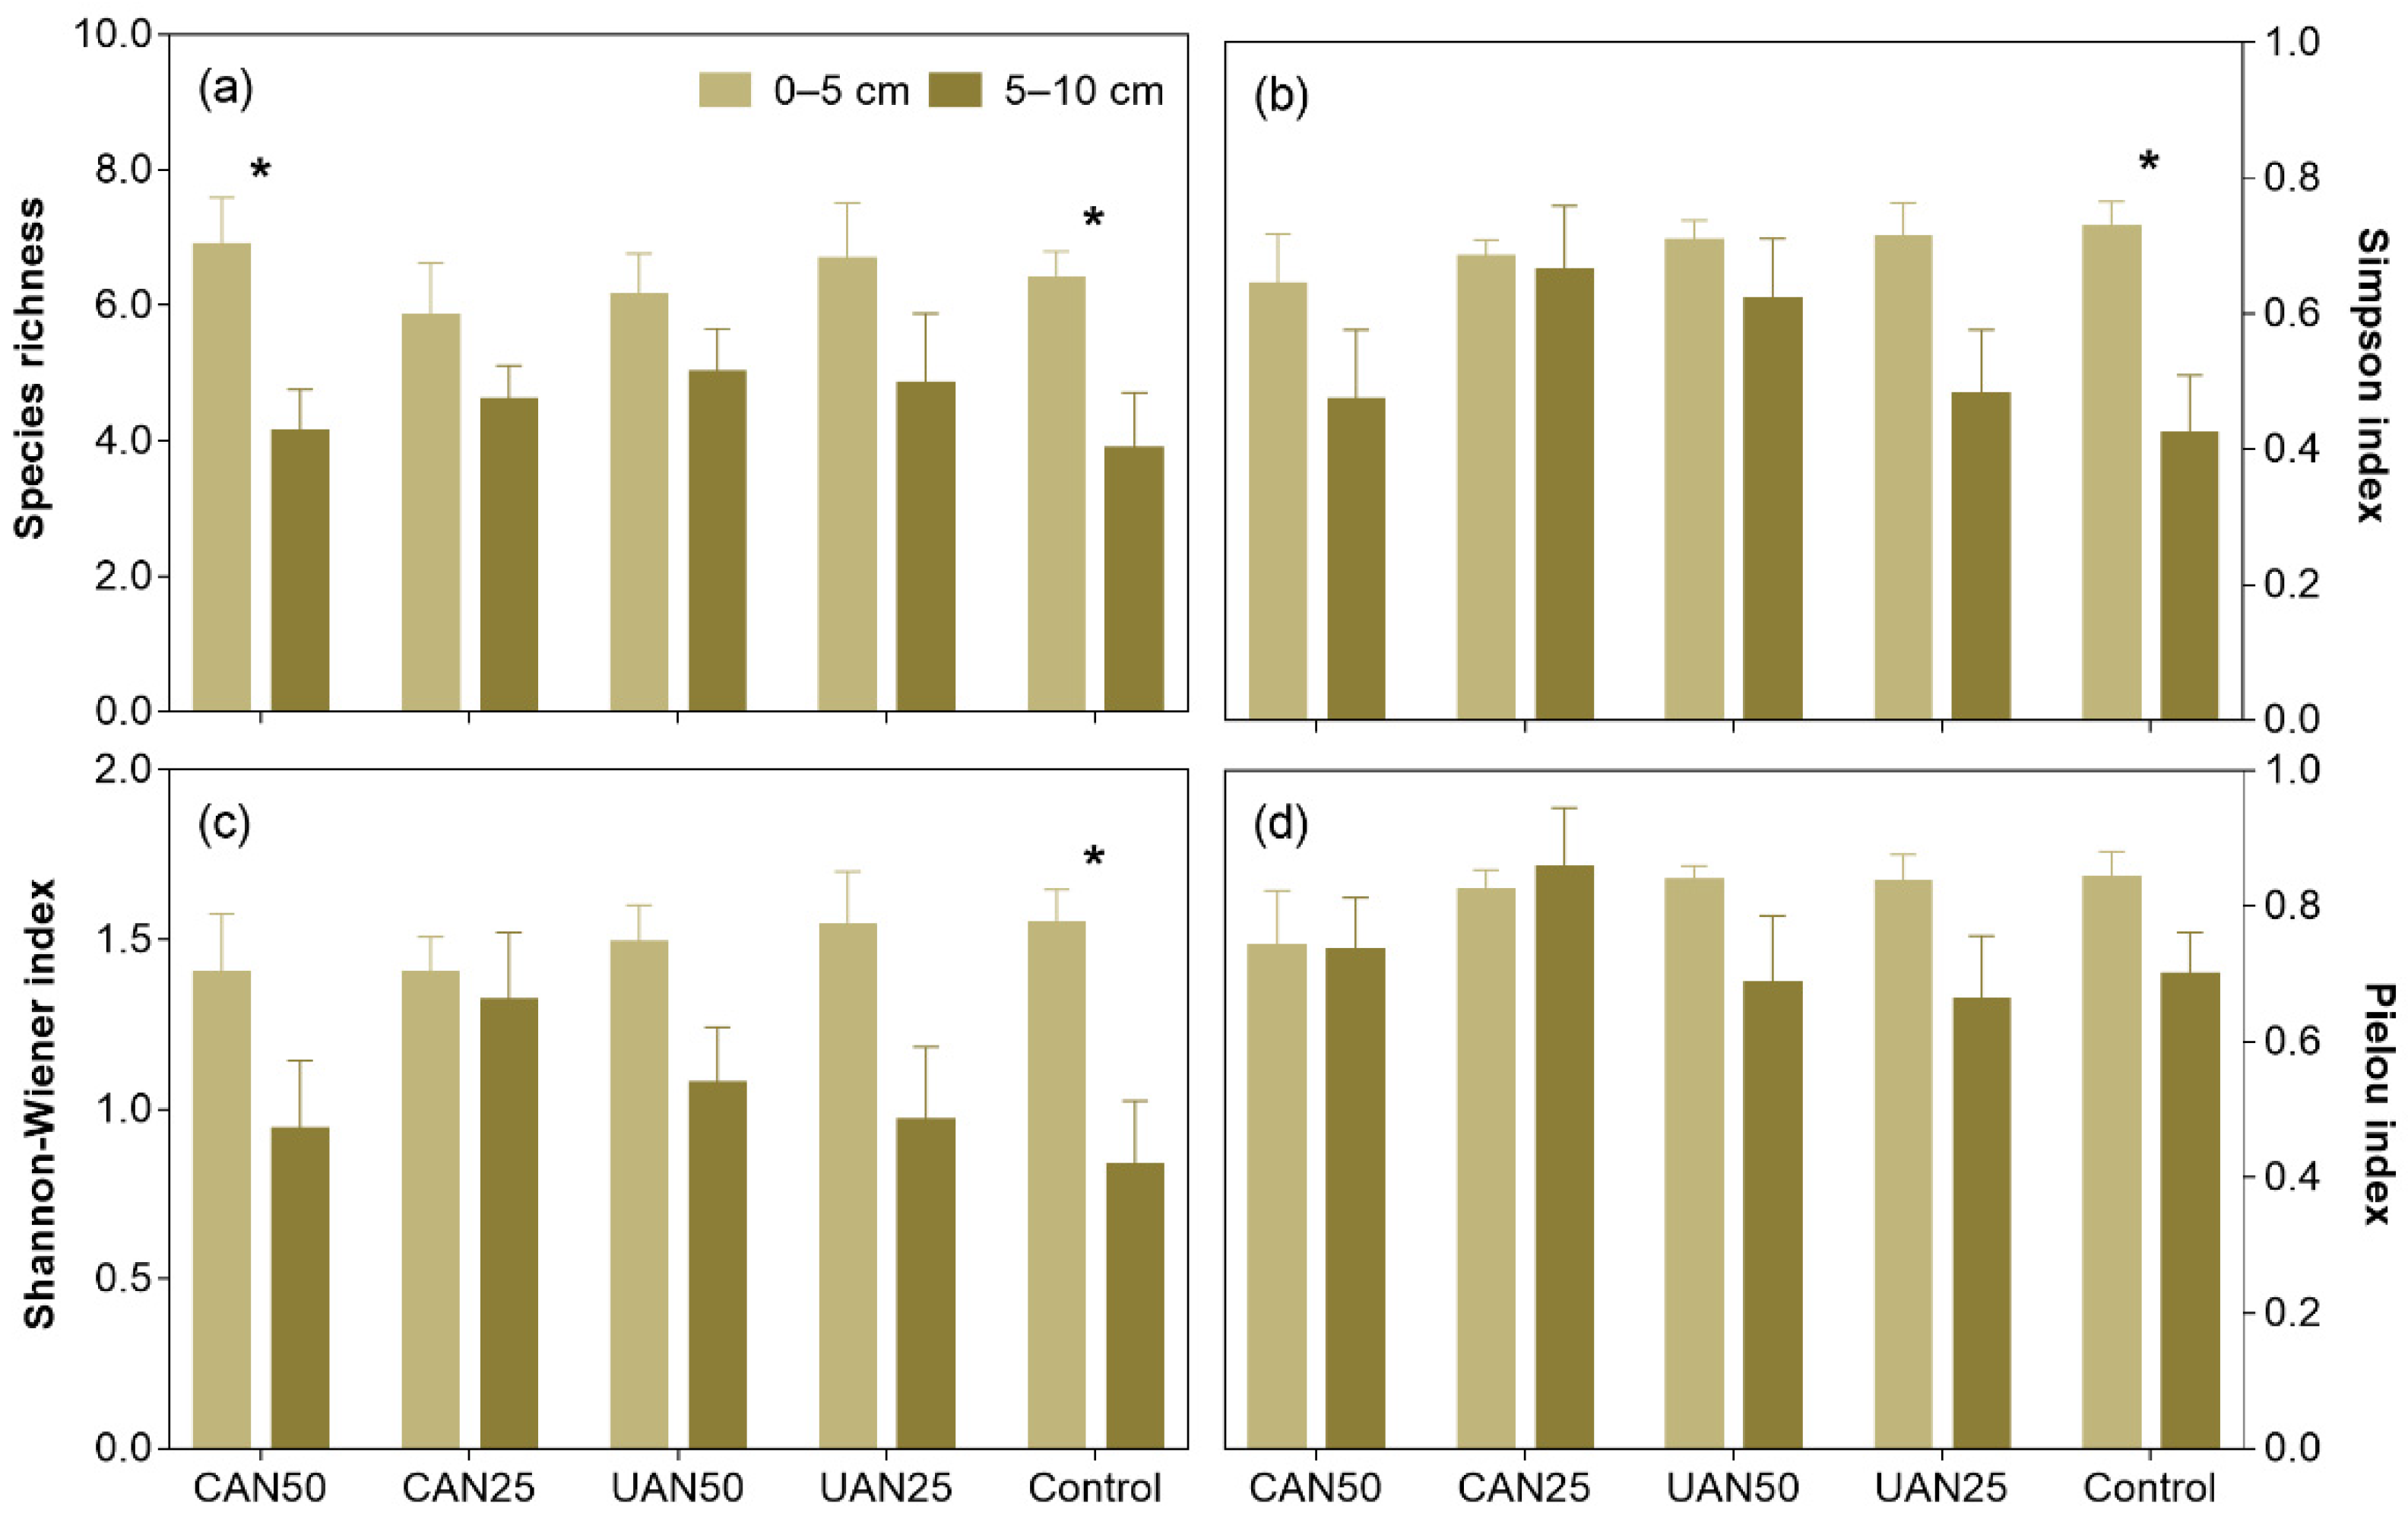
3.2. Species Richness and Diversity
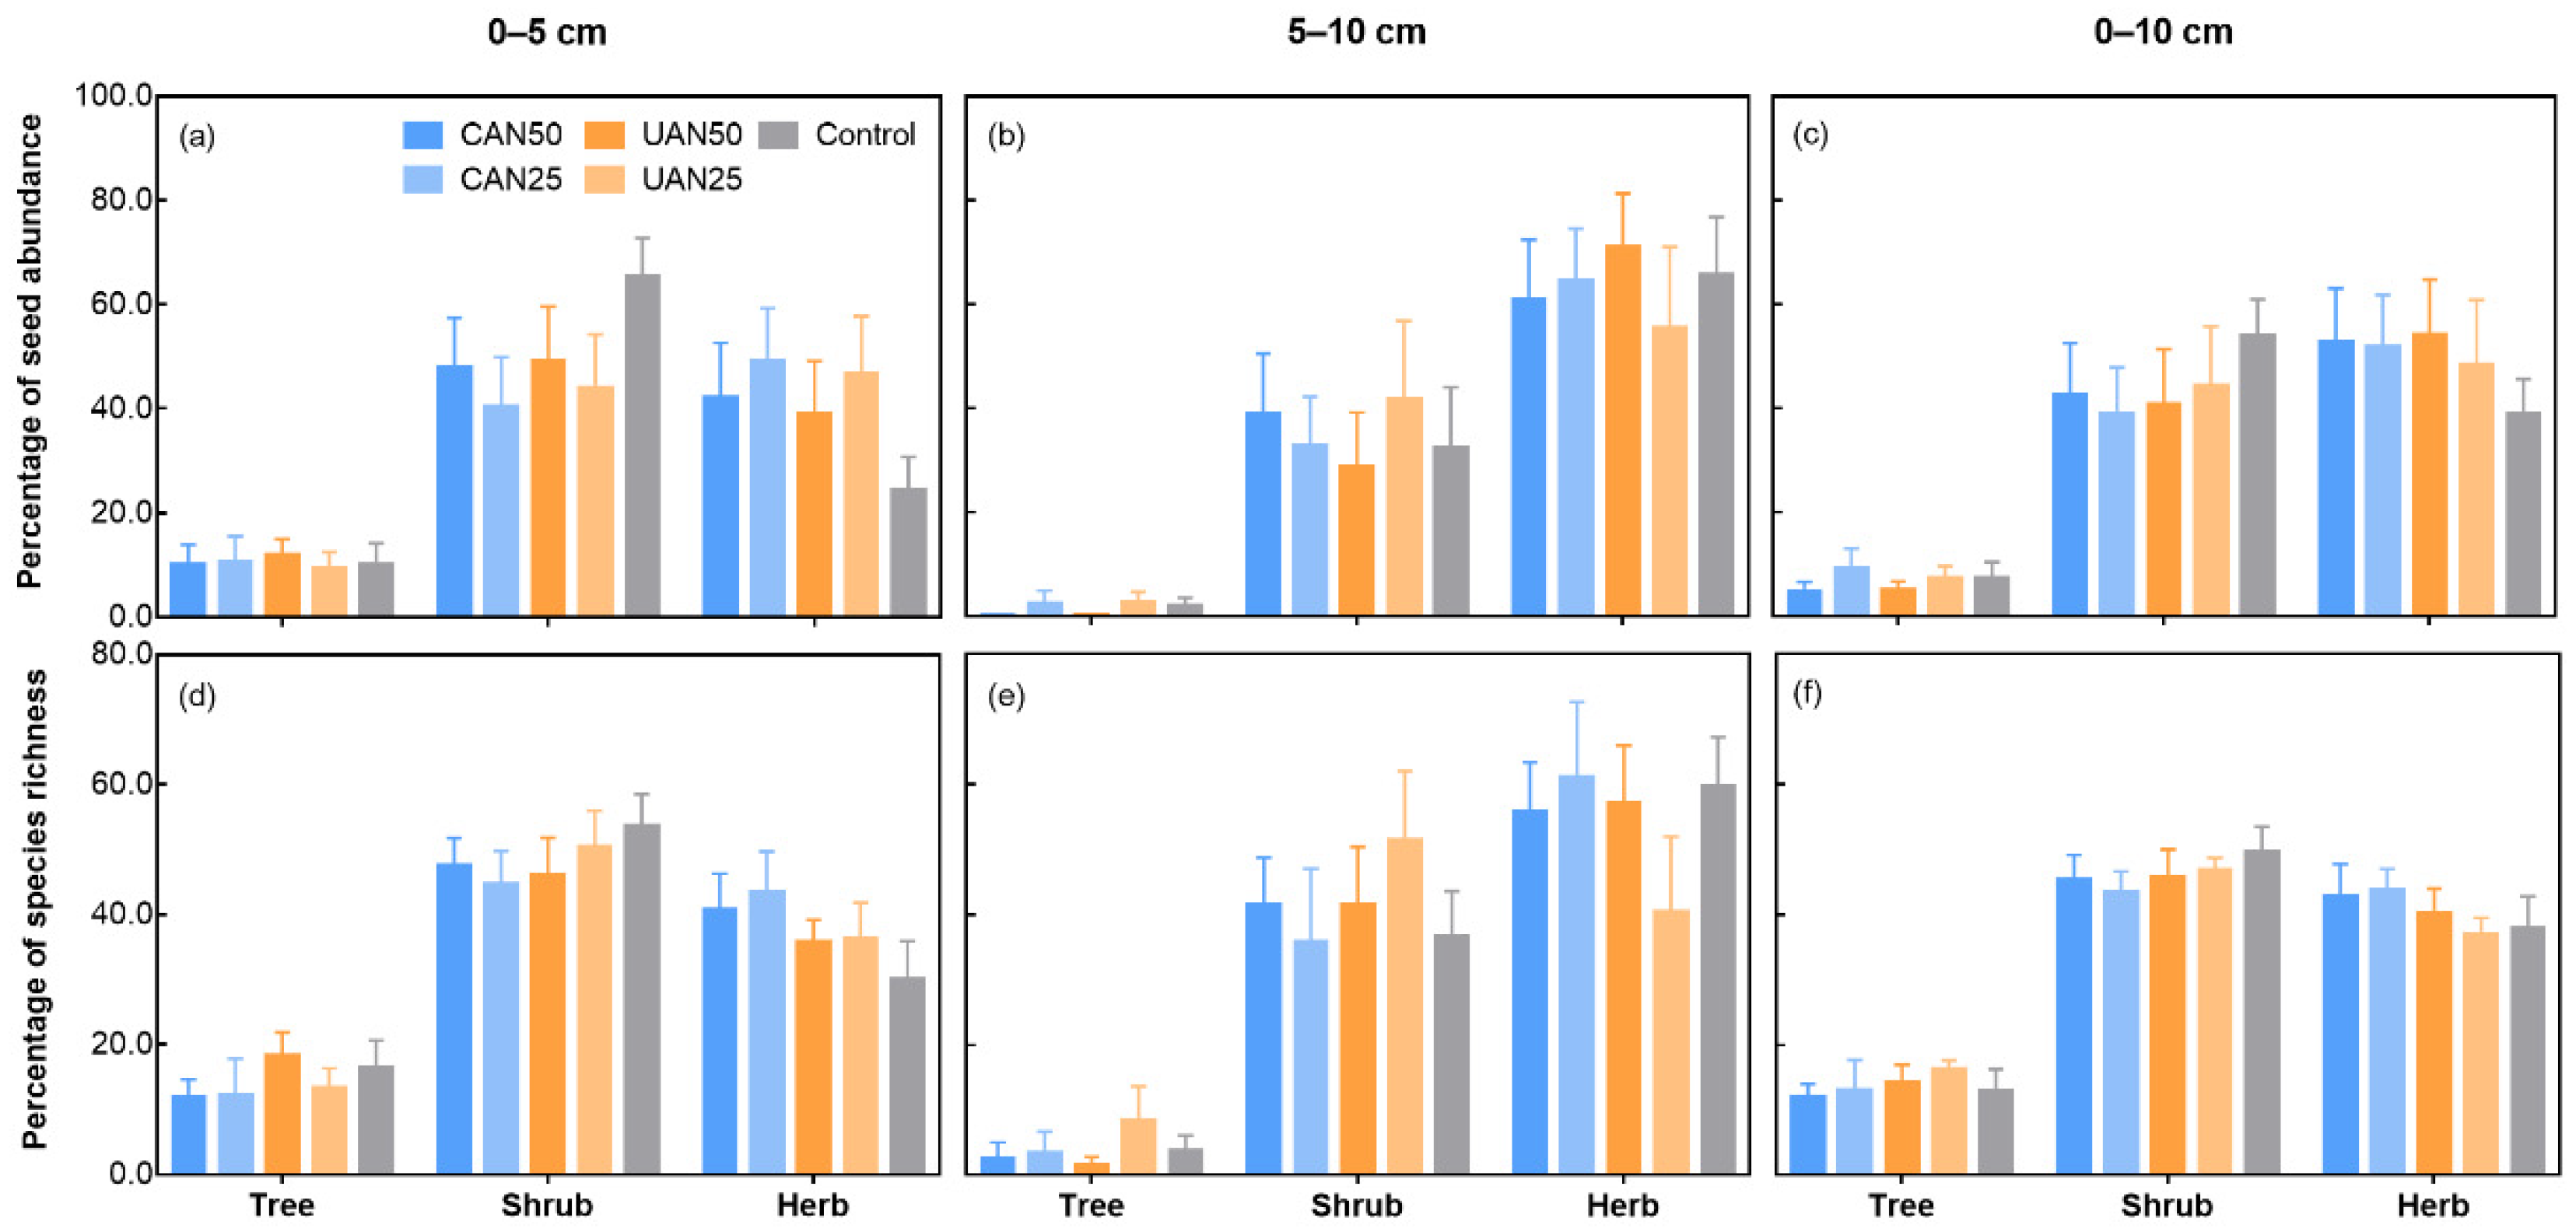
3.3. Taxonomic and Functional Composition
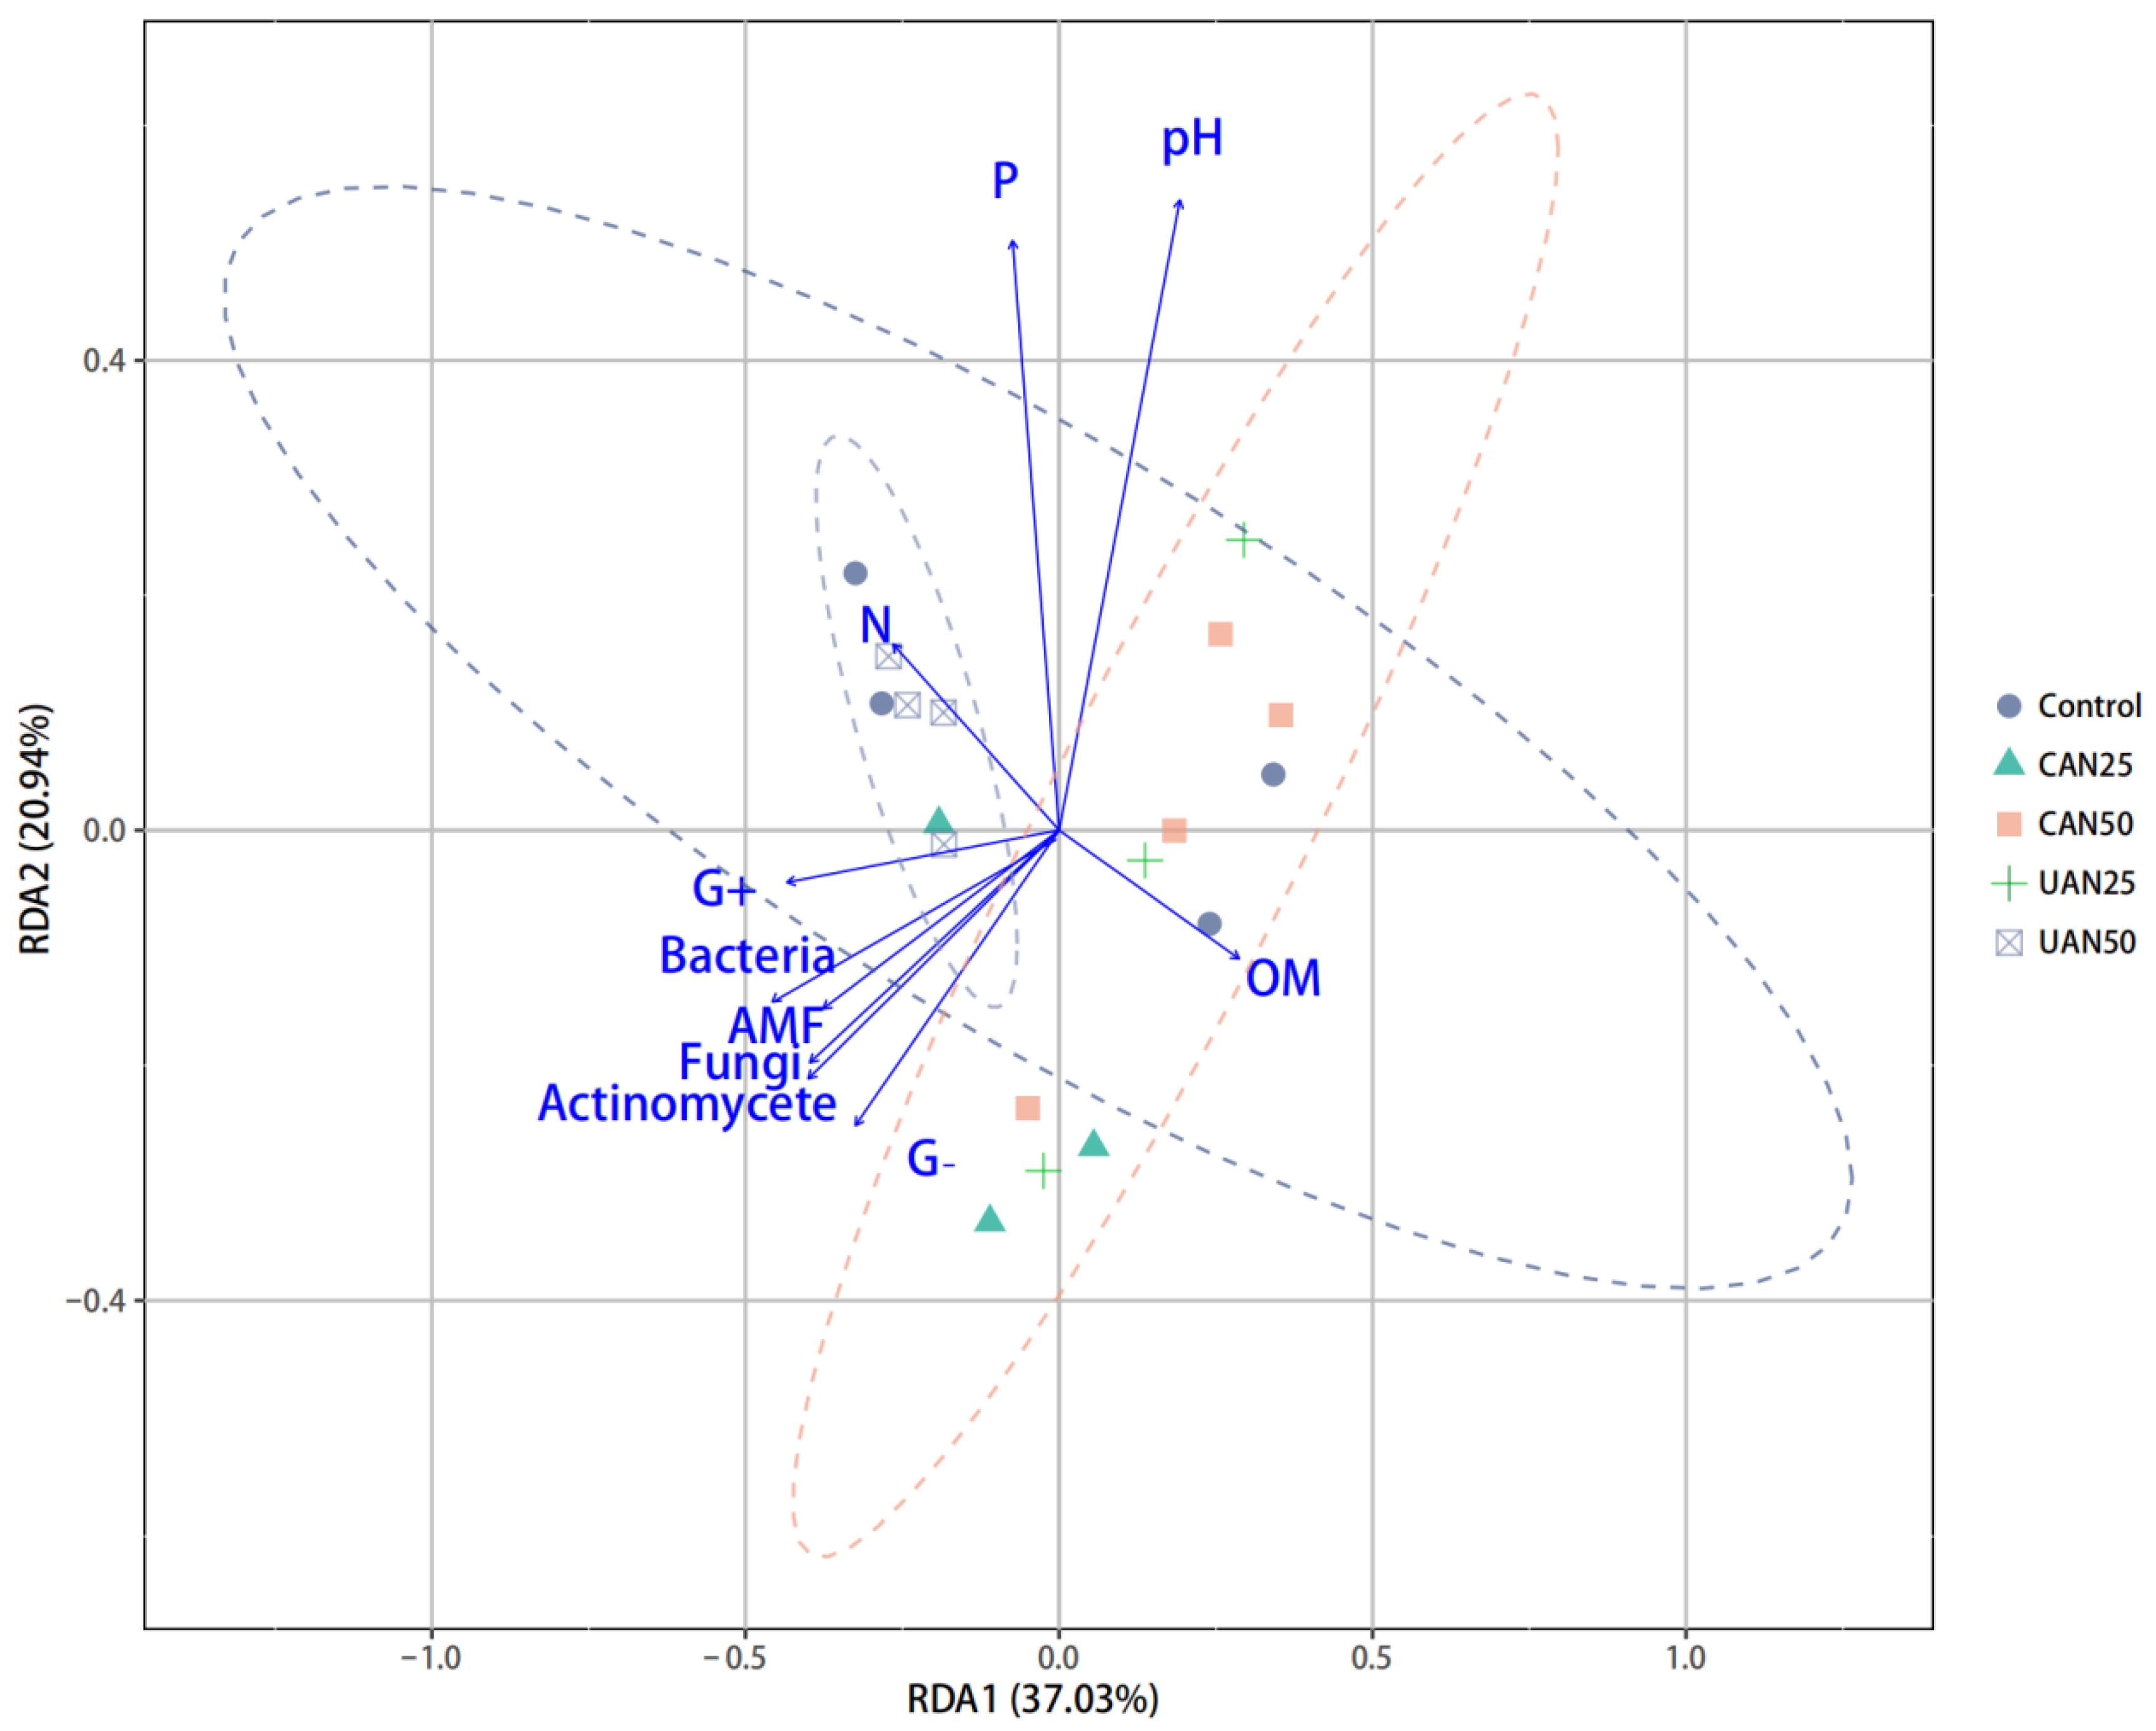
3.4. Relationship between Seed Bank Composition and Soil Chemical and Microbial Properties
4. Discussion
5. Conclusions
Author Contributions
Funding
Institutional Review Board Statement
Informed Consent Statement
Data Availability Statement
Acknowledgments
Conflicts of Interest
References
- Gruber, N.; Galloway, J.N. An Earth-system perspective of the global nitrogen cycle. Nature 2008, 451, 293–296. [Google Scholar] [CrossRef]
- Fowler, D.; Coyle, M.; Skiba, U.; Sutton, M.A.; Cape, J.N.; Reis, S.; Sheppard, L.J.; Jenkins, A.; Grizzetti, B.; Galloway, J.N.; et al. The global nitrogen cycle in the twenty-first century. Philos. Trans. R. Soc. B 2013, 368, 20130164. [Google Scholar] [CrossRef]
- Phoenix, G.K.; Emmett, B.A.; Britton, A.J.; Caporn, S.J.M.; Dise, N.B.; Helliwell, R.; Jones, L.; Leake, J.R.; Leith, I.D.; Sheppard, L.J.; et al. Impacts of atmospheric nitrogen deposition: Responses of multiple plant and soil parameters across contrasting ecosystems in long-term field experiments. Glob. Chang. Biol. 2012, 18, 1197–1215. [Google Scholar] [CrossRef]
- Steffen, W.; Richardson, K.; Rockstrom, J.; Cornell, S.E.; Fetzer, I.; Bennett, E.M.; Biggs, R.; Carpenter, S.R.; de Vries, W.; de Wit, C.A.; et al. Planetary boundaries: Guiding human development on a changing planet. Science 2015, 347, 1259855. [Google Scholar] [CrossRef] [Green Version]
- WallisDeVries, M.F.; Bobbink, R. Nitrogen deposition impacts on biodiversity in terrestrial ecosystems: Mechanisms and perspectives for restoration. Biol. Conserv. 2017, 212, 387–389. [Google Scholar] [CrossRef]
- Robbink, R.; Hicks, K.; Galloway, J.; Spranger, T.; Alkemade, R.; Ashmore, M.; Bustamante, M.; Cinderby, S.; Davidson, E.; Emmett, B.; et al. Global assessment of nitrogen deposition effects on terrestrial plant diversity: A synthesis. Ecol. Appl. 2010, 20, 30–59. [Google Scholar] [CrossRef] [Green Version]
- Lu, X.K.; Mo, J.M.; Gilliam, F.S.; Zhou, G.Y.; Fang, Y.T. Effects of experimental nitrogen additions on plant diversity in an old-growth tropical forest. Glob. Chang. Biol. 2010, 16, 2688–2700. [Google Scholar] [CrossRef] [Green Version]
- Clark, C.M.; Morefield, P.E.; Gilliam, F.S.; Pardo, L.H. Estimated losses of plant biodiversity in the United States from historical N deposition (1985–2010). Ecology 2013, 94, 1141–1448. [Google Scholar] [CrossRef] [Green Version]
- Payne, R.J.; Dise, N.B.; Field, C.D.; Dore, A.J.; Caporn, S.J.M.; Stevens, C.J. Nitrogen deposition and plant biodiversity: Past, present, and future. Front. Ecol. Environ. 2017, 15, 431–436. [Google Scholar] [CrossRef]
- Patterson, S.L.; Zak, D.R.; Burton, A.J.; Talhelm, A.F.; Pregitzer, K.S. Simulated N deposition negatively impacts sugar maple regeneration in a northern hardwood ecosystem. J. Appl. Ecol. 2012, 19, 155–163. [Google Scholar] [CrossRef] [Green Version]
- BassiriRad, H.; Lussenhop, J.F.; Sehtiya, H.L.; Borden, K.K. Nitrogen deposition potentially contributes to oak regeneration failure in the Midwestern temperate forests of the USA. Oecologia 2015, 177, 53–63. [Google Scholar] [CrossRef]
- Tompson, K. The functional ecology of soil seed banks. In Seeds: The Ecology of Regeneration in Plant Communities; Fenner, M., Ed.; CABI Publishing: Wallingford, UK, 2000; pp. 215–235. [Google Scholar]
- Wang, J.; Ren, H.; Yang, L.; Li, D.Y.; Guo, Q.F. Soil seed banks in four 22-year-old plantations in South China: Implications for restoration. For. Ecol. Manag. 2009, 258, 2000–2006. [Google Scholar] [CrossRef]
- Kiss, R.; Deák, B.; Török, P.; Tóthmérész, B.; Valkó, O. Grassland seed bank and community resilience in a changing climate. Restor. Ecol. 2018, 26, S141–S150. [Google Scholar] [CrossRef]
- Roovers, P.; Bossuyt, B.; Igodt, B.; Hermy, M. May seed banks contribute to vegetation restoration on paths in temperate deciduous forest. Plant Ecol. 2006, 187, 25–38. [Google Scholar] [CrossRef]
- Wang, J.; Huang, L.J.; Ren, H.; Sun, Z.Y.; Guo, Q.F. Regenerative potential and functional composition of soil seed banks in remnant evergreen broad-leaved forests under urbanization in South China. Community Ecol. 2015, 16, 86–94. [Google Scholar] [CrossRef] [Green Version]
- Cofer, T.M.; Elliott, K.J.; Bush, J.K.; Miniat, C.F. Rhododendron maximum impacts seed bank composition and richness following Tsuga canadensis loss in riparian forests. Ecosphere 2018, 9, e02204. [Google Scholar] [CrossRef]
- Neto, A.M.; Martins, S.V.; Silva, K.D. Plantlet rescue in a soil seed bank to produce forest species seedlings. Ecol. Eng. 2019, 132, 94–101. [Google Scholar] [CrossRef]
- Figueroa, J.A.; Teillier, S.; Jaksic, F.M. Composition, size and dynamics of the seed bank in a mediterranean shrubland of Chile. Austral Ecol. 2004, 29, 574–584. [Google Scholar] [CrossRef]
- Moreno-de las Heras, M.; Turnbull, L.; Wainwright, J. Seed-bank structure and plant-recruitment conditions regulate the dynamics of a grassland-shrubland Chihuahuan ecotone. Ecology 2016, 97, 2303–2318. [Google Scholar] [CrossRef] [PubMed] [Green Version]
- Godefroid, S.; Pajolec, S.L.; Hechelski, M.; Van Rossum, F. Can we rely on the soil seed bank for restoring xeric sandy calcareous grasslands. Restor. Ecol. 2018, 26, S123–S133. [Google Scholar] [CrossRef]
- Wagner, M.; Mitschunas, N. Fungal effects on seed bank persistence and potential applications in weed biocontrol: A review. Basic Appl. Ecol. 2008, 9, 191–203. [Google Scholar] [CrossRef]
- Ochoa-Hueso, R.; Manrique, E. Nitrogen fertilization and water supply affect germination and plant establishment of the soil seed bank present in a semi-arid Mediterranean scrubland. Plant Ecol. 2010, 210, 263–273. [Google Scholar] [CrossRef]
- Jabot, F.; Pottier, J. Macroecology of seed banks: The role of biogeography, environmental stochasticity and sampling. Glob. Ecol. Biogeogr. 2017, 26, 1247–1257. [Google Scholar] [CrossRef] [Green Version]
- Royo, A.A.; Ristau, T.E. Stochastic and deterministic processes regulate spatio-temporal variation in seed bank diversity. J. Veg. Sci. 2012, 24, 724–734. [Google Scholar] [CrossRef] [Green Version]
- Wagner, M.; Walker, K.J.; Pywell, R.F. Seed bank dynamics in restored grassland following the sowing of high- and low-diversity seed mixtures. Restor. Ecol. 2018, 26, S189–S199. [Google Scholar] [CrossRef] [Green Version]
- Plue, J.; Van Calster, H.; Auestad, I.; Basto, S.; Bekker, R.M.; Bruun, H.H.; Chevalier, R.; Decocq, G.; Grandin, U.; Hermy, M.; et al. Buffering effects of soil seed banks on plant community composition in response to land use and climate. Glob. Ecol. Biogeogr. 2021, 30, 128–139. [Google Scholar] [CrossRef]
- Plassmann, K.; Brown, N.; Jones, M.L.M.; Edwards-Jones, G. Can atmospheric input of nitrogen affect seed bank dynamics in habitats of conservation interest? The case of dune slacks. Appl. Veg. Sci. 2008, 11, 413–420. [Google Scholar] [CrossRef]
- Zhong, M.X.; Miao, Y.; Han, S.J.; Wang, D. Nitrogen addition decreases seed germination in a temperate steppe. Ecol. Evol. 2019, 9, 8441–8449. [Google Scholar] [CrossRef] [PubMed]
- Basto, S.; Thompson, K.; Phoenix, G.; Sloan, V.; Leake, J.; Rees, M. Long-term nitrogen deposition depletes grassland seed banks. Nat. Commun. 2015, 6, 6185. [Google Scholar] [CrossRef] [PubMed] [Green Version]
- Pan, J.F.; Zhang, L.G.; Wang, L.; Fu, S.L. Effects of long-term fertilization treatments on the weed seed bank in a wheat-soybean rotation system. Glob. Ecol. Conserv. 2020, 21, e00870. [Google Scholar] [CrossRef]
- Schneider, H.E.; Allen, E.B. Effects of elevated nitrogen and exotic plant invasion on soil seed bank composition in Joshua Tree National Park. Plant Ecol. 2012, 213, 1277–1287. [Google Scholar] [CrossRef]
- Liu, X.J.; Zhang, Y.; Han, W.X.; Tang, A.H.; Shen, J.L.; Cui, Z.L.; Vitousek, P.; Erisman, J.W.; Goulding, K.; Christie, P.; et al. Enhanced nitrogen deposition over China. Nature 2013, 494, 459–463. [Google Scholar] [CrossRef] [PubMed]
- Gu, B.J.; Ju, X.T.; Chang, J.; Ge, Y.; Vitousek, P.M. Integrated reactive nitrogen budgets and future trends in China. Proc. Natl. Acad. Sci. USA 2015, 112, 8792–8797. [Google Scholar] [CrossRef] [PubMed] [Green Version]
- Fang, Y.T.; Gundersen, P.; Mo, J.M.; Zhu, W.X. Nitrogen leaching in response to increased nitrogen inputs in subtropical monsoon forests in southern China. For. Ecol. Manag. 2009, 257, 332–342. [Google Scholar] [CrossRef]
- Wang, H.; Liu, S.R.; Zhang, X.; Mao, Q.G.; Li, X.Z.; You, Z.M.; Wang, J.X.; Zheng, M.H.; Zhang, W.; Lu, X.K.; et al. Nitrogen addition reduces soil bacterial richness, while phosphorus addition alters community composition in an old-growth N-rich tropical forest in southern China. Soil Biol. Biochem. 2018, 127, 22–30. [Google Scholar] [CrossRef]
- Mori, T.; Zhou, K.J.; Wang, S.H.; Zhang, W.; Mo, J.M. Effect of nitrogen addition on DOC leaching and chemical exchanges on canopy leaves in Guangdong Province, China. J. For. Res. 2019, 30, 1707–1713. [Google Scholar] [CrossRef]
- Huang, J.; Wang, X.M.; Zheng, M.H.; Mo, J.M. 13-year nitrogen addition increases nonstructural carbon pools in subtropical forest trees in southern China. For. Ecol. Manag. 2021, 481, 118748. [Google Scholar] [CrossRef]
- Kwak, J.H.; Chang, S.X.; Naeth, M.A. Eleven years of simulated deposition of nitrogen but not sulfur changed species composition and diversity in the herb stratum in a boreal forest in western Canada. For. Ecol. Manag. 2018, 412, 1–8. [Google Scholar] [CrossRef]
- Zhou, K.J.; Lu, X.K.; Mori, T.; Mao, Q.G.; Wang, C.; Zheng, M.H.; Mo, H.; Hou, E.Q.; Mo, J.M. Effects of long-term nitrogen deposition on phosphorus leaching dynamics in a mature tropical forest. Biogeochemistry 2018, 138, 215–224. [Google Scholar] [CrossRef]
- Gaige, E.; Dail, D.B.; Hollinger, D.Y.; Davidson, E.A.; Fernandez, I.J.; Sievering, H.; White, A.; Haleman, W. Changes in canopy processes following whole-forest canopy nitrogen fertilization of a mature Spruce-Hemlock forest. Ecosystems 2007, 10, 1133–1147. [Google Scholar] [CrossRef]
- Bortolazzi, A.; Da Ros, L.; Rodeghiero, M.; Tognetti, R.; Tonon, G.; Ventura, M. The canopy layer, a biogeochemical actor in the forest N-cycle. Sci. Total Environ. 2021, 776, 146024. [Google Scholar] [CrossRef]
- Zhang, W.; Shen, W.J.; Zhu, S.D.; Wan, S.Q.; Luo, Y.Q.; Yan, J.H.; Wang, K.Y.; Liu, L.; Dai, H.T.; Li, P.X.; et al. CAN canopy addition of nitrogen better illustrate the effect of atmospheric nitrogen deposition on forest ecosystems? Sci. Rep. 2015, 5, 11245. [Google Scholar] [CrossRef] [PubMed] [Green Version]
- Ter Heerdt, G.N.J.; Verweij, G.L.; Bekker, R.M.; Bakker, J.P. An improved method for seed-bank analysis: Seedling emergence after removing soil by sieving. Funct. Ecol. 1996, 10, 144–151. [Google Scholar] [CrossRef]
- Smith, R.S.; Shiel, R.S.; Millward, D.; Corkhill, P.; Sanderson, R.A. Soil seed banks and the effects of meadow management on vegetation change in a 10-year meadow field trial. J. Appl. Ecol. 2002, 39, 279–293. [Google Scholar] [CrossRef]
- Liu, G.S.; Jiang, N.H.; Zhang, L.D.; Liu, Z.L. Soil Physical and Chemical Analysis and Description of Soil Profiles; Standards Press of China: Beijing, China, 1996. (In Chinese) [Google Scholar]
- Bossio, D.A.; Scow, K.M. Impacts of carbon and flooding on soil microbial communities: Phospholipid fatty acid profiles and substrate utilization patterns. Microb. Ecol. 1988, 35, 265–278. [Google Scholar] [CrossRef]
- Frostegård, A.; Bååth, E. The use of phospholipid fatty acid analysis to estimate bacterial and fungal biomass in soil. Biol. Fertil. Soils 1996, 22, 59–65. [Google Scholar] [CrossRef]
- Magurran, A.E. Ecological Diversity and Its Measurement; Princeton University Press: Princeton, NJ, USA, 1988. [Google Scholar]
- Cox, G.W. Laboratory Manual of General Ecology; McGraw-Hill: New York, NY, USA, 1985. [Google Scholar]
- Zou, C.B.; Martini, F.; Xia, S.W.; Castillo-Diaz, D.; Goodale, U.M. Elevation and micro environmental conditions directly and indirectly influence forests’ soil seed bank communities. Glob. Ecol. Conserv. 2021, 26, e01443. [Google Scholar] [CrossRef]
- Faist, A.M.; Stone, H.; Tripp, E.A. Imapcts of mastication: Soil seed bank response to a forest thinning treatment in tree Colorado (USA) conifer forest types. Forests 2015, 6, 3060–3074. [Google Scholar] [CrossRef]
- Wang, N.; He, X.Y.; Zhao, F.W.; Wang, D.L.; Jiao, J.Y. Soil seed bank in different vegetation types in the Loess Plateau region and its role in vegetation restoration. Restor. Ecol. 2020, 28, A5–A12. [Google Scholar] [CrossRef]
- Lunt, I.D. Germinable soil seed banks of anthropogenic native grasslands and grassy forest remnants in temperate south-eastern Australia. Plant Ecol. 1997, 130, 21–34. [Google Scholar] [CrossRef]
- Bekker, R.M.; Bakker, J.P.; Grandin, U.; Kalamees, R.; Milberg, P.; Poschlod, P.; Thompson, K.; Willems, J.H. Seed size, shape and vertical distribution in the soil: Indicators of seed longevity. Funct. Ecol. 1998, 12, 834–842. [Google Scholar] [CrossRef]
- Hana, F.; Sanja, C.Z.; Alois, H.; Zdenka, M.; Petr, T.; Pavel, S. Which seed properties determine the preferences of Carabid beetle seed predators? Insect 2020, 11, 757. [Google Scholar] [CrossRef]
- Hou, J.W.; Nan, Z.B.; Baskin, C.; Chen, T. Effect of seed size and fungicide on germination and survival of buried seeds of two grassland species on the Loess Plateau, China. Acta Oecol. 2021, 110, 10716. [Google Scholar] [CrossRef]
- Hopfensperger, K.N. A review of similarity between seed bank and standing vegetation across ecosystems. Oikos 2007, 116, 1438–1448. [Google Scholar] [CrossRef]
- Miao, R.H.; Guo, M.X.; Ma, J.; Gao, B.W.; Alamusa; Miao, Y.; Yang, Z.L.; Liu, Y.Z. Shifts in soil seed bank and plant community under nitrogen addition and mowing in an Inner Mongolian steppe. Ecol. Eng. 2020, 153, 105900. [Google Scholar] [CrossRef]
- Basto, S.; Thompson, K.; Rees, M. The effect of soil pH on persistence of seeds of grassland species in soil. Plant Ecol. 2015, 216, 1163–1175. [Google Scholar] [CrossRef]
- Pakeman, R.J.; Small, J.L.; Torvell, L. Edaphic factors influence the longevity of seeds in the soil. Plant Ecol. 2012, 213, 57–65. [Google Scholar] [CrossRef]
- Török, P.; Kelemen, A.; Valkó, O.; Miglécz, T.; Tóth, K.; Tóth, E.; Sonkoly, J.; Kiss, R.; Csecserits, A.; Rédei, T.; et al. Succession in soil seed banks and its implications for restoration of calcareous sand grasslands. Restor. Ecol. 2018, 26, S134–S140. [Google Scholar] [CrossRef]
- Zhang, C.H.; Wills, C.G.; Ma, Z.; Ma, M.J.; Csontos, P.; Baskin, C.C.; Baskin, J.M.; Li, J.Y.; Zhou, H.K.; Zhao, X.Q.; et al. Direct and indirect effects of long-term fertilization on the stability of the persistent seed bank. Plant Soil 2019, 438, 239–250. [Google Scholar] [CrossRef]
- Long, R.L.; Steadman, K.J.; Panetta, F.D.; Adkins, S.W. Soil type does not affect seed ageing when soil water potential and temperature are controlled. Plant Soil 2009, 320, 131–140. [Google Scholar] [CrossRef]
- Chee-Sanford, J.C.; Williams II, M.M.; Davis, A.S.; Sims, G.K. Do microorganisms influence seed-bank dynamics? Weed Sci. 2006, 54, 575–587. [Google Scholar] [CrossRef]
- Dalling, J.W.; Davis, A.S.; Schutte, B.J.; Arnold, A.E. Seed survival in soil: Interacting effects of predation, dormancy and the soil microbial community. J. Ecol. 2011, 99, 89–95. [Google Scholar] [CrossRef]
- Sarmiento, C.; Zalamea, P.; Dalling, J.W.; Davis, A.S.; Stump, S.M.; U’Ren, J.M.; Arnold, A.E. Soilborne fungi have host affinity and host-specific effects on seed germination and survival in a lowland tropical forest. Proc. Natl. Acad. Sci. USA 2017, 114, 11458–11463. [Google Scholar] [CrossRef] [PubMed] [Green Version]
- Maighal, M.; Salem, M.; Kohler, J.; Rillig, M.C. Arbuscular mycorrhizal fungi negatively affect soil seed bank viability. Ecol. Evol. 2016, 6, 7683–7689. [Google Scholar] [CrossRef] [PubMed] [Green Version]
- Tian, Y.; Lu, H.F.; Wang, J.; Lin, Y.B.; Campbell, D.E.; Jian, S.G. Effects of canopy and understory nitrogen addition on the structure and eco-exergy of a subtropical forest community. Ecol. Indic. 2019, 106, 105459. [Google Scholar] [CrossRef]
- Plue, J.; De Frenne, P.; Acharya, K.; Brunet, J.; Chabrerie, O.; Decocq, G.; Diekmann, M.; Graae, B.J.; Heinken, T.; Hermy, M.; et al. Climatic control of forest herb seed banks along a latitudinal gradient. Glob. Ecol. Biogeogr. 2013, 22, 1106–1117. [Google Scholar] [CrossRef]
- Zhao, Z.; Liu, Y.; Jia, H.Y.; Sun, W.S.; Ming, A.G.; Pang, S.J.; An, N.; Zhang, J.H.; Tang, C.; Dong, S.T. Influence of slope direction on the soil seed bank and seedling regeneration of Castanopsis hystrix seed rain. Forest 2021, 12, 500. [Google Scholar] [CrossRef]
- Bonilla-Valencia, L.; Castillo-Arguero, S.; Martinez-Orea, Y.; Garcia, F.J.E.; Lindig-Cisneros, R.; Alvarez-Anorve, M.Y.; Avila-Cabadilla, L.D. Predictions of the community assemblage in a temperate forest through indicators that evaluate the anthropogenic disturbance effect on natural regeneration. Flora 2021, 275, 151764. [Google Scholar] [CrossRef]


| Species | CAN50 | CAN25 | UAN50 | UAN25 | Control | |||||
|---|---|---|---|---|---|---|---|---|---|---|
| No. | IVI | No. | IVI | No. | IVI | No. | IVI | No. | IVI | |
| Tree | ||||||||||
| Ficus hirta Vahl | 12 | 0.648 | 7 | 0.538 | 6 | 0.517 | 9 | 0.871 | 11 | 0.549 |
| Eurya loquaiana Dunn | 7 | 0.388 | 4 | 0.355 | 8 | 0.523 | 4 | 0.517 | 3 | 0.263 |
| Schima superba Gardn. et Champ. | 11 | 0.227 | ||||||||
| Elaeocarpus varunua Buch.-Ham. | 1 | 0.128 | ||||||||
| Triadica cochinchinensis Loureiro | 1 | 0.128 | 2 | 0.175 | ||||||
| Shrub | ||||||||||
| Blastus cochinchinensis Lour. | 169 | 1.198 | 7 | 0.872 | 19 | 0.929 | 56 | 1.067 | 30 | 0.758 |
| Melicope pteleifolia (Champion ex Bentham) T. G. Hartley | 20 | 0.788 | 5 | 0.527 | 19 | 0.804 | 10 | 0.542 | 24 | 0.981 |
| Mussaenda pubescens W. T. Aiton | 28 | 0.679 | 27 | 0.982 | 40 | 1.114 | 22 | 1.092 | 52 | 1.105 |
| Hedyotis hedyotidea (DC.) Merr. | 12 | 0.523 | 7 | 0.538 | 14 | 0.540 | 7 | 0.863 | 1 | 0.129 |
| Embelia ribes subsp. Pachyphylla (Chun ex C. Y. Wu & C. Chen) Pipoly & C. Chen | 5 | 0.385 | 5 | 0.264 | 3 | 0.346 | 5 | 0.272 | ||
| Trema tomentosa (Roxb.) Hara | 16 | 0.281 | 3 | 0.516 | 5 | 0.264 | 3 | 0.263 | ||
| Litsea cubeba (Lour.) Pers. | 2 | 0.129 | 1 | 0.172 | ||||||
| Baeckea frutescens L. | 1 | 0.127 | 1 | 0.172 | 1 | 0.128 | 2 | 0.259 | ||
| Ampelopsis glandulosa | 1 | 0.127 | ||||||||
| Ardisia crenata Sims | 1 | 0.171 | ||||||||
| Alchornea trewioides (Benth.) Muell. Arg. | 1 | 0.171 | ||||||||
| Itea chinensis Hook. Et Arn. | 1 | 0.171 | ||||||||
| Herb | ||||||||||
| Oxalis corniculata L. | 44 | 0.959 | 21 | 0.949 | 46 | 1.131 | 4 | 0.516 | 6 | 0.402 |
| Digitaria cruciata (Nees) A. Camus | 118 | 0.601 | 58 | 0.652 | 158 | 1.201 | 4 | 0.183 | 17 | 0.450 |
| Torenia benthamiana Hance | 50 | 0.596 | 15 | 0.916 | 8 | 0.523 | 68 | 0.617 | 32 | 0.392 |
| Carex cruciata Wahlenb. | 11 | 0.271 | 2 | 0.344 | 5 | 0.389 | 9 | 0.290 | ||
| Panicum brevifolium L. | 4 | 0.258 | 5 | 0.139 | 8 | 0.533 | 1 | 0.129 | ||
| Ottochloa nodosa var. micrantha (Balansa) Keng f. | 2 | 0.254 | 2 | 0.344 | 1 | 0.128 | 2 | 0.175 | 1 | 0.129 |
| Cyrtococcum patens (L.) A. Camus | 11 | 0.146 | ||||||||
| Cyperus tenuispica Steud. | 2 | 0.128 | 1 | 0.172 | 2 | 0.131 | 32 | 1.133 | 23 | 0.727 |
| Peperomia pellucida (L.) Kunth | 5 | 0.127 | 2 | 0.134 | ||||||
| Richardia scabra L. | 1 | 0.127 | ||||||||
| Solanum americanum Miller | 1 | 0.127 | ||||||||
| Thysanolaena latifolia (Roxburgh ex Hornemann) Honda | 1 | 0.127 | ||||||||
| Rubus parvifolius L. | 3 | 0.516 | 2 | 0.256 | 2 | 0.342 | 1 | 0.129 | ||
| Cyperus rotundus L. | 6 | 0.200 | 2 | 0.256 | ||||||
| Cardamine hirsuta L. | 1 | 0.172 | ||||||||
| Eleusine indica (L.) Gaertn. | 2 | 0.131 | ||||||||
| Lindernia anagallis (Burm. F.) Pennell | 2 | 0.342 | ||||||||
| Ludwigia hyssopifolia (G. Don) exell. | 1 | 0.171 | ||||||||
| Ageratum conyzoides L. | 1 | 0.171 | 1 | 0.129 | ||||||
| Eragrostis ferruginea (Thunb.) Beauv. | 1 | 0.129 | ||||||||
| Property | N-Addition Treatments | ||||
|---|---|---|---|---|---|
| CAN50 | CAN25 | UAN50 | UAN25 | Control | |
| pH | 3.84 ± 0.04 | 3.98 ± 0.28 | 3.79 ± 0.04 | 3.81 ± 0.06 | 3.79 ± 0.03 |
| Total N (g kg−1) | 2.14 ± 0.24 | 2.82 ± 0.45 | 2.88 ± 0.21 | 2.55 ± 0.09 | 2.89 ± 0.45 |
| Total P (g kg−1) | 0.39 ± 0.04 | 0.42 ± 0.05 | 0.44 ± 0.01 | 0.37 ± 0.03 | 0.47 ± 0.08 |
| Organic matter (g kg−1) | 55.58 ± 6.10 | 70.45 ± 12.97 | 73.64 ± 4.18 | 59.78 ± 6.52 | 65.10 ± 4.75 |
| Bacteria (nmol g−1 dry soil) | 12.90 ± 2.22 | 13.74 ± 1.11 | 15.00 ± 2.42 | 15.29 ± 1.87 | 18.41 ± 1.42 |
| GP bacteria (nmol g−1 dry soil) | 6.45 ± 1.21 | 7.15 ± 0.42 | 7.28 ± 1.01 | 7.52 ± 0.84 | 9.11 ± 0.68 |
| GN bacteria (nmol g−1 dry soil) | 5.92 ± 0.95 | 5.92 ± 0.65 | 7.10 ± 1.38 | 7.10 ± 0.92 | 8.54 ± 0.68 |
| Fungi (nmol g−1 dry soil) | 2.34 ± 0.42 | 2.44 ± 0.42 | 2.67 ± 0.53 | 2.59 ± 0.27 | 3.46 ± 0.38 |
| AM fungi (nmol g−1 dry soil) | 0.42 ± 0.08 b | 0.48 ± 0.05 b | 0.52 ± 0.11 ab | 0.53 ± 0.08 ab | 0.76 ± 0.08 a |
| Actinomycete (nmol g−1 dry soil) | 3.27 ± 0.55 | 3.22 ± 0.29 | 3.64 ± 0.59 | 3.70 ± 0.40 | 4.42 ± 0.35 |
Publisher’s Note: MDPI stays neutral with regard to jurisdictional claims in published maps and institutional affiliations. |
© 2021 by the authors. Licensee MDPI, Basel, Switzerland. This article is an open access article distributed under the terms and conditions of the Creative Commons Attribution (CC BY) license (https://creativecommons.org/licenses/by/4.0/).
Share and Cite
Wang, J.; Huang, Y.; Guo, Q.; Yang, L.; Lu, H.; Ren, H. Influence of Simulated Nitrogen Deposition on the Soil Seed Bank of a Subtropical Evergreen Broadleaved Forest. Forests 2021, 12, 1538. https://doi.org/10.3390/f12111538
Wang J, Huang Y, Guo Q, Yang L, Lu H, Ren H. Influence of Simulated Nitrogen Deposition on the Soil Seed Bank of a Subtropical Evergreen Broadleaved Forest. Forests. 2021; 12(11):1538. https://doi.org/10.3390/f12111538
Chicago/Turabian StyleWang, Jun, Yao Huang, Qinfeng Guo, Long Yang, Hongfang Lu, and Hai Ren. 2021. "Influence of Simulated Nitrogen Deposition on the Soil Seed Bank of a Subtropical Evergreen Broadleaved Forest" Forests 12, no. 11: 1538. https://doi.org/10.3390/f12111538
APA StyleWang, J., Huang, Y., Guo, Q., Yang, L., Lu, H., & Ren, H. (2021). Influence of Simulated Nitrogen Deposition on the Soil Seed Bank of a Subtropical Evergreen Broadleaved Forest. Forests, 12(11), 1538. https://doi.org/10.3390/f12111538