Abstract
Summer air temperatures will continue to rise in metropolitan regions due to climate change and urbanization, intensifying daytime and nighttime air temperatures and result in greater thermal discomfort for city dwellers. Urban heat may be reduced by trees which provide shade, decreasing air and surface temperatures underneath their canopies. We asked whether tree height and canopy density can help to identify species that provide greater microclimate benefits during day and night. We also asked if increased canopy cover of street trees provides similar microclimate benefits. We used continuous measurements of near-surface air temperatures under 36 park trees and from two urban streets to assess these questions. In the park, trees were grouped according to their height (<10 m, 10–20 m, >20 m) and canopy density (low, high), while the effect of canopy cover was tested using streets with high (31%) and low (11%) cover. Daytime near-surface air temperature declined with increasing height and canopy density providing significant cooling benefits. However, this trend was reversed at night when tall trees with dense canopies restricted longwave radiative cooling and trapped warm air beneath their crowns. High canopy cover of street trees reduced daytime air temperatures more, resulting in a lower number of days with hot (>35 °C) and extreme (>40 °C) air temperatures compared to the street that had low canopy cover. These findings suggest that tree species and streetscapes with dense canopy cover improve local thermal conditions during the day but do not seem ideal to allow for nighttime cooling, creating potential discomfort for residents during hot summer nights. Our results indicate that classifying trees using a simple metric can assist in selecting tree species that can alleviate the local negative effect of urban heat during the day, but at the same time, their effect in preventing optimal longwave radiative cooling during the night must be factored into planting strategies.
1. Introduction
Given that most of the world population resides in cities, increasing urban air temperatures as a result of human activity is a concern for public health and wellbeing. On top of increased mean air temperature, climate models predict more intense, frequent, and prolonged heatwaves [1]. Moreover, since urban space is already warmer than non-urban areas [2,3], further increases in air temperatures have adverse effects on the urban environment and its residents as signified by the positive relationship between heat and human mortality rates [4]. As population growth and urban expansion continue, cost-effective strategies that help to limit the negative effects of rising air temperatures in our cities are needed.
Replacement of natural vegetation by buildings and other low albedo surfaces in metropolitan areas affects the surface energy exchange at daytime and nighttime [5,6,7,8]. At daytime, low albedo surfaces cause less shortwave radiation to be reflected, which instead is absorbed leading to warm thermal conditions in cities [5,6,9,10,11], mainly attributed to increased surface temperatures. The absorbed shortwave radiation is then gradually re-emitted as longwave radiation back into the urban space at nighttime [5,9,10]. The influence of street geometry affecting air movement, types of building materials, and contribution of heat generated by city dwellers (i.e., warm air vented from air conditioning, traffic) often disrupts the loss of longwave radiation at nighttime [5,6], leading to generally elevated nighttime near-surface air temperatures [3,5,10]. Given the predicted rise in air temperature due to climate change, population growth, and urban expansion [1,8,12,13], urban heat may occur more often or even in semi-urban areas which previously did not experience such a phenomenon. Thus, identification of potential areas affected by elevated urban air temperatures and implementation of strategies like green roofs, use of materials with high albedo, and increased green space at ground level are essential to minimize the negative effects of urban heat [14,15,16].
One popular strategy to alleviate the adverse effects of urban heat is planting trees, as they are known to improve thermal conditions in metropolitan landscapes by cooling the microclimate underneath the canopy [2,17]. However, the microclimate benefits of trees are often species-specific because woody plants differ in physiological and anatomical characteristics as well as strategies to cope with abiotic stress factors like heatwaves and droughts [16,18]. Thus, the right tree species should be selected for minimizing the negative effects of urban heat, particularly at a local scale. In general, trees cool air and surface temperatures effectively during the day through transpiration of water from leaves and surface shading [19,20,21,22]. Transpiration is a process which regulates temperature by cooling the air surrounding the leaf, whereas the canopy reflects solar radiation and provides shading by blocking light transmission through the crown and thus prevents solar radiation from reaching surfaces beneath [16,18]. Canopy light-transmission properties and thus shade quality depend on foliage density and leaf positioning and can be determined by estimating the Leaf Area Index (LAI) of a tree crown [9], which can be used to provide a first estimate of the amount of light penetrating the canopy. Previous studies found that tree species with dense canopies (high LAI) restricted light transmission and reduced daytime air and surface temperatures more, compared to tree species with open canopies (low LAI) [18,20,23,24]. Hence, the daytime cooling benefits of trees improve as canopy cover increases, since extensive and dense crowns seem to reflect more light, provide more shade, and transpire greater amounts of water, generating more transpirative cooling [9], and resulting in a cool microclimate underneath the canopy. Moreover, tree height, and thus crown size, is also an important factor determining the amount of shade produced by the tree, as tall, wide trees create more shade which results in lower surface temperature of a larger space compared to species of short or narrow stature [18,25].
Despite daytime cooling, the beneficial microclimate provided by dense canopies can be reversed during the nighttime [26]. Given the lack of solar radiation and limited transpiration during the night [27], nighttime cooling depends on longwave radiation exchange and ventilation underneath the canopy [28,29]. In addition, the shortwave radiation, which was absorbed by impervious surfaces during the day, is gradually released into the near surface atmosphere during nighttime. A limited number of studies demonstrated the reversed effect of dense tree canopies, where heat was trapped underneath the tree canopy due to restricted longwave radiative cooling and impaired ventilation, leading to elevated nighttime temperatures [21,24,28,29,30], while radiation loss with unobstructed ventilation and thus nighttime cooling were enhanced under open canopies. Importantly, nighttime thermal conditions are key to human health as the absence of cooling overnight limits the relief from elevated daytime air temperatures.
Systematic assessments of the effect of commonly planted native and non-native urban tree species on summer air temperatures in Greater Sydney, Australia, are missing. The metropolitan area is home to more than 5 million people who are exposed to increasing summer air temperatures [31]. The lack of knowledge around the capacity of urban tree species to deliver microclimate benefits limits urban planners and landscape architects to selecting those species that are specifically effective when the aim of planting is to reduce near-surface air temperatures (Tair). The present study recorded Tair at high temporal resolution in the field to test the following three hypotheses: (1) If characteristics like tree size and canopy density can be used to classify tree species by their potential to reduce Tair, then simple metrics can be used to select the best species to alleviate the effects of urban heat. (2) If species with high canopy density provide the best cooling during the day, then their canopies will restrict longwave radiative cooling during the night. (3) If the principles of hypotheses 1 and 2 are true, then air temperatures in streets with higher canopy cover should be cooler during the day and warmer during the night compared to nearby streets with low canopy cover. The first two hypotheses were tested by analyzing Tair under six different tree species in a single park. To test the third hypothesis, Tair data was recorded in two residential streets that markedly differed in canopy cover provided by street trees. Assessment categories were deliberately selected to be broad and simple to apply, with three categories for tree height (<10 m, 10–20 m, >20 m) and two categories for canopy density (high, low). Working with such descriptive categories is necessary when producing evidence-based selection guidelines for urban tree plantings that are practical and intuitive. Our results document that broad categorization of trees can support informed decision-making by practitioners. However, our findings also highlight that trees selected for cooling during the day will be those that keep Tair higher during the night. These findings should be used to refine selection and planting strategies for urban trees.
2. Results
2.1. Species-Specific Differences in Tair
Across the entire summer of 2018/19, near-surface air temperatures (Tair) varied significantly under the canopies of the nine tree species studied (F = 2.97, p < 0.05). Throughout December 2018, and January and February 2019, mean Tair was comparable for all species and was around 24 °C (Table 1). The absolute maximum air temperature (Tmax) was found under Eucalyptus spp. (44.8 °C) and Callistemon viminalis trees (43.4 °C), while Tmax was the lowest under the canopies of Ficus microcarpa (40.1 °C) and Platanus spp. (39.7 °C). The other species had comparable Tmax ranging between 41.0 °C and 42.9 °C. In addition, Platanus spp., Ficus microcarpa, and Liquidambar styraciflua had also the highest absolute minimum air temperatures (Tmin) which was around 13.6 °C, while the lowest Tmin was recorded under canopies of Lagerstroemia indica (11.6 °C) and Eucalyptus spp. (12.0 °C) (Table 1). Hot and extreme days where Tair exceeded 35 °C and 40 °C were most common under canopies of Eucalyptus spp. (43 hot and 16 extreme days) and Callistemon viminalis (40 hot and 13 extreme days; Table 1). In contrast, Tair never reached 40 °C under the canopy of Platanus spp. while such extreme temperatures were only recorded during two days under Ficus microcarpa, and both species also had the lowest number of days with hot air temperatures (20 days).

Table 1.
Mean (Tair; °C), absolute minimum (Tmin; °C) and maximum (Tmax; °C) near-surface air temperatures, including number of days with hot (>35 °C) and extreme conditions (>40 °C). Values were extracted from all three summer months. ±1 standard deviation (SD) is shown for Mean Tair. Asterisks denote tree species in the streets with low (*) and high (**) canopy cover.
2.2. Tree Height
During the summer of 2018/19 and across all park trees, mean daytime and mean nighttime Tair changed significantly with tree height (Table 2). Importantly, the direction of the response was different for each time of day. Daytime near-surface air temperatures were generally the highest under <10 m high trees but decreased under taller trees (Figure 1). Throughout summer, and across the six park tree species, mean daytime Tair for each height was 28.6 °C ± 1.2 (<10 m tall, (mean ± SD)), 28.2 °C ± 1.3 (10 m–20 m tall), and 27.6 °C ± 1.1 (>20 m tall). A statistically significant mean daytime Tair difference of 1.1 °C was recorded between <10 m and >20 m tall trees (p < 0.05), which was a consistent pattern in each month. In contrast, the temperature difference between medium trees (10 m–20 m height) and other tree heights changed little (−0.4 °C compared to trees <10 m tall; +0.6 °C compared to trees taller than 20 m). The largest mean daytime Tair difference was recorded between canopies of Eucalyptus trees and Ficus microcarpa (−1.3 °C to −1.7 °C) or Platanus spp. (−1.0 °C to −1.4 °C). Given the overall height-related reductions in mean daytime Tair (F = 29.08; p < 0.001; Table 2), significant relationships between temperature and tree height (Figure 1) were found for all three summer months. The coefficients of determination (R2) ranged from 0.33 to 0.41 (p < 0.01 and p < 0.001) with tree heights. These relationships were comparable across months with the strongest effect of tree height on Tair in January (R2 = 0.41), when the ambient air temperatures were the highest.
Table 2.
A 2-way ANOVA of tree height and month effects and its interactions for daytime and nighttime near-surface air temperatures.
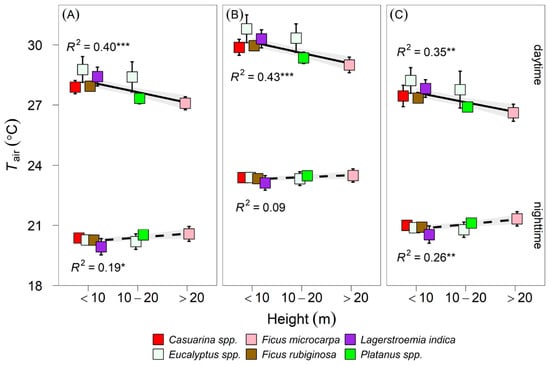
Figure 1.
Relationship between tree height and daytime (10 a.m.–6 p.m., upper relationships) and nighttime (9 p.m.–5 a.m., lower relationships) mean near-surface air temperatures (Tair) for six commonly planted urban tree species in Greater Sydney. Individual species are identified in the legend. Species means (N = 2688–8928) are shown for December 2018 (panel A), January 2019 (panel B) and February 2019 (panel C). Coefficients of determination are shown for each linear relationship (solid lines = daytime; dashed lines = nighttime) and asterisks refer to significant relationships (p-values: * <0.05, ** <0.01, *** <0.001); error bars show ± 1 SD.
Nighttime Tair showed the opposite response with tree height compared to daytime measurements and significantly increased with tree height (F = 9.77; p < 0.001; Table 2; Figure 1). However, these trends were only significant in December (R2 = 0.19, p < 0.05; Figure 1A) and February (R2 = 0.26, p < 0.01; Figure 1C). Across the entire summer and all species, mean nighttime Tair reached 21.5 °C ± 1.4 (<10 m tall), 21.6 °C ± 1.4 (10 m–20 m tall), and 21.8 °C ± 1.3 (>20 m tall). Similar to daytime, the largest mean difference of nighttime Tair was found for trees that were more than 10 m but less than 20 m in height (p < 0.05). However, the overall difference was only around 0.3 °C across all months, with a maximum of +0.5 °C mean nighttime Tair under trees taller than 20 m compared to trees shorter than 10 m in February. When compared with the smallest and the largest tree height category, nighttime Tair measured under the canopy of intermediate trees did not differ much (difference of only 0.2 °C).
2.3. Canopy Density
Mean daytime Tair decreased significantly as canopies became denser (Figure 2), with overall mean values of 28.7 °C ± 1.2 (low density) and 27.9 °C ± 1.2 (high density) across summer and all six park tree species. This corresponded to a mean daytime Tair difference of 0.8 °C between the canopy densities, which was also consistent and significant for all three summer months (p < 0.001; Table 2). Mean daytime Tair showed a strong and significant reduction with canopy density (F = 63.18, p < 0.001, Table 2). The coefficients of determination (R2) for the effect of canopy density on mean Tair ranged from 0.39 to 0.44 (p < 0.001).
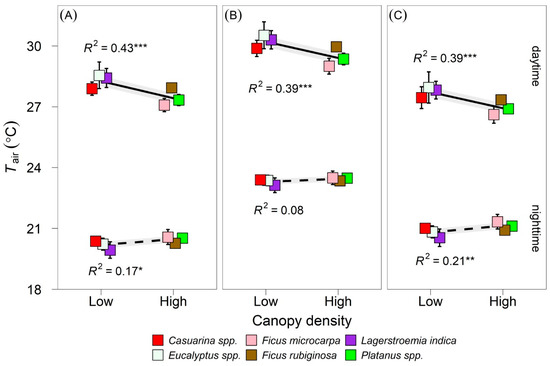
Figure 2.
Relationship between canopy density and daytime (10 a.m.–6 p.m., upper relationships) and nighttime (9 p.m.–5 a.m., lower relationships) mean near-surface air temperatures (Tair) for six commonly planted urban tree species in Greater Sydney. Individual species are identified in the legend. Species means (N = 6720–8928) are shown for December 2018 (panel A), January 2019 (panel B) and February 2019 (panel C). Coefficients of determination are shown for each linear relationship (solid lines = daytime; dashed lines = nighttime) and asterisks refer to significant relationships (p-values: * <0.05, ** <0.01, *** <0.001); error bars show ± 1 SD.
Similar to tree height, canopy density was positively and significantly (F = 17.15, p < 0.001; Table 2) correlated to mean nighttime Tair, being cooler (21.4 °C ± 1.4) under low density and warmer (21.7 °C ± 1.3) under high density canopies (Figure 2). The mean nighttime Tair difference between the canopies was around 0.3 °C in December (R2 = 0.17, p < 0.05; Figure 2A) and February (R2 = 0.21, p < 0.01; Figure 2C), but did not differ in January.
2.4. Canopy Cover
Mean daytime and mean nighttime Tair were used to compare the effect of 11% canopy cover in the low canopy cover street (LCCS) to 31% canopy cover in the high canopy cover street (HCCS). In LCCS, mean daytime Tair measured under the canopy reached on average 29.2 °C (±1.3) which was significantly warmer compared to HCCS (+3.2%; p < 0.05). This corresponded to a mean daytime Tair difference of 0.9 °C between the streets, with the same pattern in each month (Figure 3). In summer months, LCCS had significantly higher Tair during daytime than HCCS (p < 0.05), which was reflected by warmer mean daytime Tair of 0.9 °C (January) and 1.0 °C (December). However, LCCS was close to also having significantly higher mean daytime Tair than HCCS in February (+0.8 °C; p = 0.06). Moreover, LCCS had 40 days with hot (>35 °C) and 13 days of extreme (>40 °C) temperatures, while HCCS recorded only 28 days with hot and 5 days with extreme conditions (Table 1).
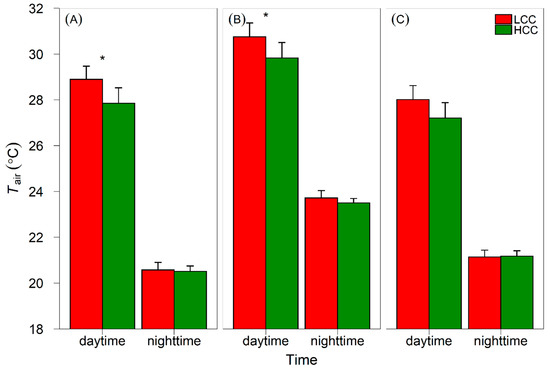
Figure 3.
Daytime (10 a.m.–6 p.m.) and nighttime (9 p.m.–5 a.m.) mean near-surface air temperatures (Tair) in a street with low canopy cover (LCCS, red bars) and high canopy cover (HCCS, green bars). Means (N = 8064–8928) are shown for December 2018 (panel A), January 2019 (panel B) and February 2019 (panel C). Asterisks refer to significant differences between the streets for daytime Tair (t test, p-values: * <0.05); error bars show 1 SD.
In contrast, mean nighttime Tair was comparable under canopies in both streets and was on average ~22 °C across summer. There was also no detectible change in mean nighttime Tair between the streets when analyzed for individual months since the mean difference was only around 0.1 °C (Figure 3). The highest mean nighttime temperatures were recorded in January in both streets (~24 °C; Figure 3B), almost 4 °C higher than in December and February (Figure 3A,C).
3. Discussion
A large number of near-surface air temperature (Tair) data collected under tree canopies allowed us to verify how common, woody species in Sydney influenced summer daytime and nighttime microclimates in a park and two urban streets. Compared with other more sophisticated measurements and modelling assessments [32], this study used a simplistic approach to classify tree species based on visual characteristics and offered an easy and cost-effective method to verify species-specific differences in cooling benefits. Based on empirical evidence, we found that characteristics like tree height, canopy density, and canopy cover can be useful metrics to determine cooling benefits and thus simplify the selection of appropriate species for alleviating the negative effects of summer heat at a local scale. However, the selected metrics that resulted in favorable microclimate benefits during the day produced the reverse effect during nighttime.
A number of studies investigated the effect of tree size on urban heat [18,25,26,33], suggesting that daytime cooling benefits improve with increase in tree height. Some authors indicated that tall trees might cast more shade than short ones reducing surface and air temperatures, but the effect varied with time of day [25]. The height-related reduction in Tair was also observed in our study, where the tallest species (Ficus microcarpa) provided the most considerable cooling, which was underneath the canopy and near these trees. This was likely because tall trees cast a large shadow on the surrounding urban surfaces that limited warming of surrounding ambient air during the day. In addition, the crown base of tall trees is usually wider compared to shorter trees. This could result in increased isolation of microclimates underneath larger trees. The effect could also help explain why the local microclimate beneath the canopies of the shortest trees (Lagerstroemia indica, Casuarina spp., Ficus rubiginosa, and Eucalyptus spp.) was warmer. The short trees shaded only a small area and the crown and branches were closer to sunlit surfaces which probably radiated sensible heat during the day [25], resulting in warmer Tair under these canopies.
While tree height was an essential factor driving Tair in our study, other authors indicated that canopy density might have a greater influence on urban heat than tree size [25,33]. Many studies found that trees with dense and wide canopies provided the best shading quality, regardless of their size, which considerably reduced air temperatures in the surrounding urban space [22,25,34]. This trend was also visible in our park study, where species with dense canopies (Ficus microcarpa, Ficus rubiginosa, and Platanus spp.) correlated with the coolest mean and maximum daytime Tair under their canopies. The shading underneath these species was substantial due to low light transmission, which limited warming of sub-canopy air and surfaces underneath the trees. Moreover, high transpirational cooling from species with dense canopies may have further contributed to lowering air temperatures [19,23], but we did not measure transpiration rates and thus cannot provide evidence to verify this effect. Increased light penetration through open canopies resulted in less shade, warming sub-canopy air and surfaces beneath the trees [23]. This was likely the cause for higher Tair and the number of days with hot (>35 °C) and extreme (>40 °C) temperatures under tree species with open canopies in our study (Lagerstroemia indica, Casuarina spp., and Eucalyptus spp.). These results demonstrate that a simple metric with six variables to characterize tree height and canopy density can be useful when selecting species to effectively mitigate urban heat during the day at a local scale. However, we acknowledge that other tree characteristics (tree width and LAI, not measured in this study) might have a role in the observed responses.
However, even though trees with dense, broad canopies provided substantial daytime cooling, the effect of longwave radiation from surrounding surfaces as well as dense canopies restricting radiative cooling, resulted in warmer sub-canopy microclimates during the night in this and other studies [27]. High nighttime air temperatures were recorded under trees with dense canopies in several urban environments, particularly in areas with restricted air movement and around hard surfaces slowly re-radiating stored heat as longwave radiation overnight [11,26]. The reason for this phenomenon seems to be the effect of restricted air movement and low radiation of heat through a dense canopy. However, trees measured in the present study grew in an urban park where they were surrounded by grassed areas. The fact that nighttime air temperatures were still cooler under open canopies in an environment where additional longwave radiation from hard surfaces can be excluded, underlines the importance of convection for nighttime cooling.
Although the best cooling benefits are provided by canopy cover larger than 40% [27], many Sydney suburbs have often less than 20% canopy area [35] and in some suburbs even below 10% [36]. By comparing two urban streets that differed in canopy cover, we found that the area of canopy cover only partially followed the trends documented in the park. The wide and dense crowns of established trees in the street with high canopy cover limited extreme daytime heat by reducing shortwave and longwave radiation, thus improving thermal comfort of the residents more than when compared to the nearby street with low canopy cover. However, nighttime temperatures were similar between the streets. This was an unexpected result, as observations from the urban park had indicated that nighttime air temperatures should have been lower in the street with low canopy cover. The capacity of surface materials to store and release daytime heat may explain the different results between the street and park study for nighttime air temperatures. The grass in the park was likely warm at nighttime as shading had little effect on the heat storage of the grassed area [37]. Similar to a study from Melbourne [38], our data indicates that daytime cooling provided by large and dense canopies in the street with high canopy cover was sufficient to limit the absorption of shortwave radiation by hard surfaces, which resulted in less emission of stored heat as longwave radiation and a contribution to cooling of the microclimate during nighttime. The low canopy cover in the second street most likely did result in greater absorption of heat by hard surfaces during the day, but low canopy cover did also allow for this heat to dissipate quickly during the night, resulting in localized good nighttime cooling [11,28]. Further research is required to identify thresholds of canopy area for these two mechanisms that can produce similar cooling benefits during hot summer nights.
We found clear daytime and nighttime thermal trends associated with tree and canopy characteristics. We acknowledge that a risk remains that our measurements were influenced by radiant heat from surfaces under the trees. However, this risk lies in a temperature range of 0.001 °C or smaller when estimating energy budgets related to directly reflected solar radiation. Moreover, measurements were collected in half or full shade further reducing the potential impact of reflected solar radiation influencing our measurements.
4. Materials and Methods
4.1. Research Sites
The experiments took place during the summer of 2018/19 at two locations in the Parramatta City Local Government Area (LGA). The LGA was located at the geographical center of the Greater Sydney Basin, approximately 24 km west of downtown Sydney. The climate of the area is temperate with dry winters. Long-term annual minimum and maximum daily average air temperatures are 12.2 °C and 23.4 °C and mean annual precipitation is 960 mm (based on data from 1967–2020, available from the Australian Government Bureau of Meteorology). The area is experiencing extreme heat every summer and at increasing frequency and magnitude. The number of days with maximum air temperatures of 35.0 °C or greater has increased from an average of 6 in the late 1960s to more than 15 in the late 2010s. In 2017, these temperatures were recorded for 27 days. Since 2005, the area experienced 11 of the hottest summers on record. The highest temperature ever recorded in the LGA was 47.0 °C on 4 January 2020. Hence, the residents of Parramatta City are increasingly exposed to hot and extreme summer temperatures. Effective strategies need to be developed to limit the adverse effects of urban heat in the area.
4.2. Experiments
Two experiments were implemented where near-surface air temperatures (Tair) were recorded to test the effects of individual tree characteristics and entire canopy cover on sub-canopy microclimates in urban environments. The first experiment elucidated the effects of tree height and canopy density on Tair using six different tree species, each replicated six times (N = 36, details below). The mature trees used for this experiment grew in single-species groups in an urban park (Robin Thomas/James Ruse Reserve, Figure 4A), 1 km east of Parramatta and included the following species: Lagerstroemia indica L. (comm. Crepe Myrtle), Platanus spp. (comm. London Planetree), Casuarina spp. (comm. Sheoak), Eucalyptus spp. (comm. Gum Tree), Ficus microcarpa L.f. (comm. Curtain Fig), and Ficus rubiginosa Desf. ex Vent. (comm. Port Jackson Fig). Tree height and canopy density categories for each species are shown in Table 3.
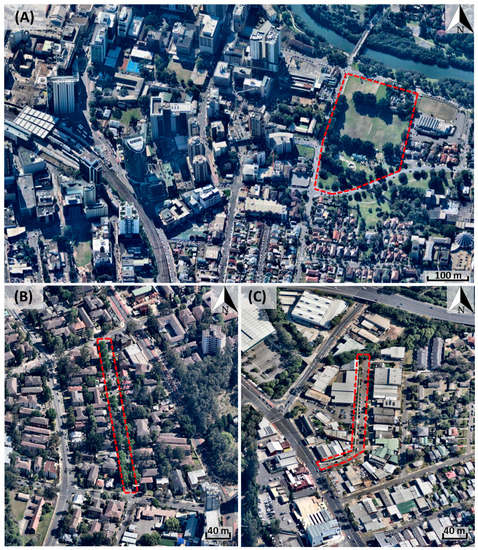
Figure 4.
Aerial views of the research sites in the local government area of Parramatta City, Australia. (A) urban park; (B): residential street with high canopy cover; (C): mixed residential and commercial street with low canopy cover. Dashed red lines indicate the areas where the experiments took place. Aerial images depict locations during the time of data collection in summer 2018/19. Image© Nearmap.
Table 3.
Height, canopy density classification, and a range of distance for park tree species.
The second experiment assessed the effect of canopy cover on street microclimate. For this purpose, two streets that differed in canopy cover were selected in the suburb of North Parramatta. The two streets were Galloway (high canopy-cover street, hereafter referred to as ‘HCCS’; Figure 4B) and Daking Street (low canopy-cover street, hereafter referred to as ‘LCCS’; Figure 4C) in North Parramatta and their physical characteristics are shown in Table 4. Both streets had a north-south orientation and were 1 km apart. The HCCS was a residential street with a high percentage of green infrastructure in the form of Quercus palustris Münchh (comm. Pin Oak) and Liquidambar styraciflua L. (comm. Liquidambar) street trees, providing ample shade in summer. The LCCS featured Callistemon viminalis (comm. Bottlebrush) trees, and the surrounding area was dominated by buildings for industrial, commercial, and educational purposes. Canopy cover in both streets was assessed using high-resolution aerial images provided by Nearmap (Barangaroo, NSW, Australia). Using the polygon function of this software allowed delineating the area of the entire length of the streets and adjacent infrastructure at 25 m distance from the road center. This approach captured street trees and adjacent trees in front gardens and along fence lines that would all influence the microclimate of the street. After determining the area of each polygon and the area of tree canopy inside each polygon, the proportion of tree canopy to polygon area was calculated, showing that HCCS had 31% and LCCS had 11% canopy cover (Table 4). Six temperature loggers were deployed in each of the two streets (details below).
Table 4.
Canopy cover characteristics in the high (HCCS) and low canopy-cover streets (LCCS). Canyon depth indicates the highest point at the top of the tree.
4.3. Placing Loggers in the Field
Near-surface air temperatures were collected from 1 December 2018 until 28 February 2019 using custom-made micro temperature loggers (hereafter referred to as ‘MTL’) designed and manufactured at Western Sydney University. The MTLs consisted of a water-proof temperature sensor (Tempmate.®-S1 V2, Imec Messtechnik, Heilbronn, Germany) and a reflective aluminum shield to protect the sensor from direct solar radiation. The base of the shield was open and holes in the top of the shield allowed for good air circulation around the sensor. The sensor can record temperatures ranging from −30 to +70 °C with an accuracy of 0.5 to 1.0 °C at 0.1 °C resolution, and it met international certifications (e.g., EN 12830, RoHS, and CE).
The accuracy of the MTL was assessed against a bare sensor (Tempmate), a commercially available air temperature logger (TGP4500, TinyTag, Gemini Data Loggers, Chichester, UK), and three official weather stations operated by the Australian Government Bureau of Meteorology. The following comparisons were done simultaneously: (1) bare sensor with TinyTag (N = 1, R2 = 0.999), (2) MTL with the bare sensor (N = 1, R2 = 0.997), (3) MTL with TinyTag (N = 1, R2 = 0.997), and four MTLs were compared against data recorded by three official Bureau of Meteorology weather stations (R2 = 0.96–0.98). Air temperatures recorded at 9 a.m., 3 p.m., minimum and maximum daily air temperatures were used for these comparisons. All calibrations resulted in coefficients of determination close to 1, indicating that the bespoke loggers were documenting air temperatures correctly. Logging interval was 10 min.
Following activation, the MTLs were assembled and hung onto a lower branch of the target tree, 2.5–3.5 m above the ground using a ladder and cable ties. The temperature sensor inside the MTL was completely shaded and the MTLs were installed vertically with their open base facing towards the ground. In total, 48 MTLs were deployed, with 6 loggers placed in tree canopies of six species (N = 36) across the park and six loggers in canopies of street trees in HCCS and LCCS (N = 12). Two loggers in the park were lost to vandalism. A total of 596,160 individual measurements of Tair were collected and analyzed. A total of 77,760 individual measurements of Tair were collected for each tree species in the park (except for Ficus rubiginosa, Eucalyptus spp., and Lagerstroemia indica, where one MTL per species was lost resulting in 64,800 individual measurements) and each of the two urban streets.
4.4. Tree Height and Canopy Density
To test the effect of tree characteristics on Tair, height and canopy density were visually assessed for each park tree. Tree height was classed as being either less than 10 m (<10 m), between 10 and 20 m (10 m–20 m) or taller than 20 m (>20 m), while canopy density was associated with the amount of light penetrating the canopy and scored as low or high. Given that these assessments may be subjected to potential bias, the visual inspection was carried out by a single person for consistency. Individual tree groups were planted at the same time, resulting in similar height and canopy density for the six individuals in each group.
4.5. Daytime and Nighttime Tair
Mean summer daytime Tair was calculated using data recorded between 10 a.m. and 6 p.m. from 1 December 2018 to 28 February 2019. Mean daytime Tair was also calculated separately for each month. Mean nighttime Tair was calculated similarly, based on the time interval between 9 p.m. and 5 a.m. for the entire summer and each month. Both nighttime and daytime Tair were extracted from the main dataset for each day and averaged for individual MTLs.
4.6. Statistical Analysis
Statistical analyses were done using R (Version 3.5.1; R Foundation for Statistical Computing, Vienna, Austria). For all analyses, statistical significance was assumed when p < 0.05. To verify species-specific differences in Tair, 1-way ANOVA (lm and Anova from stats R package) was used for all nine park and street tree species averaged for individual MTL during 24 h-time. Across tree species in the park, Tair was analyzed using a 2-way ANOVA, with the factors tree height (<10 m, 10 m–20 m and >20 m) or canopy density (low and high) and month (December, January, and February) for each time of day (nighttime and daytime). Using means of individual MTLs (N = 1344–1488), linear relationships between daytime and nighttime Tair and tree height or canopy density were tested by analyzing each month separately with the lm function in the stats package of R. Differences in mean summer, daytime, and nighttime Tair between the two streets were tested using t tests (t test from stats R package).
5. Conclusions
We demonstrated that simple metrics such as tree size and canopy density can be used to inform the selection of species that have the greatest potential to minimize the negative effects of summer urban heat during the day at a local scale. At the same time, dense canopies will reduce nighttime cooling underneath tree canopies. Based on the evidence provided, three recommendations to mitigate increasing urban heat through trees can be devised to local scale. First, given that existing tall trees already provide cooling benefits, it will be expedient to protect and manage these trees well, especially those with dense canopies. Second, improving growing conditions of juvenile trees (e.g., irrigation, fertigation) will accelerate their capacity to provide greater cooling benefits in less time. Third, selection of species and planting locations for additional trees should consider daytime and nighttime effects of these trees on urban microclimates.
Author Contributions
Conceptualization: S.P.; methodology: S.P.; formal analysis: S.P. and A.W.-K.; data curation: S.P.; writing—original draft preparation: A.W.-K.; writing—review and editing: S.P.; visualization: A.W.-K.; supervision: S.P. All authors have read and agreed to the published version of the manuscript.
Funding
This research was funded by Parramatta City Council.
Acknowledgments
The authors would like to thank Betty Jones, Helen Papathanasiou, Hannah Greig, Sue Cram, Ashlyn Kishore, Michael Nicholson, Josh Jongma and Geoff King for their technical support. The Orora Group is thanked for the generous donation of raw protective shields for MTLs.
Conflicts of Interest
The authors declare no conflict of interest.
References
- Masson-Delmotte, V.; Zhai, P.; Pörtner, H.-O.; Roberts, D.; Skea, J.; Shukla, P.R.; Pirani, A.; Moufouma-Okia, W.; Péan, C.; Pidcock, R.; et al. Global Warming of 1.5 °C: An IPCC Special Report on the Impacts of Global Warming of 1.5 °C Above Pre-Industrial Levels and Related Global Greenhouse Gas Emission Pathways, In the Context of Strengthening the Global Response to the Threat of Climate Change, Sustainable Development, and Efforts to Eradicate Poverty; Intergovernmental Panel on Climate Change: Geneva, Switzerland, October 2018. [Google Scholar]
- Bowler, D.E.; Buyung-Ali, L.; Knight, T.M.; Pullin, A.S. Urban greening to cool towns and cities: A systematic review of the empirical evidence. Landsc. Urban Plan. 2010, 97, 147–155. [Google Scholar] [CrossRef]
- Rizwan, A.M.; Dennis, L.Y.; Liu, C. A review on the generation, determination and mitigation of Urban Heat Island. J. Environ. Sci. 2008, 20, 120–128. [Google Scholar] [CrossRef]
- Li, Y.; Ren, T.; Kinney, P.L.; Joyner, A.; Zhang, W. Projecting future climate change impacts on heat-related mortality in large urban areas in China. Environ. Res. 2018, 163, 171–185. [Google Scholar] [CrossRef] [PubMed]
- Oke, T.R. Urban Climates; Mills, G.M., Christen, A., Voogt, J.A., Eds.; Cambridge University Press: Cambridge, UK, 2017. [Google Scholar] [CrossRef]
- Oke, T.R.; Johnson, G.T.; Steyn, D.G.; Watson, I.D. Simulation of surface urban heat islands under ‘ideal’ conditions at night part 2: Diagnosis of causation. Bound. Layer Meteorol. 1991, 56, 339–358. [Google Scholar] [CrossRef]
- Oke, T.R. The energetic basis of the urban heat island. Q. J. R. Meteorol. Soc. 1982, 108, 1–24. [Google Scholar] [CrossRef]
- Arnfield, A.J. Two decades of urban climate research: A review of turbulence, exchanges of energy and water, and the urban heat island. Int. J. Clim. 2003, 23, 1–26. [Google Scholar] [CrossRef]
- Jamei, E.; Rajagopalan, P.; Seyedmahmoudian, M.; Jamei, Y. Review on the impact of urban geometry and pedestrian level greening on outdoor thermal comfort. Renew. Sustain. Energy Rev. 2016, 54, 1002–1017. [Google Scholar] [CrossRef]
- Martilli, A.; Krayenhoff, E.S.; Nazarian, N. Is the Urban Heat Island intensity relevant for heat mitigation studies? Urban Clim. 2020, 31, 100541. [Google Scholar] [CrossRef]
- Gago, E.; Roldán, J.; Pacheco-Torres, R.; Ordóñez, J. The city and urban heat islands: A review of strategies to mitigate adverse effects. Renew. Sustain. Energy Rev. 2013, 25, 749–758. [Google Scholar] [CrossRef]
- Argüeso, D.; Evans, J.; Fita, L.; Bormann, K.J. Temperature response to future urbanization and climate change. Clim. Dyn. 2013, 42, 2183–2199. [Google Scholar] [CrossRef]
- Broadbent, A.M.; Krayenhoff, E.S.; Georgescu, M. The motley drivers of heat and cold exposure in 21st century US cities. Proc. Natl. Acad. Sci. USA 2020, 202005492. [Google Scholar] [CrossRef] [PubMed]
- Solecki, W.D.; Rosenzweig, C.; Parshall, L.; Pope, G.; Clark, M.; Cox, J.; Wiencke, M. Mitigation of the heat island effect in urban New Jersey. Environ. Hazards 2005, 6, 39–49. [Google Scholar] [CrossRef]
- Wang, Y.; Berardi, U.; Akbari, H. Comparing the effects of urban heat island mitigation strategies for Toronto, Canada. Energy Build. 2016, 114, 2–19. [Google Scholar] [CrossRef]
- Taleghani, M. Outdoor thermal comfort by different heat mitigation strategies—A review. Renew. Sustain. Energy Rev. 2018, 81, 2011–2018. [Google Scholar] [CrossRef]
- Aram, F.; García, E.H.; Solgi, E.; Mansournia, S. Urban green space cooling effect in cities. Heliyon 2019, 5, e01339. [Google Scholar] [CrossRef] [PubMed]
- Smithers, R.J.; Doick, K.J.; Burton, A.; Sibille, R.; Steinbach, D.; Harris, R.; Groves, L.; Blicharska, M. Comparing the relative abilities of tree species to cool the urban environment. Urban Ecosyst. 2018, 21, 851–862. [Google Scholar] [CrossRef]
- Chen, X.; Zhao, P.; Hu, Y.; Ouyang, L.; Zhu, L.; Ni, G. Canopy transpiration and its cooling effect of three urban tree species in a subtropical city- Guangzhou, China. Urban For. Urban Green. 2019, 43, 126368. [Google Scholar] [CrossRef]
- Kotzen, B. An investigation of shade under six different tree species of the Negev desert towards their potential use for enhancing micro-climatic conditions in landscape architectural development. J. Arid. Environ. 2003, 55, 231–274. [Google Scholar] [CrossRef]
- Rahman, M.A.; Moser-Reischl, A.; Rötzer, T.; Pauleit, S. Within canopy temperature differences and cooling ability of Tilia cordata trees grown in urban conditions. Build. Environ. 2017, 114, 118–128. [Google Scholar] [CrossRef]
- Shashua-Bar, L.; Pearlmutter, D.; Erell, E. The cooling efficiency of urban landscape strategies in a hot dry climate. Landsc. Urban Plan. 2009, 92, 179–186. [Google Scholar] [CrossRef]
- Gillner, S.; Vogt, J.; Tharang, A.; Dettmann, S.; Roloff, A. Role of street trees in mitigating effects of heat and drought at highly sealed urban sites. Landsc. Urban Plan. 2015, 143, 33–42. [Google Scholar] [CrossRef]
- Sanusi, R.; Johnstone, D.; May, P.; Livesley, S.J. Microclimate benefits that different street tree species provide to sidewalk pedestrians relate to differences in Plant Area Index. Landsc. Urban Plan. 2017, 157, 502–511. [Google Scholar] [CrossRef]
- Armson, D.; Rahman, M.A.; Ennos, A.R. A Comparison of the Shading Effectiveness of Five Different Street Tree Species in Manchester, UK. Arboric. Urban For. 2013, 39, 157–164. [Google Scholar]
- Morakinyo, T.E.; Kong, L.; Lau, K.K.L.; Yuan, C.; Ng, E. A study on the impact of shadow-cast and tree species on in-canyon and neighborhood’s thermal comfort. Build. Environ. 2017, 115, 1–17. [Google Scholar] [CrossRef]
- Ziter, C.; Pedersen, E.J.; Kucharik, C.J.; Turner, M. Scale-dependent interactions between tree canopy cover and impervious surfaces reduce daytime urban heat during summer. Proc. Natl. Acad. Sci. USA 2019, 116, 7575–7580. [Google Scholar] [CrossRef] [PubMed]
- Coutts, A.M.; White, E.C.; Tapper, N.J.; Beringer, J.; Livesley, S.J. Temperature and human thermal comfort effects of street trees across three contrasting street canyon environments. Theor. Appl. Clim. 2015, 124, 55–68. [Google Scholar] [CrossRef]
- Mussetti, G.; Brunner, D.; Henne, S.; Allegrini, J.; Krayenhoff, E.S.; Schubert, S.; Feigenwinter, C.; Vogt, R.; Wicki, A.; Carmeliet, J. COSMO-BEP-Tree v1.0: A coupled urban climate model with explicit representation of street trees. Geosci. Model Dev. 2020, 13, 1685–1710. [Google Scholar] [CrossRef]
- Souch, C.A.; Souch, C. The effect of trees on summertime below canopy urban climates: A case study Bloomington, Indiana. J. Arboric. 1993, 19, 303–312. [Google Scholar]
- Bureau of Meteorology. Special Climate Statement 73—Extreme heat and fire weather in December 2019 and January 2020. 2020. Available online: http://www.bom.gov.au/climate/current/statements/scs73.pdf (accessed on 15 June 2020).
- Sidiqui, P.; Huete, A.; Devadas, R. Spatio-temporal mapping and monitoring of Urban Heat Island patterns over Sydney, Australia using MODIS and Landsat-8. In Proceedings of the 2016 4th International Workshop on Earth Observation and Remote Sensing Applications (EORSA), Guangzhou, China, 4–6 July 2016; pp. 217–221. [Google Scholar] [CrossRef]
- Speak, A.; Montagnani, L.; Wellstein, C.; Zerbe, S. The influence of tree traits on urban ground surface shade cooling. Landsc. Urban Plan. 2020, 197, 103748. [Google Scholar] [CrossRef]
- Rahman, M.A.; Moser, A.; Rötzer, T.; Pauleit, S. Microclimatic differences and their influence on transpirational cooling of Tilia cordata in two contrasting street canyons in Munich, Germany. Agric. For. Meteorol. 2017, 232, 443–456. [Google Scholar] [CrossRef]
- Santamouris, M.; Haddad, S.; Fiorito, F.; Osmond, P.; Ding, L.; Prasad, D.; Zhai, X.; Wang, R. Urban Heat Island and Overheating Characteristics in Sydney, Australia. An Analysis of Multiyear Measurements. Sustainability 2017, 9, 712. [Google Scholar] [CrossRef]
- Jacobs, B.; Mikhailovich, N.; Delaney, C. Where Are All the Trees? An Analysis of Tree Canopy Cover in Urban Australia; Institute for Sustainable Futures, University of Technology: Sydney, Australia, 2014. [Google Scholar]
- Middel, A.; Krayenhoff, E.S. Micrometeorological determinants of pedestrian thermal exposure during record-breaking heat in Tempe, Arizona: Introducing the MaRTy observational platform. Sci. Total. Environ. 2019, 687, 137–151. [Google Scholar] [CrossRef] [PubMed]
- Coutts, A.M.; Harris, R.J.; Phan, T.; Livesley, S.J.; Williams, N.S.G.; Tapper, N.J. Thermal infrared remote sensing of urban heat: Hotspots, vegetation, and an assessment of techniques for use in urban planning. Remote. Sens. Environ. 2016, 186, 637–651. [Google Scholar] [CrossRef]


© 2020 by the authors. Licensee MDPI, Basel, Switzerland. This article is an open access article distributed under the terms and conditions of the Creative Commons Attribution (CC BY) license (http://creativecommons.org/licenses/by/4.0/).