Article

Combining Climate Change Mitigation Scenarios with Current Forest Owner Behavior: A Scenario Study from a Region in Southern Sweden

1
Southern Swedish Forest Research Centre, Swedish University of Agricultural Sciences, Sundsvägen 3, SE-230 53 Alnarp, Sweden
2
Department of Forest Resource Management, Swedish University of Agricultural Sciences, SE-901 83 Umeå, Sweden
3
International Institute for Applied Systems Analysis (IIASA), Schlossplatz 1, A-2361 Laxenburg, Austria
4
Current affiliation: European Commission, Joint Reseach Centre, Via E. Fermi 2749 – TP 261, I-21027 Ispra (VA), Italy
*
Author to whom correspondence should be addressed.
Forests 2020, 11(3), 346; https://doi.org/10.3390/f11030346
Submission received: 1 February 2020 / Revised: 17 March 2020 / Accepted: 18 March 2020 / Published: 20 March 2020

Abstract

:
This study investigates the need for change of current forest management approaches in a southern Swedish region within the context of future climate change mitigation through empirically derived projections, rather than forest management according to silvicultural guidelines. Scenarios indicate that climate change mitigation will increase global wood demand. This might call for adjustments of well-established management approaches. This study investigates to what extent increasing wood demands in three climate change mitigation scenarios can be satisfied with current forest management approaches of different intensities in a southern Swedish region. Forest management practices in Kronoberg County were mapped through interviews, statistics, and desk research and were translated into five different management strategies with different intensities regulating management at the property level. The consequences of current practices, as well as their intensification, were analyzed with the Heureka Planwise forest planning system in combination with a specially developed forest owner decision simulator. Projections were done over a 100-year period under three climate change mitigation scenarios developed with the Global Biosphere Management Model (GLOBIUM). Current management practices could meet scenario demands during the first 20 years. This was followed by a shortage of wood during two periods in all scenarios unless rotations were reduced. In a longer timeframe, the wood demands were projected to be easily satisfied in the less ambitious climate change mitigation scenarios. In contrast, the demand in the ambitious mitigation scenario could not be met with current management practices, not even if all owners managed their production forests at the intensive extreme of current management approaches. The climate change mitigation scenarios provide very different trajectories with respect to future drivers of forest management. Our results indicate that with less ambitious mitigation efforts, the relatively intensive practices in the study region can be softened while ambitious mitigation might push for further intensification.

1. Introduction

Scenario studies investigate probable, possible, or preferable futures to provide information relevant for the needs of the users [1]. Scenario modelling of forest management often involves projecting the future provisioning of ecosystem services at the landscape level with different management alternatives in decision support systems (DSS), with or without changes in external drivers [2,3].
A recent review of scenario studies in forest management found a strong focus on climate change [4]. This is not surprising, considering uncertainties regarding the level of future warming and the potential associated effects on forests and forestry [5]. Climate change also calls for various changes in forest management, such as adaptation strategies to address climate-related hazards [6], and mitigation strategies aiming to maintain or enhance forest carbon stocks and the associated carbon sinks [7]. Studies indicate that ambitious climate change mitigation through fossil fuel substitution will drastically increase global wood demand, which in turn will require intensified management of forest resources globally [8,9]. In addition, more intensive management can yield further emission reductions by enabling the replacement of carbon-intensive materials with renewable wood (e.g., increased house building with wood) [10].
Another trend in forest scenario modelling is an increased recognition that more realistic assumptions regarding forest owners’ behavior are needed to increase the quality of the projection results [3,11,12]. “Yield table harvesting” for maximum production has been a frequent assumption in these types of studies. However, such guidelines have a limited value in explaining actual forest management practices across Europe [13].
Some scenario studies following the new trend have solely focused on including empirically grounded specifications reflecting current owner behavior without considering changes in external drivers (e.g., [14,15,16]). As a recent example, Eggers et al. [16] accounted for the diversity of management strategies among owners when projecting the provisioning of ecosystem services in two Swedish municipalities. The results clearly showed that detailed differentiation of owners’ management behavior makes a difference when projecting ecosystem services. However, the authors reported that the translation of management strategies into rules for different silvicultural treatments involved subjective interpretation due to insufficient data. In addition, the owners’ different management strategies were projected as artificial proportions of the forestland, i.e., not on the properties of actual forest owners.
There are studies that account for the forest owner diversity within the frame of scenarios where external drivers are changing (e.g., forest policies, markets, societal values, climate mitigation goals) [2,12,17,18]. Applying this methodology implies starting with identifying influential external drivers, followed by an assessment of the responsiveness to changes in these drivers of the proportions of different owner types, as well as the forest management programs within each owner type [2,17,18]. The involved researchers report challenges with matching owner types and management programs [2], as well as with quantifying and allocating the different forest owner types in the projected landscapes [18], due to empirical data insufficiency. In addition, predicting “likely” changes of forest owner types and silvicultural treatments given different manifestations of external drivers is a very complex and challenging task [3], which in practice involves multiple steps of expert judgement [2,17].
Forest outlook studies are another type of scenario study that investigate the long-term consequences of forest management practices to provide input to policy processes, e.g., [9,19,20,21,22]. These studies account for the actual management practices to a varying degree. For example, in Sweden, the 100-year projections of the forest resource include empirically based settings for regeneration, pre-commercial thinning and nature conservation [21]. In contrast, the implementation of final fellings is far from current practices. To avoid constraining the defined utilization rate (felling/net increment), the final felling ages were set to 0.75 of the minimum ages in the Forestry Act in the latest study [21] (p. 26). As a result, from being approximately 110 years since the 1950s, the average age at final felling during the next 100 years were projected to decrease to 60–77 years depending on utilization scenario. Researchers using the harvest potentials from this study in their own research have found these theoretical harvest potentials ambitious, raising a question of whether they can be realized in practice [23].
Inspired by the recent focus on climate change in scenario modelling, along with the emergence of more realistic behavioral assumptions, the main aim of this study is to examine if current forest management practices can meet the projected wood demands in three different climate change mitigation scenarios. This can provide policy makers and practitioners with information regarding potential needs/possibilities to change forest management in the context of future climate change. To provide a reliable comparison point, what is “current” needs to reflect the actual practices among forest owners, rather than ideal management according to the dominant silvicultural guidelines. The study region of this paper, the forests of Kronoberg County in Southern Sweden, is part of a larger EU project, ALTERFOR (see [24]). The study region was chosen due to the dominance of ownership by small-scale private forest owners [25]. Due to the varied management priorities in this ownership group [26], along with previous research [16,27], it was expected that a more detailed representation of owners’ management behavior would make a difference.
Informed by the challenges described in our short literature review, our projections with current management practices include some innovations compared to earlier studies. Firstly, we have gathered a considerable amount of empirical data about actual management (e.g., statistics, interviews) to account for the current management and the projections have been done on the actual properties. Secondly, compared to other studies that accounted for a diverse ownership structure within the frames of scenarios [2,12,17,18], this study does not investigate “likely” responses of forest owners and managers given certain changes of external drivers. Instead, we contrast our projections of current management practices with two projections where all forest owners switch to management at the intensive extreme of current management approaches in the study region. This is done in light of the second aim of this study, which is to investigate the prospects of meeting the increasing demand for wood by increasing the management intensity within the frames of the currently widely used management approaches in the study region.

2. Materials and Methods

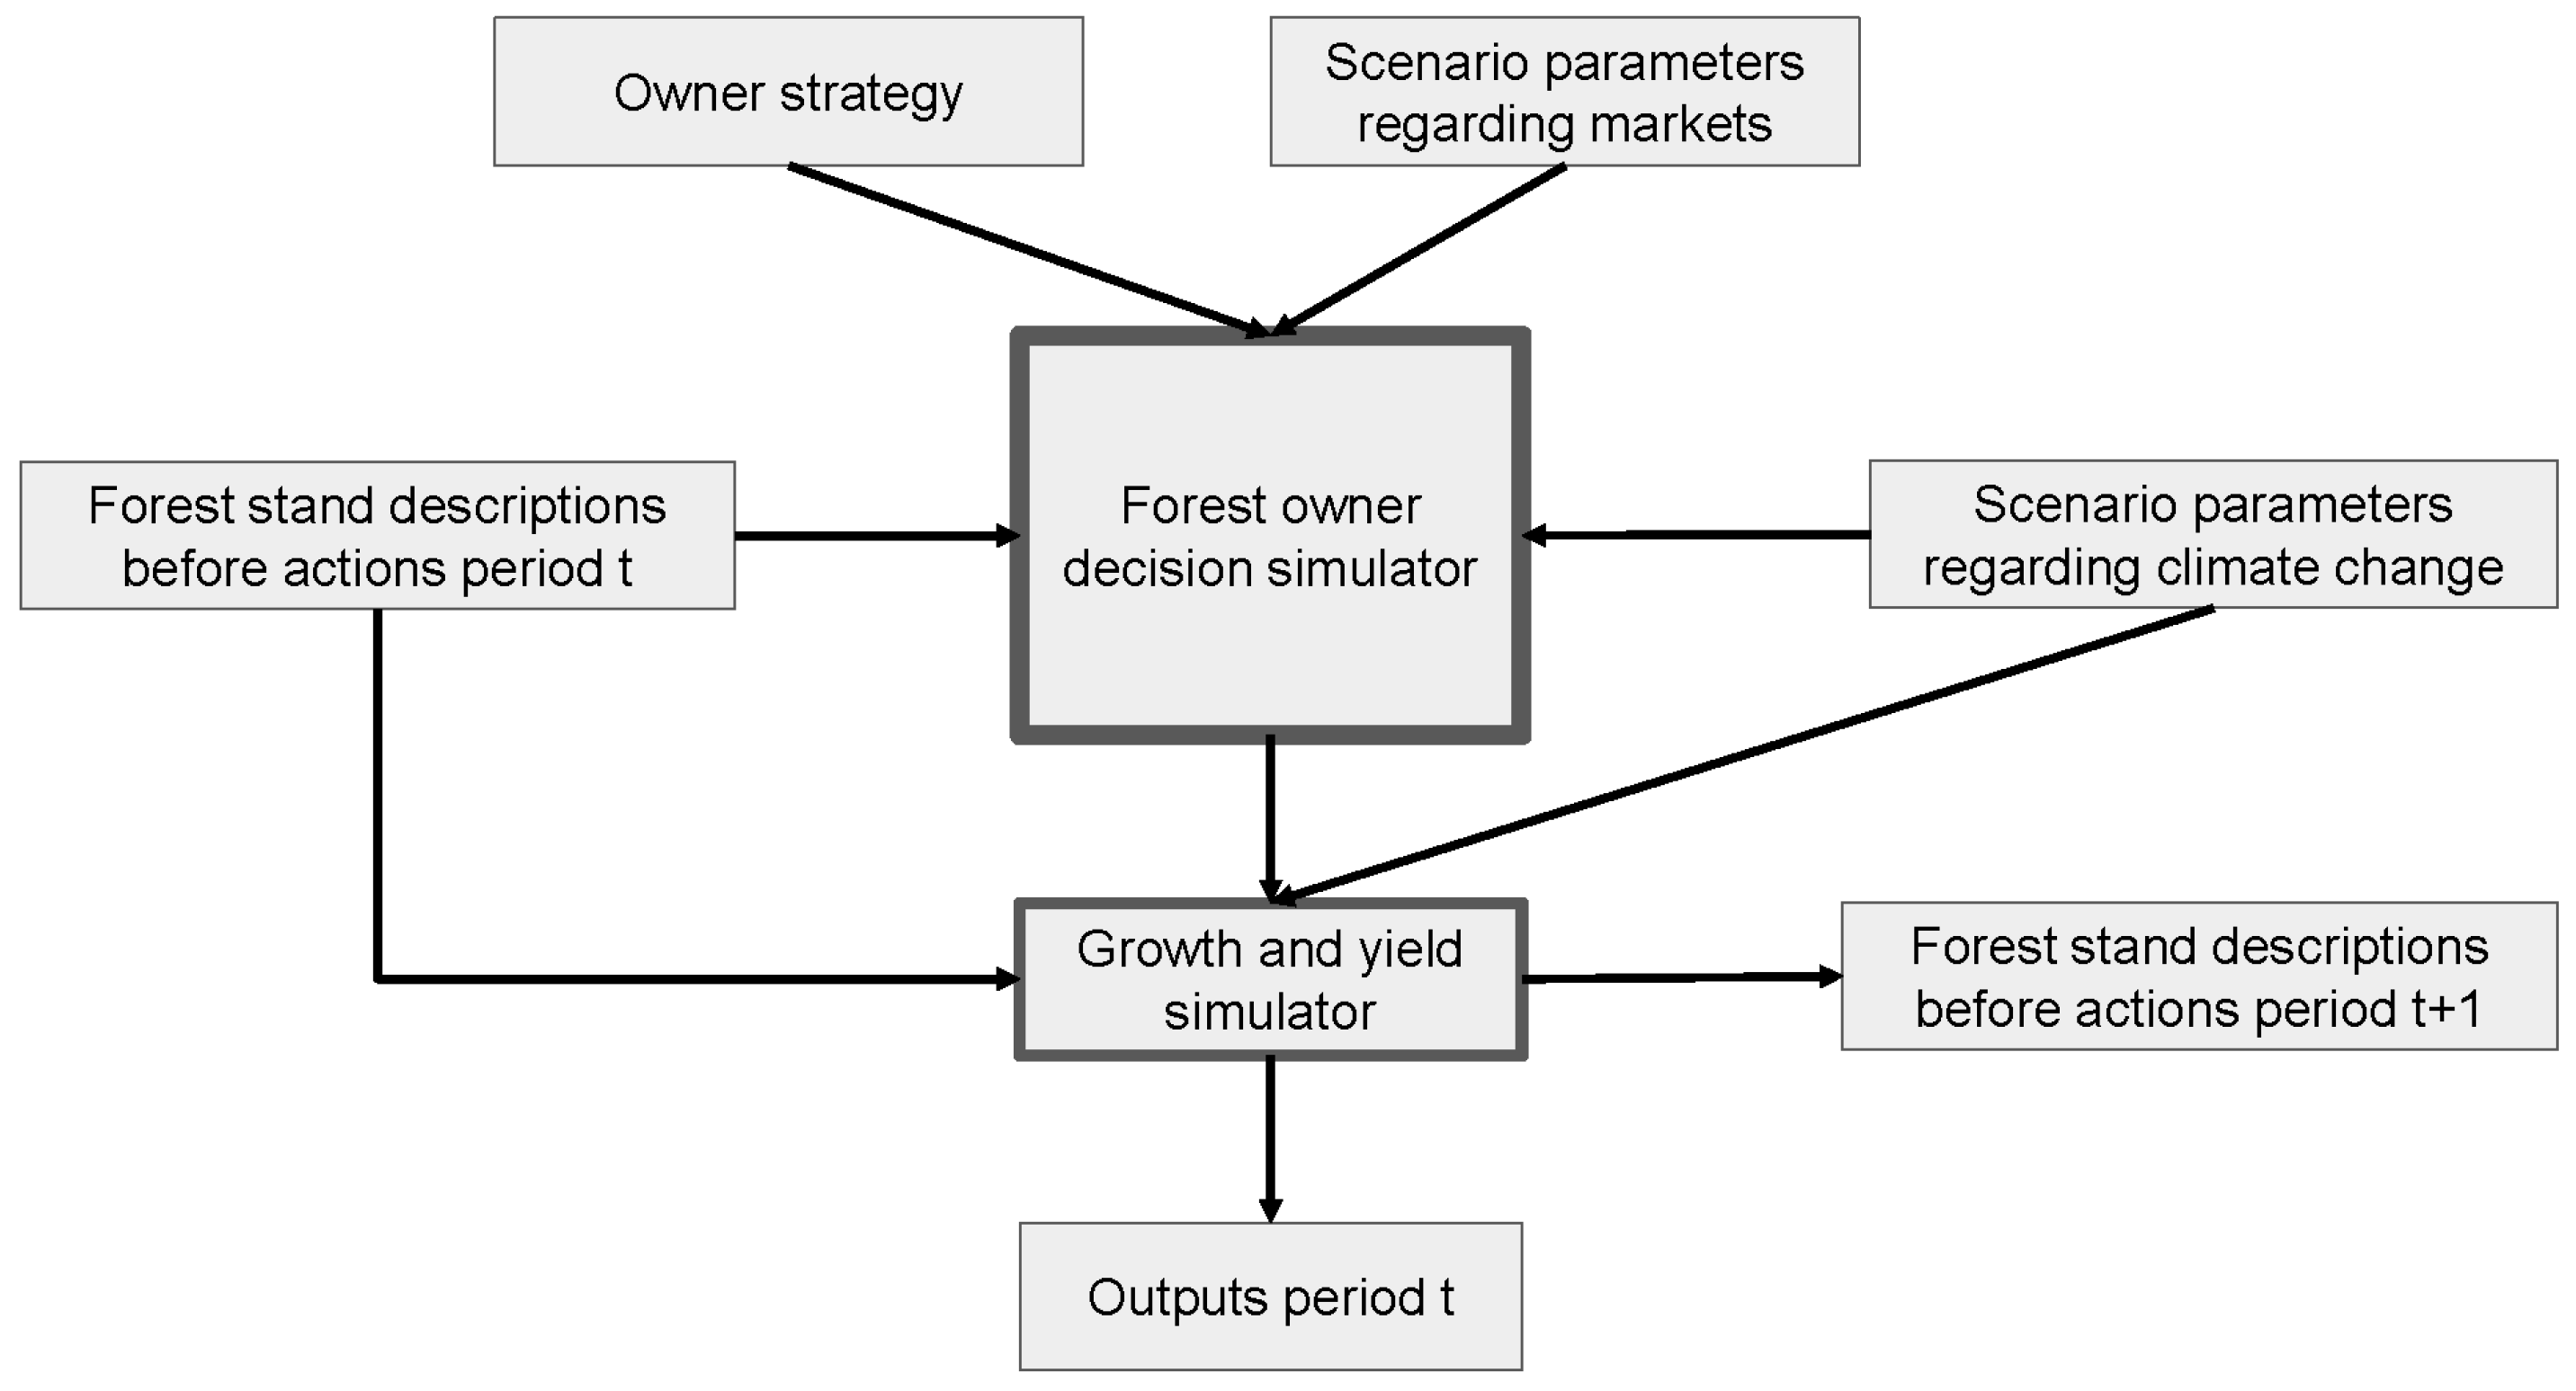
2.1. The Forest Simulator

In order to base the modelling of forest management in Kronoberg County on our empirical and statistical observations, a forest simulator was developed. The simulator operated with one forest owner on each property in each period. The actions of the different forest owners were coordinated with respect to the need to satisfy total wood demand that period. After simulating the actions on all properties, the state of stands in the next period were derived and the procedure was repeated. This section describes, firstly, the interconnected elements of the simulator, and secondly, the formulation of the forest owner decision problem, i.e., the core of the simulator.
The data and models that were involved in simulating the actions taken on one property in one period are depicted in Figure 1. The forest owner decision simulator operated on three general categories of input parameters; the state of the stands of the property, the strategy followed by the forest owner, and the scenario in terms of prices, demanded volumes, and assumed climate change. Once decisions on silvicultural treatments were derived for the stands, the decisions entered the growth and yield simulator. Together with scenario assumptions regarding climate change, the growth and yield simulator projected the state of each stand into the next period. Current period outputs in terms of harvest volumes and costs were also produced as a result of the simulation of treatments on the stands. Section 2.2 together with the supplementary material describes the forest data, Section 2.3.3 gives details on owner strategies, and Section 2.4 describes the climate change mitigation scenarios.
Turning to the forest owner decision simulator, its aim was to replicate how forests are currently managed by forest owners. There were two elements influencing forest owners, one referring to the strategy of the owner, the other referring to the timber markets. The strategy of a certain forest owner eliminated particular silvicultural treatments. This took two forms: by eliminating particular treatments for particular stands or by constraining the total activity on the property. An example of the first form is an owner following the passive strategy that would not be able to harvest a stand until after a considerable time after the minimum rotation age according to the Forestry Act. An example of the second form of constraint is the owner following the conservation strategy that must make pre-commercial thinning (hereafter PCT) on a certain share of the area eligible for the treatment. Among the second type of constraints were the rationing rules from the Forestry Act restricting the possibilities for final felling and applying to all forest properties larger than 50 ha (pp. 28–29) [28].
The other element, the timber markets, affected forest owners in two ways. One of those was current and future prices on sawlogs and pulpwood. Even though strategy and Forestry Act restricted the decision space for the owner there was still room for allocating silvicultural treatments among stands. To unambiguously determine the management action in each stand it was assumed that, among eligible stand treatments and within property wide constraints, the owner was assumed to choose the most economically profitable action. Profitability was defined in terms of net present value [29]. It was calculated for all production stands based on the net revenues of current and future periods of the current rotation added to the expected land value given the most profitable program for future rotations, using an interest rate of 3%. It was assumed that the forest owner used the prevailing climate change scenario for computing future stand conditions and the current period prices of the scenario for computing net revenues. Nature conservation thinning in set-asides with management were determined by random selection among available programs, and was thus not influenced by economic conditions.
The other way the market influenced forest owner decisions was through the current period wood demand as described by the scenario. In case the profitability criteria resulted in total harvest volumes above demand, the least profitable harvest options among forest owners were removed until the harvest volume equaled demand. In the opposite case, the least unprofitable harvest options were chosen until the demand was met or until no more could be extracted due to the combination of stand conditions and the constraints given by strategies under which owners operated.
Thus, the forest owner decision simulator for a specific period can be represented as an optimization problem to maximize the sum of net present values over all stands of all forest owners, subject to (i) the silvicultural treatments for each property given by the strategy, (ii) that the sum of final felling area for each property respect the stipulations of the Forestry Act, and (iii) that the sum of harvest volume over all stands of all properties being equal to demand according to the scenario. The problem was formulated and solved as a mixed linear programming (MILP) problem (see Table A1 and Table A2).

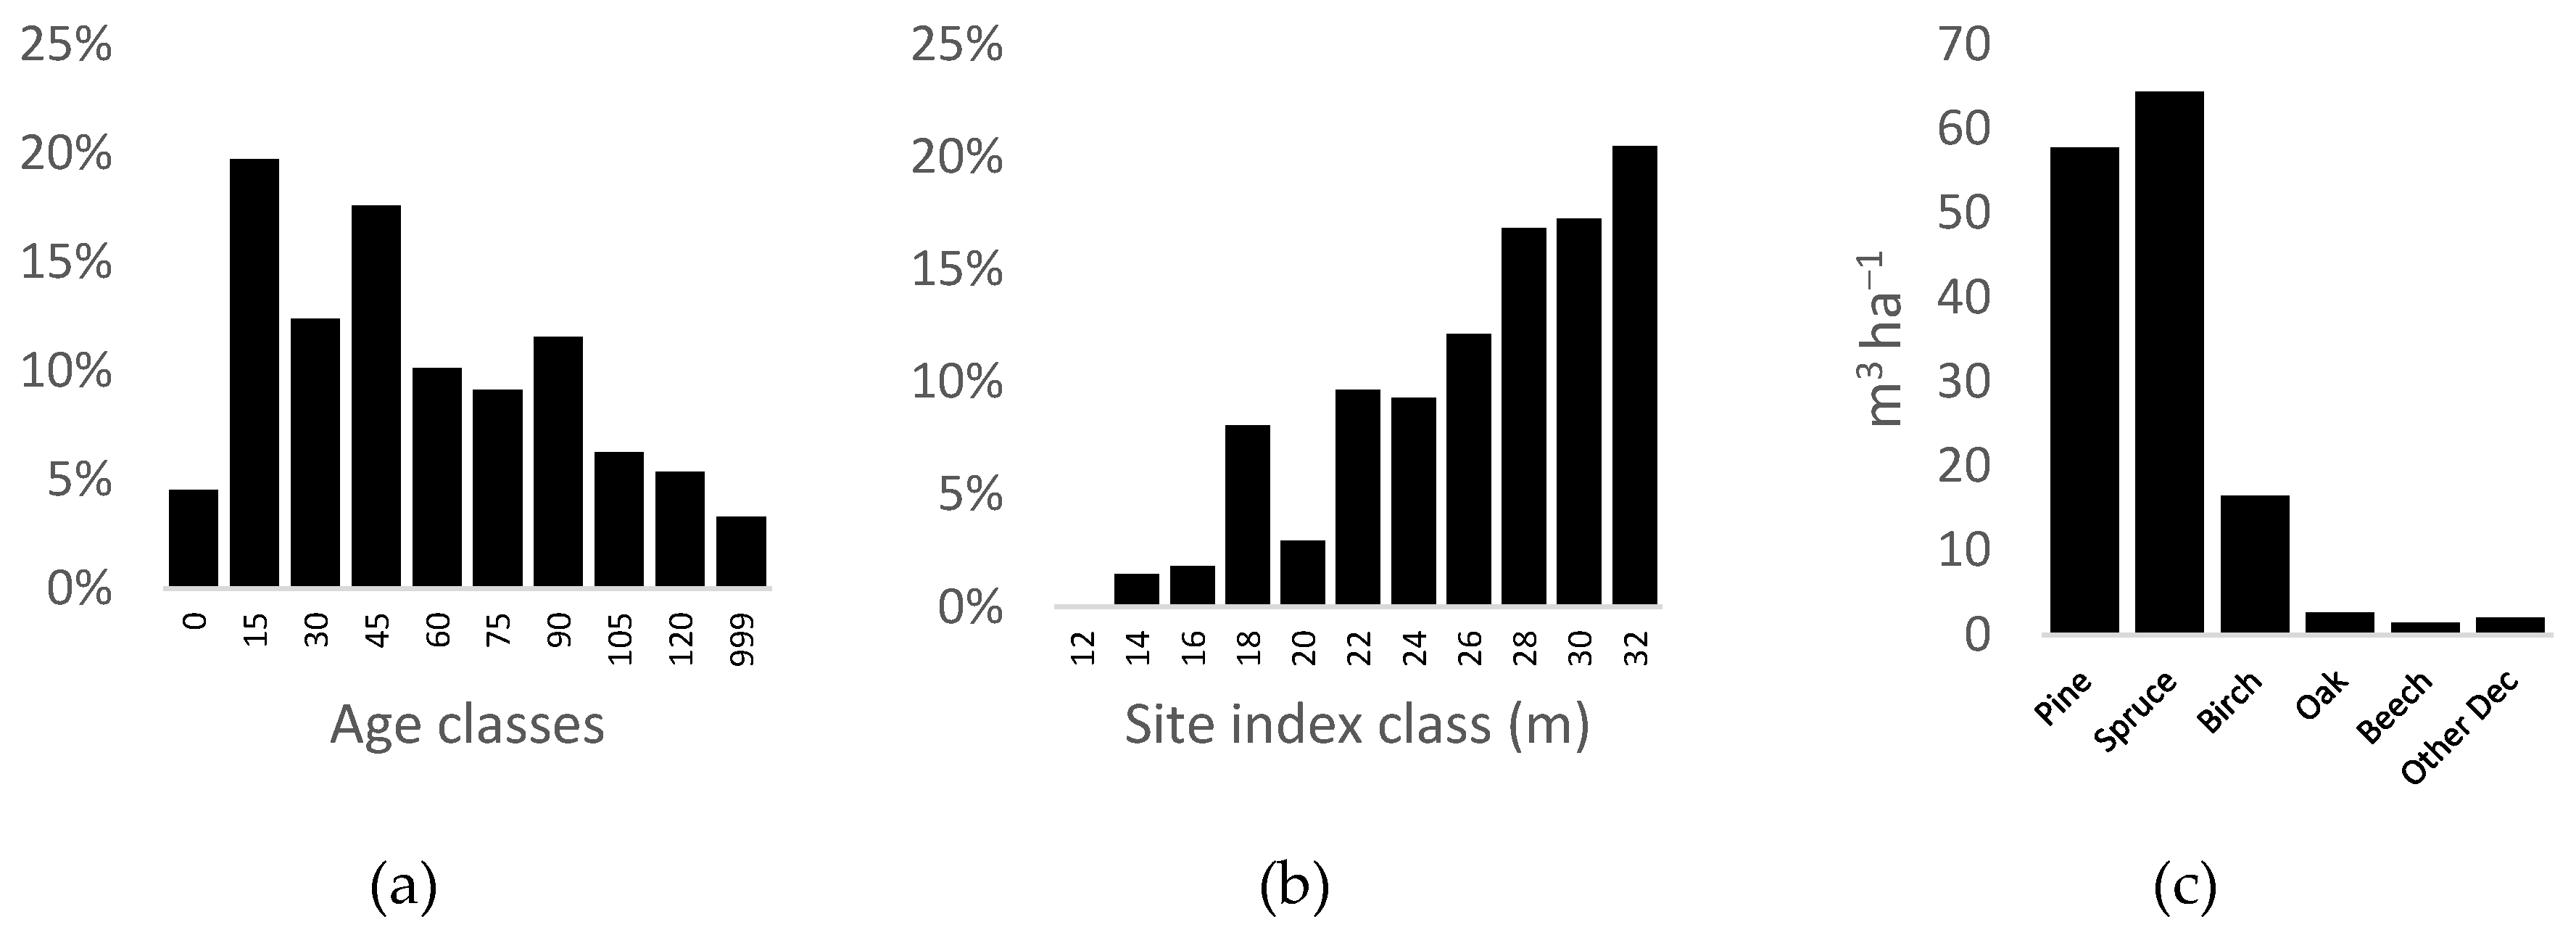
2.2. Forest Data and Forest Projection System

The area of productive forestland (>1 m3ha−1year−1) in Kronoberg County is about 650 thousand ha. In order to limit computations, 10 contiguous areas were sampled from a set of ranger districts to represent Kronoberg. After GIS processing and stand delimitation of stands (see Supplementary material for details) the sample had a total of 836 properties with 50,176 stands covering a productive forest area of 58,389 ha (for some features of the forest see Figure 2).
Projections were made for a 100-year projection period divided into 20 five-year-planning periods. Projections of forest stand development were performed with the Heureka forest planning system, interface Planwise [30,31], which encompasses a complete set of growth and yield models that are based on single tree data. All costs but harvesting costs were calculated with Heureka. For thinning (also nature conservation thinning in set-asides with management) and final felling the cost of harvester and cost of forwarder were assessed with Nurminen et al. [32] where saw timber and pulpwood volumes were computed with functions from Ollas [33].

2.3. Current Forest Management Practices

2.3.1. Overview of Forest Management in Kronoberg

Forest management practices in Kronoberg County are typical for small-scale forestry of southern Sweden, where private forest owners control approx. 80% of the productive forestland [25]. Southern Sweden is a “hot-spot” of intensive forestry at the European level [13,34]. However, there is still some diversity in the management intensity.
The native conifers, Scots pine (Pinus sylvestris) and Norway spruce (Picea abies) are managed with even-aged management. In regeneration, owners tend to plant Norway spruce also on typical pine sites due to the fear of browsing damages [35] resulting in only approximately 12% of pine regeneration according to recent statistics [36,37,38,39,40]. There is a certain share of failed regeneration, which do not fulfill the minimum seedling density requirements in the Forestry act (7% in 2011/12–2015/16) [41]. An experienced forest consultant at the Swedish Forest Agency (hereafter the SFA) estimated that the SFA succeed in enforcing planting on approximately half of the not approved area. Some areas that are easy to regenerate through natural regeneration (especially wetter areas), are left without any measure after harvest, in total corresponding to approximately 9% of the regenerated area (called “Other natural regeneration” in the statistics) [41]. The remaining part of the management cycle (i.e., pre-commercial thinning, thinning and final felling) is characterized by a varied management intensity due to inter alia different owner objectives and priorities [26,27]. To exemplify, 25% of the young forest area is never treated with PCT [21] and the rotation periods often tend to be longer than what is recommended in standard guidelines [42]. Logging residues are often extracted at final felling, especially in association with the final felling of Norway spruce on sites without high soil moisture.
There are formal set-asides for conservation purposes involving financial compensation to owners (e.g., nature reserves, nature conservation agreements), as well as voluntary set-asides (with/without management) which are required for owners who want to certify their properties with FSC (Forest Stewardship Council) and/or PEFC (Programme for the Endorsement of Forest Certification) [43,44]. Based on recent statistics [45,46], set-asides constitute approximately 8% of the productive forestland (2% formal and 6% voluntary). Owners also leave retention patches (approximately 6% of the felled area), living trees (13 trees/ha) and create high stumps (4 high stumps/ha) at final felling for conservation purposes [21].

2.3.2. Sources and Methods Used to Describe Current Management Practices

Multiple sources were used to map current practices including interviews with forest consultants from the SFA and wood-buyers from industrial actors, statistics and reports from the SFA, and information about nature conservation from the forest owner association, Södra members’ forest management plans in Kronoberg County (Table 1).
In Sweden, the legislation has few detailed requirements and forest owners have large freedom in the management of their forests [48]. In addition, having a forest management plan is voluntary and the management proposals are not obligatory to follow [49]. The governance model is thus characterized by soft policy tools such as information and advice, which are mainly provided by regionally stationed forest consultants and wood-buyers [49,50,51]. With their direct involvement in private owners’ decision-making processes, these advisors possess a wealth of practical knowledge about forest management practices among private forest owners. Due to this, they were interviewed to get an overview about the current forest management practices in the county.
The selection procedure was targeted towards finding a group of advisors with: (i) a long working experience, (ii) representing different organizations, (iii) working in different areas of the county. Assisted by senior managers from the three participating organizations (the SFA, Södra and the wood procurement company Sydved), thirteen potential advisors were identified, all of whom agreed to participate. The twelve interviews (two consultants took part in the same interview) were conducted between 6 and 22 February 2017 at the workplace of the interviewees. The tape-recorded interviews lasting between 1 h 30 min and 3 h 10 min which were transcribed in full length. The interviews covered a wide range of topics related to forest management among private forest owners (see the interview guide in supplementary material). The part used in this study addressed different forest owner types, variation in the practical execution of the dominant silvicultural system within the county (the clearcutting system with Norway spruce/Scots pine), as well as some questions regarding other silvicultural treatments.

2.3.3. Silvicultural Treatments and Owner Strategies for the Projections

Based on information about current management obtained from the sources described in Section 2.3.2 a set of treatments in the Heureka system were defined, which are described in Table 2. This process involved excluding some approaches (e.g., planting of exotic species, planting of native broadleaves, continuous cover forestry in ordinary production stands) that are currently used in Kronoberg, but only to a limited extent.
Five different owner strategies were defined and used in the projections with current management practices. These strategies were based on previous research about management strategies among small-scale forest owners by Eggers et al. [16,27]. The strategies were updated based on information from the interviewed advisors and other sources used to map forest management in Kronoberg (see Section 2.3.2). Following is a short description of the different strategies.
The Intensive strategy implies management according to silvicultural guidelines in line with the “management for profit” paradigm [52] promoted by influential actors in the Swedish forest sector (e.g., forest owner associations, large forest companies). This strategy is characterized by high activity in all silvicultural treatments and, in order to keep a high return on invested capital, the rotations are kept short. The productivity strategy is overall very similar, but there is less emphasis on keeping a high return on invested capital, resulting in slightly longer rotations. The save strategy represents owners with a lower interest in wood harvest and those who want to increase the standing stock for the future, e.g., to leave harvest opportunities for the next generation. Rotations are therefore kept longer. In addition, there is a lower activity in other silvicultural treatments. The conservation strategy represents owners whose applied forest management practices are influenced by large interest in nature values. Consequently, the share of set-asides is higher, natural regeneration is used to a higher extent to avoid scarification and promote establishment of broadleaves, PCT and thinning are devised to promote broadleaves at the expense of conifers, and the rotations are longer. The overall level of activity in silviculture is similar to the save strategy. The passive strategy represents owners characterized by a low level of activity due to inter alia lacking interest in forest management. The regeneration quality is low, no PCTs are conducted and the rotations are very long. Table 3 provides a more detailed description of the treatment settings for the five different forest management strategies.
All properties were assigned an owner strategy through the following procedure. Firstly, all properties owned by individual private forest owners (78.3% of the productive forestland) were assigned a strategy according to probabilities in line with the proportions in Table 4 in Eggers et al. [16]. In short, the positive relation between property size and management intensity [27] implied that the probability in receiving Intensive and Productivity increased with increasing property size. Secondly, properties owned by municipalities (3.3% of the productive forestland) were assigned the Conservation strategy, thereby accounting for a likely stronger emphasis on nature and recreational objectives in the management of these forests. Finally, organizations/companies own 18.4% of the productive forestland in the 10 areas, most of it owned by larger production-oriented owners such as the state forest company Sveaskog, the forest owner association Södra and the Swedish church. In this group, properties above 50 ha were assigned the intensive strategy (18.1%), while properties smaller than 50 ha received the passive strategy (0.3%). The resulting strategy distribution that was used in the projections with current forest management practices is shown in Table 4. Based on the strategy distribution, strategy settings were tuned in order to make sure that the management outcome was in line with the target proportions for different silvicultural treatments obtained from statistics (see Table 1).

2.4. Climate Change Mitigation Scenarios

Three climate change mitigation scenarios were used in this study (see [53] for more details). They were prepared using GLOBIOM [9,54], which is a global recursive dynamic partial equilibrium model of the forest, agricultural, and bio-energy sectors. The equilibrium refers to that markets are cleared, i.e., supply and demand on different markets were equal in each time period. The supply side combines management alternatives with the availability of land (land cover and land use) to meet demand. Demand is a function of assumptions of the development of populations, gross domestic products, consumer preferences, and policy targets. The trade of commodities between regions is covered by bilateral trade flows, meaning that the model explicitly tracks which countries are importing and exporting for each individual trade. The GLOBIOM version used for this assessment has 53 regions, in which each individual EU member state is accounted for.
The three scenarios cover a wide range of future trajectories for the global development of climate change mitigation efforts, economic growth, population development and overall use of natural resources. The scenarios were based on analysis of policy targets for the European Union [22], combined with the RCP (Representative Concentration Pathways) - SSP (Shared Socioeconomic Pathway) framework developed for the International Panel for Climate Change (IPCC) [55]. The scenarios represent futures with different levels of ambition in climate change mitigation, resulting in different levels of climate warming. A key assumption pertaining to all scenarios is that more ambitious climate change mitigation will require more wood to substitute carbon intensive fuels and materials.
The REFERENCE scenario (see [53]) takes into account the EU climate policies and targets until 2020 that were in place in 2016, thereafter continuing according to historical development without any further policy intervention. The global temperature is assumed to be about 3.7 °C higher by 2100 than the pre-industrial level.
The EU BIOENERGY scenario is characterized by a rapid development of the bioenergy sector in Europe, taking into account EU policies that aim at an 80% reduction in emissions by 2050. In addition, the scenario assumes some climate policies to be in place on a global level, so that the global temperature will be about 2.5 degrees Celsius higher by 2100 than that of pre-industrial level.
In the GLOBAL BIOENERGY scenario, very ambitious climate policies are assumed to be taken into action globally, with both stringent EU policies and strong global climate mitigation. Consequently, the global temperature will only be about 1.5 °C higher by 2100 than the pre-industrial level.
The scenarios influenced the results for Kronoberg County through climate, market demand and prices for wood [53]. The impact of climate change on growth was projected through the climate change scenarios as implemented in Heureka [56]. The climate scenario with radiative forcing RCP8.5 formed the basis for the climate impact in REFERENCE and RCP4.5 for scenario EU BIOENERGY. In Sweden, the growth is projected to increase with increasing warming. In the recent Swedish forest outlook study conducted with Heureka, the positive effect on growth by the end of the century in southern Sweden corresponded to 19% and 36% for RCP4.5 and RCP8.5 respectively [56] (p. 26). For the GLOBAL BIOENERGY scenario, the Heureka system does not have a corresponding climate effect. Instead, it was assumed that forest growth would be unaffected by climate change.
When downscaling the national roundwood demands in the scenarios we assumed that the local demands would follow the projected national trends in the scenarios. The projected demands for each 5-year period were interpolated from the 10-year period scenario figures. For the last two periods, the demands were assumed to stay on the same level as in 2100. The resulting trends for the roundwood demand in the study region in the three scenarios are shown in Figure 3. The lower demand in scenario EU BIOENERGY than in REFERENCE is due to trade within and outside the EU sector. The roundwood demand in the first period was set to 81.6% of the gross increment on all productive forestland, reflecting the felling intensity (excluding felling in PCT since this treatment don’t yield any commercial roundwood) in southern Sweden during 2006/2007–2015/2016 (calculations based on figures in [57] (p.45–46, 129) and [58]).
Prices paid to owners were represented by prices at mill gate for timber and pulpwood, computed by subtracting transport cost [59,60,61] from scenario prices and interpolated in the same way as for the roundwood demand (Table 5). No scenario price for residues was available and was set to 14 SEK m−3 o.b. [62].

3. Results

The current forest management practices as described in Section 2.3.3 were projected in all three climate change mitigation scenarios REFERENCE, EU BIOENERGY, and GLOBAL BIOENERGY and here referred to as Current_REF, Current_EU, and Current_GLOBAL respectively. Two additional projections were done for the GLOBAL BIOENERGY scenario. The purpose of the two latter projections were to analyze to which extent the big increase in demand in this scenario could be satisfied with an intensification within the frames of the currently used forest management approaches. One projection, Intensive_GLOBAL, presumed that all properties were managed according to the settings for the Intensive strategy (e.g., no RE4, 100% PCT, shorter rotations). The other projection, Intensive_Short_GLOBAL, presumed that, in addition to Intensive_GLOBAL, final fellings were allowed from the minimum age stipulated in the Forestry Act. The net area used for wood production (i.e., excluding set-asides and retention areas in production stands) in these two projections remained basically the same as in the projections with current management practices (it increased from 84.6% to 84.9% due to the removal of the conservation strategy).

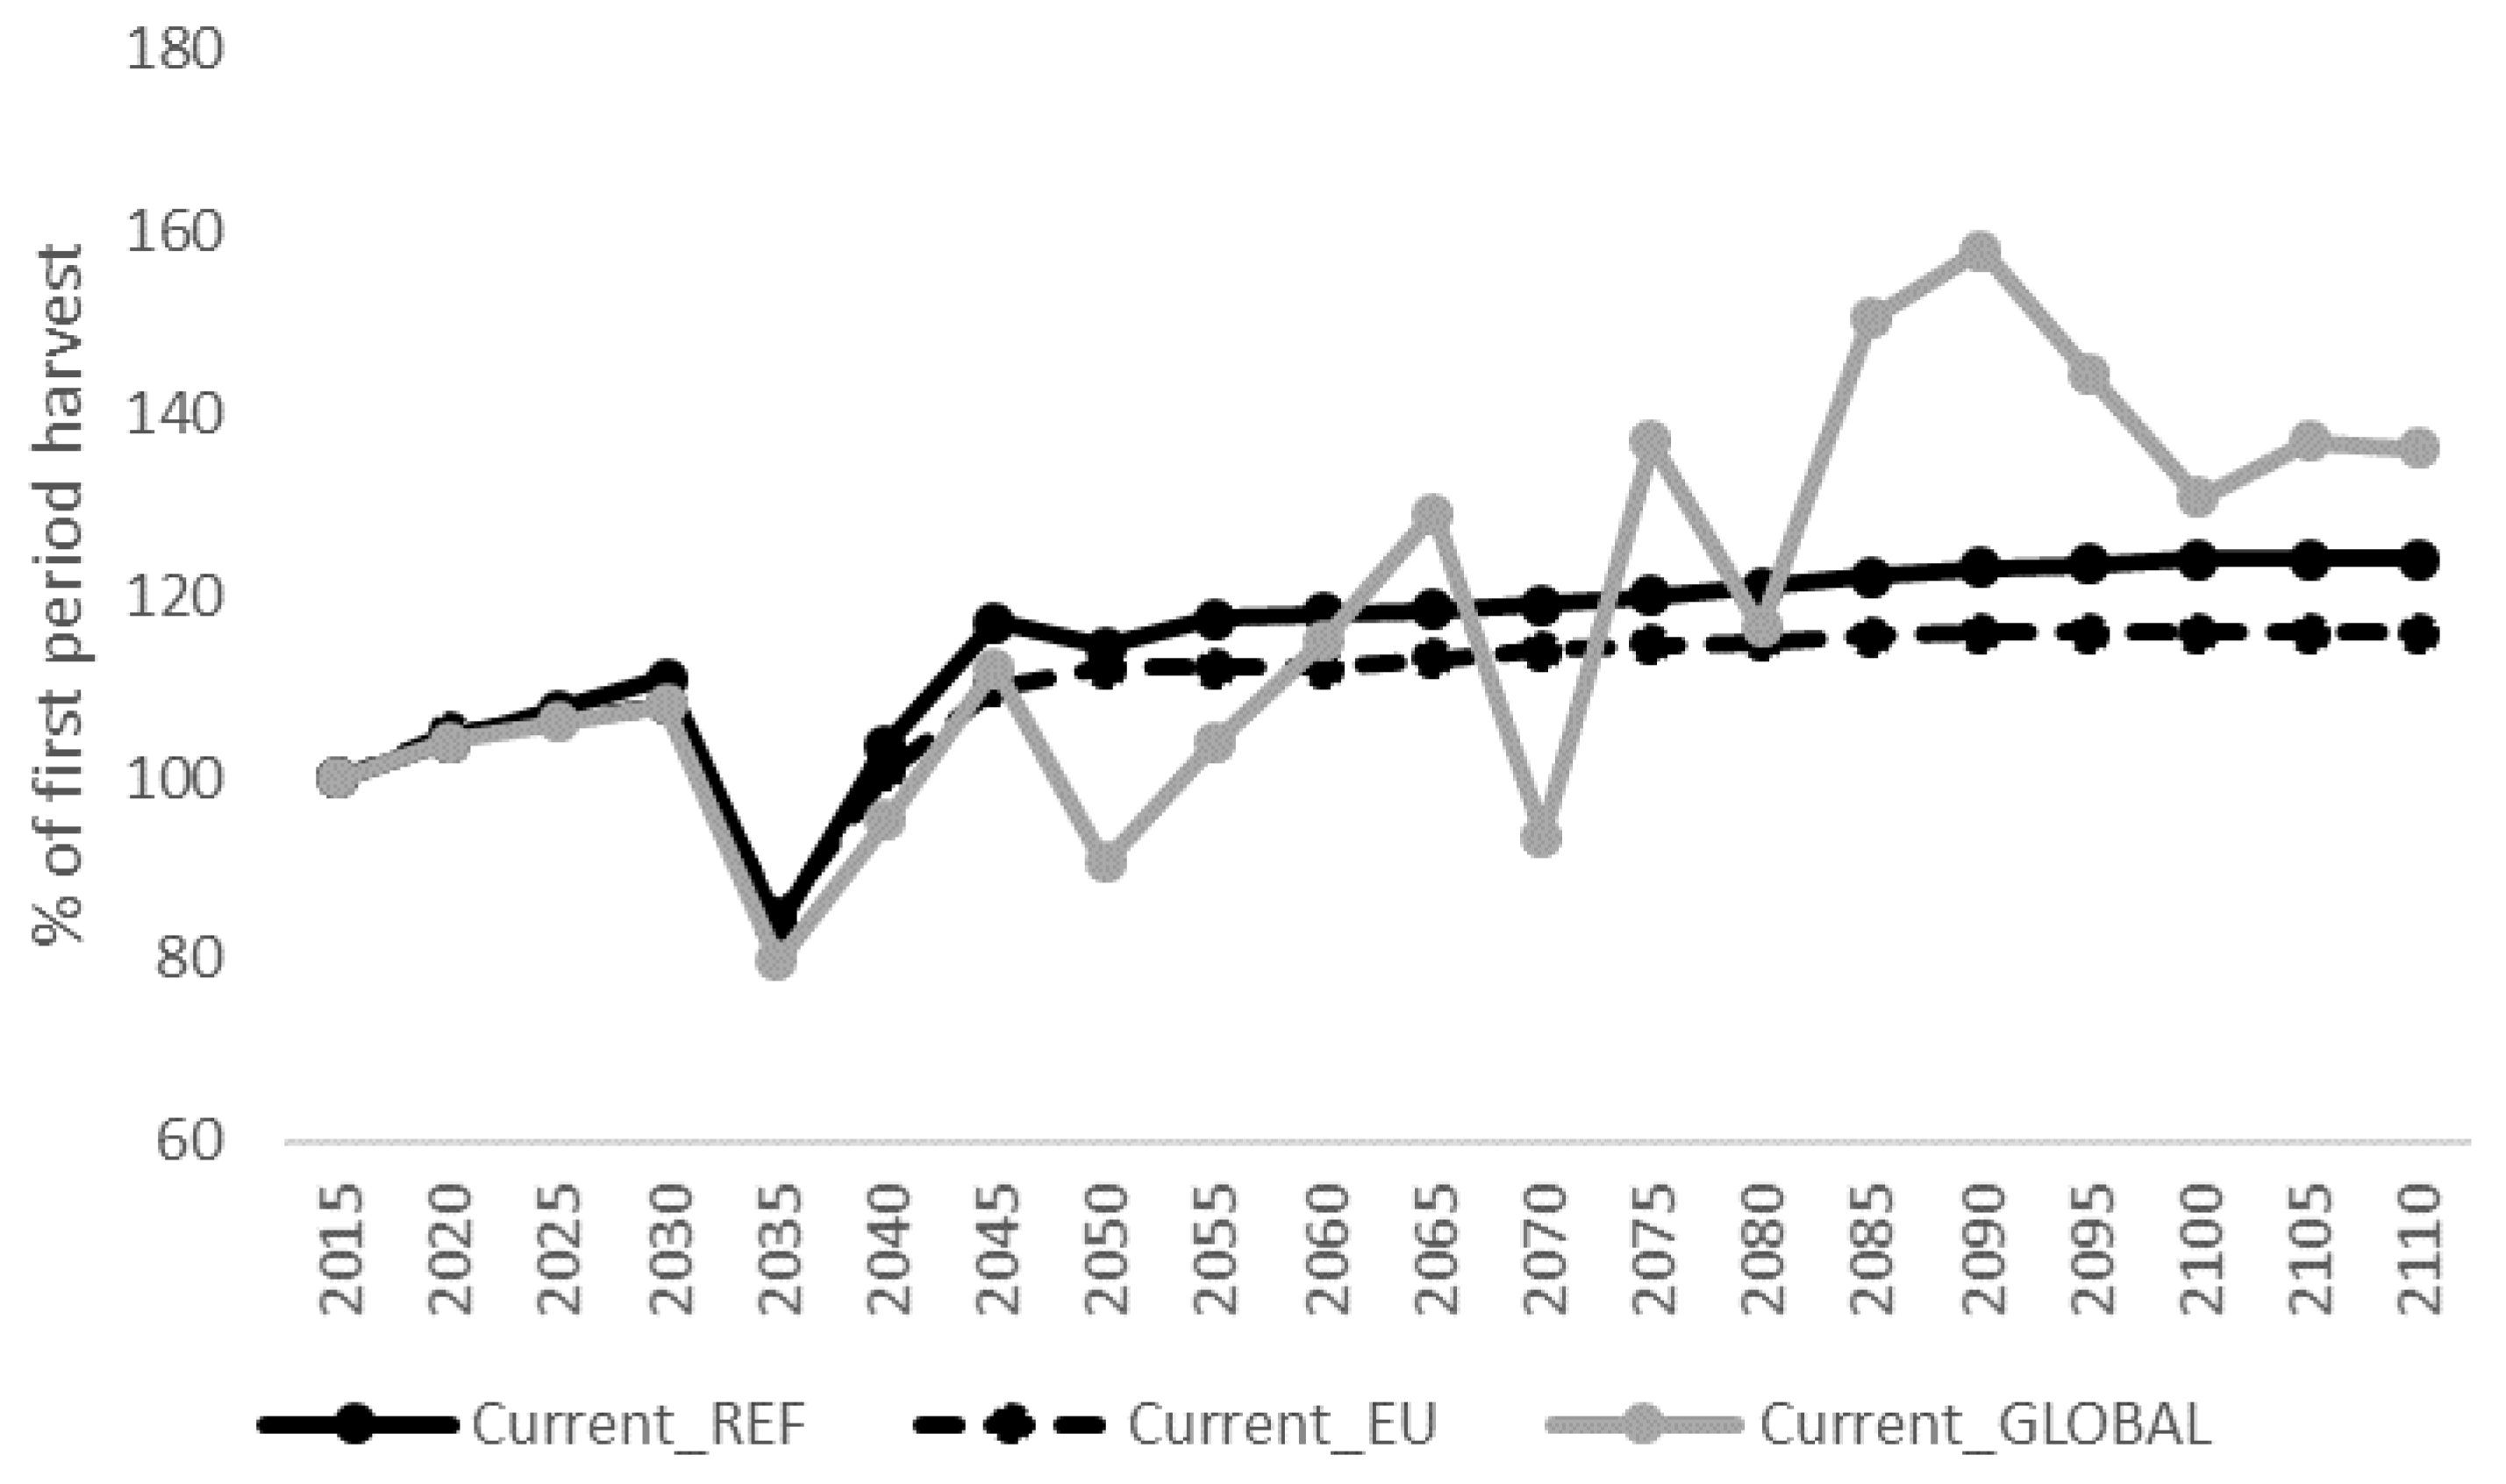
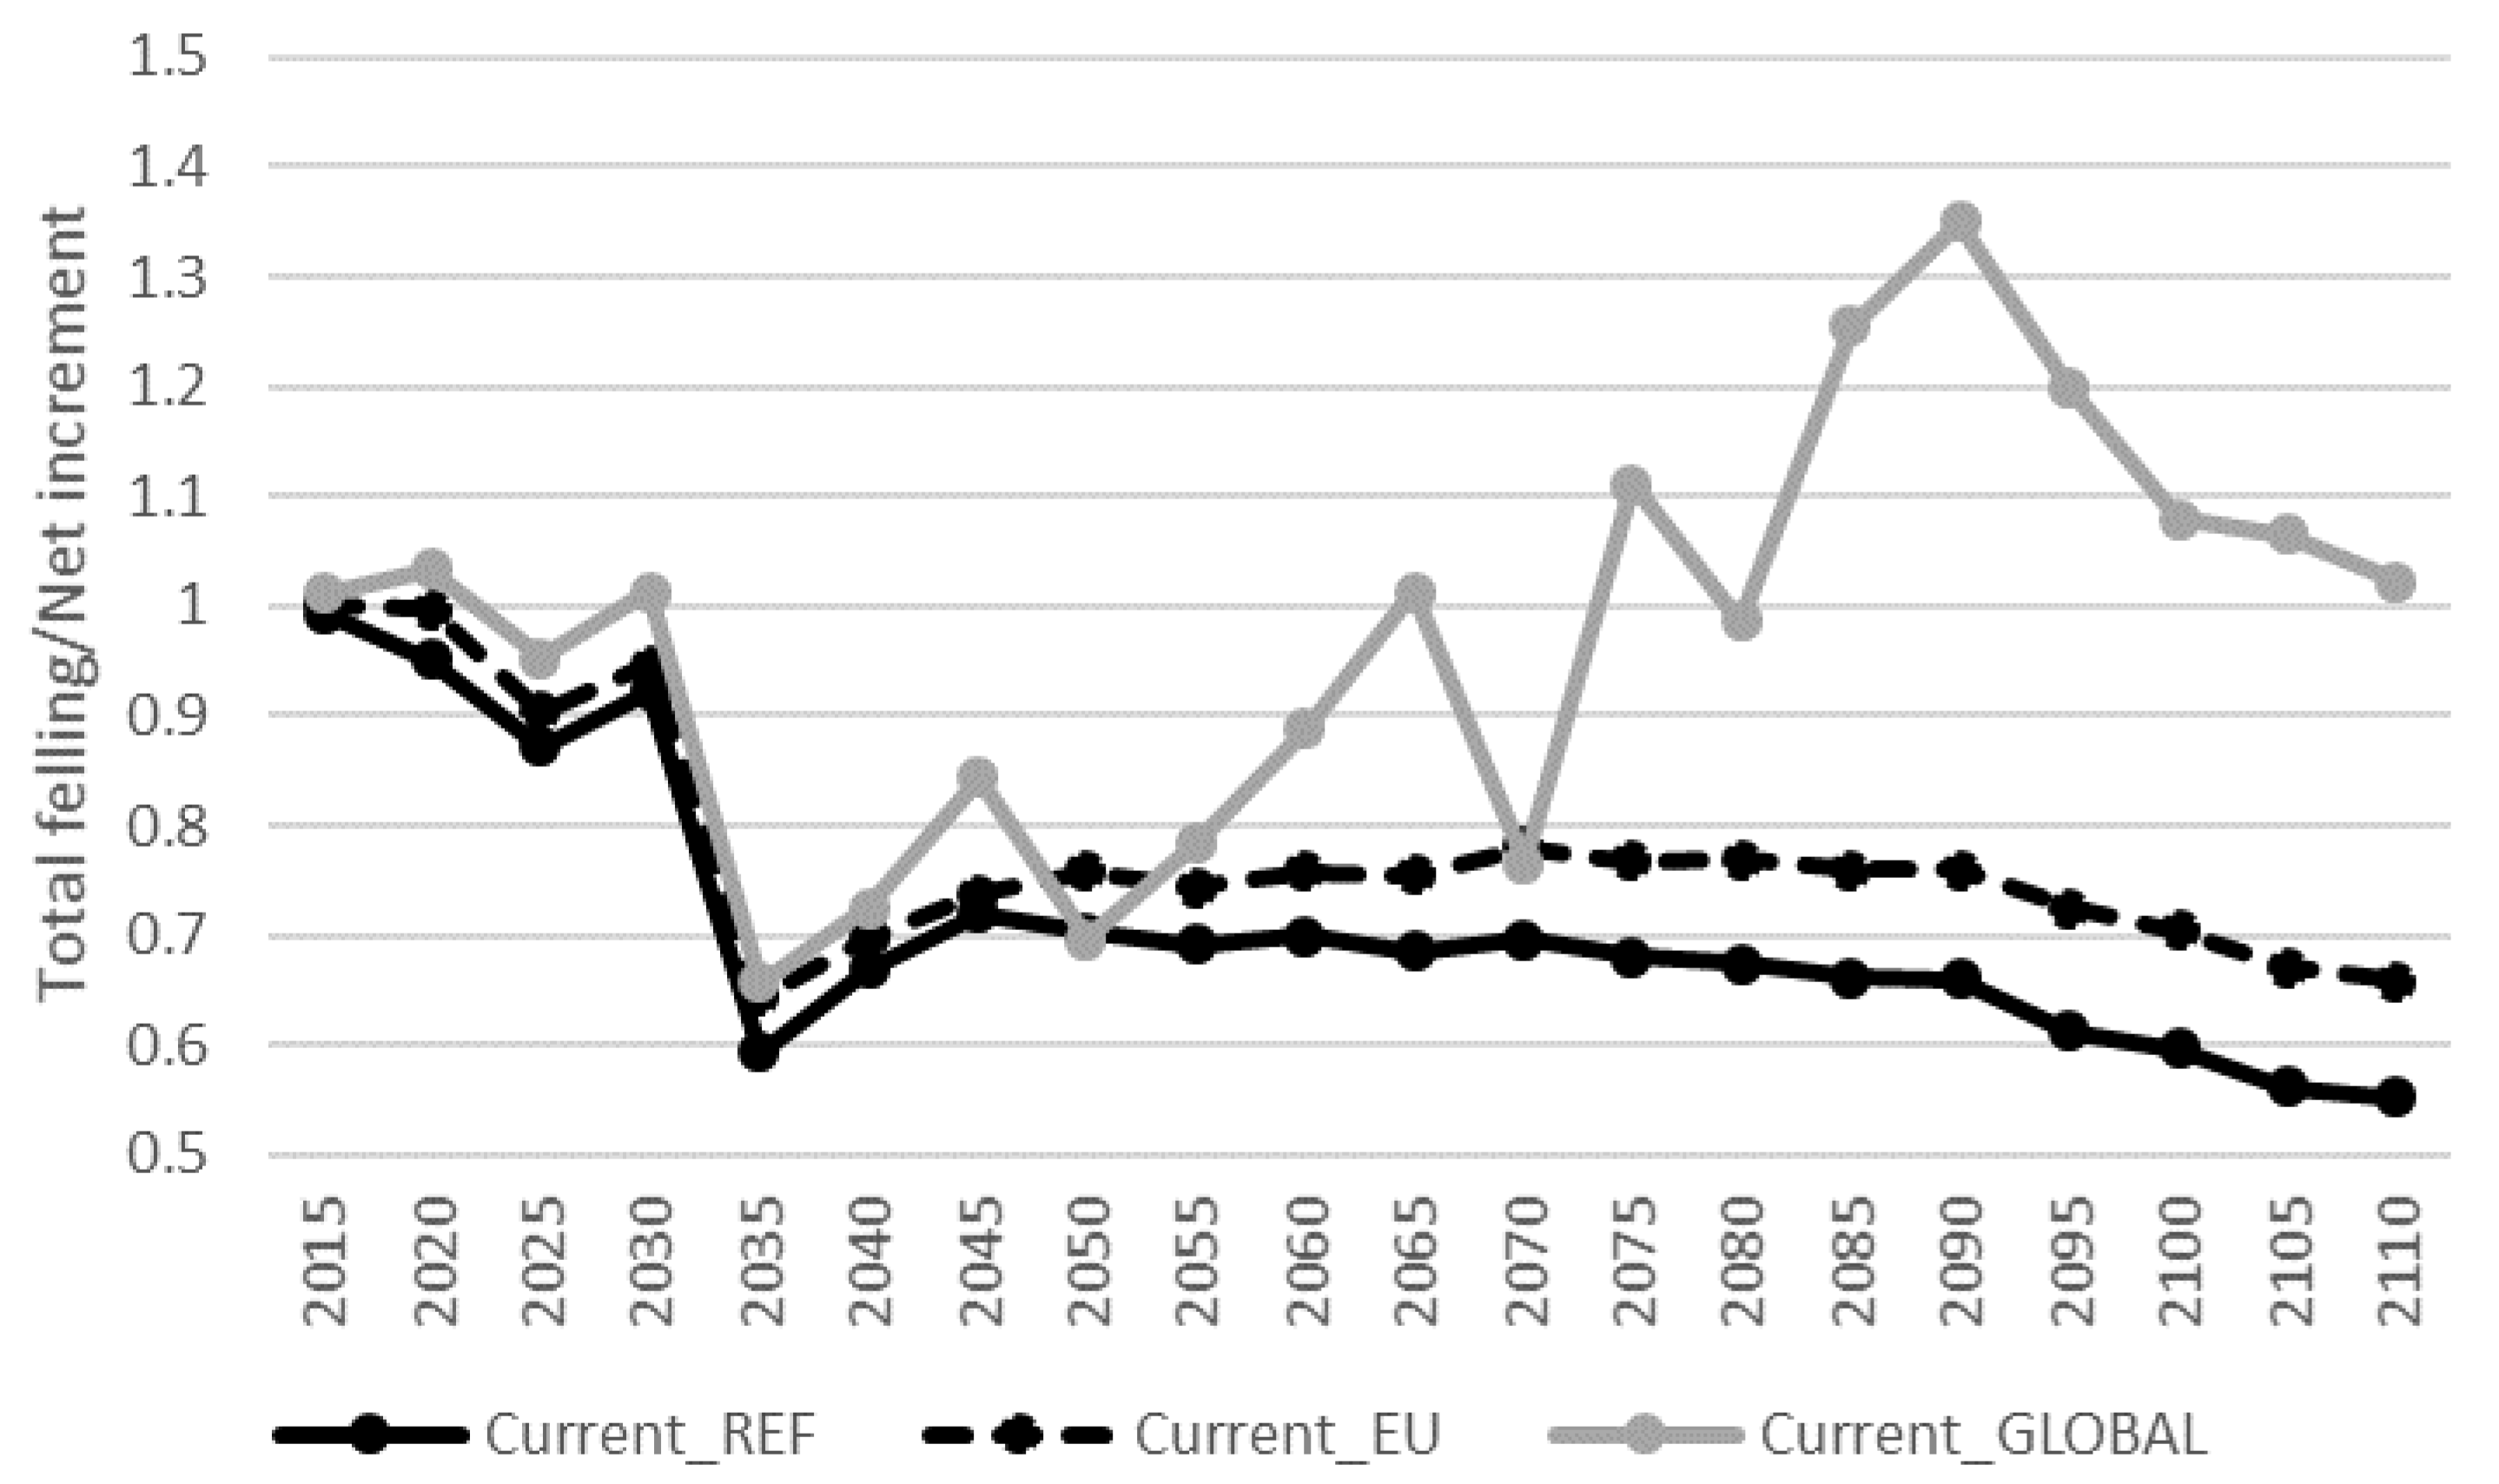
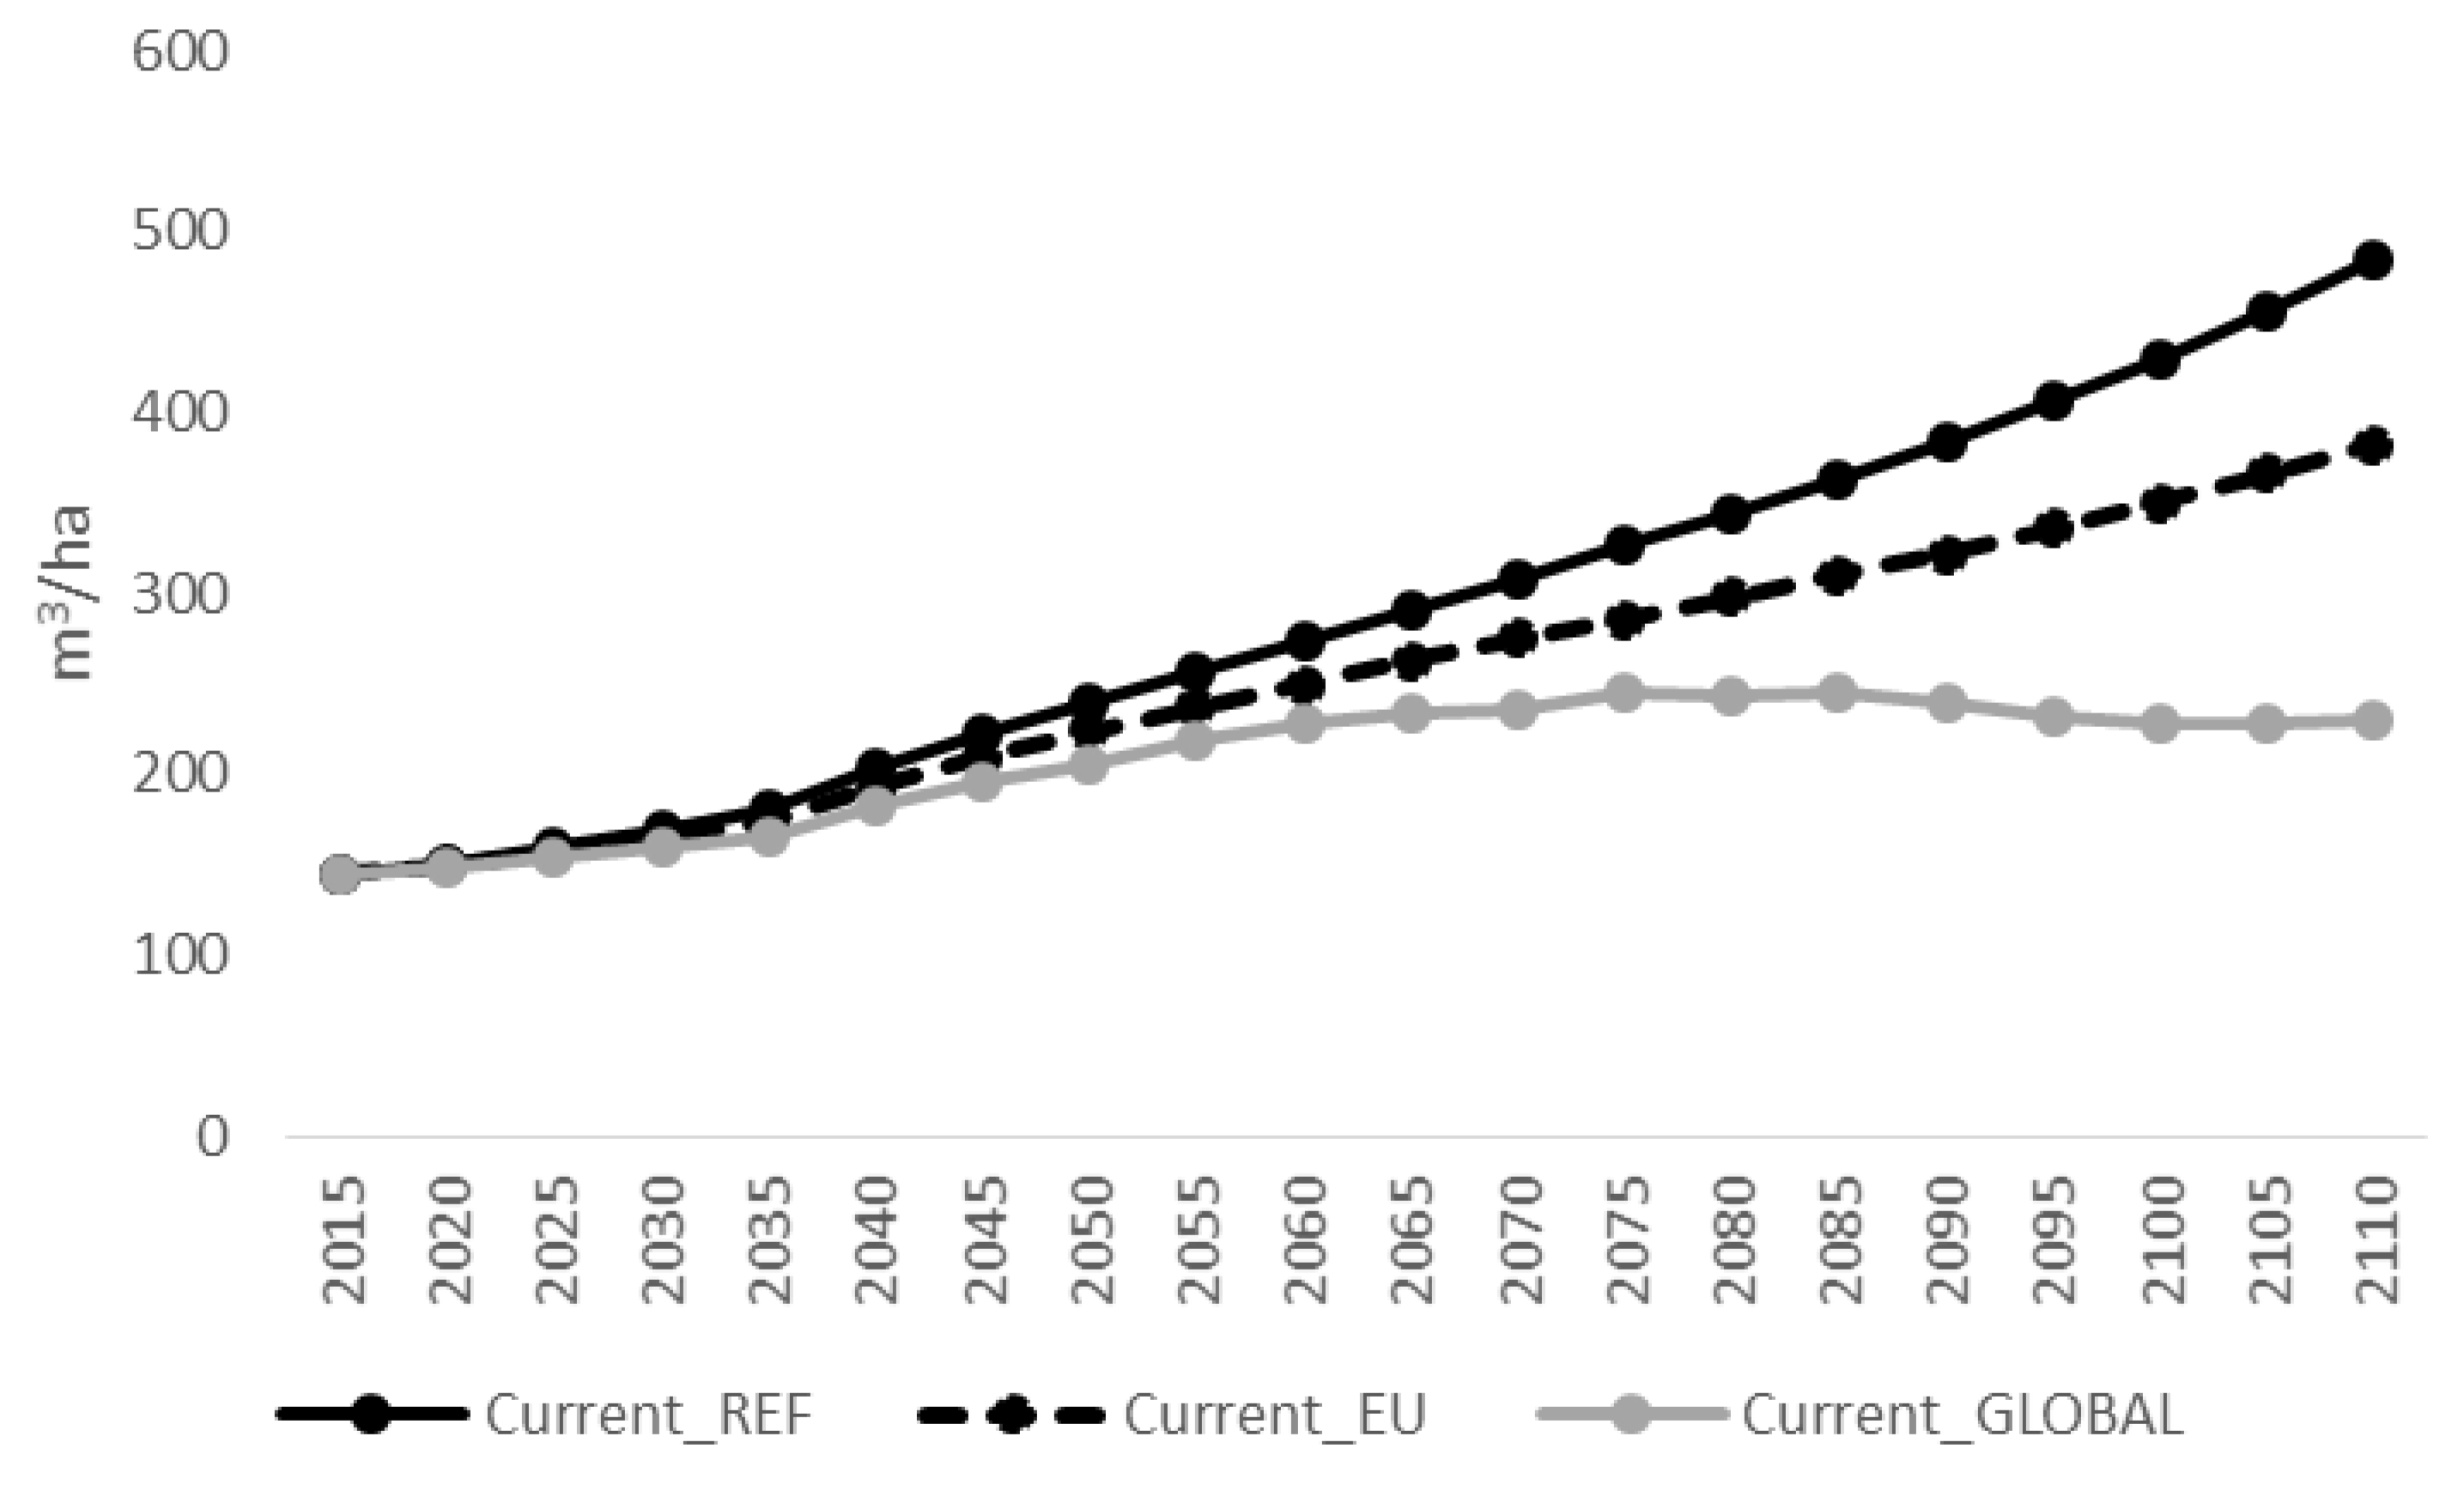
3.1. Current Forest Management Practices in the Three Climate Change Mitigation Scenarios

The development of the roundwood harvest with current management practices in all scenarios is shown in Figure 4. The projected wood demands are satisfied by current forest management practices in all scenarios for the first four periods (Figure 4). In Current_REF and Current_EU, this is followed by wood shortages during three (2035, 2040, 2050) and two (2035, 2040) periods of the remaining projection, respectively. In contrast, in Current_GLOBAL, the demand cannot be satisfied during most periods of the remaining projection (except during the periods 2065, 2075, 2085, and 2090).
The utilization rate, i.e., total felling including PCT through net increment (i.e., after subtracting the mortality), is close to 1 on the net area used for wood production in the beginning of all projections (Figure 5). During periods of wood shortage (e.g., 2035 and 2040 in all projections), the utilization rates drop due to the lower harvests. The warmer climate in REFERENCE and EU BIOENERGY results in higher growth rates compared with GLOBAL BIOENERGY and the projected increases in demand in these two scenarios are also more modest (see Section 2.4). As a result, the utilization rates are generally lower in Current_REF and Current_EU compared to Current_GLOBAL and the difference increase with time (Figure 5). In periods during the end of the projection where the demand is satisfied in Current_GLOBAL (e.g., during 2085 and 2090), the total felling is substantially higher than the net increment. This finding indicates that the scenario demand is higher than what can be sustained with current management practices.
As a consequence, the standing volume on all productive forestland (i.e., including set-asides and retention areas) increases markedly in Current_EU (to 383 m3ha−1 in 2110) and Current_REF (to 485 m3ha−1) during the projected period (Figure 6), while the increase, although substantial, is lower in Current_GLOBAL (to 230 m3ha−1).
An excess of potential final felling areas during the first four periods are followed by wood shortages (2035 and 2040) in all projections, where all potential final felling areas are harvested (Figure 7). In Current_REF and Current_EU, this is followed by two periods where potential final felling areas are slightly lacking (Current_REF in 2050), or just sufficient to meet scenario demand. Towards the end of the projections, there are large buildups of areas available for final felling due to the lower utilization rates. In Current_Global, there is no such buildup, and from 2035 onwards, the stands are generally final felled as soon as they become available for harvest.

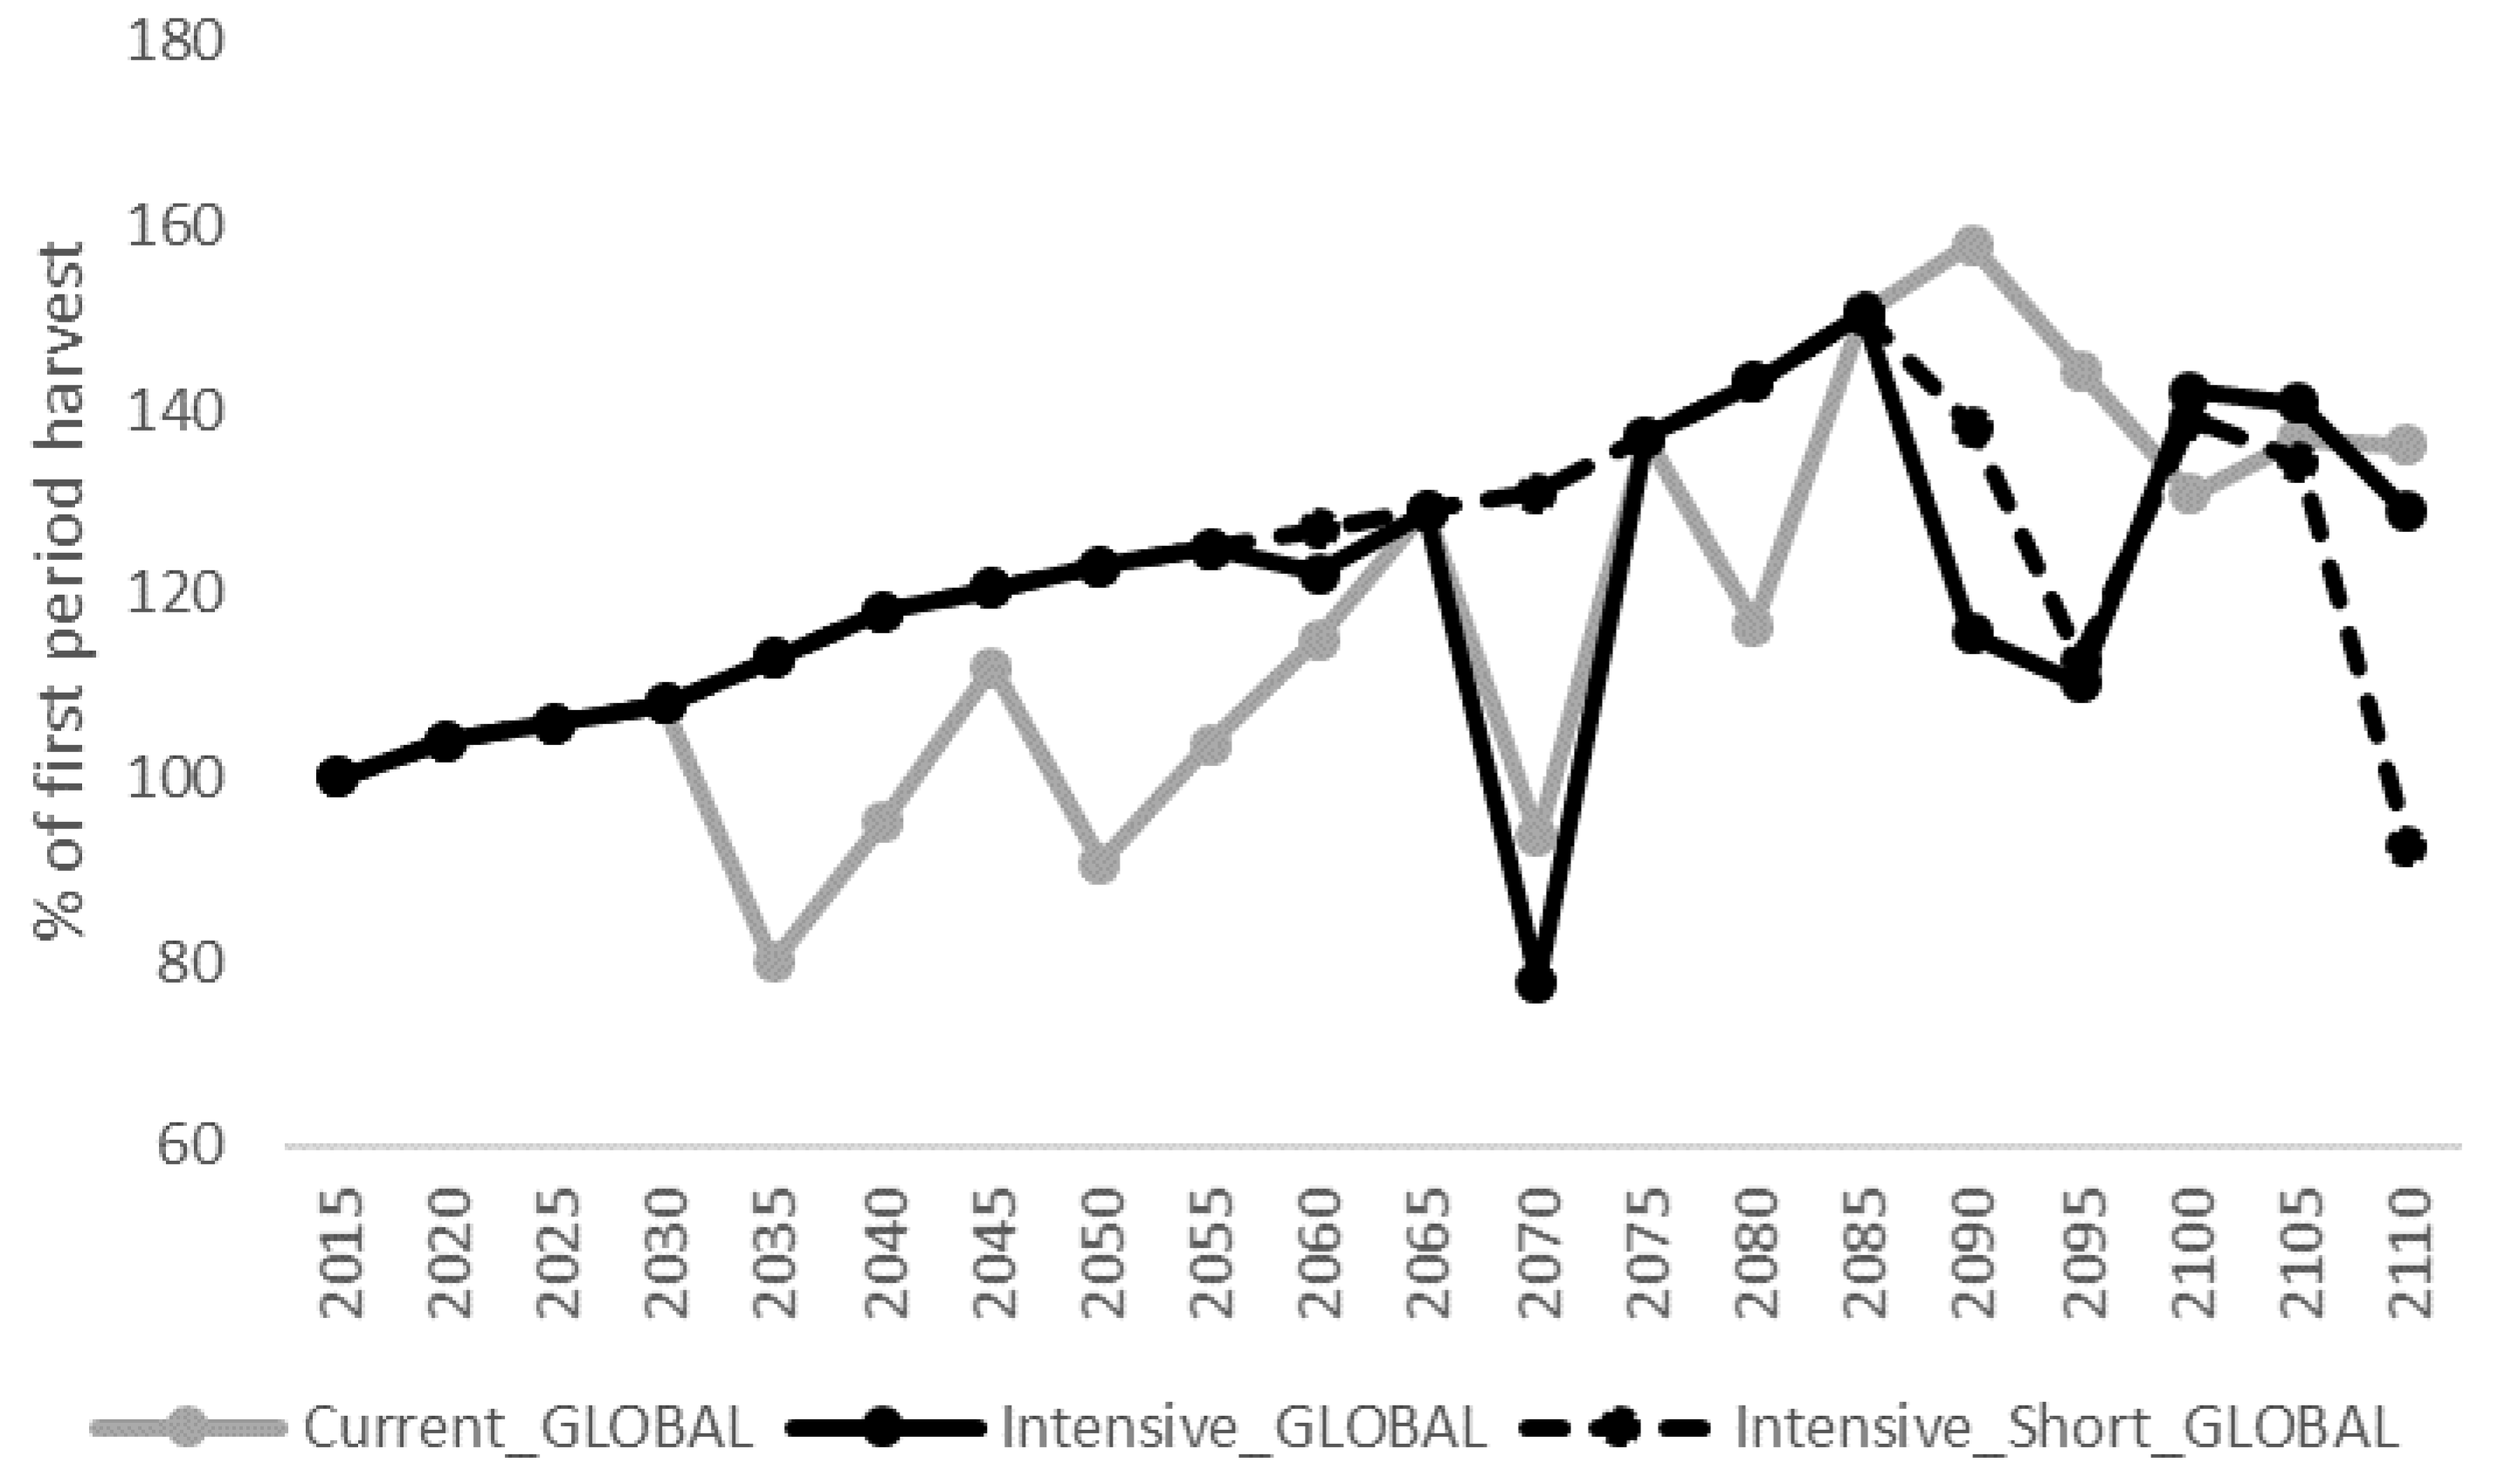
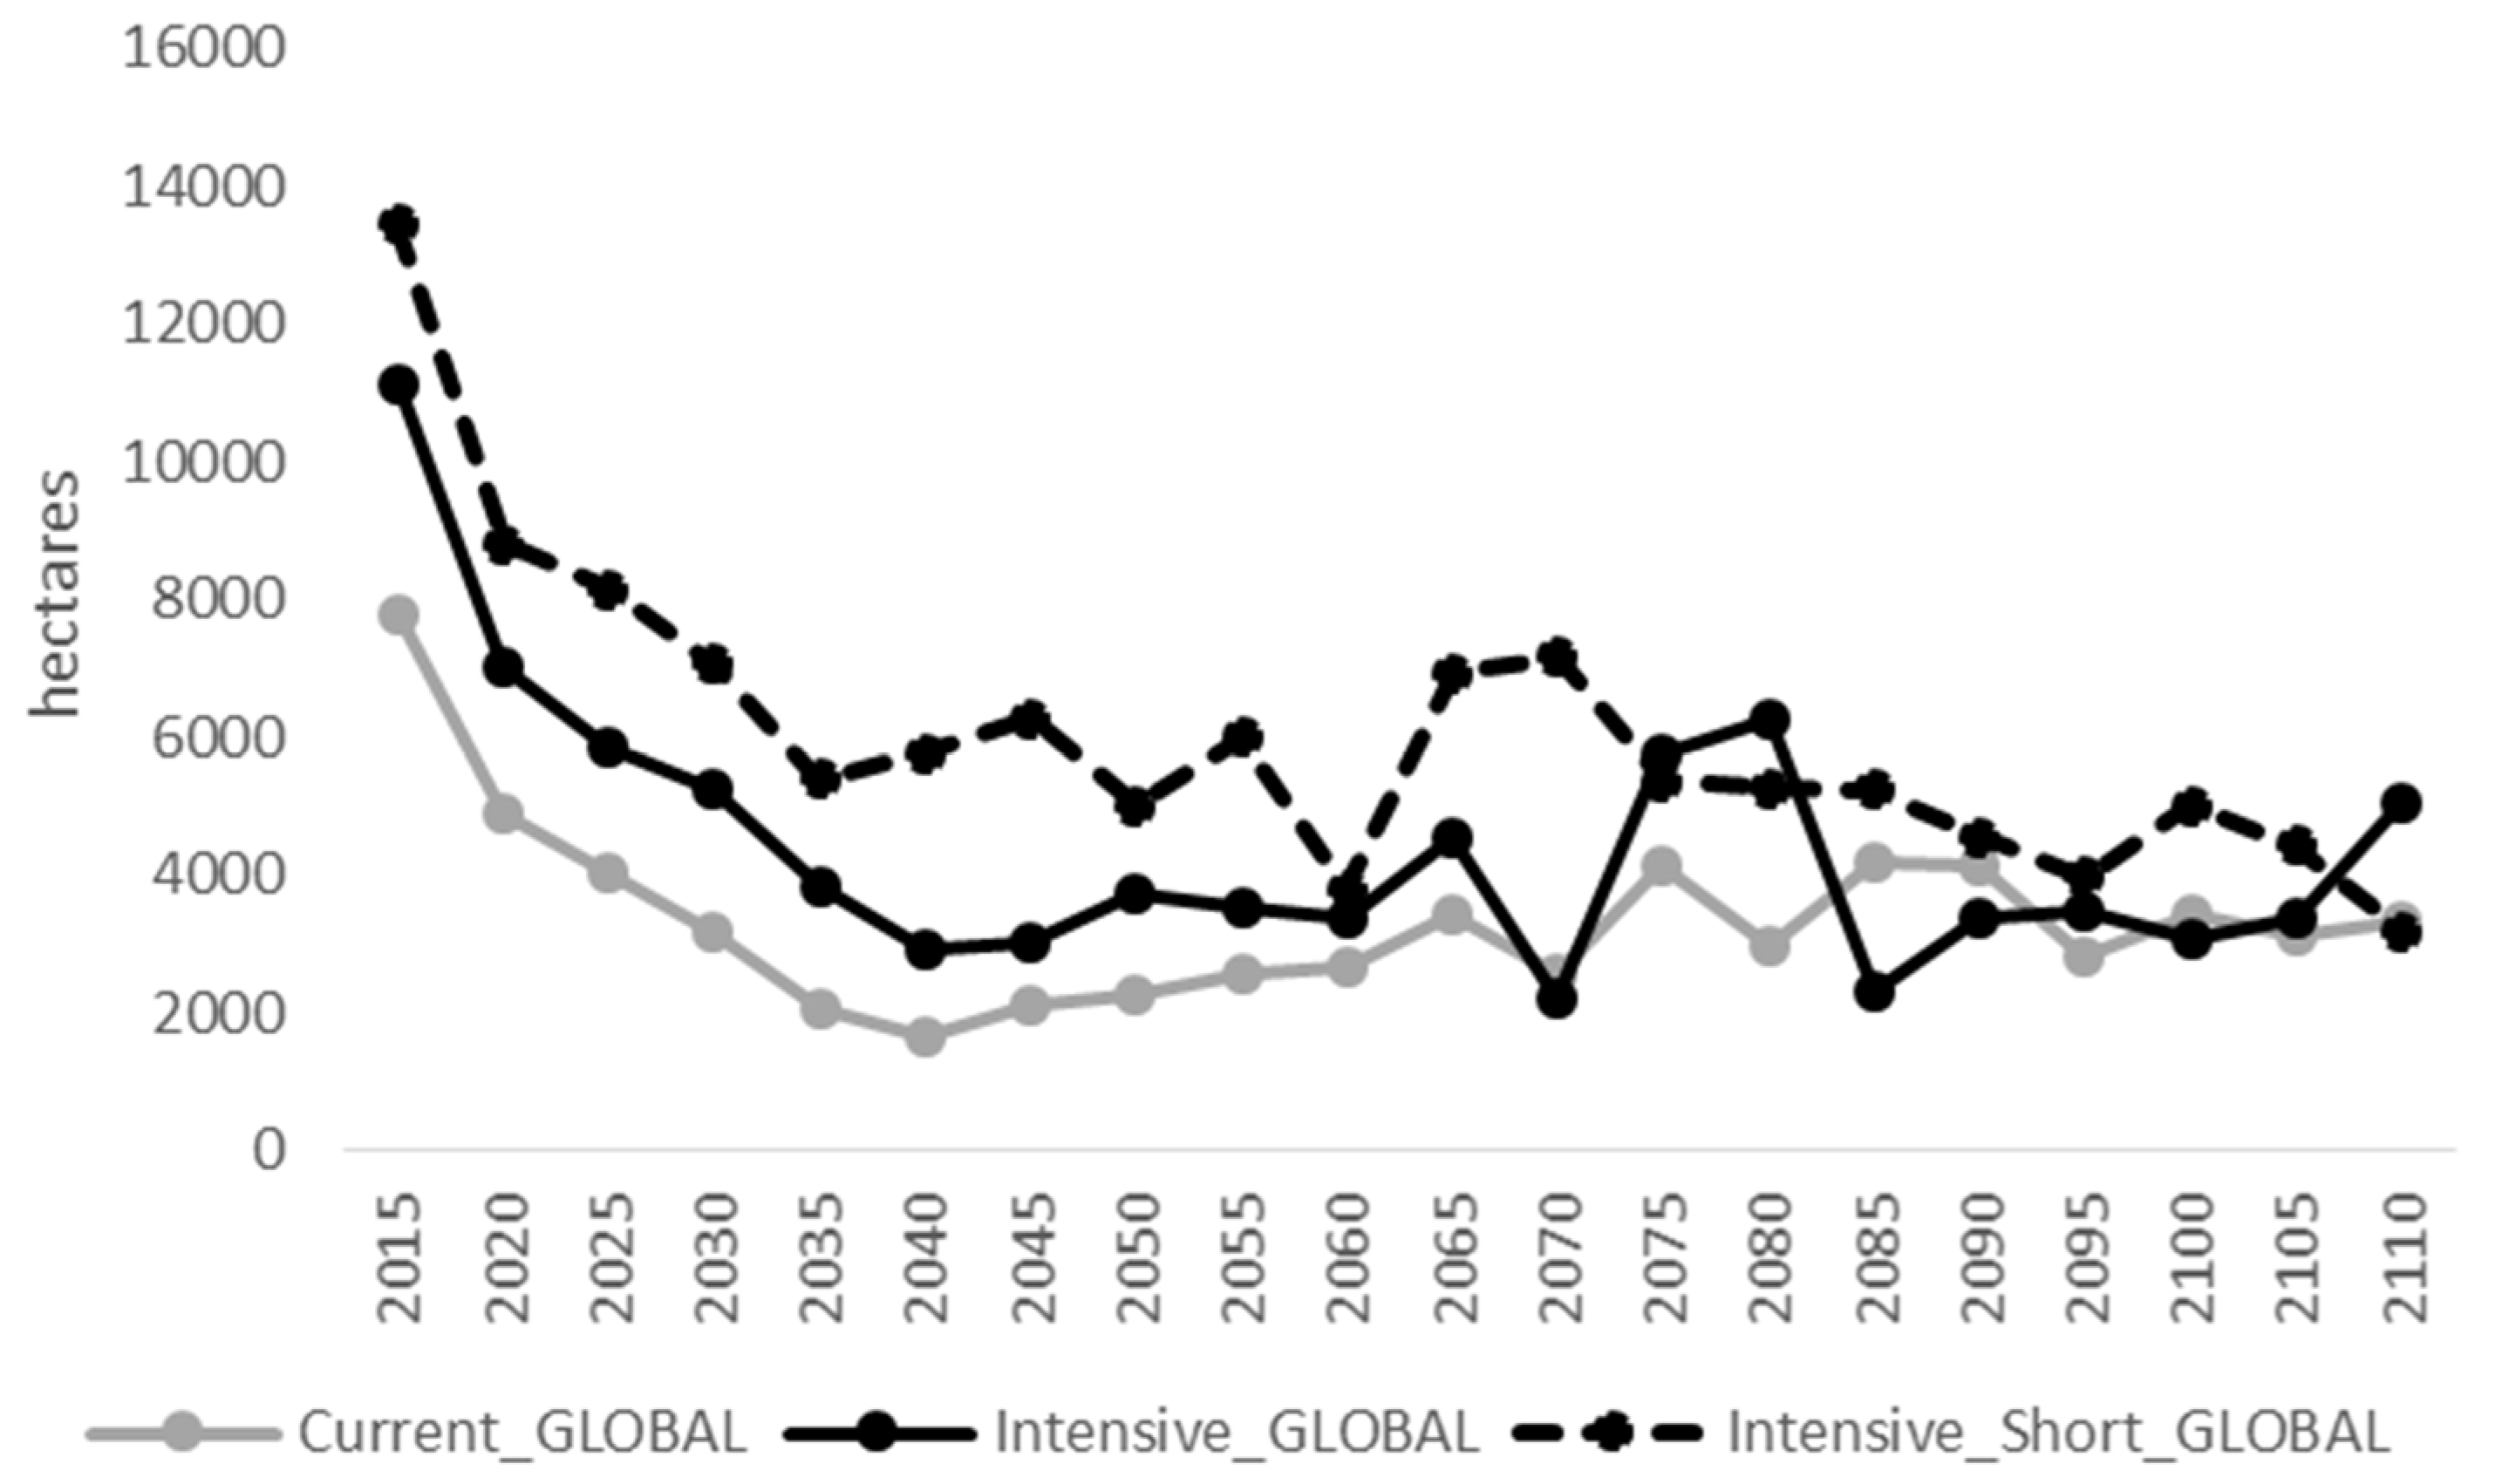
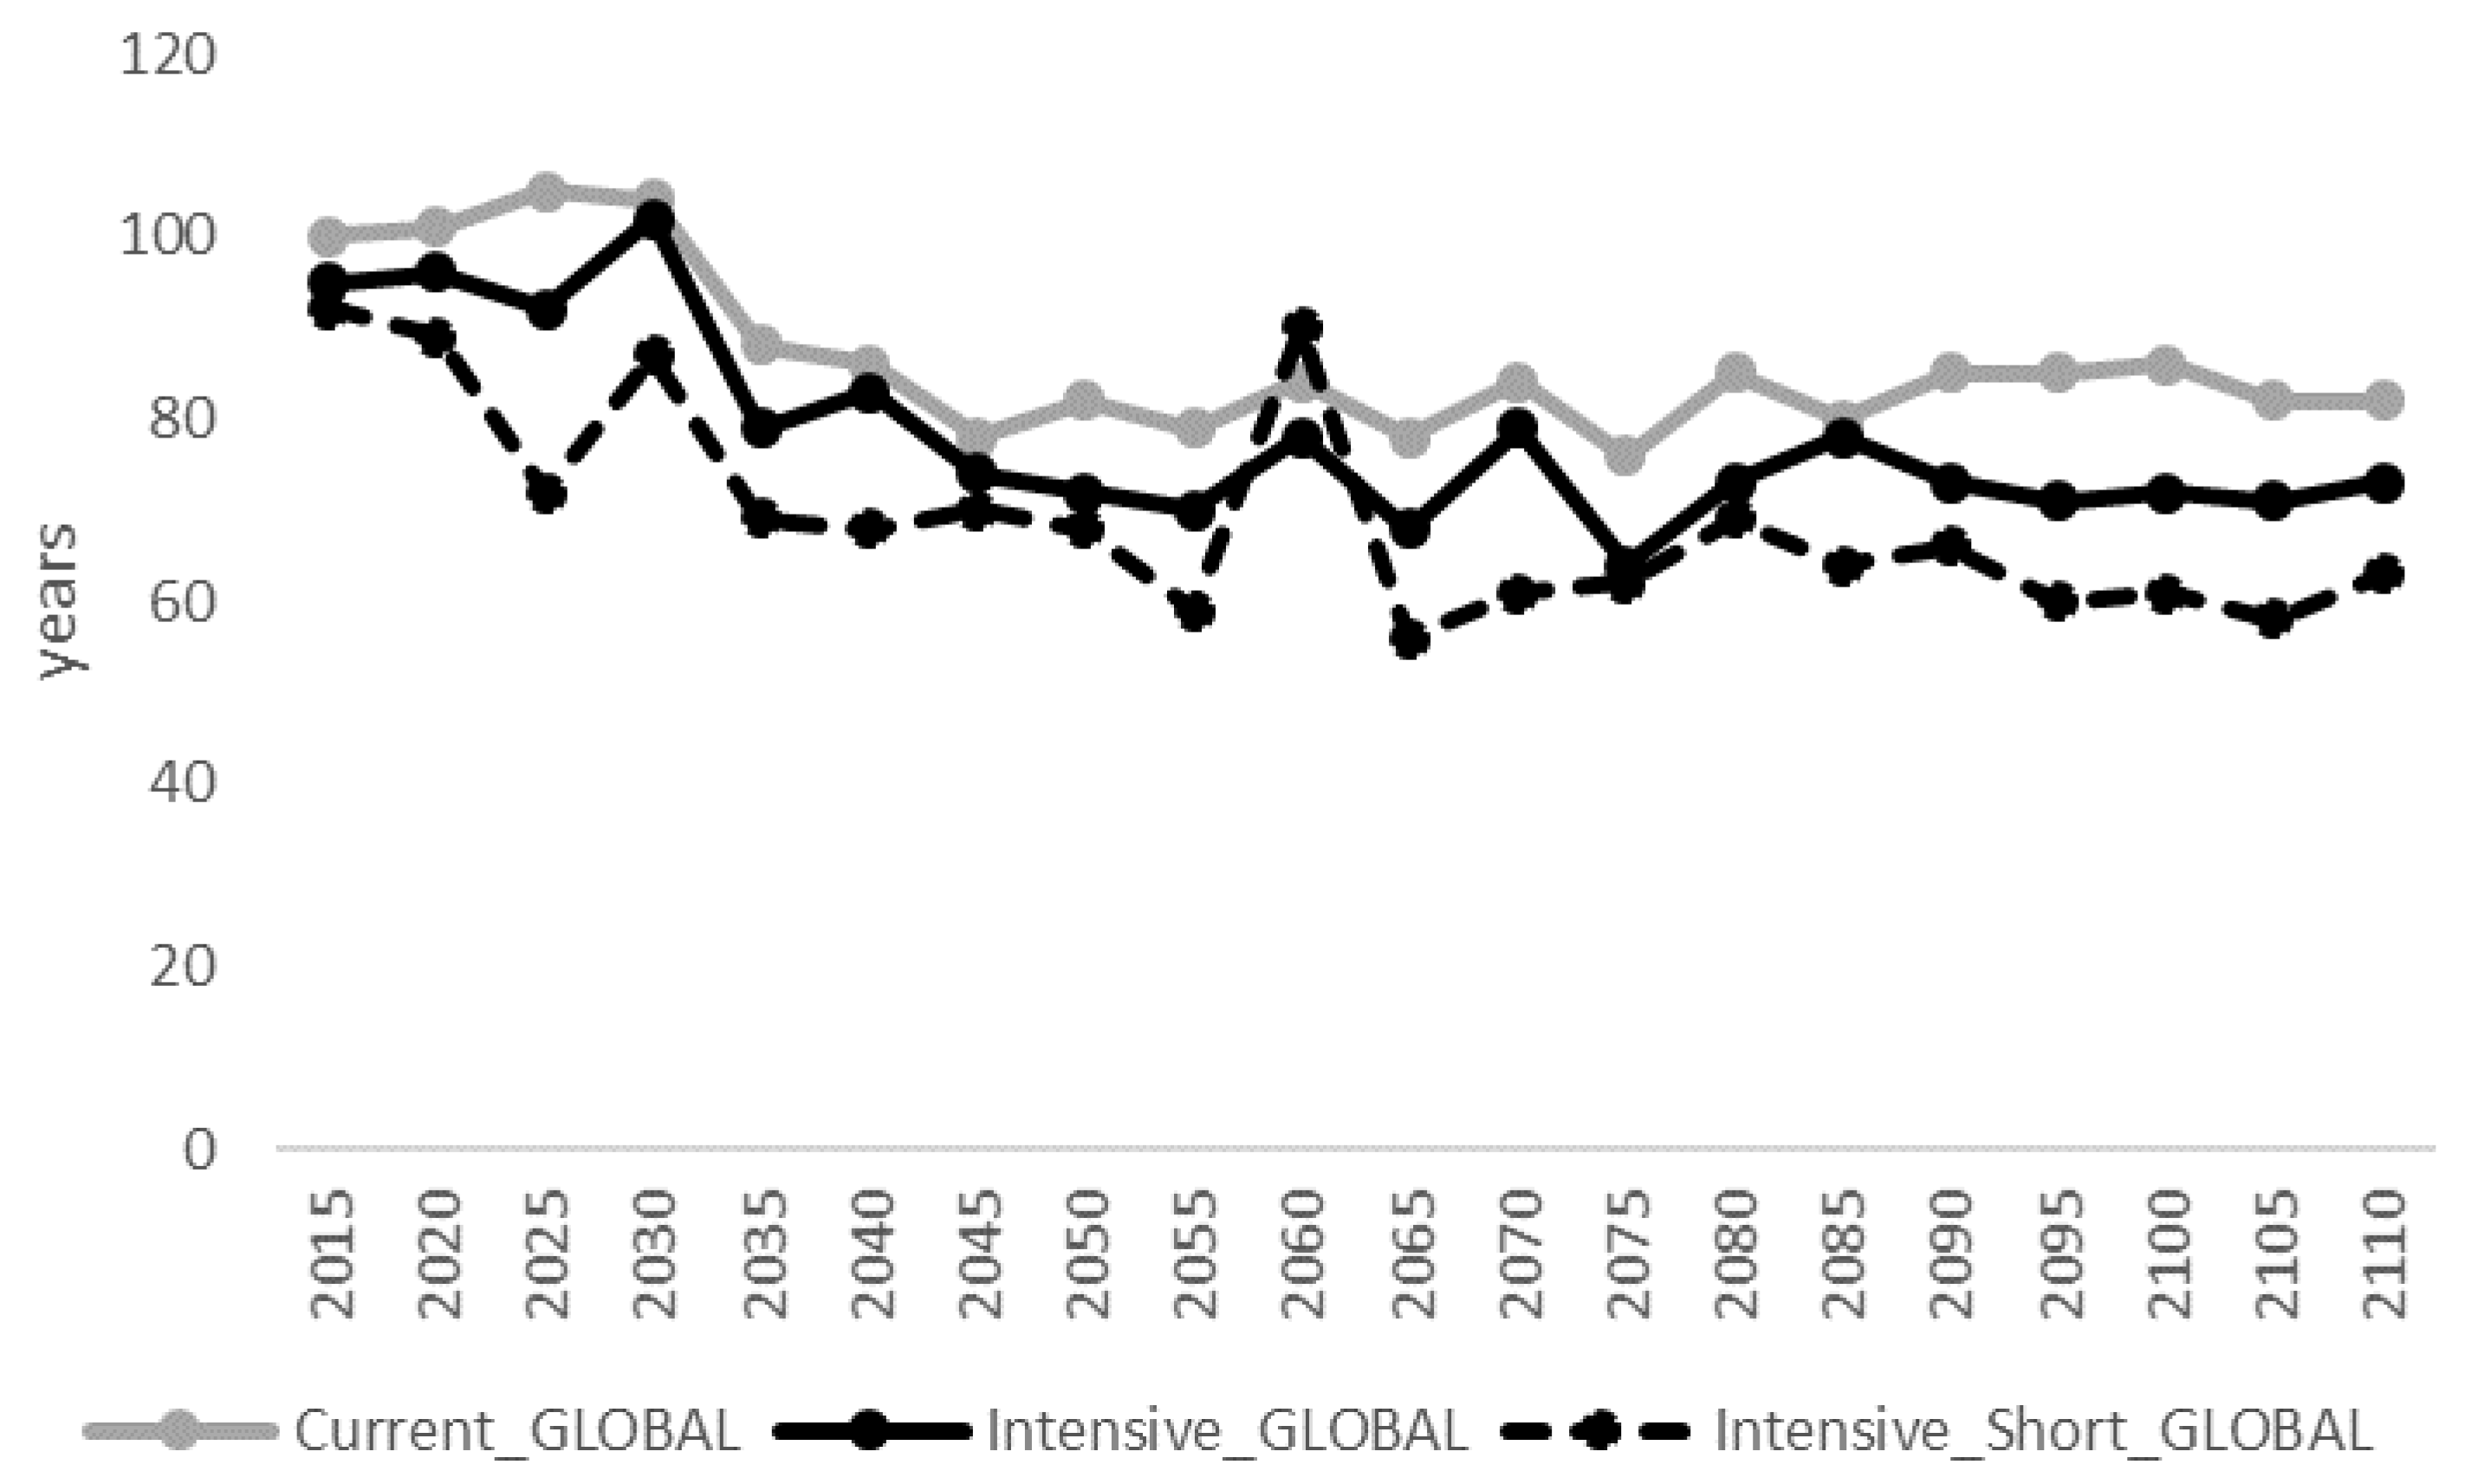
3.2. Intensification in GLOBAL BIOENERGY

Changing the strategy to Intensive on all properties reduces the projected wood shortage from twelve periods in Current_GLOBAL to seven periods in Intensive_GLOBAL (Figure 8). Additional intensification in Intensive_Short_GLOBAL reduces the wood shortage further to five periods. This is mainly due to increases in the potential final felling area (Figure 9). As a result of the different assumptions regarding the final felling behavior in the three projections, the rotation periods are on average shorter in Intensive_GLOBAL (78 years) and Intensive_Short_GLOBAL (69 years) in comparison to Current_GLOBAL (87 years) (Figure 10). In addition to the strategy rules, and the minimum legal rotation ages, the Forestry Act’s restrictions on the share of barren land and young forest (<20 years) on larger properties (>50 ha) also limits the potential final felling area in the projections. To exemplify, removing this regulation in Intensive_Short_GLOBAL would increase the potential final felling area in the first period from ca 13,400 ha to ca 16,900 ha.
The higher felling in Intensive_GLOBAL and Intensive_Short_GLOBAL during 2035–2060 results in higher utilization rates (where the net increment and total felling are approx. equal) on the net area used for wood production compared to Current_GLOBAL (Figure 11). Towards the end of the projection period, the utilization rates are highly fluctuating in all projections, reflecting the difficulties of meeting the scenario demand with current management approaches.
The standing volume on all productive forestland (i.e., including set-asides and retention areas) increases through time in all projections (Figure 12). Due to higher average utilization rates, the standing volume at the end of the projection period is lower in Intensive_GLOBAL (200 m3ha−1) and in Intensive_Short_GLOBAL (174 m3ha−1) compared to Current_GLOBAL (230 m3ha−1). The differences are more pronounced on the net forest area used for production, where the standing volume increase in Current_GLOBAL (to 177 m3ha−1 in 2110) remains the same in Intensive_Global (to 144 m3ha−1) and decreases in Intensive_Short_GLOBAL (to 113 m3ha−1).
Finally, results regarding the effects of management intensification on the wood shortages in Current_REF and Current_EU can be deduced from the results provided in the projections in GLOBAL BIOENERGY and are therefore not presented in this study. Making all owners manage the forest according to the Intensive strategy would eliminate the projected shortages.

4. Discussion

4.1. Projection Results with Possible Management Implications

The main aim of this study was to investigate if current management, rather than management according to production-oriented guidelines, could satisfy future wood demands under three different climate change mitigation scenarios in the studied region. To achieve this, the projections were made on the individual properties where the decisions are actually made. Efforts have also been invested (e.g., interviews, scrutinizing statistics, and the latest Swedish outlook study) in trying to make the behavioral rules of the owners reflect current practices. These are improvements compared with earlier studies that have tried to capture the behavior of diverse forest owners in long term projections in Sweden [16]. Similar work has been done in Lithuania [12].
The results show that accounting for the existing owner heterogeneity makes a difference compared to more simplistic approaches. This is recognized in a growing number of studies [2,12,16,17,18]. Different constraints, often related to forest ownership, limits the potential supply of wood [12,20,63]. By incorporating different forest owner management strategies in our projections, our study shows the effect of such owner-related constraints (i.e., by comparing Intensive_Short_GLOBAL and Current_GLOBAL). For example, if all production stands above the minimum age legal to harvest were available for final felling, the demand would be satisfied until 2085 in the most ambitious climate change mitigation scenario (i.e., in Intensive_Short_GLOBAL, see Figure 8) instead of only up to 2030. In addition, our study also accounted for the legal restrictions limiting the share of young forest on property level. Both these constraints on final felling are lacking in the latest forest outlook study [21] (p. 76) and associated peer-reviewed publications (e.g., [23]). From a European perspective, the study region is situated in a hot-spot region of intensive forestry [13,34]. Our approach of differentiating owner types that have different management logics and behavior, and thus avoiding to simply apply “the yield table harvesting approach” [13] is therefore most likely even more important in other settings.
However, the strategies and management approaches described and projected in this study only form “a snap-shot” of forest management, and reflect the factors that have shaped forest management in southern Sweden until today. In reality, the management resulting from the “frozen” strategies in the projections with current practices will never fully materialize because the forest owners will, each in their own way [18,64], react to future changes in external drivers. A viable alternative to the present study would have been to explore “likely” developments considering the impact on behavior of changed external drivers in the climate mitigation scenarios (e.g., by applying the methodology in [2,17,18]). For example, it is likely that the proportions of the different strategies and/or the strategy rules themselves (e.g., rotation ages, tree species, natural regeneration vs planting) would change due to changes in demand, prices and climate. Nevertheless, this study had a different focus, namely to investigate the potential to increase harvest within the frames of the currently widely used management approaches. In order to do that, a rather strict current projection with low responsiveness to external drivers was needed as a comparison point to the two projections with intensified practices.
The harvesting potential in Sweden is currently close to being fully utilized [65,66,67]. This is even more evident in our study region, where the total felling is equal to the net increment on the area available for wood supply in the beginning of our projections (see Figure 5). Nevertheless, during the first 20 years, the wood demands are still satisfied in all projections with current management practices. However, the latter two periods faced wood shortage in all scenarios. The projected wood shortages in our study are probably amplified by the poorer forest conditions in Kronoberg (144 m3ha−1, 6.1 m3ha−1year−1) compared with the rest of southern Sweden (180 m3ha−1, 7.4 m3ha−1year−1) [68] (pp. 107–108; 120). Kronoberg is situated in the core area of the 2005 winter storm Gudrun, the most devastating storm in Swedish modern history [69], which was followed by an additional storm in 2007. The storms reduced standing volume and annual increment substantially, and increased the share of young forest [70]. Reflecting this, in the most recent Swedish outlook study, Kronoberg county was highlighted as a region where the harvest in the near future could be limited by the forest state [21] (p. 58). This could indicate that the harvest in the first period should start at lower level of utilization than the average for southern Sweden, or alternatively, not follow the relative trend for Sweden as a whole as was assumed here. In such a case, more of the future demand would be satisfied by harvesting from other parts of Sweden, lessening the pressure for deliveries from Kronoberg.
The historical development of forest management has been driven by changes in external factors [71]. Climate change will arguably be one of the major factors driving the future development. Based on our results, the following can be said about challenges and opportunities in the different climate mitigation scenarios employed in our study.
Firstly, regardless of the scenario, our study supports the conclusion of the most recent Swedish outlook study that in order to maintain a high utilization rate, the rotation ages would have to be reduced in the near future [21] (p. 86). This would reduce the capacity of the production forest to provide large trees and coarse deadwood, with likely adverse effects on forest biodiversity [72].
Secondly, with less ambitious mitigation efforts and an increased climatic warming (i.e., EU BIOENERGY and REFERENCE), the pressure on the forest resource for timber production were found to be reduced with time. In these scenarios, there is potential and great need (climate change adaptation measures) to increase the use of approaches that currently are less attractive than the typical plantation of Norway spruce in terms of production but are more beneficial for other ecosystem services and/or decrease climate change related risks. This includes inter alia increasing the share of set-asides and continuous cover forestry, establishing mixed forests and native broadleaves [6,73,74].
Finally, in a future with ambitious efforts to mitigate climate change through increased use of biomass (i.e., GLOBAL BIOENERGY), the demand for wood is expected to increase notably in Sweden [23,75,76]. The projections made in relation to the second aim of this paper showed that the demand could not be satisfied towards the end of this century, even if all owners managed their production forests at an intensive extreme of current management approaches (i.e., Intensive_Short_GLOBAL). In a future such as this, the forest sector as a whole will be incentivized to increase the long-term supply of forest biomass through various means [66]. This may involve implementing more intensive and productive forest management programs and/or increasing the recovery rate at harvest (by harvesting more residues and some stumps), which could significantly increase the role played by Swedish forests in climate change mitigation [10,76,77,78]. However, further intensification in one of the most intensively managed regions in Europe can be questionable from an economic point of view. This is because of the higher marginal costs of further increasing production in Sweden compared with “lower hanging fruits” elsewhere [66]. In addition, the benefits associated with increasing the biomass supply need to be weighed against negative effects on other ecosystem services, such as biodiversity [6,79]. Concerning the latter, the Swedish approach to biodiversity conservation is highly dependent on the habitat quality of the production forests [80]. Further intensification in the managed forests can therefore be expected to have negative effects on the conservation status of many forest dependent species. In the end this “balancing act” needs to be regulated by policymakers through suitable forest policies and forms of governance.

4.2. Uncertainties and Improvements

A critical basis for the results rests with the global scenarios produced with the GLOBIOM model. Within the GLOBIOM model, the initial state of forest is calibrated according to the information received from the G4M model (Global Forest Model) [81]. The G4M model is calibrated to European data sources received by EU member states themselves [82] as well as publicly available data sources that have an EU wide coverage [83,84,85,86]. However, it should be noted that such EU-wide information sources may at times differ from detailed national forest inventory sources, which most EU member states do not make publicly available. One of the key current challenges that this brings is to accurately reflect upon set aside areas and biodiversity conservation areas [87]. As the area of forests set aside for non-wood production purposes is increasing within the EU [83], is it becoming vital that geographic allocation and management-specific information on such areas is collected and made publicly available in a harmonized manner across the EU member states.
It is important to note that the climate change mitigation scenarios examined in this study are based on global SSP-RCP scenarios, and on EU policies and regulations in place as of 2016. In scenarios with high mitigation targets, the focus is commonly on increased production of bioenergy to replace fossil fuels. An increase in the forest harvest level can lead to different short- and long-term impacts in the forest carbon sinks. In the short term, the forest carbon sinks are decreased when harvest increases. In the long term, the forest carbon sinks can be enhanced through increased forest growth. Therefore, the harvest level may have a notable impact on the choice of an efficient climate change mitigation strategy. The 2018 EU regulation on LULUCF (land use, land use change and forestry) obliges the EU member states, including Sweden, to account for changes in the forest carbon stock for the period 2021–2030 [88]. This LULUCF regulation has not been considered in the current study since it was not in place when the scenarios were prepared. In the coming years, however, the LULUCF regulation may affect the use of wood as it adds another set of tradeoffs to consider when making decisions over the use of forests [89,90].
Forest owners are indebted to fill the demand requirement of the scenario downscaled to Kronoberg County. This is not realistic on two accounts. Firstly, as mentioned above, the potential to satisfy demand in one or several future periods may be better elsewhere and thus making requirements less challenging for Kronoberg County. Secondly, harvesting to the last available cubic meter is too costly to be made in reality. An alternative to make the simulation more realistic in both of these respects would to use a forest sector model [91] for the whole of Sweden. The scenario demand would then be balanced over the regions of Sweden and the demand falling on Kronoberg County could be registered. An example of how different regions develop under various assumptions is presented by Chudy et al. [92].
In the projections in the EU BIOENERGY and REFERENCE scenarios, the average standing volumes increased markedly. This is due to growth that is boosted by the high usage of genetically improved seedlings and climate warming, at the same time as the increases in wood demands are more modest. The very positive impacts of climate change on wood production implemented in Heureka (i.e., [56]) are most likely too optimistic. Belyazid and Giuliana [93] indicate that the positive effects of higher temperature on the increment will be counteracted by lower water availability, especially in the part of Sweden where this study is located. By better accounting for the extreme variations in future climate (e.g., drought, frost), Subramanian et al. [94] projected a lower increase in growth in RCP8.5 and RCP4.5 for our study region than what currently is implemented in Heureka (e.g., 21% instead of 36% increase by the end of the century in RCP8.5). Consequently, the buildups of standing volume, in Current_EU and Current_REF are most likely overestimated. In addition, storm damages, which have the potential to substantially reduce the annual increment and standing volume [94], were not accounted for in any of the projections.
Our experiences from the work allow us to indicate areas where future research can further increase the quality of the projection results. Currently, 63% of the pine trees in young forests in Kronoberg are damaged by moose [40]. While the indirect effects of browsing on forest owners’ tree species choice have been accounted for in this study, it would be valuable to incorporate functionality to also account for the direct effects, which include reduced production [95] and failure to recruit valuable broadleaved species [96,97]. Moreover, the incorporation of better and more advanced models (e.g., [94]) to predict the effects of future warming and climate change related risks in Heureka is a priority. Other potential improvements are related to the forest owner decision’s simulator. In contrast to the assumption of this study, the harvesting intensity among private forest is not stable, but rather varies between the different phases of ownership (e.g., set-up phase vs stewardship phase) [98]. Properties also change owner with an average interval of approx. 20 years [99], and with a new owner, there might be changes in the management orientation. Including more dynamic strategy allocation to account for these factors would make the projections come closer to reality. Moreover, the mapping of current practices and its translation to owner strategies implied combining information of different types (qualitative-quantitative) and spatial resolution (Kronoberg – southern Sweden). This involved simplifications, interpretations and expert judgment by the involved researchers. In this regard, studies that combine the previous focus on mapping of forest owner objectives (e.g., [26], or their intentions/strategies (e.g., [16]), with detailed investigations of applied management practices at the property level would be needed to improve the behavioral rules.

5. Conclusions

The projected demand in all climate change mitigation scenarios would put additional pressure on the forest resource in our study region in the near future. To meet the demand, forest owners would need to make final fellings in their production stands earlier than what is currently being practiced. Being aware that uncertainties compound as we move into the future, our results indicate that the demand in a longer perspective could be satisfied with current forest management practices in the less ambitious climate change mitigation scenarios. In contrast, an increase in harvest in line with the demand in the most ambitious scenario seems unrealistic considering the already high level of utilization on the area available for wood supply. Trying to increase the harvest to this extent would require intensification within the frames of the current management approaches, as well as large-scale implementation of more intensive and productive forest management programs. Studies on larger scales would be needed to validate our conclusions on a larger regional (southern Sweden) and/or a national level. Finally, this study highlights the fact that how we define current forest management practices affects the degree of change needed to respond to various future challenges. The strict definition used in this study enabled us to explore the potential to increase harvests within the frames of the current management approaches. This represents a tangible starting point when discussing strategies in response to the expected demand challenge imposed upon the forest resource by climate change mitigation. It also calls attention to the need for solid knowledge of drivers and their impact on forest owner behavior as a basis for forest policy development.

Supplementary Materials

The following are available online at https://www.mdpi.com/1999-4907/11/3/346/s1, Forest Data: Supplementary material_Forest data, Interview guide: Supplementary material_Interview guide.

Author Contributions

Conceptualization, I.L. and L.O.E.; methodology, I.L., L.O.E., N.F., A.K.; software, L.O.E., N.F. and A.K.; validation, I.L., L.O.E.; formal analysis, I.L., L.O.E., N.F. and A.K.; investigation, I.L., L.O.E., N.F. and A.K.; resources, I.L., L.O.E., N.F. and A.K.; data curation, L.O.E.; writing—original draft preparation, I.L., L.O.E., N.F., A.K.; writing—review and editing, I.L., L.O.E., N.F., A.K.; visualization, I.L., L.O.E.; supervision, I.L.; project administration, L.O.E.; funding acquisition, L.O.E., N.F. All authors have read and agreed to the published version of the manuscript.

Funding

This study was conducted within the frames of the European research project ALTERFOR (Alternative models and robust decision making for future forest management) that has received funding from the European Union’s Horizon 2020 research and innovation program under grant agreement No 676754.

Acknowledgments

We would like to express our gratitude to the interviewed forest consultants and wood-buyers who made this study possible through their participation. We are grateful to Jonas Jonzen for making remote sensing derived data on species distribution available, to David Alger for preparing data for the identification of forest properties, both at Department of Forest Resource Management, and to William Lidberg for the TWI data on soil moisture at the Department of Forest Ecology and Management, all at the Swedish University of Agricultural Sciences.

Conflicts of Interest

The authors declare no conflict of interest.

Appendix A. The Mixed Linear Programming (MILP) Formulation of the Forest Owner Decision Simulator

The forest owner management activities in a particular planning period and the result in terms of harvests volumes and other ecosystem services related measures is corresponding to the solution of an MILP problem. The formal description of this problem is as follows; see Table A1 and the optimization model below.
Table A1. Optimization model definitions.
Indices and Sets
H ,   h Set of forest holdings and set index
R ,   r Set of regeneration alternatives RE1-RE4 in Table 2, and set index
G , G h , g Set of stands, subset of stands belonging to holding h , and set index
F , f Set of strategies and set index
J ,   J g r ,   j Set of management programs for existing forest, the subset of permissible programs belonging to stand g and that can be regenerated with regeneration alternative r , and set index
K ,   K g r , k Set of management programs for barren land or forest that has been established during an earlier period of the simulation period, the subset of permissible programs belonging to stand g with regeneration alternative r , and set index
I , i   Set of NFI plots and set index
B , b   Set of types of barren land and set index
Variables
x g j 1 if stand g is consisting of existing forest and is allocated to management program j , otherwise 0
y g k 1 if stand g is consisting of barren land or forest that has been established during an earlier period of the simulation period and is allocated to management program k , otherwise 0
ρ Objective variable to be maximized
π Slack referring to harvest volume requirement
a h Final felling area of property h
Parameters
A g Area of stand g with existing forest
B g Area of stand g with barren land or forest that has been established during an earlier period of the simulation period
N j ,   M k Indictor whether program j respectively k is prescribing final felling (‘F’), precommercial thinning (‘R’) or (only for k ) establishment (‘E’)
Ω h r Regeneration requirement for holding h and regeneration alternative r as share of permissible area for r on holding h
Φ h Precommercial thinning requirement for holding h as share of possible precommercial thinning area
Θ Harvest volume requirement
Π Penalty associated with harvest volume requirement
Γ h The maximum area of final felling according to Forestry Act for holding h
C h Maximum possible precommercial thinning area for holding h
V j ,   U k Harvest volume ha-1 pertaining to program j and program k , respectively
P j , Q k Net present value of forest management activities in current and future periods ha-1 pertaining to program j and program k , respectively
Table A2. Optimization model.
Maximize ρ = g   · ( r , j J g r P j · A g · x g j +   r , k K g r Q j · B g · y g k ) Π · π   (A1)
subject to
r , j J g r x g j = 1   g | A g (A2)
r , k K g r y g k = 1   g | B g (A3)
r , j J g r   N j = F x g j =   r , k K g r   M k = E y g k     g | A g (A4)
r , k K g r   M k = F y g k = r , k K g r   M k = E y g k     g | B g (A5)
g G h   Ω h r · ( r , j J g r   N j = F A g · x g j +   r , k K g r   M k = F B g · y g k ) = g G h   r , k K g r   M k = E B g · y g k             h H ,   r   ϵ { R E   2   . . R E   4 } (A6)
g G h   · ( r , j J g r   N j = R A g · x g j +   r , k K g r   M k = R B g · y g k ) = Φ h · C h   h H (A7)
g G h   · ( r , j J g r   N j = F A g · x g j +   r , k K g r   M k = F B g · y g k )     Γ h     h H (A8)
g   · ( r , j J g r V j · A g · x g j +   r , k K g r V j · B g · y g k ) + π = Θ   (A9)
x g j = { 0 , 1 } , y g k = { 0 , 1 } , π = [ 0 , ] . and ρ = [ , ] . (A10)
Before explaining the equations, the concept of stand, the form of model and the consequences for admitting forest programs is commented. Firstly, the stand in the model is a pseudo stand, not necessarily identical to the original stand delimitation. The difference is that the area corresponding to the retention of trees at final harvesting harvest is defined as a stand. Thus, the original stand is separated into two parts where applicable. Secondly, the format of the decision problem is a so-called Model II [100]. This means that, once a stand is finally felled, the continued development is linked to variables describing the development from barren land. Thus, there are two different sets that link a stand to its development, one set referring to established forest with a further link to NFI plots and one referring to forest that is established during the current period or has been established in previous period and further linked to programs pertaining to one of the barren land classes. In the former case the stand has its area assigned to A g and in the latter case the area is assigned to B g . Thirdly, before entering the model, the stands are analyzed and assigned permissible programs reflected in the sub-sets J g r and K g r for established stands and for stands that were established in previous or current simulation period, respectively. For instance, protected forest and retention pseudo stands will have their options restricted to programs with no management. The sub-set is also restricted by strategy, some actions not being permissible for a stand belonging to a particular holding. Furthermore, the sub-set is restricted due to previous management activities, i.e., programs are only permissible if they are a sub-set of the sets J g r or K g r of the MILP problem of the previous simulation period, respectively, except for when a new set of programs are made available after final harvest.
Equation (A1) states that the net present value from management of stands less penalty due to non-fulfillment of harvest requirement should be maximized. Equations (A2) and (A3) ensures that all forest is assigned a management program depending on whether it is existing forest from the beginning of the projection period or not. Equations (A4) and (A5) ensures that once a stand is finally felled new forest is established depending on whether it is existing forest from the beginning of the projection period or not. Equation (A6) regulates the form of regeneration of initiallyarren land or after final felling. Equation (A7) specifies that a certain share of the area that can be precommercially thinned should be thinned. Equation (A8) implements the restrictions of the Forestry Act on final felling. The parameter Γ h incorporates the different rules for holdings of different size and the amounts of existing forest of age less than 20 years. Equation (A9) forces harvest to meet the harvest requirement up until a marginal cost of Π m−3.
Penalties are associated with Equations (A7) and (A8) in addition to Equation (A9), although not explicitly stated in the formulation, so as not to make it more complex than necessary. The penalties are set high and are a technical tool to avoid infeasibility. The primary reason for their inclusion is that since the variables x g j and y g k are integers, the solution will rarely coincide with the exact areas. Another reason is to safeguard for the possibility that infeasibility is caused by overlapping requirements, although this should not be the case with the current settings.

References

  1. Börjeson, L.; Höjer, M.; Dreborg, K.-H.; Ekvall, T.; Finnveden, G. Scenario types and techniques: Towards a user’s guide. Futures 2006, 23, 723–739. [Google Scholar] [CrossRef]
  2. Trubins, R.; Jonsson, R.; Wallin, I.; Sallnäs, O. Explicating behavioural assumptions in forest scenario modelling–the behavioural matrix approach. For. Policy Econ. 2019, 444, 299–307. [Google Scholar] [CrossRef]
  3. Nordström, E.-M.; Nieuwenhuis, M.; Başkent, E.Z.; Biber, P.; Black, K.; Borges, J.G.; Bugalho, M.N.; Corradini, G.; Corrigan, E.; Eriksson, L.O.; et al. Forest decision support systems for the analysis of ecosystem services provisioning at the landscape scale under global climate and market change scenarios. Eur. J. For. Res. 2019, 138, 561–581. [Google Scholar] [CrossRef]
  4. Hoogstra-Klein, M.A.; Hengeveld, G.M.; De Jong, R. Analysing scenario approaches for forest management One decade of experience in Europe. For. Policy Econ. 2017, 85, 222–234. [Google Scholar] [CrossRef]
  5. Lindner, M.; Fitzgerald, J.B.; Zimmermann, N.E.; Reyer, C.; Delzon, S.; Van der Maaten, E.; Schelhaas, M.-J.; Lasch, P.; Eggers, J.; Van der Maaten-Theunissen, M. Climate change and European forests: What do we know, what are the uncertainties, and what are the implications for forest management? J. Environ. Manag. 2014, 146, 69–83. [Google Scholar] [CrossRef] [Green Version]
  6. Felton, A.; Gustafsson, L.; Roberge, J.-M.; Ranius, T.; Hjältén, J.; Rudolphi, J.; Lindbladh, M.; Weslien, J.; Rist, L.; Brunet, J. How climate change adaptation and mitigation strategies can threaten or enhance the biodiversity of production forests: Insights from Sweden. Biol. Conserv. 2016, 194, 11–20. [Google Scholar] [CrossRef]
  7. UNFCCC 2015; FCCC/CP/2015/L.9/Rev.1: Adoption of the Paris Agreement: Paris, France, 2015; pp. 1–32. Available online: https://unfccc.int/resource/docs/2015/cop21/eng/l09r01.pdf (accessed on 20 August 2019).
  8. Kraxner, F.; Nordström, E.-M.; Havlík, P.; Gusti, M.; Mosnier, A.; Frank, S.; Valin, H.; Fritz, S.; Fuss, S.; Kindermann, G. Global bioenergy scenarios–Future forest development, land-use implications, and trade-offs. Biomass Bioenergy 2013, 57, 86–96. [Google Scholar] [CrossRef]
  9. Lauri, P.; Forsell, N.; Korosou, A.; Havlík, P.; Obersteiner, M.; Nordin, A. Impact of the 2 °C target on the global woody biomass use. For. Policy Econ. 2017, 83, 121–130. [Google Scholar] [CrossRef] [Green Version]
  10. Lundmark, T.; Bergh, J.; Hofer, P.; Lundström, A.; Nordin, A.; Poudel, B.C.; Sathre, R.; Taverna, R.; Werner, F. Potential roles of Swedish forestry in the context of climate change mitigation. Forests 2014, 5, 557–578. [Google Scholar] [CrossRef]
  11. Rinaldi, F.; Jonsson, R.; Sallnäs, O.; Trubins, R. Behavioral modelling in a decision support system. Forests 2015, 6, 311–327. [Google Scholar] [CrossRef] [Green Version]
  12. Mozgeris, G.; Brukas, V.; Stanislovaitis, A.; Kavaliauskas, M.; Palicinas, M. Owner mapping for forest scenario modelling—A Lithuanian case study. For. Policy Econ. 2017, 85, 235–244. [Google Scholar] [CrossRef]
  13. Schelhaas, M.-J.; Fridman, J.; Hengeveld, G.M.; Henttonen, H.M.; Lehtonen, A.; Kies, U.; Krajnc, N.; Lerink, B.; Ní Dhubháin, Á.; Polley, H.; et al. Actual European forest management by region, tree species and owner based on 714,000 re-measured trees in national forest inventories. PLoS ONE. 2018, 13, e0207151. [Google Scholar] [CrossRef] [PubMed] [Green Version]
  14. Lönnstedt, L. Calculating non-industrial private forest owners’ cuttings. Scand. J. For. Res. 1998, 13, 215–223. [Google Scholar] [CrossRef]
  15. Antón-Fernández, C.; Astrup, R. Empirical harvest models and their use in regional buisness-as-usual scenarios of timber supply and carbon stock development. Scand. J. For. Res. 2012, 27, 379–392. [Google Scholar] [CrossRef]
  16. Eggers, J.; Holmström, H.; Lämås, T.; Lind, T.; Öhman, K. Accounting for a diverse forest ownership structure in projections of forest sustainability indicators. Forests 2015, 6, 4001–4033. [Google Scholar] [CrossRef] [Green Version]
  17. Hengeveld, G.M.; Schüll, E.; Trubins, R.; Sallnäs, O. Forest Landscape Development Scenarios (FoLDS)—A framework for integrating forest models, owners’ behaviour and socio-economic developments. For. Policy Econ. 2017, 85, 245–255. [Google Scholar] [CrossRef]
  18. Sotirov, M.; Sallnäs, O.; Eriksson, L.-O. Forest owner behavioural models, policy changes, and forest management. An agent-based framework for studying the provision of forest ecosystem goods and services at the landscape level. For. Policy Econ. 2019, 103, 79–89. [Google Scholar] [CrossRef]
  19. UNCE-FAO. The European Forest Sector Outlook Study II, 2010-2030; United Nations Publication: Geneva, Switzerland, 2011; p. 107. [Google Scholar]
  20. Verkerk, P.J.; Anttila, P.; Eggers, J.; Lidner, M.; Asikainen, A. The realisable potential supply of woody biomass from forests in the European Union. For. Ecol. Manag. 2011, 261, 2007–2015. [Google Scholar] [CrossRef]
  21. Claesson, S.; Duvemo, K.; Lundström, A.; Wikberg, P.-E. Rapport 2015:10 Skogliga Konsekvensanalyser 2015-SKA 15 [Report 2015:10 Impact Assessments within Forestry 2015-SKA 15]; Skogsstyrelsens böcker och broschyrer: Jönköping, Sweden, 2015; p. 110. [Google Scholar]
  22. Forsell, N.; Korosuo, A.; Havlík, P.; Valin, H.; Lauri, P.; Gusti, M.; Kindermann, G.; Obersteiner, M.; Böttcher, H.; Hennenberg, K.; et al. Study on Impacts on Resource Efficiency of Future EU Demand for Bioenergy (ReceBio); Final report; Publications Office of the European Union: Luxembourg, Luxembourg, 2016; p. 43. [Google Scholar]
  23. Nordström, E.-M.; Forsell, N.; Lundström, A.; Korosuo, A.; Bergh, J.; Havlík, P.; Kraxner, F.; Frank, S.; Fricko, O.; Lundmark, T. Impacts of climate change mitigation scenarios on forests and harvesting in Sweden. Can. J. For. Res. 2016, 46, 1427–1438. [Google Scholar] [CrossRef]
  24. ALTERFOR Project. Available online: https://alterfor-project.eu/ (accessed on 15 March 2020).
  25. Swedish Forest Agency. Statistical Yearbook of Forestry 2014; Swedish Forest Agency: Jönköping, Sweden, 2014; p. 368. [Google Scholar]
  26. Ingemarson, F.; Lindhagen, A.; Eriksson, L. A typology of small-scale private forest owners in Sweden. Scand. J. For. Res. 2006, 21, 249–259. [Google Scholar] [CrossRef]
  27. Eggers, J.; Lämnås, T.; Lind, T.; Öhman, K. Factors influencing the choice of management strategy among small-scale private forest owners in Sweden. Forests 2014, 5, 1695–1716. [Google Scholar] [CrossRef]
  28. Swedish Forest Agency. Skogsvårdslagstiftningen. Gällande Regler 1 April 2019 [The Swedish Forestry Act. Valid Rules 1 April 2019]; Swedish Forest Agency: Jönköping, Sweden, 2019; p. 92. [Google Scholar]
  29. Faustmann, M. 1849. Calculation of the value which forest land and immature stands possess for forestry. Repr. J. For. Econ. 1995, 1, 7–44. [Google Scholar]
  30. Wikström, P.; Edenius, L.; Elfving, B.; Eriksson, L.O.; Lämås, T.; Sonesson, J.; Öhman, K.; Wallerman, J.; Waller, C.; Klintebäck, F. The Heureka forestry decision support system: An overview. Math. Comput. For. Nat. Resour. Sci. 2011, 3, 87–95. [Google Scholar]
  31. Heureka 2019. Heureka Wiki. Swedish University of Agricultural Sciences. Available online: https://www.heurekaslu.se/wiki/Main_Page (accessed on 16 August 2019).
  32. Nurminen, T.; Korpunen, H.; Uusitalo, J. Time consumption analysis of the mechanized cut-to-length harvesting system. Silva Fenn. 2006, 40, 335–363. [Google Scholar] [CrossRef] [Green Version]
  33. Ollas, R. Nya Utbytesfunktioner för Träd och Bestånd [New Yield Functions for Trees and Stands], Ekonomi, 5; Forskningsstiftelsen Skogsarbeten: Stockholm, Sweden, 1980; p. 20. (In Swedish) [Google Scholar]
  34. Levers, C.; Verkerk, P.J.; Müller, D.; Verburg, P.H.; Butsic, V.; Leitão, P.J.; Linder, M.; Kuemmerle, T. Drivers of forest harvesting intensity patterns in Europe. For. Ecol. Manag. 2014, 315, 160–172. [Google Scholar] [CrossRef]
  35. Lodin, I.; Brukas, V.; Wallin, I. Spruce or not? Contextual and attitudinal drivers behind the choice of tree species in Southern Sweden. For. Policy Econ. 2017, 83, 191–198. [Google Scholar] [CrossRef]
  36. Swedish Forest Agency. Älgbetesinventering (ÄBIN) 2015, Kronobergs län [Inventory of Moose Browsing 2015, Kronoberg County]. Available online: https://www.skogsstyrelsen.se/globalassets/statistik/abin-och-andra-betesinventeringar/abin/abinrapporter-tidigare-ar/lan-abinresultat-2015/lansniva-kronoberg-2015.pdf (accessed on 5 July 2018). (In Swedish).
  37. Swedish Forest Agency. Älgbetesinventering och Foderprognos 2015/2016, Kronobergs Län [Inventory of Moose Browsing and Forage Prognosis 2015/2016, Kronoberg County]. Available online: https://www.skogsstyrelsen.se/globalassets/statistik/abin-och-andra-betesinventeringar/abin/abinrapporter-tidigare-ar/lan-abinresultat-2016/kronobergs-lan-2016.pdf (accessed on 5 July 2018). (In Swedish).
  38. Swedish Forest Agency. Älgbetesinventering och Foderprognos 2016/2017, Kronobergs Län [Inventory of Moose Browsing and Forage Prognosis 2016/2017, Kronoberg County]. Available online: https://www.skogsstyrelsen.se/globalassets/statistik/abin-och-andra-betesinventeringar/abin/abinrapporter-tidigare-ar/lan-abinresultat-2017/kronoberg_2017.pdf (accessed on 5 July 2018). (In Swedish).
  39. Swedish Forest Agency. Älgbetesinventering och Foderprognos 2017/2018, Kronobergs Län [Inventory of Moose Browsing and Forage Prognosis 2017/2018, Kronoberg County]. Available online: https://www.skogsstyrelsen.se/globalassets/statistik/abin-och-andra-betesinventeringar/abin/abinrapporter-tidigare-ar/lan-abinresultat-2018/kronoberg_2018.pdf (accessed on 5 July 2018). (In Swedish).
  40. Swedish Forest Agency. Älgbetesinventering och Foderprognos 2018/2019, Kronobergs Län Inventory of Moose Browsing and Forage Prognosis 2017/2018, Kronoberg County]. Available online: https://www.skogsstyrelsen.se/globalassets/statistik/abin-och-andra-betesinventeringar/abin/abinrapporter-2019/lan-abinresultat-2019/kronoberg_2019.pdf (accessed on 10 November 2019). (In Swedish).
  41. Swedish Forest Agency. Results from the Regeneration Inventories in Kronoberg County 2011/12-2015/16; Swedish forest Agency: Jönköping, Sweden, 2017. [Google Scholar]
  42. Fries, C.; Bergquist, J.; Wikström, P. Rapport 2015:6 Lägsta Ålder för Föryngringsavverkning (LÅF)–En Analys av Följder av att Sänka Åldrarna i Norra Sverige till Samma Nivå som i Södra Sverige [Report 2015:6 The Minimum Age for Final Felling–An Analysis of the Effects of Lowering the Ages in Northern Sweden to the Same Level as in Southern Sweden]; Skogsstyrelsens Böcker och Broschyrer: Jönköping, Sweden, 2015; p. 92. (In Swedish) [Google Scholar]
  43. Swedish FSC Standard for Forest Certification Including SLIMF Indicators. FSC-STD-SWE-02-02-2010. Available online: https://se.fsc.org/preview.fsc-forest-management-standard-for-sweden.a-772.pdf (accessed on 13 August 2019).
  44. Svenska PEFC:s Skogsstandard 2017-2022 [Swedish PEFC Forest Standard 2017–2022]. Available online: https://pefc.se/wp-content/uploads/2017/12/PEFC-SWE-002-Skogsstandard-2017-12-15.pdf (accessed on 13 August 2019). (In Swedish).
  45. Statistics Sweden. Formellt skyddad skogsmark, frivilliga avsättningar, hänsynsytor samt improduktiv skogsmark 2018 [Formally protected forest land, voluntary set-asides, consideration patches and unproductive forest land]. Swedens Official Statistics, Statistical Message; MI 41 SM 1902; SCB: Stockholm, Sweden, 2019; p. 42. [Google Scholar]
  46. Swedish Environmental Protection Agency; Swedish Forest Agency. Nationell Strategi för Formellt Skydd av skog. Reviderad Version 2017 [National Strategy for Formal Protection of Forest. Revised Version 2017]; SEPA, SFA: Bromma, Sweden, 2017; p. 88. (In Swedish) [Google Scholar]
  47. Agestam, E. Personal Communication; Southern Swedish Research Centre, Swedish University of Agricultural Sciences: Alnarp, Skåne, Sweden, 2018. [Google Scholar]
  48. Appelstrand, M. Developments in Swedish forest policy and administration – from a policy of restriction toward a policy of cooperation. Scand. J. For. Res. 2012, 27, 186–199. [Google Scholar] [CrossRef]
  49. Brukas, V.; Sallnäs, O. Forest management plan as a policy instrument: Carrot, stick or sermon? Land Use Policy 2012, 29, 605–613. [Google Scholar] [CrossRef] [Green Version]
  50. Guillén, L.A.; Wallin, I.; Brukas, V. Social capital in small-scale forestry: A local case study in Southern Sweden. For. Policy Econ. 2015, 53, 21–28. [Google Scholar] [CrossRef] [Green Version]
  51. Lidskog, R.; Löfmarck, E. Fostering a flexible forest: Challenges and strategies in the advisory practice of a deregulated forest management system. For. Policy Econ. 2016, 62, 177–183. [Google Scholar] [CrossRef] [Green Version]
  52. Brukas, V.; Weber, N. Forest management after the economic transition-at the crossroads between German and Scandinavian traditions. For. Policy Econ. 2009, 11, 586–592. [Google Scholar] [CrossRef] [Green Version]
  53. Forsell, N.; Korosuo, A. 2016 Milestone 6–Global and Country Specific Prospective Scenarios. ALTERFOR. Available online: https://alterforproject.eu/files/alterfor/download/Deliverables/MS%206%20Global%20and%20country%20specific%20scenarios_1.pdf (accessed on 6 July 2019).
  54. Havlík, P.; Valin, H.; Herrero, M.; Obersteiner, M.; Schmid, E.; Rufino, M.C.; Mosnier, A.; Thornton, P.K.; Böttcher, H.; Conant, R.T.; et al. Climate change mitigation through livestock system transitions. Proc. Natl. Acad. Sci. USA 2014, 111, 3709–3714. [Google Scholar] [CrossRef] [PubMed] [Green Version]
  55. Fricko, O.; Havlik, P.; Rogelj, J.; Klimont, Z.; Gusti, M.; Johnson, N.; Kolp, P.; Strubegger, M.; Valin, H.; Amann, M. The marker quantification of the Shared Socioeconomic Pathway 2: A middle-of-the-road scenario for the 21st century. Glob. Environ. Chang. 2017, 42, 251–267. [Google Scholar] [CrossRef] [Green Version]
  56. Eriksson, H.; Fahlvik, N.; Freeman, M.; Fries, C.; Jönsson, A.M.; Lundström, A.; Nilsson, U.; Wikberg, P.-E. Rapport 2015:12 Effekter av ett Förändrat Klimat [Report 2015:12 Effects of a Changed Climate]; Skogsstyrelsens böcker och broschyrer: Jönköping, Sweden, 2015; p. 54. (In Swedish) [Google Scholar]
  57. Swedish University of Agricultural Sciences. Skogsdata 2017; Department of Forest Resource Management, Swedish University of Agricultural Sciences: Umeå, Sweden, 2017; p. 137. [Google Scholar]
  58. Swedish University of Agricultural Sciences, National Forest Inventory. Table 3.31-Mean Annual Volume Increment by Tree Species. Growth of Felled Trees Included. Productive Forest Land (1983-date). Available online: http://skogsstatistik.slu.se/pxweb/en/OffStat/OffStat__ProduktivSkogsmark__Tillväxt/PS_Tillväxt_avverkning_fig.px/?rxid=ccf096a0-61e2-4c43-8f2b-b80c98a4a180 (accessed on 15 November 2019).
  59. Skogskunskap 2019a. Beståndets Biomassa och Energi. Skogforsk. Available online: https://www.skogskunskap.se/rakna-med-verktyg/skogsbransle/bestandets-biomassa-och-energi/ (accessed on 12 April 2019).
  60. Skogskunskap 2019b. Medeltransport Avstånd Götaland. Skogforsk. Available online: https://www.skogforsk.se/kunskap/kunskapsbanken/2016/skogsbrukets-transporter-2014/ (accessed on 16 May 2019).
  61. Skogskunskap 2019c. Transportkostnad väg. Skogforsk. Available online: https://www.skogforsk.se/kunskap/kunskapsbanken/2014/Skogsbrukets-kostnader-och-intakter-20131/ (accessed on 16 May 2019).
  62. Skogskunskap 2019d. Kostnader för skogsbränsle. Skogforsk. Available online: https://www.skogskunskap.se/aga-skog/priser--kostnader/kostnader-for-skogsbransle (accessed on 15 November 2019).
  63. Butler, B.J.; Ma, Z.; Kittredge, D.B.; Catanzaro, P. Social versus biophysical availability of wood in northern United States. North. J. Appl. For. 2010, 27, 151159. [Google Scholar] [CrossRef] [Green Version]
  64. Deuffic, P.; Sotirov, M.; Arts, B. 2018. “Your policy, my rationale”. How individual and structural drivers influence European forest owners’ decisions. Land Use Policy 2018, 79, 1024–1038. [Google Scholar] [CrossRef]
  65. Jonsson, R.; Mustonen, M.; Lundmark, T.; Nordin, A.; Gerasimov, Y.; Granhus, A.; Eugene, H.; Hynynen, J.; Kvist Johannsen, V.; Kaliszewski, A.; et al. Working Papers of the Finnish Forest Research Institute 271. Conditions and Prospects for Increasing Forest Yield in Northern Europe; Finish Forest Research Institute: Vantaa, Finland, 2013; p. 41. Available online: http://www.metla.fi/julkaisut/workingpapers/2013/mwp271.pdf. (accessed on 20 July 2019).
  66. Bostedt, G.; Mustonen, M.; Gong, P. Increasing forest biomass supply in northern Europe—Countrywide estimates and economic perspectives. Scand. J. For. Res. 2015, 31, 314–322. [Google Scholar] [CrossRef] [Green Version]
  67. SLU. Reviderad Svensk Bokföringsrapport för Brukad Skogsmark Inklusive Skoglig Referensnivå [Revised Swedish Report for Managed Forest Including New Reference Level], Rapport; Institutionen för Mark och Miljö: Uppsala, Sweden, 2019; p. 30. (In Swedish) [Google Scholar]
  68. Swedish University of Agricultural Sciences. Skogsdata 2018; Department of Forest Resource Management, Swedish University of Agricultural Sciences: Umeå, Sweden, 2018; p. 143. [Google Scholar]
  69. Holmberg, L.-E. Rapport 2005:9 Sammanställning av Stormskador i Sverige under Senaste 210 Åren [Report 2005:9 Summary of Storm Damages in Sweden during the Last 210 Years]; Skogsstyrelsens böcker och broschyrer: Jönköping, Sweden, 2005; p. 14. (In Swedish) [Google Scholar]
  70. Valinger, E.; Kempe, G.; Fridman, J. Forest management and forest state in southern Sweden before and after the impact of storm Gudrun in the winter of 2005. Scand. J. For. Res. 2014, 29, 466–472. [Google Scholar] [CrossRef]
  71. Puettmann, K.J.; Coates, K.J.; Messier, C. Historical context of silviculture. In A Critique of Silviculture: Managing for Complexity; Island Press: Washington, DC, USA, 2009; pp. 1–40. [Google Scholar]
  72. Felton, A.; Sonesson, J.; Nilsson, U.; Lämås, T.; Lundmark, T.; Nordin, A.; Ranius, T.; Roberge, J.-M. Varying rotation lengths in northern production forests: Implications for habitats provided by retention and production trees. AMBIO 2017, 46, 324–334. [Google Scholar] [CrossRef]
  73. Eggers, J.; Holmgren, S.; Nordström, E.-M.; Lämås, T.; Lind, T.; Öhman, K. Balancing different forest values: Evaluation of forest management scenarios in a multi-criteria decision analysis framework. For. Policy Econ. 2019, 103, 55–69. [Google Scholar] [CrossRef]
  74. Felton, A.; Nilsson, U.; Sonesson, J.; Felton, A.M.; Roberge, J.-M.; Ranius, T.; Ahlström, M.; Bergh, J.; Björkman, C.; Boberg, J. Replacing monocultures with mixed species stands: Ecosystem service implications of two production forest alternatives in Sweden. AMBIO 2016, 45, 124–139. [Google Scholar] [CrossRef] [Green Version]
  75. Cintas, O.; Berndes, G.; Hansson, J.; Bishnu, C.P.; Bergh, J.; Börjesson, P.; Egnell, G.; Lundmark, T.; Nordin, A. The potential role of forest management in the Swedish scenarios towards climate neutrality by mid century. For. Ecol. Manag. 2017, 383, 73–84. [Google Scholar] [CrossRef]
  76. Jonsson, R. How to cope with changing demand conditions—The Swedish forest sector as a case study: An analysis of major drivers of change in the use of wood resources. Can. J. For. Res. 2013, 43, 405–418. [Google Scholar] [CrossRef]
  77. Nilsson, U.; Fahlvik, N.; Johansson, U.; Lundström, A.; Rosvall, O. Simulation of the effect of intensive forest management on forest production in Sweden. Forests 2011, 2, 373–393. [Google Scholar] [CrossRef] [Green Version]
  78. Poudel, B.C.; Sathre, R.; Bergh, J.; Gustavsson, L.; Lundström, A.; Hyvönen, R. Potential effects of intensive forestry on biomass production and total carbon balance in north-central Sweden. Environ. Sci. Policy 2012, 15, 106–124. [Google Scholar] [CrossRef]
  79. Verkerk, P.J.; Mavsar, R.; Giergiczny, M.; Lindner, M.; Edwards, D.; Schelhaas, M.J. Assessing impacts of intensified biomass production and biodiversity protection on ecosystem services provided by European forests. Ecosyst. Serv. 2014, 9, 155–165. [Google Scholar] [CrossRef]
  80. Felton, A.; Löfroth, T.; Angelstam, P.; Gustafsson, L.; Hjalten, J.; Felton, A.M.; Simonsson, P.; Dahlberg, A.; Lindbladh, M.; Svensson, J.; et al. Keeping pace with forestry: Multi-scale conservation in a changing production forest matrix. AMBIO 2019. [Google Scholar] [CrossRef] [Green Version]
  81. Gusti, M.; Kindermann, G. An approach to modeling landuse change and forest management on a global scale. In Proceedings of the 1st International Conference on Simulation and Modeling Methodologies, Technologies and Applications (SIMULTECH 2011), Noordwijkerhout, The Netherlands, 29–31 July 2011; pp. 180–185. [Google Scholar]
  82. Böttcher, H.; Verkerk, P.J.; Gusti, M.; HavlÍk, P.; Grassi, G. Projection of the future EU forest CO 2 sink as affected by recent bioenergy policies using two advanced forest management models. GCB Bioenergy 2012, 4, 773–783. [Google Scholar] [CrossRef] [Green Version]
  83. Forest Europe. State of Europe’s Forests 2015; Ministerial Conference on the Protection of Forests in Europe: Madrid, Spain, 2015; p. 314. [Google Scholar]
  84. Gallaun, H.G.; Zanchi, G.J.; Nabuurs, G.; Hengeveld, M.; Schardt, P.; Verkerk, P.J. EU-wide maps of growing stock and above-ground biomass in forests based on remote sensing and field measurements. For. Ecol. Manag. 2010, 260, 252–261. [Google Scholar] [CrossRef]
  85. Brus, D.J.; Hengeveld, G.M.; Walvoort, D.J.J.; Goedhart, P.W.; Heidema, A.H.; Nabuurs, G.J.; Gunia, K. Statistical mapping of tree species over Europe. Eur. J. For. Res. 2012, 131, 145–157. [Google Scholar] [CrossRef]
  86. Verkerk, P.J.; Levers, C.; Kuemmerle, T.; Lindner, M.; Valbuena, R.; Verburg, P.H.; Zudin, S. Mapping wood production in European forests. For. Ecol. Manag. 2015, 357, 228–238. [Google Scholar] [CrossRef] [Green Version]
  87. Grönlund, Ö.; Di Fulvio, F.; Bergström, D.; Djupström, L.; Eliasson, L.; Erlandsson, E.; Forsell, N.; Korosuo, A. Mapping of voluntary set-aside forests intended for nature conservation management in Sweden. Scand. J. For. Res. 2019, 34, 133–144. [Google Scholar] [CrossRef]
  88. European Commission. Regulation (EU) 2018/841 of the European parliament and of the council of 30 May 2018 on the inclusion of greenhouse gas emissions and removals from land use, land use change and forestry in the 2030 climate and energy framework, and amending Regulation (EU) No 525/2013 and Decision No 529/2013/EU. Off. J. Eur. Union 2018. Available online: https://eur-lex.europa.eu/legal-content/EN/TXT/PDF/?uri=CELEX:32018R0841&from=EN (accessed on 19 June 2018).
  89. Kallio, A.M.I.; Solberg, B.; Käär, L.; Päivinen, R. Economic impacts of setting reference levels for the forest carbon sinks in the EU on the European forest sector. For. Policy Econ. 2018, 92, 193–201. [Google Scholar] [CrossRef]
  90. Nabuurs, G.J.; Arets, E.J.; Schelhaas, M.J. Understanding the implications of the EU-LULUCF regulation for the wood supply from EU forests to the EU. Carbon Balance Manag. 2018, 13, 18. [Google Scholar] [CrossRef] [PubMed]
  91. Latta, G.S.; Sjølie, H.K.; Solberg, B. A review of recent developments and applications of partial equilibrium models of the forest sector. J. For. Econ. 2013, 19, 350–360. [Google Scholar] [CrossRef]
  92. Chudy, R.P.; Sjølie, H.K.; Latta, G.S.; Solberg, B. Effects on forest products markets of second-generation biofuel production based on biomass from boreal forests: A case study from Norway. Scand. J. For. Res. 2019, 34, 218–227. [Google Scholar] [CrossRef]
  93. Belyazid, S.; Giuliana, Z. Water limitation can negate the effect of higher temperatures on forest carbon sequestration. Eur. J. For. Res. 2019, 138, 287–297. [Google Scholar] [CrossRef] [Green Version]
  94. Subramanian, N.; Nilsson, U.; Mossberg, M.; Bergh, J. Impacts of climate change, weather extremes and alternative strategies in managed forests. Écoscience 2019, 26, 53–70. [Google Scholar] [CrossRef] [Green Version]
  95. Nilsson, U.; Berglund, M.; Bergquist, J.; Holmström, H.; Wallgren, M. Simulated effects of browsing on the production and economic values of Scots pine (Pinus sylvestris) stands. Scand. J. For. Res. 2016, 31, 279–285. [Google Scholar] [CrossRef]
  96. Angelstam, P.; Pedersen, S.; Manton, M.; Garrido, P.; Naumov, V.; Elbakidze, M. Green infrastructure maintenance is more than land cover: Large herbivores limit recruitment of key-stone tree species in Sweden. Landsc. Urban Plan. 2017, 167, 368–377. [Google Scholar] [CrossRef]
  97. Petersson, L.K.; Milberg, P.; Bergstedt, J.; Dah, J.; Felton, A.M.; Götmark, F.; Salk, C.; Löf, M. Changing land use and increasing abundance of deer cause natural regeneration failure of oaks: Six decades of landscape-scale evidence. For. Ecol. Manag. 2019, 444, 299–307. [Google Scholar] [CrossRef]
  98. Lönnstedt, L. Non-industrial private forest owners’ decision process: A qualitative study about goals, time perspective, opportunities and alternatives. Scand. J. For. Res. 1997, 12, 302–310. [Google Scholar] [CrossRef]
  99. Eriksson, L. Åtgärdsbeslut i Privatskogsbruket [Treatment Decisions in Privately Owned Forestry]; Report No 11; Department of Forest products, Swedish University of Agricultural Sciences: Uppsala, Sweden, 2008; p. 93. [Google Scholar]
  100. Johnson, K.N.; Scheurman, H.L. Techniques for prescribing optimal timber harvest and investment under different objectives—Discussion and synthesis. For. Sci. 1977, 23 (Suppl. S1), 1–31. [Google Scholar]
Figure 1. Overview of the forest simulator with data and models that were interconnected to project the development of the forest of one forest holding from period t to period t+1.
Forests 11 00346 g001
Figure 2. The initial state for forest variables for the 10 areas representing Kronoberg County with respect to (a) age class distribution, (b) site index H100 in 2 m classes, and (c) species distribution.
Forests 11 00346 g002
Figure 3. Development of the roundwood (sawlogs and pulpwood from thinning and final felling) demands (expressed as percentage of first period demand) in the study region in the three climate change mitigation scenarios relative to the demand in the first period.
Forests 11 00346 g003
Figure 4. Projected harvests (expressed as percentage of first period harvest) of roundwood (sawlogs and pulpwood from thinning and final felling) with current forest management practices in the three climate change mitigation scenarios.
Forests 11 00346 g004
Figure 5. Projected utilization rates (total felling in PCTs, thinning and final felling/net increment) on the net area used for wood production (84.6% of the productive forestland, set-asides and retention areas in production stands are not included) with current forest management practices in the three climate change mitigation scenarios.
Forests 11 00346 g005
Figure 6. Projected average standing volumes of living trees on productive forestland (>1 m3ha−1year−1) with current forest management practices in the three climate change mitigation scenarios.
Forests 11 00346 g006
Figure 7. Projected actual vs potential final felling areas (in hectares) with current forest management practices in the three climate change mitigation scenarios.
Forests 11 00346 g007
Figure 8. Projected harvests (expressed as percentage of first period harvest) of roundwood (sawlogs and pulpwood from thinning and final felling) with current management approaches of different intensities in the GLOBAL BIOENERGY scenario.
Forests 11 00346 g008
Figure 9. Projected potential areas available for final felling (in hectares) with current management approaches of different intensities in the GLOBAL BIOENERGY scenario.
Forests 11 00346 g009
Figure 10. Projected average rotations (i.e., age at final felling) with current forest management approaches of different intensities in the GLOBAL BIOENERGY scenario.
Forests 11 00346 g010
Figure 11. Projected utilization rates (total felling in PCTs, thinnings and final fellings/net increment) on the net forest area used for production (84.9% of the productive forestland, set-asides and retention areas in production stands are not included) with current forest management approaches of different intensities in the GLOBAL BIOENERGY scenario.
Forests 11 00346 g011
Figure 12. Projected average standing volumes of living trees on productive forestland (>1 m3ha−1year−1) with current forest management approaches of different intensities in the GLOBAL BIOENERGY scenario.
Forests 11 00346 g012
Table 1. Summary of main sources used in the mapping of current management practices. The table also provides some target proportions for different treatments that have been guiding the settings in the projections.
TreatmentsTarget PproportionsMain Sources
RegenerationNatural regeneration on moist/wet sites: approx. 9%; failed regeneration: approx. 4% (after legal supervision by the SFA); Scots pine: approx. 12% (% of the reforested area) Share of genetically improved seedlings today and future development: [21] (p. 34).
Regeneration methods and tree species choice: The SFAs regeneration inventory in Kronoberg 2011/12–2015/16 [41], ÄBIN Kronoberg County 2015-2019 [36,37,38,39,40], interviews.
Growth of seed tree regenerated pine: Eric Agestam, personal communication [47].
Pre-commercial
thinning (PCT)
75% of the production forest area is treated with PCTShare of the young forest treated with PCT: [21] (p. 34).
PCT type: Interviews
Thinning- Interviews, [27].
Final felling
with
retention
Total retention area (i.e., retention patches and retention trees) of each final felling stand:
8% (6% retention patches, 2% retention trees)
Rotation periods: [42] (p. 30), interviews.Share of retention patches of felled area: [21] (p. 31). Retention trees and high stumps: [21] (p. 36)
Set-asidesTotal share of set-asides:
approx. 8% of the productive forestland (2% formal set-asides, 6% voluntary set-asides).
Share of voluntary set-asides: [45] (p. 18)
Share of formal set-asides: [46] (p. 57)
Site selection of nature conservation with/without management: Södras forest management plans in Kronoberg County
Management of set-asides with management: Interviews
Logging residue extraction-Site selection: Interviews
Table 2. Overview of the different silvicultural treatments.
Silvicultural TtreatmentsDescriptions
RE 1Standard planting program for Norway spruce in Heureka. Allowed on all sites.
RE 2Standard planting program for Scots pine in Heureka. Used to project regeneration through planting (1/3) and regeneration with seed trees (2/3). The growth was reduced to account for the lower production associated with seed tree regeneration (based on [47]. Allowed on sites with SI (site index) H1001 ≤ 26.
RE 3Natural regeneration on moist and wet sites resulting in an admixture of Birch and Norway spruce.
RE 4Failed regeneration resulting in a very sparse stand dominated by Birch. This program should represent no measure on mesic and dry sites, which is the regeneration method with the highest rate of failure (40% do not fulfil the minimum seedling density requirements in the Forestry act [41]).
PCT 1Standard PCT program in Heureka, favoring conifers at the expense of broadleaves.
PCT 2PCT program aiming to maintain a high share of broadleaves.
TH 1Standard thinning program in Heureka, favoring conifers at the expense of broadleaves.
TH 2Thinning program aiming to maintain a high share of broadleaves.
Final fellingPermissible 10–60 years past the minimum allowable rotation age depending on dominant species and owner strategy.
Logging residue extractionIn connection with final felling of spruce dominated stands on dry and mesic sites.
Nature conservation thinning in set-asides with managementReoccurring thinnings (approx. every 20 years) favoring broadleaves at the expense of conifers in set-asides actively managed for nature conservation (stands dominated by broadleaves, and especially noble broadleaves2)
No management in set-asides without managementUndisturbed growth pertaining to set-asides without management (low productive wet/moist stands and broadleaved dominated stands prioritized).
No management in areas retained at final felling sitesImplemented by assigning no management to 8% of each production stand from the first period in the projections.
1.H100: Dominant heights at 100 years. 2.Beech (Fagus sylvatica), Oak (Quercus spp.), Ash (Fraxinus excelsior), Elm (Ulmus spp.), Lime (Tilia Cordata), Hornbeam (Carpinus Betulus), Cherry (Prunus avium) and Norway maple (Acer platanoides).
Table 3. Description of the five different forest owner strategies.
StrategyDescription
IntensiveExcellent regeneration quality i.e., no RE4 and RE3 on suitable sites. All the young forests “in need” of PCT are treated with PCT 1. Max two thinnings with TH 1. Final felling allowed 10 years1 or 20 years2 past the minimum rotation age in the Forestry act. Approx. 8% set-asides with equal share of set-asides with/without management.
ProductivityExcellent regeneration quality i.e., no RE4 and RE3 on suitable sites. 77.5% of the young forests “in need” of PCT are treated with PCT 1. Max two3 or three4 thinnings with TH 1. Final felling allowed 20 years1 or 30 years2 past the minimum rotation age in the Forestry act. Approx. 8% set-asides with equal share of set-asides with/without management.
SaveOk regeneration quality, RE3 on suitable sites but some RE4. 50 % of the young forests “in need” of PCT are treated with PCT 1. Max one3 or two4 thinnings with TH 1. Final felling allowed 30 years1 or 40 years2 past the minimum rotation age in the Forestry act. Approx. 8% set-asides with higher share of set-asides without management.
ConservationOk regeneration quality, some RE 4 and a higher share of RE 3 to avoid scarification and to increase the share of broadleaves. 50% of the young forests “in need” of PCT are treated with PCT 2. Max two thinnings with TH 2. Final felling allowed 30 years1 or 40 years2 past the minimum rotation age in the Forestry act. Approx. 12% set-asides with equal share of set-asides with/without management.
PassivePoor regeneration quality i.e., high share of RE4 and RE3. No PCT. Max one thinning with TH 1. Final felling allowed 50 years1 or 60 years2 past the minimum rotation age in the Forestry act. Approx. 8% set-asides without management.
1 Spruce dominated stands (>50% volume Norway spruce); 2 None spruce dominated stands (< 50% volume Norway spruce); 3 None pine dominated stands (< 50% volume Scots pine);4 Pine dominated stands (>50% volume Scots pine).
Table 4. Distribution of the five different forest owner strategies over the productive forestland (>1 m3ha−1year−1) in the 10 projected areas. This distribution was used in the projections with current management practices.
StrategyProportion (%)
Intensive30.4
Productivity39.5
Save15.2
Conservation8.3
Passive6.6
Table 5. Prices SEK per m3 under bark for sawlogs and pulpwood.
Scenario
GLOBAL BIOENERGYEU BIOENERGYREFERENCE
YearSawlogsPulpwoodSawlogsPulpwoodSawlogsPulpwood
2015452334453335453334
2020454335456337455336
2025518378510366541376
2030583421564394627416
2035596432609404635408
2040610443654414644401
2045606440662413648360
2050603436670412652319
2055603436684383686328
2060602435699353719338
2065602435708347718338
2070602436717340718338
2075632465716341721335
2080662495715342724333
2085690524712347728327
2090719552708352732322
2095713562701361740312
2100708572693369747302
2105708572693369747302
2110708572693369747302

