Article

Small-Scale Forest Structure Influences Spatial Variability of Belowground Carbon Fluxes in a Mature Mediterranean Beech Forest

by
Ettore D’Andrea
1,*,
Gabriele Guidolotti
2,
Andrea Scartazza
3,
Paolo De Angelis
4 and
Giorgio Matteucci
1
1
CNR-ISAFOM, Via Patacca, 85 I, 80056 Ercolano, Italy
2
CNR-IRET, Viale Guglielmo Marconi, 2, 05010 Porano, Italy
3
CNR-IRET, Via Moruzzi 1, 56124 Pisa, Italy
4
UNITUS-DIBAF, Via San Camillo de Lellis, 01100 Viterbo, Italy
*
Author to whom correspondence should be addressed.
Forests 2020, 11(3), 255; https://doi.org/10.3390/f11030255
Submission received: 23 January 2020 / Revised: 18 February 2020 / Accepted: 21 February 2020 / Published: 26 February 2020

Abstract

:
The tree belowground compartment, especially fine roots, plays a relevant role in the forest ecosystem carbon (C) cycle, contributing largely to soil CO2 efflux (SR) and to net primary production (NPP). Beyond the well-known role of environmental drivers on fine root production (FRP) and SR, other determinants such as forest structure are still poorly understood. We investigated spatial variability of FRP, SR, forest structural traits, and their reciprocal interactions in a mature beech forest in the Mediterranean mountains. In the year of study, FRP resulted in the main component of NPP and explained about 70% of spatial variability of SR. Moreover, FRP was strictly driven by leaf area index (LAI) and soil water content (SWC). These results suggest a framework of close interactions between structural and functional forest features at the local scale to optimize C source–sink relationships under climate variability in a Mediterranean mature beech forest.

1. Introduction

Terrestrial ecosystems, especially forests, have an active role in the global carbon (C) cycle: forests cover about 4.2 × 10³ Mha of the earth’s land surface, accounting for about 45% of terrestrial carbon and contributing to about 50% of terrestrial net primary production (NPP) [1]. As we are following the climatic scenario characterized by the highest variations [2], forests play a crucial role to mitigate global climatic change by removing 2.4 ± 0.4 Pg C y−1 from the atmosphere through growth [3]. This amount corresponds up to 30% of anthropogenic CO2 emissions from fossil fuel burning and deforestation [4]; hence, it is evident how changes in the productivity of the forest ecosystem affects the C-cycle.
Overall, the forest net effect on the carbon cycle is strictly related to net primary production (NPP), which is the small difference between the amount of C absorbed through photosynthesis and the C emitted by plant (autotrophic) respiration [5]. NPP is usually estimated as the new organic matter produced during a given period (generally one year), in both aboveground and belowground plant compartments, and it is affected by environmental drivers [6].
Within the belowground compartment, fine root production (FRP) plays a relevant role on NPP at both ecosystem and global levels accounting for up to 67% and 22% of NPP, respectively [7,8]. Moreover, at the ecosystem level, FRP affects both autotrophic and heterotrophic components of soil CO2 efflux (SR) [9,10,11], contributing to 30%–80% of annual total ecosystem respiration [12].
Despite the importance of fine roots in the ecological processes, our understanding on their dynamics is still limited [13,14]. Studies were mainly focused on the role of environmental drivers on FRP [15,16], evidencing the impact of FRP on SR, both within and among ecosystems [11,17,18]. Therefore, a better identification of drivers regulating belowground processes through FRP is essential for a correct estimation of the ecosystem C budget [19].
The forest structure, here defined as the distribution of trees over an area, is determined by past management practices and represents one of the major drivers of the forest C cycle [20,21,22] and biodiversity [23]. Indeed, the forest structure interacts with tree physiological functionality [13,24] and climate [19], affecting C allocation and source–sink relationships [25,26].
In this context, the general objective of this study was to explore the intra-site relationships among forest structures (number of trees, basal area, maximum diameter, and leaf area index), soil characteristics, and spatial variability of SR and FRP in a mature beech stand in Mediterranean montane conditions, characterized by an almost total canopy closure. Hence, FRP, SR, soil proprieties, and forest structural parameters were measured in different randomized plots inside the stand.
Specific aims of the present study were to assess (i) the fraction of annual NPP partitioned to FRP; (ii) if, and which, intra-stand forest structural parameters and soil characteristics affect FRP; and (iii) the effect of FRP on the spatial variability of SR.

2. Materials and Methods

2.1. Site Characteristics

The experiment was carried out during 2007–2008 in a European beech (Fagus sylvatica L.) forest near Collelongo (Abruzzi Region, Central Italy, Figure 1A), where a permanent experimental facility (Selva Piana stand, 41°50′58″ N, 13°35′17″ E, 1560 m elevation) was established in 1991. The Selva Piana stand is located within a 3000 ha community forest that is part of a wider forest area, included in the external belt of the Abruzzi National Park. The environmental and structural conditions of the stand are representative of central Apennine beech forests. In 2007, the stand density was 825 trees ha−1, and the basal area was 40.5 m2 ha−1 with a mean diameter at breast height of 25 cm and a mean height of 21.5 m. Mean tree age in 2007 was estimated to be about 115 years.
The forest structure is characterized by a sensible vertical stratification derived from a conversion of a beech coppice with standards to high stand [24,27] started after the middle of the 20th century.
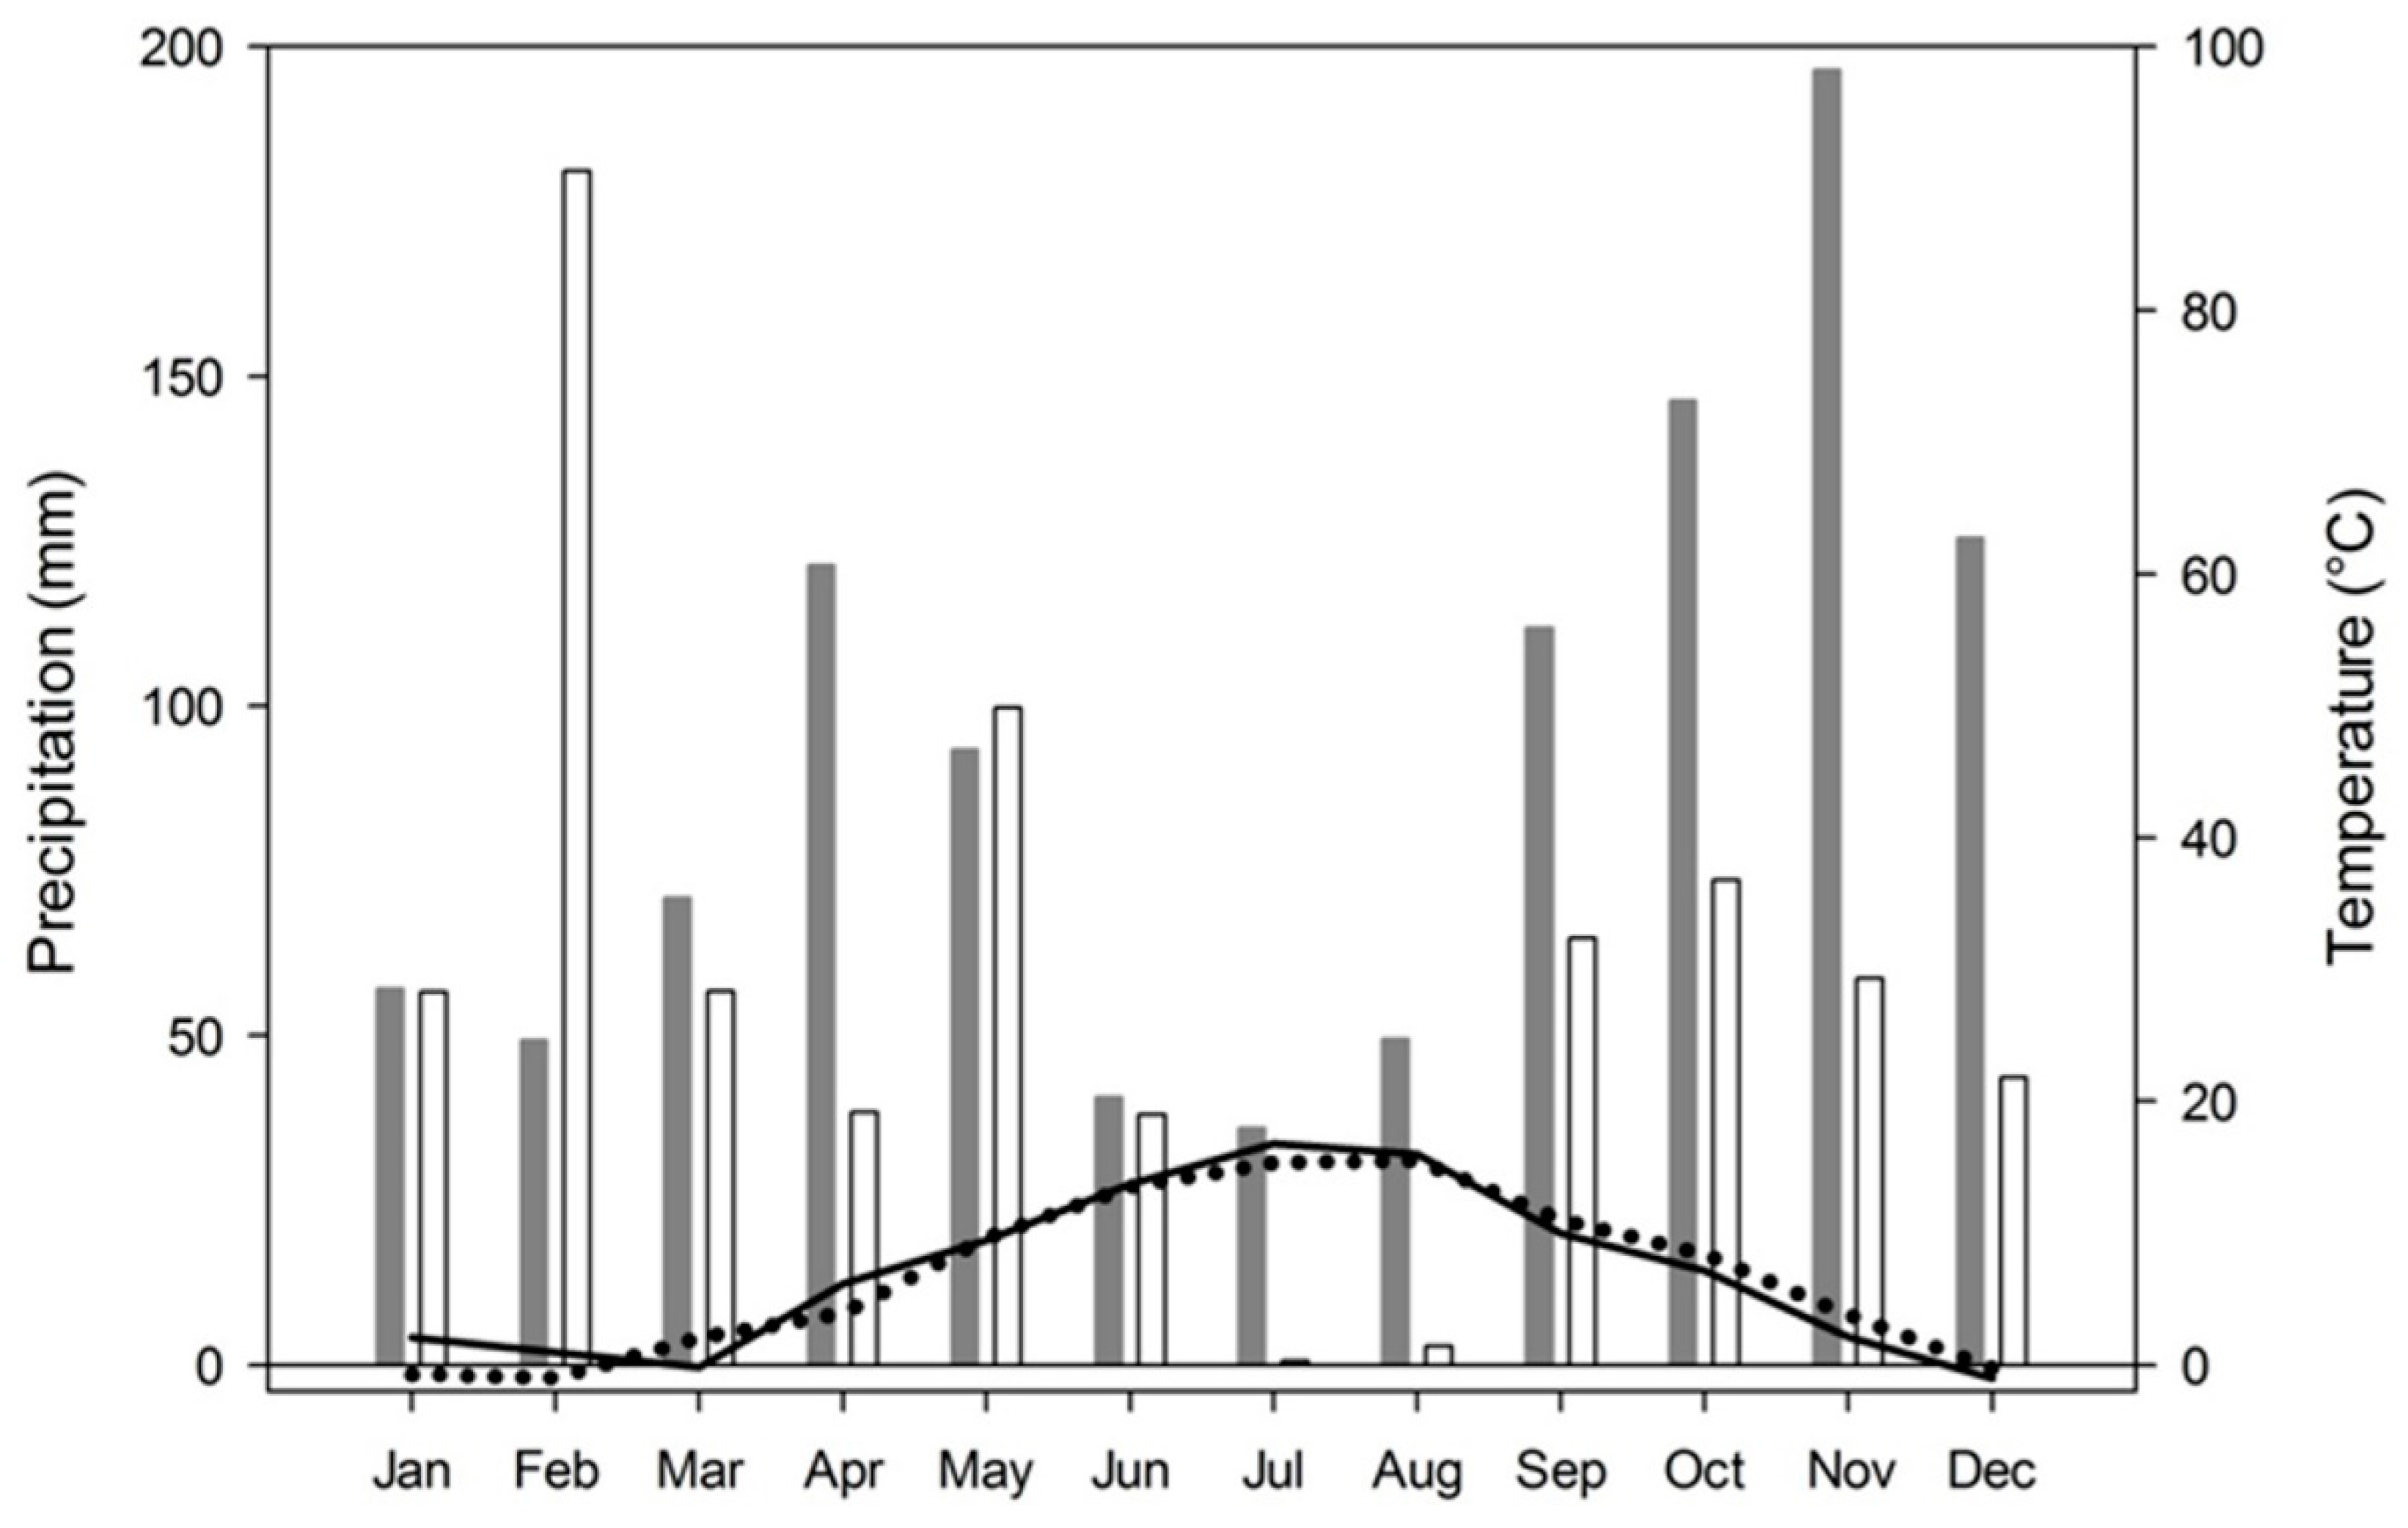
The soil, developed on calcareous bedrock, has a variable depth (40–100 cm) and is classified as a humic Alisol [28]. Site topography is gently sloping. The climate is Mediterranean montane, with a mean annual temperature of 6.97 °C, and the mean temperatures of the coldest and warmest months are −1.04 and 16.3 °C, respectively (average of 1996–2014). Mean annual precipitation is 1116 mm, of which ~10% falls in summer. During the study, in 2007, the summer was extremely dry with only 3 mm precipitation in July and August (Figure 2).

2.2. Experimental Design

To assess the role of local forest structure on the studied parameters, nine circular and relatively small experimental plots (5 m radius) were randomly established, maintaining a minimum distance of 15 m between plots centers (Figure 1B). Inside each plot, we measured forest structural parameters, soil CO2 efflux, FRP, and soil characteristics (Figure 1C).

2.3. Fine Root Production (FRP)

The ingrowth core method (Ostonen et al. 2005) was used to estimate FRP. In each experimental plot, two ingrowth cores were installed at the beginning of April 2007. Cores were made of 0.4 cm mesh net of plastic material, to allow ingrowth of fine to medium roots (1 to 4 mm). The cores were cylindrical, with a base diameter of 5.5 cm and exploring a depth of 30 cm, as over 90% of fine roots are located at this soil depth [29,30,31]. Cores were filled using soil collected in the same stand near the experimental plots, air dried, and sieved at 0.4 mm to remove all the roots. One of the two cores was extracted 6 months later at the end of the growing season (October 2007), while the second core was collected one year after the installation, before the bud break (May 2008), because diffuse, porous ring species tend to produce a greater proportion of their roots after bud break [14]. After the extractions, cores were carried to the laboratory for fine roots collection (<2 mm). Hence, FRP for both annual (FRPY) and growing season (FRPG) scales was estimated. Finally, FRP for the leafless period (FRPLP, related to winter and early spring FRP) was calculated as the difference between FRPY and FRPG. In addition, other 11 plots were established, where only FRP was measured according to the above-described protocol. This additional dataset was used only to increase to 20 the sampling points used for NPP estimation.

2.4. Forest Structural Parameters

At the center of each sampling plot, leaf area index (LAI) was measured at the seasonal peak of 2007 (July) through two LAI 2000 Canopy Analyzers (Li-Cor) measuring above and below the canopy, respectively. LAI values were calculated using the software FV2200 (LICOR Biosciences, Lincoln, NE, USA) by considering only four of the five measuring rings to restrict the angle of view to better represent LAI of the sampling plots.
At the end of the experiment (May 2008), the diameter at breast height (DBH) of each tree inside the plots was measured, and the basal area (BA), representing the area (m2) of the cross-section of the stem measured at 1.30 m height, mean, and maximum tree diameter of the plot (Dmax) were derived.

2.5. Soil CO2 Efflux, Microclimatic Condition, and Soil Characteristics

Inside the nine experimental plots, five PVC collars (10 cm diameter and 5 cm high, for a total of 45 points) were inserted in the soil with a circular distribution spaced at a minimum of 50 cm away from the neighboring trees (Figure 1C). A closed dynamic system (EGM 4, PP-System, Hitchin, UK), connected to a SRC-1 Soil Respiration Chamber (PP-System, Hitchin, UK), was used to measure SR. Measurements were performed from May 2007 until May 2008 for a total of 11 campaigns, 7 during growing season (from May to October 2007) and 4 in the leafless season (from November 2007 to April 2008) (see Guidolotti et al., 2013, for further information on SR measurements).
Soil temperature (T Soil) and soil water content (SWC) were measured at 0–10 cm by means of STP-1 (PP-System, Hitchin, UK) and time domain reflectometry techniques (Trime-FM, IMKO, gmbH, Ettlingen, Germany), respectively. All measurements were performed concurrently to the SR sampling.
In May 2008, litter and soil samples, down to 30 cm depth, were collected inside and below each PVC collar installed for SR measurements.

2.6. Carbon/Nitrogen Concentration

Litter, soil, and fine root C and N content were determined by an elemental analyzer (Model NA 1500, Carlo Erba, Milan, Italy). Soil samples were previously treated with HCl (10%) to remove carbonates.

2.7. Statistical Analysis

Analysis of the relationships between fine root production with both forest structural parameters and soil characteristics were performed only on annual values of FRP (FRPY) because soil sampling and DBH measurements to calculate the forest structural parameters were carried out at the end of the experimental period in May 2008.
Stepwise analysis was used to select the independent variables determining FRPY (Table 1 and Table S1). We tested data normality and constant variance using the Shapiro–Wilk test and the Spearman rank correlation between the absolute values of the residuals and the observed value of the dependent variable. We applied communality analysis (CA) to a multiple linear regression built with the variables identified by the stepwise analysis to disentangle the effects of each independent variable. Communality analysis shares the explained variance into pure and joint effects of predictors in order to assess the relative contribution of each predictor to the explained variance of the response variable [32].

3. Results

3.1. Fine Root Production and Its Drivers

Fine root production during the growing season (FRPG) was estimated at 7.63 ± 2.02 Mg ha−1, ranging from 5.47 to 10.93 Mg ha−1, with a coefficient of variation (CV) of 0.26. In May 2008, 12 months after in-growth cores installation, FRPY was 9.80 ± 1.97 Mg ha−1 y−1, ranging from 7.32 to 13.50 Mg ha−1 y−1 and with a CV of 0.20. The FRPLP, estimated as the difference between FRPY and FRPG, was 2.17 ± 1.50 Mg ha−1.
Considering that total carbon NPP for the Selva Piana experimental site in 2007–2008 was 11.01 MgC ha−1 y−1 [33], and that the amount of C allocated in fine roots was 3.92 MgC ha−1 y−1 (with C content of fine roots at 40.02 ± 1.92%), the contributions to total NPP by FRPY, stem and branches, leaves, and coarse roots were 36%, 33%, 22%, and 9%, respectively.
The step-wise analysis results indicated LAI, related to basal area (Figure S1), and SWC as the variables affecting FRPY (FRPY = −7.504 + 0.145 SWC + 2.342 LAI, R2 = 0.928, p < 0.01). The commonality analysis suggested that 44% of the whole variability was affected by the pure effect of LAI, 20% related to SWC, and 36% was affected by the joint effect of the two predictors.

3.2. Spatial Variability of Soil Respiration

In the study period, SR was 1.49 ± 0.22 μmol CO2 m−2 s−1 and ranged from 1.04 to 1.83 μmol CO2 m−2 s−1. We observed relevant variability at both spatial (among the 9 experimental plots) and seasonal (among the 11 SR campaigns) scales with mean CVs of 0.15 and 0.46, respectively.
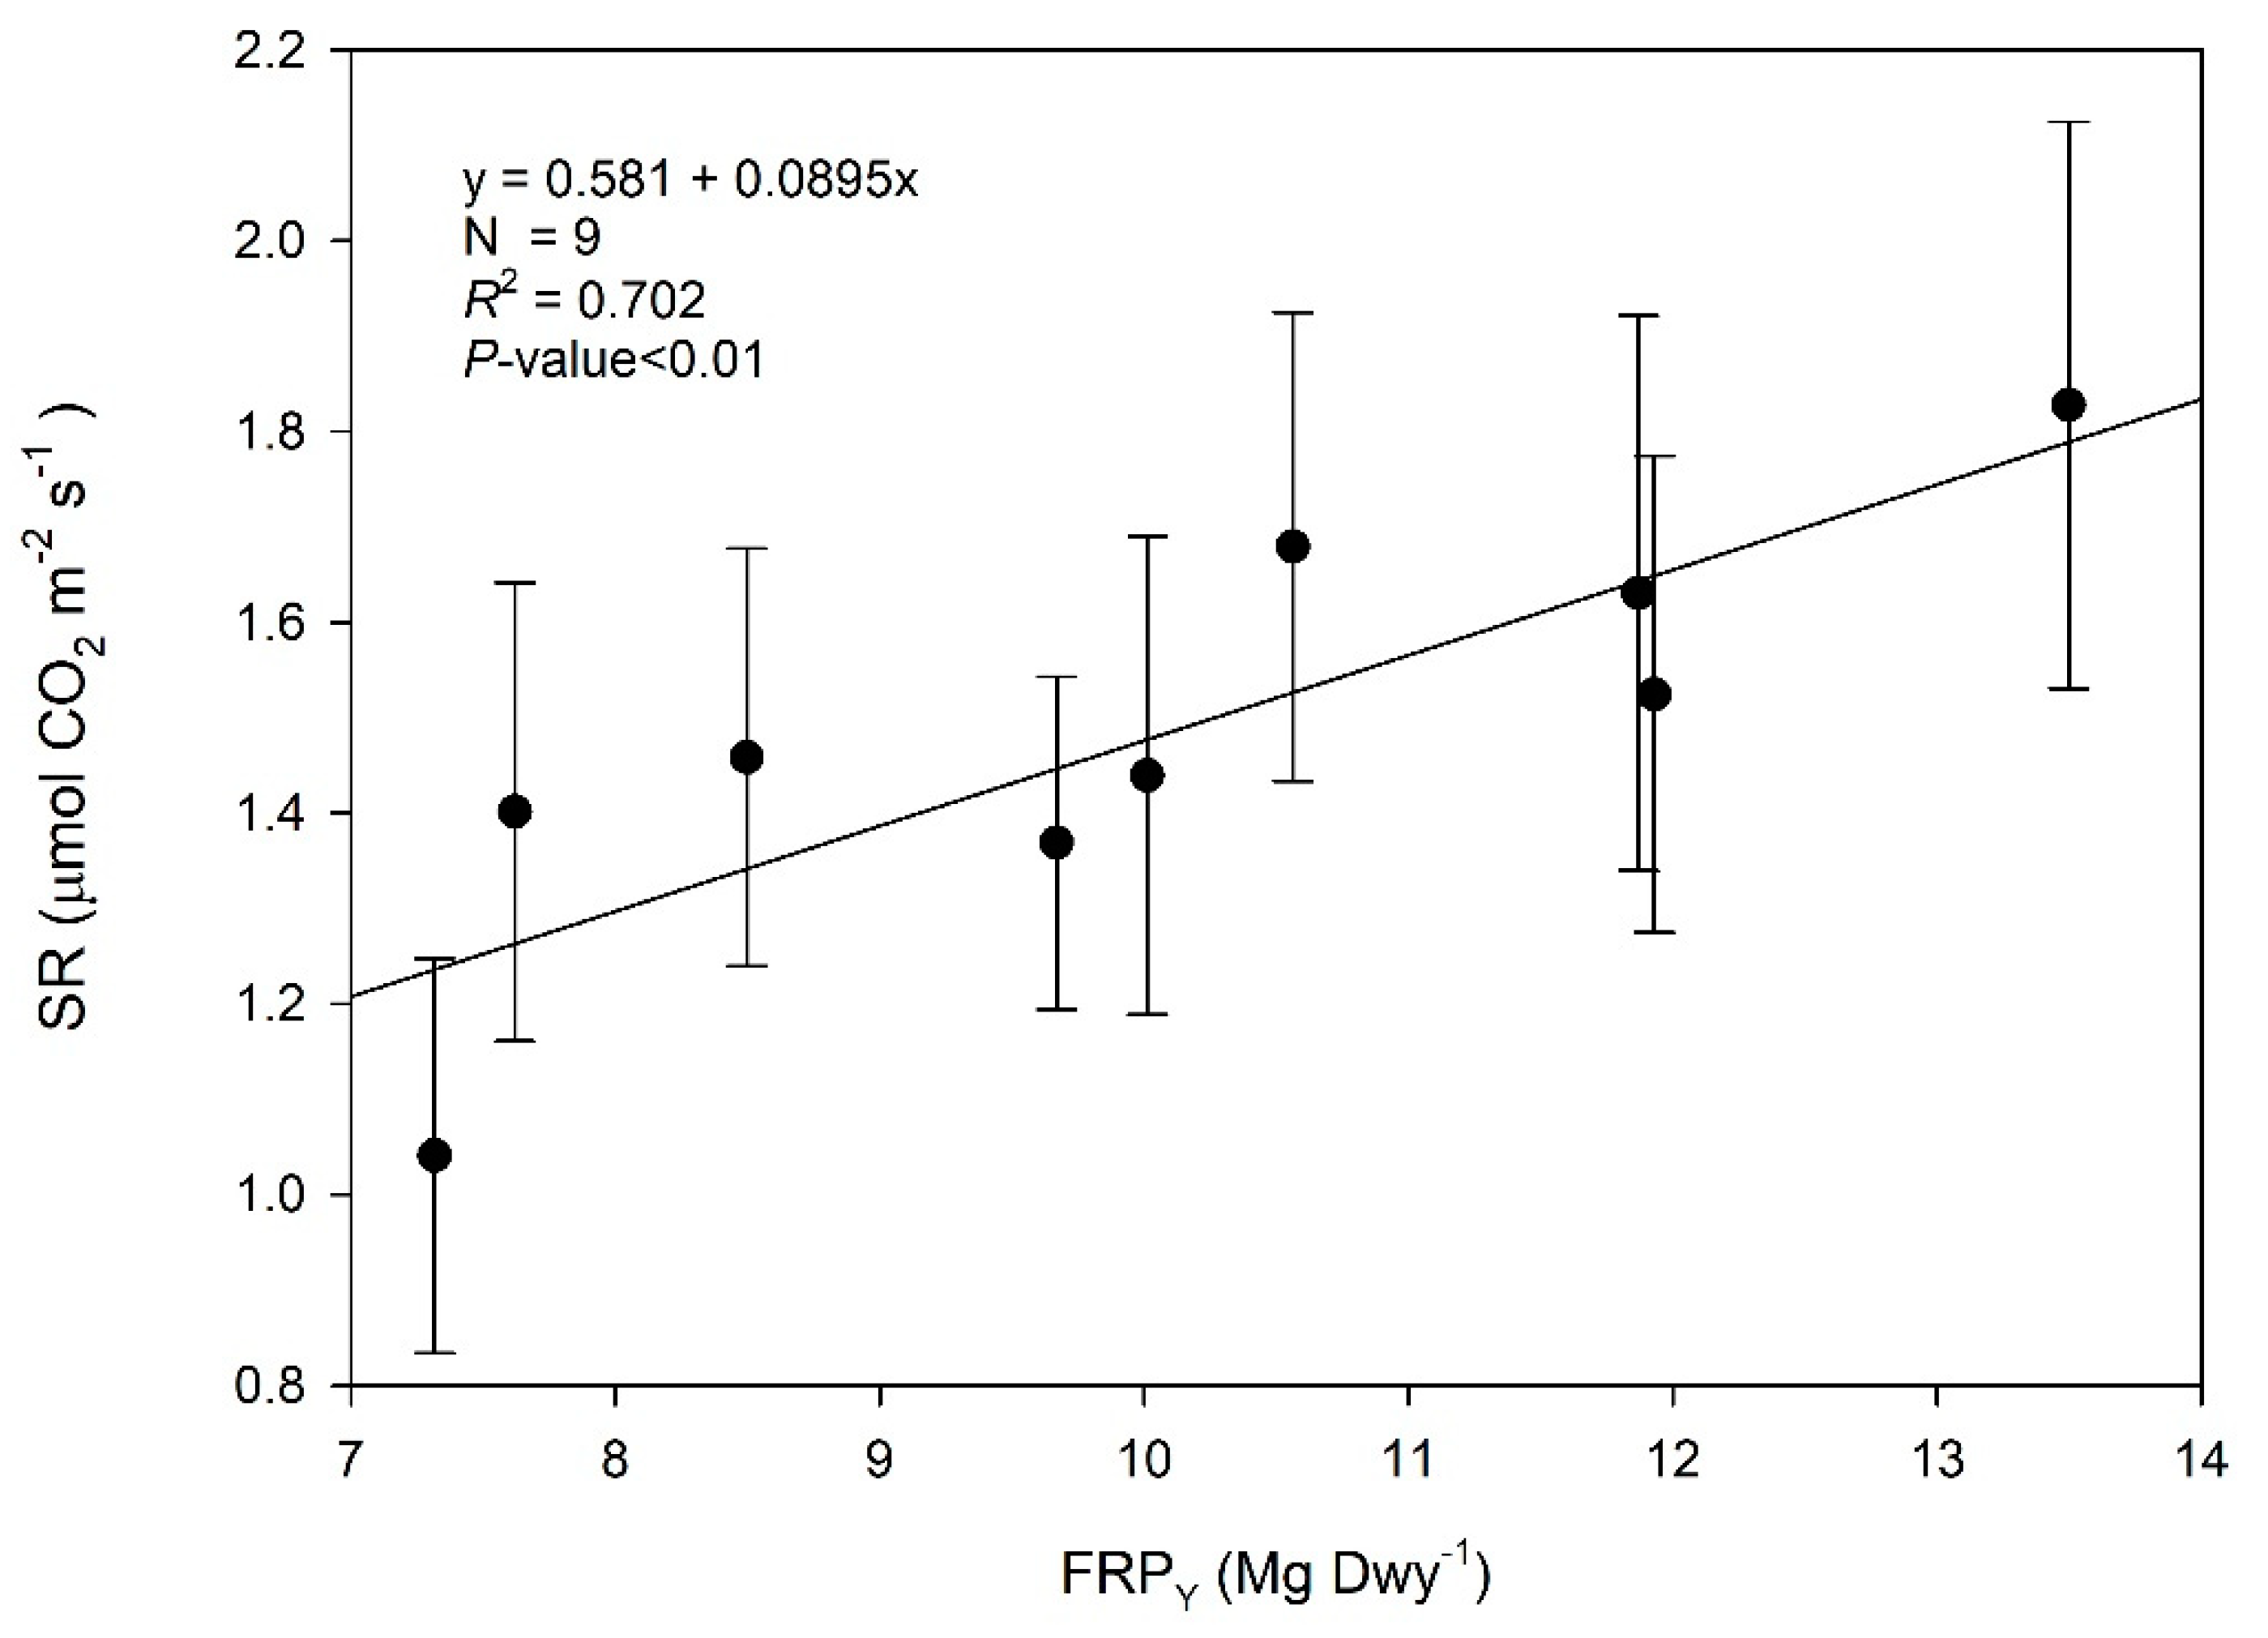
In the study site, significant relationships between SR and FRP were observed. We found a highly significant effect of FRP on SR among the different plots considering both annual mean value (FRPY, R2 = 0.702, p < 0.01, Figure 3) and the datasets including growing (FRPG) and leafless periods (FRPLP) (R2 = 0.842; p < 0.01; Figure 4). Conversely, among plots, we did not find any significant relationships between annual average SR and soil parameters reported in Table 1 (data not shown).

4. Discussion

4.1. Fine Root Production and Its Contribution to NPP

FRP values of this study were within the range of 2.9 and 9.6 Mg ha−1 yr−1 reported for several beech stands in Europe [31,34]. Indeed, in an independent experiment carried out in the same period and site using isotope-labelled soil in-growth cores, a net annual root-derived carbon input to soil was estimated at 4 Mg C ha−1 yr−1 [33].
Moreover, our study suggests that not accounting for FRPLP could lead to an underestimation of fine root contribution to C-cycle that could be relevant, confirming previous findings [35]. FRPLP could be supported by the mobilization and use of carbohydrate reserves demonstrated in several studies [36,37,38]. In our experimental site, this hypothesis is corroborated by the decrease of starch and soluble sugars during winter [39,40].
Our results indicate that FRPY is mainly dependent on LAI, which represents a proxy of ecosystem productivity and ground coverage [41,42]. This suggests that above- and belowground compartments are strongly connected at both local [43,44,45] and regional scales [46]. The positive relationships between FRPY with both LAI and SR demonstrate the crucial role of FRP in connecting the forest structure and soil C fluxes. The role played by fine roots on soil C fluxes could be dependent on the forest development stages. Indeed, a finding similar to that shown in the present study was reported for an old mature beech forest [25], while no relationship was found between SR and fine root biomass in a young beech forest [47].
A previous study carried out in 1996 in the Selva Piana stand [31] estimated an FRPY of 3.8 Mg ha−1 yr−1, less than half of the current study, although the ingrowth cores method estimated lower values of FRP [48]. Furthermore, in the cited study, FRPY contributed less to annual NPP (28% vs. 36%). These results might be only partially explained by the 37% increment of aboveground biomass and could be affected by the strong differences in precipitation regimes in the two sampling years, especially during the July–August period. FRP, as well its contribution to NPP, can vary depending on environmental factors [49,50,51], as suggested by the optimal partitioning theory where C allocation to roots can increase when plant growth is limited by water and/or nutrients [52,53]. However, our results suggested a double effect of water availability on FRP at different temporal and spatial scales. Water limitations could stimulate allocation to fine roots (i.e., 1996 vs. 2007), but at the stand scale, in case of water shortage, FRP could be positively stimulated by SWC. If so, this result confirms the observed positive relationship found between beech fine root growth and water availability driven by different precipitation regimes during drought years [51].

4.2. Spatial Variability of Soil Respiration and FRP

A large intra-site variability in SR rates was observed in several ecosystem types ranging from savanna, tropical, boreal, to temperate forests [11,18,47,54,55,56,57]. In the present study, the spatial variability of SR was not related to the soil microclimatic environment, including T soil and SWC, confirming previous findings reported for three temperate European forests [58]. Hence, our results suggest that FRP plays a major role in determining the spatial variability of SR in a Mediterranean beech forest characterized by a closed canopy.
In addition, our data show a reduction of the FRP influence on SR (logarithmic regression) that could be related to the effect of soil water shortage on SR fluxes during the dry seasonal period, as previously demonstrated for the Selva Piana site [59].

5. Conclusions

This work described the spatial interactions among the forest structure and belowground C fluxes in a Mediterranean beech forest characterized by an almost complete canopy closure.
Fine roots played a relevant role in the ecosystem C-cycle, representing the main component of NPP (36%) and explaining about 70% of the annual soil CO2 efflux variability inside the stand.
The results obtained in this study seem to indicate a functional mechanism to optimize source–sink C relationships in response to spatial variability of microclimatic drivers associated with changes of fine-scale forest structural traits. Forest structure and functionality are highly interactive; hence, an improved understanding of their relationships is fundamental to address forest adaptation and mitigation to climate change. Furthermore, as the structural features of the forest are derived from the past management, these results may inform adaptive forest management options.

Supplementary Materials

The following are available online at https://www.mdpi.com/1999-4907/11/3/255/s1, Figure S1: Relationship between the basal area, representing the sum of the area (m2) of the cross-section of stems measured at 1.30 m height, and Leaf Area Index (LAI) measured at the centre of each sampling plot, Figure S2: Relationship between annual fine root production (FRPY) and leaf area index (LAI). Each point is a sampling plot. Table S1: Forest structural parameters, soil parameters, and FRP in the 9 sampling plots (SP). Basal area (m2) is the sum of the stem cross section areas of the n trees present in each plot; Dmax (cm) is the maximum diameter measured in the sampling plot tree height; LAI (m2 m−2); T soil (°C) is the average soil temperature measured during the SR campaigns (n = 11); SWC (%) is the annual average soil water content measured during the SR campaigns except February 2008 because of the snow cover (n = 10); SMN (%) is the organic nitrogen percentage in the mineral soil layer; SMC (%) is the organic carbon percentage in the mineral soil layer; SON (%) is the organic nitrogen percentage in the organic soil layer; SOC (%) is the organic carbon percentage in the organic soil layer; Litter amount (g DW m−2); Litter N (%) and Litter C (%) are the nitrogen and carbon percentage of litter, respectively; FRPY, FRPG, and FRPLP (Mg Dw ha−1) are fine root production estimated at annual scale, during the vegetative season, and during leafless period, respectively; SRY, SRG, and SRLP are the mean of the soil CO2 effluxes measured during the whole study period, during the vegetative period, and during the leafless period, respectively.

Author Contributions

All the authors contributed to the manuscript: conceptualization, E.D., G.G., A.S., G.M., P.D.A.; methodology, E.D., G.G., A.S., G.M., P.D.A.; formal analysis, E.D., G.G.; investigation, E.D., G.G.; data curation, E.D., G.G.; writing—original draft preparation, E.D., G.G., A.S.; writing—review and editing, E.D., G.G., A.S., G.M., P.D.A.; supervision, G.M., P.D.A.; funding acquisition, G.M. All authors have read and agreed to the published version of the manuscript.

Funding

Researchers at the site in the year of this study were funded by FISR-CarboItaly; CarboEurope-IP, Contract n. GOCE-CT-2003-505572; Forest Focus Regulation 2152/2003 of the European Commission; CIRCE-IP, Contract no.036961.

Acknowledgments

The Collelongo-Selva Piana site was and is part of several international and national networks (CarboEurope, FluxNet, ICP-Forests, Conecofor) and since 2006 is one of the sites of the Italian Long Term Ecological Research network (LTER-Italy), part of the International LTER network (ILTER) and of eLTER Europe. Activity at the site is currently funded by the project “ForTer-Gestione Sostenibile e multifunzionale delle risorse forestali e territoriali” (DTA.AD002.486) and by resources available from Ministry of University and Research (FOE-2019). Contribution to the laboratory work by Ermenegildo Magnani is greatly acknowledged.

Conflicts of Interest

The authors declare no conflicts of interest.

References

  1. Bonan, G.B. Forests and Climate Change: Forcings, Feedbacks, and the Climate Benefits of Forests. Science 2008, 320, 1444–1449. [Google Scholar] [CrossRef] [PubMed] [Green Version]
  2. Bombi, P.; D’Andrea, E.; Rezaie, N.; Cammarano, M.; Matteucci, G. Which climate change path are we following? Bad news from Scots pine. PLoS ONE 2017, 12, e0189468. [Google Scholar] [CrossRef] [PubMed] [Green Version]
  3. Pan, Y.; Birdsey, R.A.; Fang, J.; Houghton, R.; Kauppi, P.E.; Kurz, W.A.; Phillips, O.L.; Shvidenko, A.; Lewis, S.L.; Canadell, J.G.; et al. A Large and Persistent Carbon Sink in the World’s Forests. Science 2011, 333, 988–993. [Google Scholar] [CrossRef] [PubMed] [Green Version]
  4. Le Quéré, C.; Raupach, M.R.; Canadell, J.G.; Marland, G.; Bopp, L.; Ciais, P.; Conway, T.J.; Doney, S.C.; Feely, R.A.; Foster, P.; et al. Trends in the sources and sinks of carbon dioxide. Nat. Geosci. 2009, 2, 831–836. [Google Scholar] [CrossRef]
  5. Collalti, A.; Prentice, I.C. Is NPP proportional to GPP? Waring’s hypothesis 20 years on. Tree Physiol. 2019, 39, 1473–1483. [Google Scholar] [CrossRef]
  6. Ciais, P.; Reichstein, M.; Viovy, N.; Granier, A.; Ogée, J.; Allard, V.; Aubinet, M.; Buchmann, N.; Bernhofer, C.; Carrara, A.; et al. Europe-wide reduction in primary productivity caused by the heat and drought in 2003. Nature 2005, 437, 529–533. [Google Scholar] [CrossRef]
  7. Santantonio, D.; Grace, J.C. Estimating fine-root production and turnover from biomass and decomposition data: A compartment–flow model. Can. J. For. Res. 1987, 17, 900–908. [Google Scholar] [CrossRef]
  8. McCormack, M.L.; Dickie, I.A.; Eissenstat, D.M.; Fahey, T.J.; Fernandez, C.W.; Guo, D.; Helmisaari, H.S.; Hobbie, E.A.; Iversen, C.M.; Jackson, R.B.; et al. Redefining fine roots improves understanding of below-ground contributions to terrestrial biosphere processes. New Phytol. 2015, 207, 505–518. [Google Scholar] [CrossRef]
  9. Hanson, P.J.; Edwards, N.T.; Garten, C.T.; Andrews, J.A. Separating root and soil microbial contributions to soil respiration: A review of methods and observations. Biogeochemistry 2000, 48, 115–146. [Google Scholar] [CrossRef]
  10. Gaudinski, J.; Trumbore, S.; Davidson, E.; Cook, A.; Markewitz, D.; Richter, D. The age of fine-root carbon in three forests of the eastern United States measured by radiocarbon. Oecologia 2001, 129, 420–429. [Google Scholar] [CrossRef] [Green Version]
  11. Tang, J.; Baldocchi, D.D. Spatial-temporal variation in soil respiration in an oak-grass savanna ecosystem in California and its partitioning into autotrophic and heterotrophic components. Biogeochemistry 2005, 73, 183–207. [Google Scholar] [CrossRef]
  12. Davidson, E.A.; Richardson, A.D.; Savage, K.E.; Hollinger, D.Y. A distinct seasonal pattern of the ratio of soil respiration to total ecosystem respiration in a spruce-dominated forest. Glob. Chang. Biol. 2006, 12, 230–239. [Google Scholar] [CrossRef]
  13. Hopkins, F.; Gonzalez-Meler, M.A.; Flower, C.E.; Lynch, D.J.; Czimczik, C.; Tang, J.; Subke, J.A. Ecosystem-level controls on root-rhizosphere respiration. New Phytol. 2013, 199, 339–351. [Google Scholar] [CrossRef] [PubMed] [Green Version]
  14. Mccormack, M.L.; Gaines, K.P.; Pastore, M.; Eissenstat, D.M. Early season root production in relation to leaf production among six diverse temperate tree species. Plant Soil 2015, 121–129. [Google Scholar] [CrossRef] [Green Version]
  15. Hertel, D.; Strecker, T.; Muller-Haubold, H.; Leuschner, C. Fine root biomass and dynamics in beech forests across a precipitation gradient—Is optimal resource partitioning theory applicable to water-limited mature trees? J. Ecol. 2013, 101, 1183–1200. [Google Scholar] [CrossRef]
  16. Maeght, J.-L.; Gonkhamdee, S.; Clément, C.; Isarangkool Na Ayutthaya, S.; Stokes, A.; Pierret, A. Seasonal Patterns of Fine Root Production and Turnover in a Mature Rubber Tree (Hevea brasiliensis Müll. Arg.) Stand- Differentiation with Soil Depth and Implications for Soil Carbon Stocks. Front. Plant Sci. 2015, 6, 1–11. [Google Scholar] [CrossRef] [Green Version]
  17. Saiz, G.; Green, C.; Butterbach-Bahl, K.; Kiese, R.; Avitabile, V.; Farrell, E.P. Seasonal and spatial variability of soil respiration in four Sitka spruce stands. Plant Soil 2006, 287, 161–176. [Google Scholar] [CrossRef]
  18. Shibistova, O.; Lloyd, J.; Evgrafova, S.; Savushkina, N.; Zrazhevskaya, G.; Arneth, A.; Knohl, A.; Kolle, O.; Schulze, E.D. Seasonal and spatial variability in soil CO2 efflux rates for a central Siberian Pinus sylvestris forest. Tellus 2002, 54, 552–567. [Google Scholar] [CrossRef]
  19. Sevanto, S.; Dickman, L.T. Where does the carbon go?-Plant carbon allocation under climate change. Tree Physiol. 2015, 35, 581–584. [Google Scholar] [CrossRef] [Green Version]
  20. Shugart, H.H.; Saatchi, S.; Hall, F.G. Importance of structure and its measurement in quantifying function of forest ecosystems. J. Geophys. Res. Biogeosciences 2010, 115, 1–16. [Google Scholar] [CrossRef]
  21. D’Andrea, E.; Micali, M.; Sicuriello, F.; Cammarano, M.; Ferlan, M.; Skudnik, M.; Mali, B.; Čater, M.; Simončič, P.; De Cinti, B.; et al. Improving carbon sequestration and stocking as a function of forestry. Ital. J. Agron. 2016, 11, 56–60. [Google Scholar]
  22. Collalti, A.; Trotta, C.; Keenan, T.F.; Ibrom, A.; Bond-lamberty, B.; Grote, R.; Vicca, S.; Reyer, C.P.O. Thinning Can Reduce Losses in Carbon Use Efficiency and Carbon Stocks in Managed Forests Under Warmer Climate. J. Adv. Model. Earth Syst. 2018, 2427–2452. [Google Scholar] [CrossRef] [PubMed] [Green Version]
  23. Bombi, P.; Gnetti, V.; D’Andrea, E.; De Cinti, B.; Vigna Taglianti, A.; Bologna, M.A.; Matteucci, G. Identifying priority sites for insect conservation in forest ecosystems at high resolution: The potential of LiDAR data. J. Insect Conserv. 2019, 23, 689–698. [Google Scholar] [CrossRef]
  24. Rezaie, N.; D’Andrea, E.; Bräuning, A.; Matteucci, G.; Bombi, P.; Lauteri, M. Do atmospheric CO2 concentration increase, climate and forest management affect iWUE of common beech? Evidences from carbon isotope analyses in tree rings. Tree Physiol. 2018, 1975, 1110–1126. [Google Scholar] [CrossRef] [Green Version]
  25. Søe, A.R.B.; Buchmann, N. Spatial and temporal variations in soil respiration in relation to stand structure and soil parameters in an unmanaged beech forest. Tree Physiol. 2005, 25, 1427–1436. [Google Scholar] [CrossRef]
  26. Collalti, A.; Tjoelker, M.G.; Hoch, G.; Mäkelä, A.; Guidolotti, G.; Heskel, M.; Petit, G.; Ryan, M.G.; Battipaglia, G.; Matteucci, G.; et al. Plant respiration: Controlled by photosynthesis or biomass? Glob. Chang. Biol. 2019. [Google Scholar] [CrossRef]
  27. Collalti, A.; Marconi, S.; Ibrom, A.; Trotta, C.; Anav, A.; D’Andrea, E.; Matteucci, G.; Montagnani, L.; Gielen, B.; Mammarella, I.; et al. Validation of 3D-CMCC Forest Ecosystem Model (v. 5. 1) against eddy covariance data for 10 European forest sites. Geosci. Model Dev. 2016, 9, 479–504. [Google Scholar] [CrossRef] [Green Version]
  28. Chiti, T.; Papale, D.; Smith, P.; Dalmonech, D.; Matteucci, G.; Yeluripati, J.; Rodeghiero, M.; Valentini, R. Predicting changes in soil organic carbon in mediterranean and alpine forests during the Kyoto Protocol commitment periods using the CENTURY model. Soil Use Manag. 2010, 26, 475–484. [Google Scholar] [CrossRef]
  29. Mainiero, R.; Kazda, M. Depth-related fine root dynamics of Fagus sylvatica during exceptional drought. For. Ecol. Manag. 2006, 237, 135–142. [Google Scholar] [CrossRef]
  30. Ostonen, I.; Lohmus, K.; Pajuste, K. Fine root biomass, production and its proportion of NPP in a fertile middle-aged Norway spruce forest: Comparison of soil core and ingrowth core methods. For. Ecol. Manag. 2005, 212, 264–277. [Google Scholar] [CrossRef]
  31. Scarascia-Mugnozza, G.; Bauer, G.A.; Persson, H.; Matteucci, G.; Masci, A. Tree Biomass, Growth and Nutrient Pools. In Carbon and Nitrogen Cycling in European Forest Ecosystems; Schulze, E.-D., Ed.; Springer: Berlin, Germany, 2000; pp. 49–62. [Google Scholar]
  32. Huang, R.; Zhu, H.; Liu, X.; Liang, E.; Grießinger, J.; Wu, G.; Li, X.; Bräuning, A. Does increasing intrinsic water use efficiency (iWUE) stimulate tree growth at natural alpine timberline on the southeastern Tibetan Plateau? Glob. Planet. Chang. 2017, 148, 217–226. [Google Scholar] [CrossRef]
  33. Alberti, G.; Vicca, S.; Inglima, I.; Belelli-Marchesini, L.; Genesio, L.; Miglietta, F.; Marjanovic, H.; Martinez, C.; Matteucci, G.; D’Andrea, E.; et al. Soil C:N stoichiometry controls carbon sink partitioning between above-ground tree biomass and soil organic matter in high fertility forests. iForest-Biogeosciences For. 2014, 8. [Google Scholar] [CrossRef] [Green Version]
  34. Hendriks, C.; Bianchi, F. Root density and root biomass in pure and mixed forest stands of Douglas-fir and Beech. Neth. J. Agric. Sci. 1995, 43, 321–331. [Google Scholar]
  35. Mao, Z.; Jourdan, C.; Bonis, M.; Pailler, F.; Rey, H.; Saint-andré, L.; Stokes, A. Modelling root demography in heterogeneous mountain forests and applications for slope stability analysis. Plant Soil 2013, 357–382. [Google Scholar] [CrossRef]
  36. Guo, D.L.; Mitchell, R.J.; Hendricks, J.J. Fine root branch orders respond differentially to carbon source-sink manipulations in a longleaf pine forest. Oecologia 2004, 140, 450–457. [Google Scholar] [CrossRef]
  37. Schuur, E.A.G.; Trumbore, S.E. Partitioning sources of soil respiration in boreal black spruce forest using radiocarbon. Glob. Chang. Biol. 2006, 12, 165–176. [Google Scholar] [CrossRef] [Green Version]
  38. Vargas, R.; Trumbore, S.E.; Allen, M.F. Evidence of old carbon used to grow new fine roots in a tropical forest. New Phytol. 2009, 182, 710–718. [Google Scholar] [CrossRef]
  39. Scartazza, A.; Moscatello, S.; Matteucci, G.; Battistelli, A.; Brugnoli, E. Seasonal and inter-annual dynamics of growth, non-structural carbohydrates and C stable isotopes in a Mediterranean beech forest. Tree Physiol. 2013, 33, 730–742. [Google Scholar] [CrossRef] [Green Version]
  40. D’Andrea, E.; Rezaie, N.; Battistelli, A.; Kuhlmann, I.; Matteucci, G.; Moscatello, S.; Proietti, S.; Scartazza, A.; Trumbore, S.; Muhr, J. Winter’s bite: Beech trees survive complete defoliation due to spring late-frost damage by mobilizing old C reserves. New Phytol. 2019, 224, 625–631. [Google Scholar] [CrossRef]
  41. Reich, P.B. Key canopy traits drive forest productivity. Proc Biol. Sci. 2012, 279, 2128–2134. [Google Scholar] [CrossRef] [Green Version]
  42. Clark, D.B.; Paulo, C.; Oberbauer, S.F.; Ryan, G. First direct landscape-scale measurement of tropical rain forest Leaf Area Index, a key driver of global primary productivity. Ecol Lett. 2008, 11, 163–172. [Google Scholar] [CrossRef] [PubMed]
  43. Chen, W.; Zhang, Q.; Cihlar, J.; Bauhus, J.; Price, D.T. Estimating fine-root biomass and production of boreal and cool temperate forests using aboveground measurements: A new approach. Plant Soil 2004, 265, 31–46. [Google Scholar] [CrossRef]
  44. Finér, L.; Ohashi, M.; Noguchi, K.; Hirano, Y. Factors causing variation in fine root biomass in forest ecosystems. For. Ecol. Manag. 2011, 261, 265–277. [Google Scholar] [CrossRef]
  45. Helmisaari, H.; Derome, J.; Nöjd, P.; Kukkola, M. Fine root biomass in relation to site and stand characteristics in Norway spruce and Scots pine stands. Tree Physiol. 2007, 27, 1493–1504. [Google Scholar] [CrossRef] [PubMed] [Green Version]
  46. Reichstein, M.; Rey, A.; Freibauer, A.; Tenhunen, J.; Valentini, R.; Banza, J.; Casals, P.; Cheng, Y.; Gru, J.M.; Irvine, J.; et al. Modeling temporal and large-scale spatial variability of soil respiration from soil water availability, temperature and vegetation productivity indices. Glob. Biogeochem. Cycles 2003, 17, 320. [Google Scholar] [CrossRef]
  47. Ngao, J.; Epron, D.; Delpierre, N.; Bréda, N.; Granier, A.; Longdoz, B. Spatial variability of soil CO2 efflux linked to soil parameters and ecosystem characteristics in a temperate beech forest. Agric. For. Meteorol. 2012, 154–155, 136–146. [Google Scholar] [CrossRef]
  48. Addo-Danso, S.D.; Prescott, C.E.; Smith, A.R. Methods for estimating root biomass and production in forest and woodland ecosystem carbon studies: A review. For. Ecol. Manag. 2016, 359, 332–351. [Google Scholar] [CrossRef]
  49. Gill, R.A.; Jackson, R.B. Global patterns of root turnover for terrestrial ecosystems. New Phytol. 2000, 147, 13–31. [Google Scholar] [CrossRef]
  50. Norby, R.J.; Jackson, R.B. Root dynamics and global change: Seeking an ecosystem perspective. New Phytol. 2000, 147, 3–12. [Google Scholar] [CrossRef] [Green Version]
  51. Meier, I.C.; Leuschner, C. Belowground drought response of European beech: Fine root biomass and carbon partitioning in 14 mature stands across a precipitation gradient. Glob. Chang. Biol. 2008, 14, 2081–2095. [Google Scholar] [CrossRef]
  52. Bloom, A.J.; Chapin, F.S.; Mooney, H.A. Resource Limitation in Plants-An Economic Analogy. Annu. Rev. Ecol. Syst. 1985, 16, 363–392. [Google Scholar] [CrossRef]
  53. Merganičová, K.; Merganič, J.; Lehtonen, A.; Vacchiano, G.; Sever, M.Z.O.; Augustynczik, A.L.D.; Grote, R.; Kyselová, I.; Mäkelä, A.; Yousefpour, R.; et al. Forest carbon allocation modelling under climate change. Tree Physiol. 2019, 39, 1937–1960. [Google Scholar] [CrossRef] [PubMed]
  54. Katayama, A.; Kume, T.; Komatsu, H.; Ohashi, M.; Nakagawa, M. Effect of forest structure on the spatial variation in soil respiration in a Bornean tropical rainforest. Agric. For. Meteorol. 2009, 149, 1666–1673. [Google Scholar] [CrossRef]
  55. Kosugi, Y.; Mitani, T.; Itoh, M.; Noguchi, S.; Tani, M.; Matsuo, N.; Takanashi, S.; Ohkubo, S.; Rahim Nik, A. Spatial and temporal variation in soil respiration in a Southeast Asian tropical rainforest. Agric. For. Meteorol. 2007, 147, 35–47. [Google Scholar] [CrossRef]
  56. Rodeghiero, M.; Cescatti, A. Spatial variability and optimal sampling strategy of soil respiration. For. Ecol. Manage. 2008, 255, 106–112. [Google Scholar] [CrossRef]
  57. Sotta, E.D.; Meir, P.; Malhi, Y.; Nobre, A.D.; Hodnett, M.; Grace, J. Soil CO2 efflux in a tropical forest in the Central Amazon. Glob. Chang. Biol. 2004, 10, 601–617. [Google Scholar] [CrossRef]
  58. Matteucci, G.; Dore, S.; Stivanello, S.; Rebmann, C.; Buchmann, N. Soil Respiration in Beech and Spruce Forests in Europe: Trends, Controlling Factors, Annual Budgets and Implications for the Ecosystem Carbon Balance. Ecol. Stud. 2000, 142, 217–236. [Google Scholar]
  59. Guidolotti, G.; Rey, A.; D’Andrea, E.; Matteucci, G.; De Angelis, P. Effect of environmental variables and stand structure on ecosystem respiration components in a Mediterranean beech forest. Tree Physiol. 2013, 33, 960–972. [Google Scholar] [CrossRef] [Green Version]
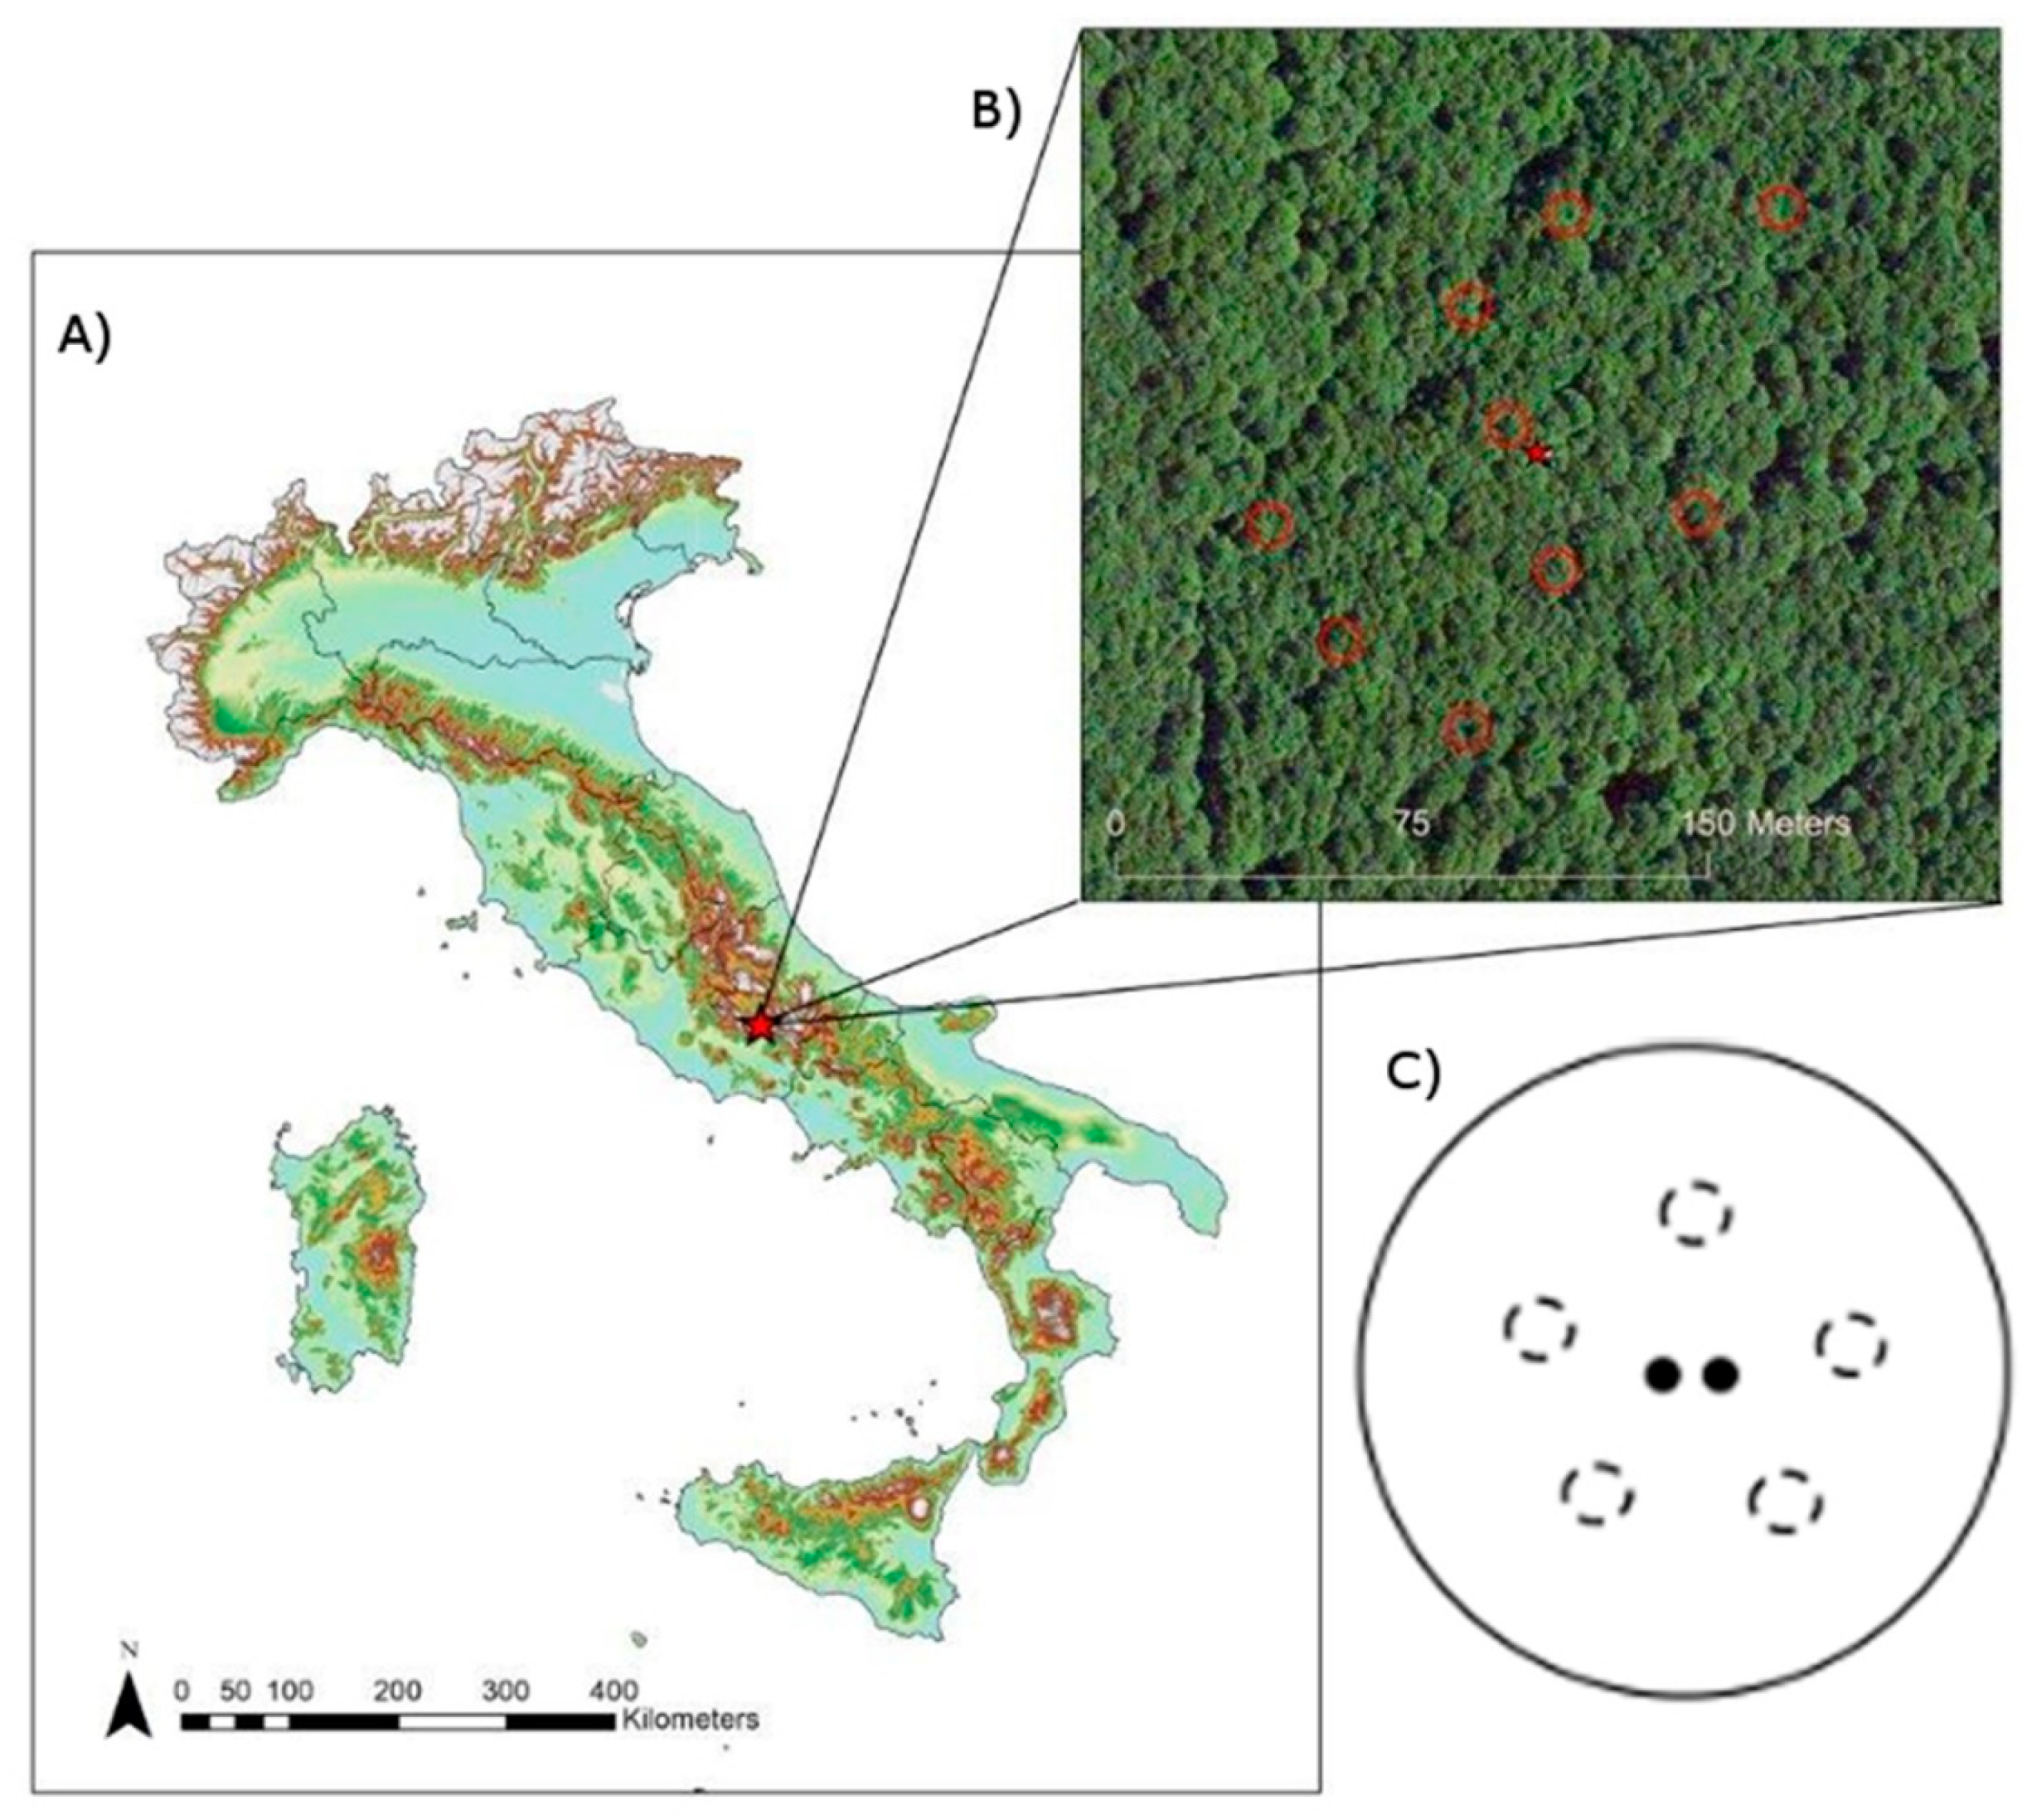
Figure 1. (A) Location of the Selva Piana experimental site. (B) Spatial distribution of the nine experimental plots (red circle) within the experimental site (the star identifies the location of the flux tower). (C) Schematic representation (not to scale) of the 5 m radius experimental plot (solid line), including the 5 soil CO2 efflux (SR) collars (dashed circle) and the 2 ingrowth cores (black filled circle).
Forests 11 00255 g001
Figure 2. Climatic diagram of the Selva Piana stand. White bars represent the monthly sums of precipitation in 2007; grey bars represent mean monthly precipitation for 1996–2006; black and dotted lines represent the mean monthly temperatures in 2007 and for the period 1996–2006, respectively.
Forests 11 00255 g002
Figure 3. Relationship between annual fine root production (FRPY) and mean soil CO2 efflux (SR). Each point is a different sampling plot, and error bars represent standard deviation.
Forests 11 00255 g003
Figure 4. Relationship between fine root production (FRP) and mean soil CO2 efflux (SR) in different periods of the study: from May 2007 to October 2007 (FRPG, dashed line and empty circles); from November 2007 to April 2008 (FRPLP, continuous line and black circles); dotted line shows overall relationship. Each point is a different sampling plot, and error bars represent standard deviation.
Forests 11 00255 g004
Table 1. Descriptive statistics of forest structural and soil parameters used to assess the relation with the FRP in the 9 sampling plots. Maximum (Max), minimum (Min), mean (Mean), and coefficient of variation (CV) values are reported for each parameter. N tree plot-1 is the number of tree inside each sampling plot; basal area (m2) is the sum of the stem cross-section areas of the n trees present in each plot; Dmax (cm) is the maximum diameter measured in the sampling plot tree height; LAI (m2 m−2); T soil (°C) is the average soil temperature measured during the SR campaigns (n = 11); SWC (%) is the annual average soil water content measured during the SR campaigns, except February 2008 because of the snow cover (n = 10); SMN (%) is the organic nitrogen percentage in the mineral soil layer; SMC (%) is the organic carbon percentage in the mineral soil layer; SON (%) is the organic nitrogen percentage in the organic soil layer; SOC (%) is the organic carbon percentage in the organic soil layer; litter amount (g DW m−2); litter N (%) and litter C (%) are the nitrogen and carbon percentages of the litter, respectively.
MaxMinMeanCV
Forest Structure Parameter
N tree plot−1245140.42
Basal area (m2)0.370.210.300.20
Dmax (cm)46.9020.9031.990.25
LAI (m2 m−2)7.135.336.100.10
Soil Parameters
T soil (°C)9.398.598.920.03
SWC (%)34.5614.7323.610.23
SMN (%)1.320.440.820.35
SMC (%)17.167.3510.580.33
SOC (%)28.0416.1421.180.18
SON (%)1.911.141.460.17
Litter Amount (g m−2)265.48191.22232.140.10
Litter N (%)2.021.751.860.05
Litter C (%)41.4936.1438.920.04