Combining Deforestation and Species Distribution Models to Improve Measures of Chimpanzee Conservation Impacts of REDD: A Case Study from Ntakata Mountains, Western Tanzania

 ,
, 
Abstract
:1. Introduction
2. Materials and Methods
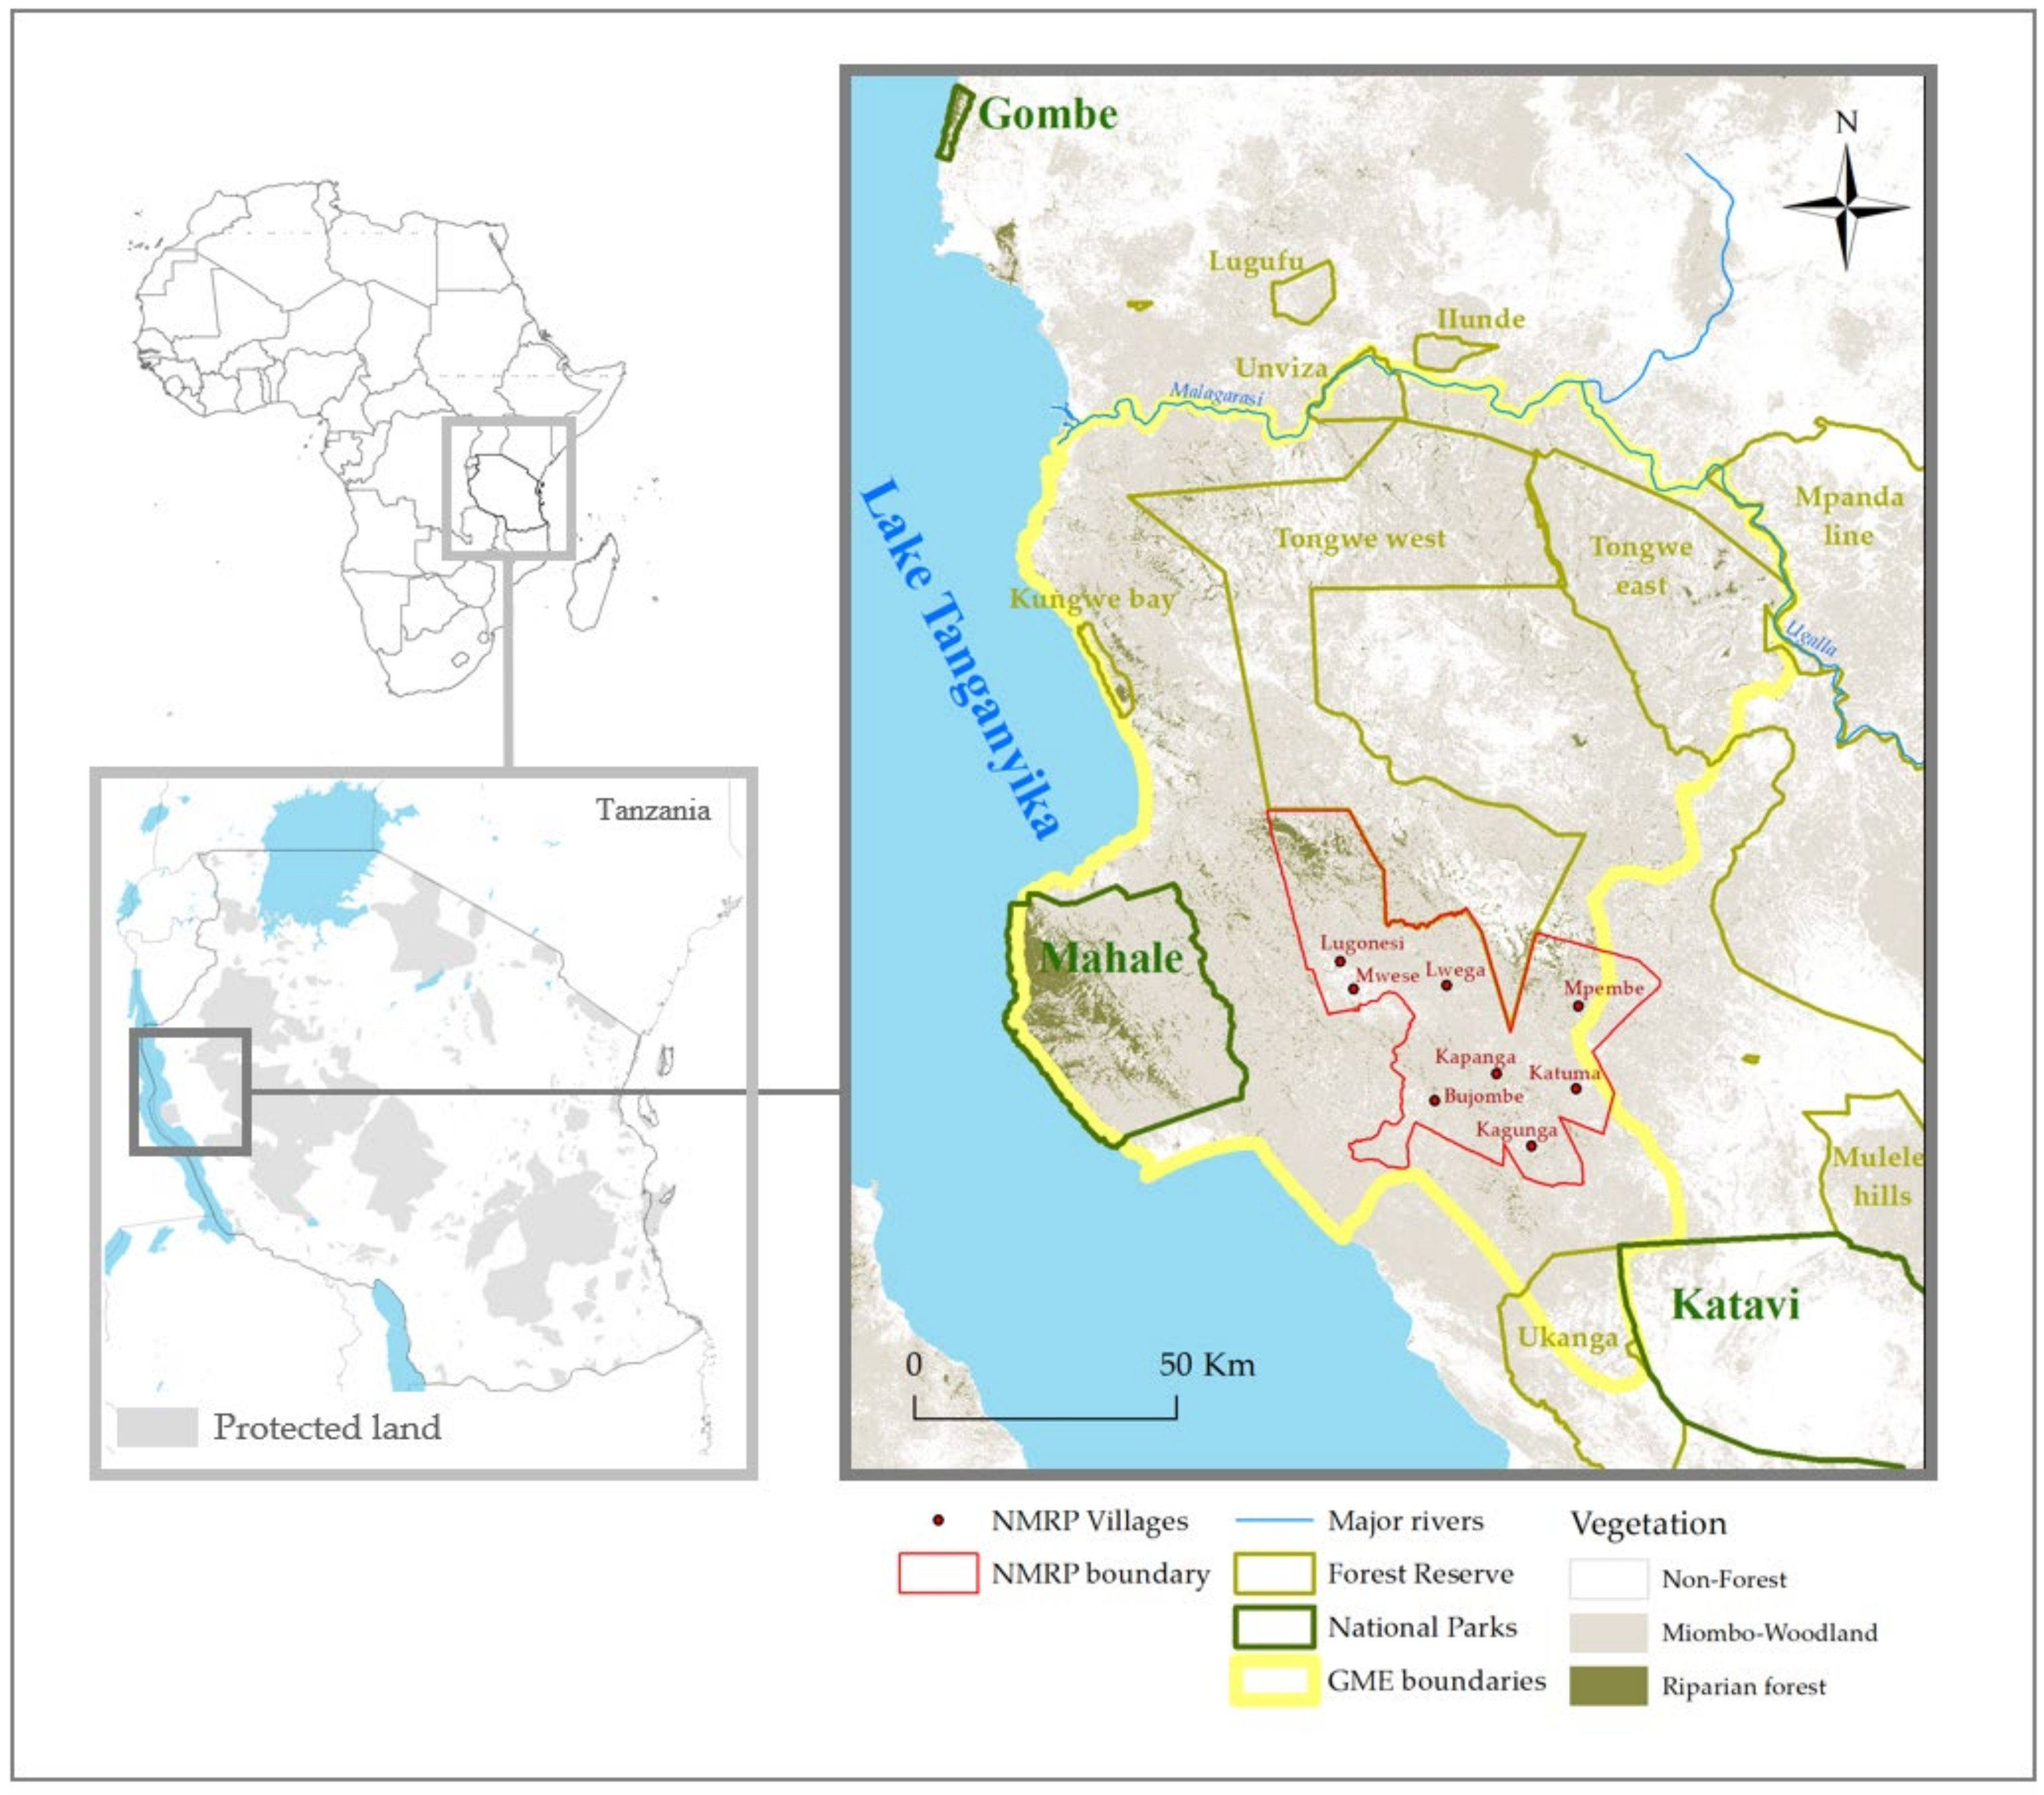
2.1. Study Area
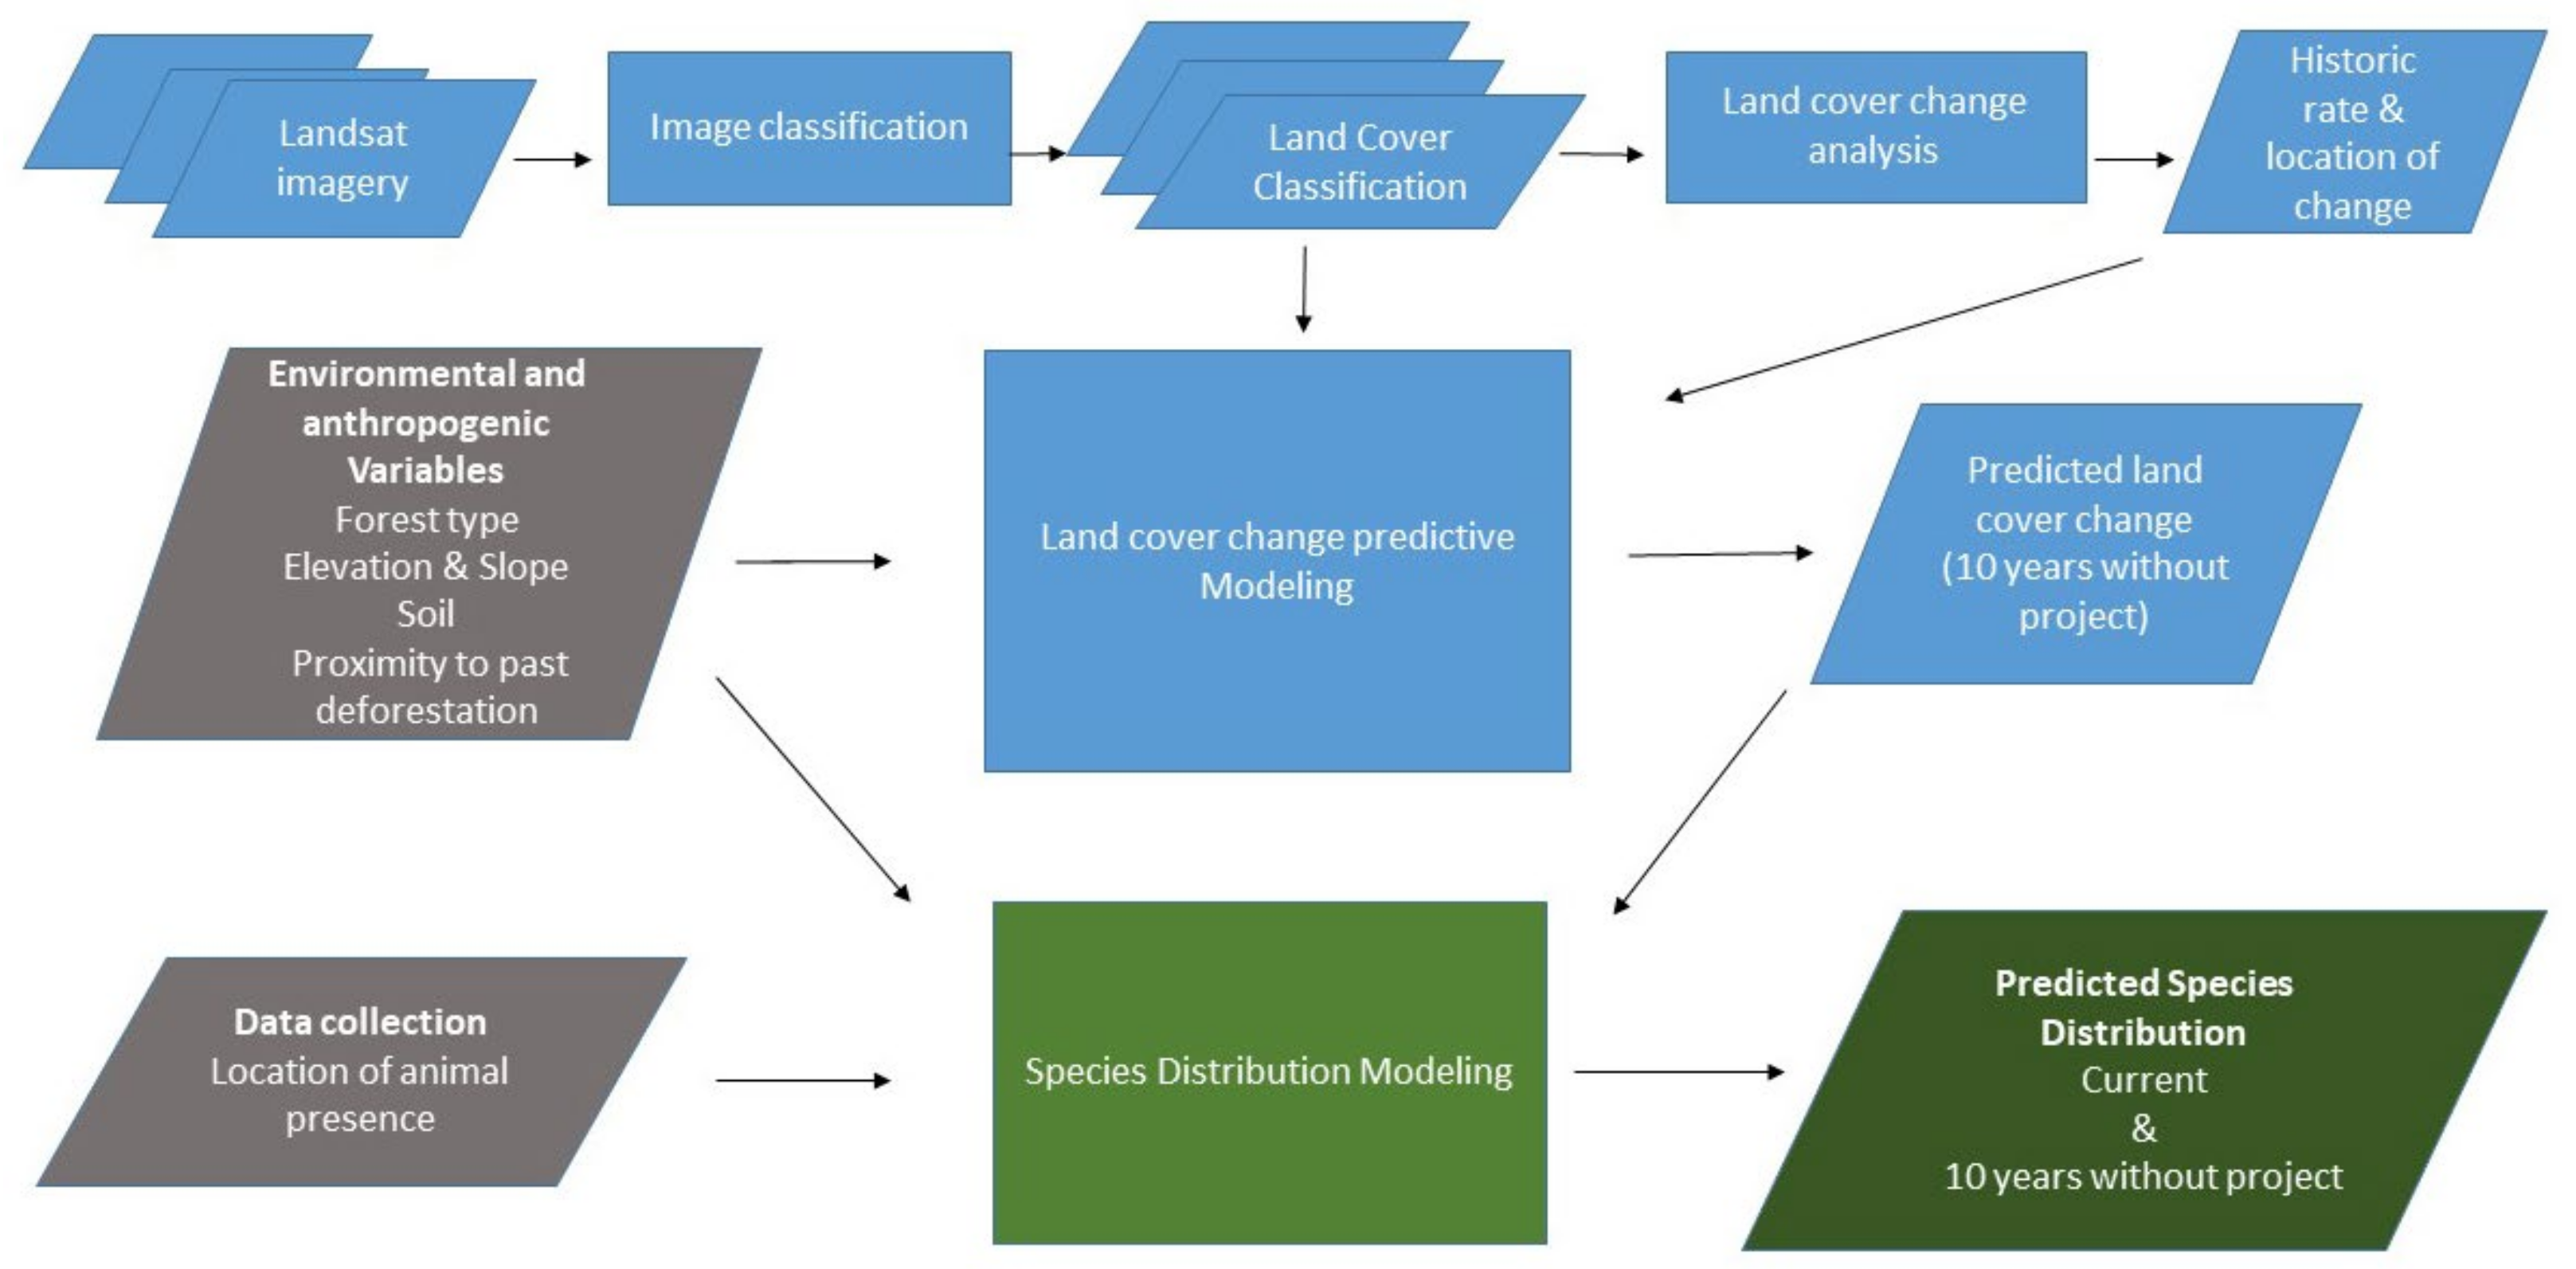
2.2. Land Cover Change and Predictions
3. Species Distribution Modelling Framework
3.1. Occurrence Data
3.2. Predictor Variables
3.3. SDMs Approach
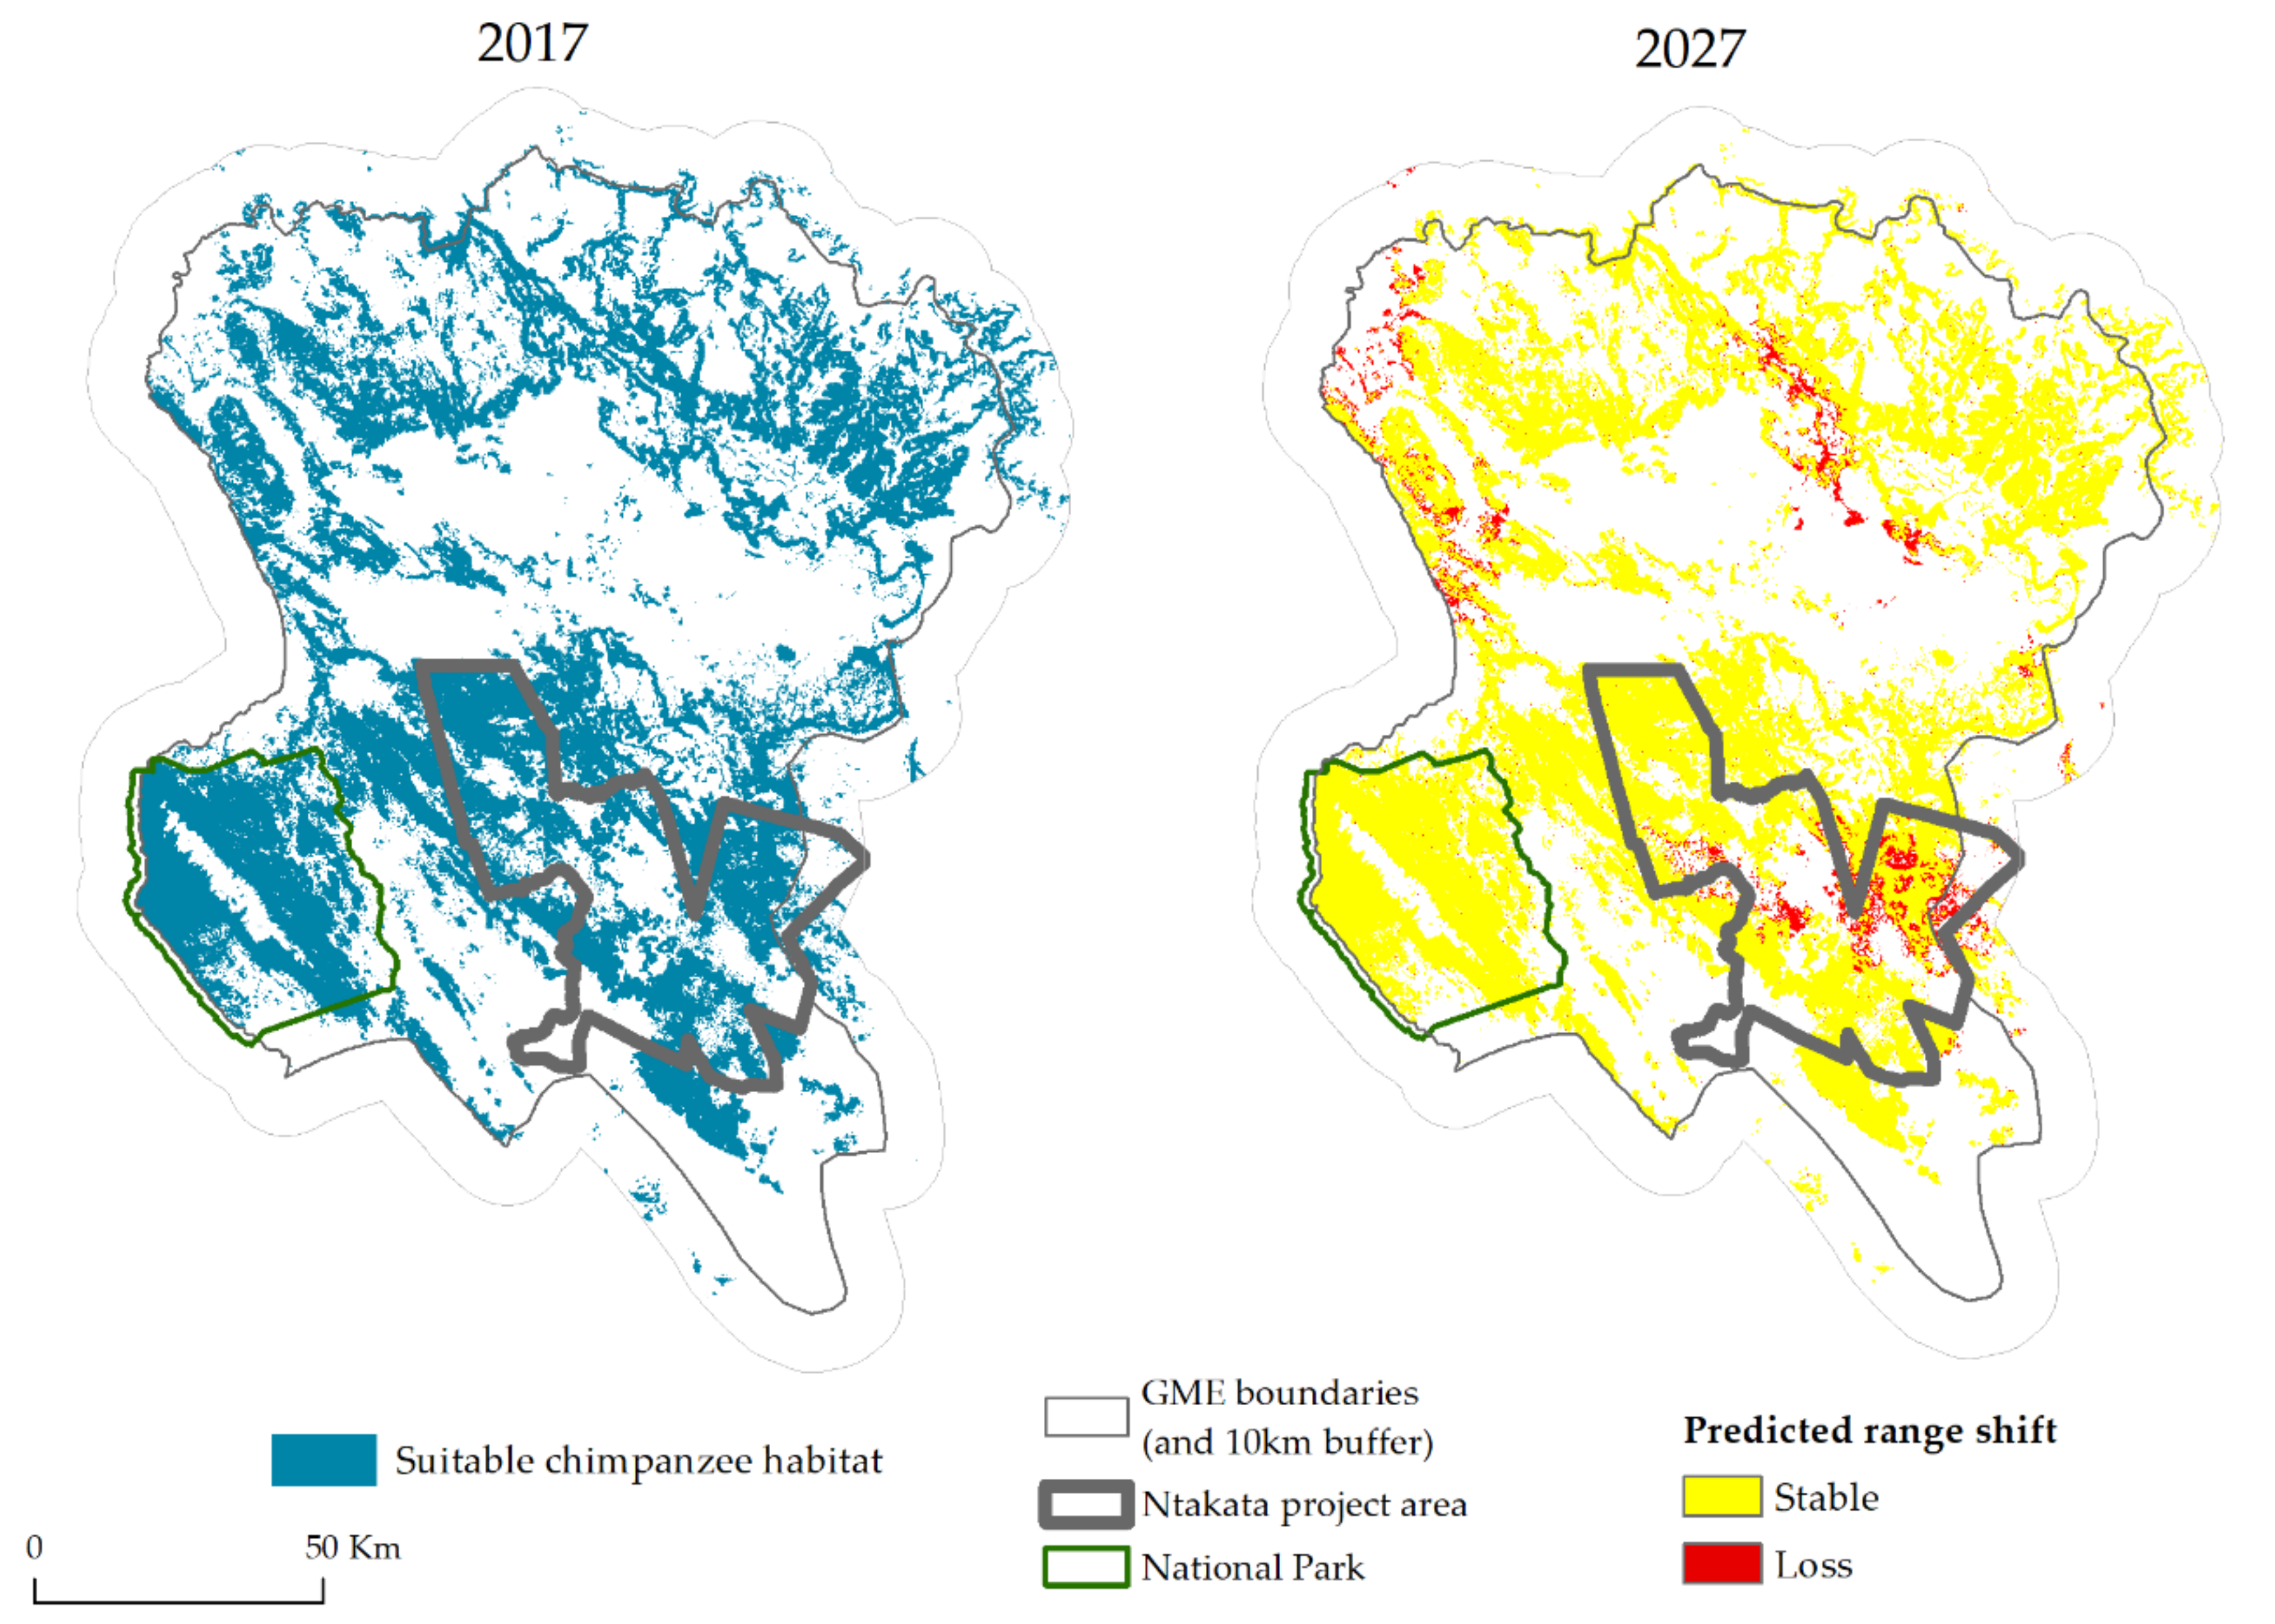
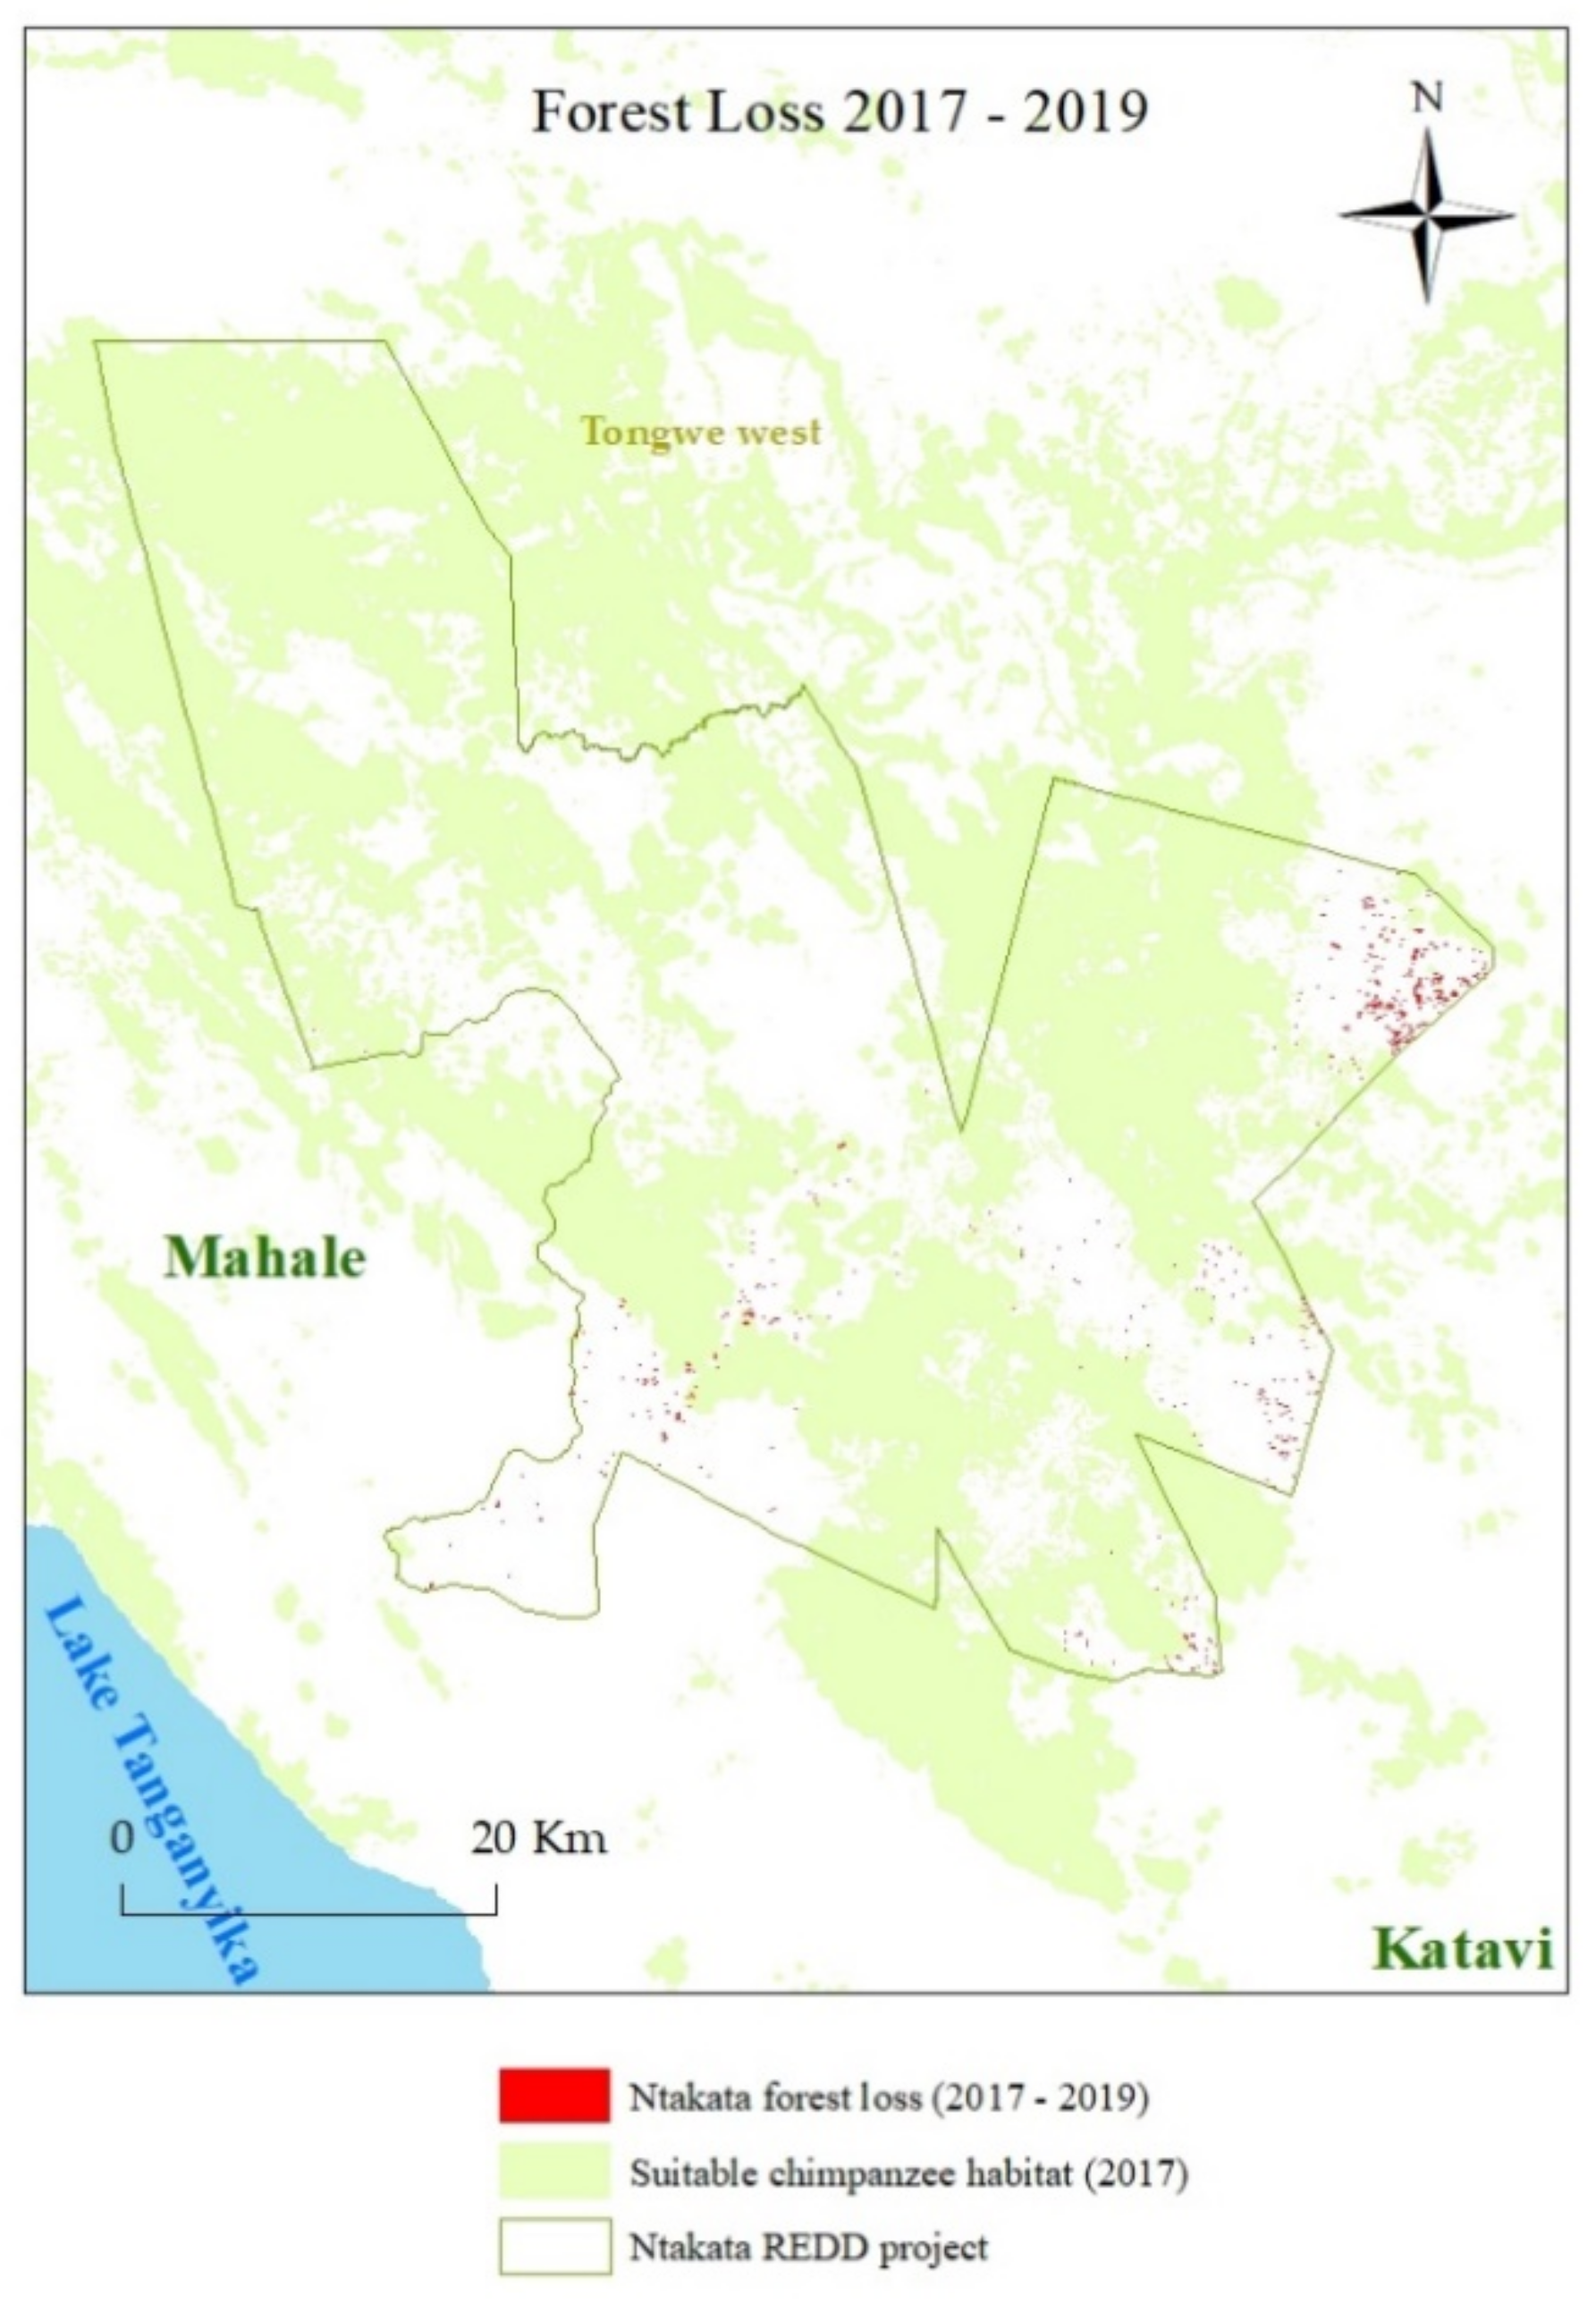
4. Results
5. Discussion
6. Conclusions
Supplementary Materials
Author Contributions
Funding
Acknowledgments
Conflicts of Interest
References
- Verra Project Registry. Available online: https://registry.verra.org/ (accessed on 28 October 2020).
- UNEP-WCMC; IUCN. Protected Planet Report; UNEP-WCMC: Cambridge, UK, 2018. [Google Scholar]
- Berkes, F. Community-Based Conservation in a Globalized World. Proc. Natl. Acad. Sci. USA 2007, 104, 15188–15193. [Google Scholar] [CrossRef] [PubMed] [Green Version]
- Lele, S.; Wilshusen, P.; Brockington, D.; Seidler, R.; Bawa, K. Beyond Exclusion: Alternative Approaches to Biodiversity Conservation in the Developing Tropics. Curr. Opin. Environ. Sustain. 2010, 2, 94–100. [Google Scholar] [CrossRef]
- Rudnick, D.; Beier, P.; Cushman, S.; Dieffenbach, F.; Epps, C.W.; Gerber, L.; Hartter, J.; Jenness, J.; Kintsch, J.; Merenlender, A.M.; et al. The Role of Landscape Connectivity in Planning and Implementing Conservation and Restoration Priorities; Ecological Society of America: Washington, DC, USA, 2012.
- Taylor, P.D.; Fahrig, L.; Henein, K.; Merriam, G. Connectivity Is a Vital Element of Landscape Structure. Oikos 1993, 68, 571. [Google Scholar] [CrossRef] [Green Version]
- Jones, T.; Caro, T.; Davenport, T.R.B. Wildlife Corridors in Tanzania; Wildlife Research Institute: Arusha, Tanzania, 2009. [Google Scholar]
- Crooks, K.R.; Sanjayan, M. (Eds.) Connectivity Conservation; Cambridge University Press: Cambridge, UK, 2006. [Google Scholar] [CrossRef]
- Dondina, O.; Orioli, V.; Colli, L.; Luppi, M.; Bani, L. Ecological network design from occurrence data by simulating species perception of the landscape. Landsc. Ecol. 2017, 33, 275–287. [Google Scholar] [CrossRef]
- Hejnowicz, A.P.; Raffaelli, D.G.; Rudd, M.A.; White, P.C. Evaluating the outcomes of payments for ecosystem services programmes using a capital asset framework. Ecosyst. Serv. 2014, 9, 83–97. [Google Scholar] [CrossRef] [Green Version]
- Measham, T.G.; Lumbasi, J.A. Success Factors for Community-Based Natural Resource Management (CBNRM): Lessons from Kenya and Australia. Environ. Manag. 2013, 52, 649–659. [Google Scholar] [CrossRef]
- Hirzel, A.H.; Le Lay, G.; Helfer, V.; Randin, C.; Guisan, A. Evaluating the ability of habitat suitability models to predict species presences. Ecol. Model. 2006, 199, 142–152. [Google Scholar] [CrossRef]
- Rondinini, C.; Di Marco, M.; Chiozza, F.; Santulli, G.; Baisero, D.; Visconti, P.; Hoffmann, M.; Schipper, J.; Stuart, S.N.; Tognelli, M.F.; et al. Global habitat suitability models of terrestrial mammals. Philos. Trans. R. Soc. B Biol. Sci. 2011, 366, 2633–2641. [Google Scholar] [CrossRef]
- IPBES; Ninan, S.F.K.N.; Leadley, P.; Alkemade, R.; Acosta, L.A.; Akcakaya, H.R.; Brotons, L. The Methodological Assessment Report on Scenarios and Models of Biodiversity and Ecosystem Services; Secretariat of the Intergovernmental Science-Policy Platform on Biodiversity, Ed.; IPBES, Secretariat of the Intergovernmental Science-Policy Platform on Biodiversity & Ecosystem Services: Bonn, Germany, 2016. [Google Scholar]
- Guisan, A.; Thuiller, W.; Zimmermann, N.E. Habitat Suitability and Distribution Models: With Applications in R; Cambridge University Press: Cambridge, UK, 2017. [Google Scholar]
- Phillips, S.J.; Anderson, R.P.; Schapire, R.E. Maximum entropy modeling of species geographic distributions. Ecol. Model. 2006, 190, 231–259. [Google Scholar] [CrossRef] [Green Version]
- Thuiller, W.; Lafourcade, B.; Engler, R.; Araújo, M.B. BIOMOD—A platform for ensemble forecasting of species distributions. Ecography 2009, 32, 369–373. [Google Scholar] [CrossRef]
- Hao, T.; Elith, J.; Guillera-Arroita, G.; Lahoz-Monfort, J.J. A review of evidence about use and performance of species distribution modelling ensembles like BIOMOD. Divers. Distrib. 2019, 25, 839–852. [Google Scholar] [CrossRef]
- Abram, N.K.; Meijaard, E.; Wells, J.A.; Ancrenaz, M.; Pellier, A.-S.; Runting, R.K.; Gaveau, D.; Wich, S.A.; Nardiyono; Tjiu, A.; et al. Mapping perceptions of species’ threats and population trends to inform conservation efforts: The Bornean orangutan case study. Divers. Distrib. 2015, 21, 487–499. [Google Scholar] [CrossRef]
- Guisan, A.; Tingley, R.; Baumgartner, J.B.; Naujokaitis-Lewis, I.; Sutcliffe, P.R.; Tulloch, A.I.T.; Regan, T.J.; Brotons, L.; McDonald-Madden, E.; Mantyka-Pringle, C.; et al. Predicting species distributions for conservation decisions. Ecol. Lett. 2013, 16, 1424–1435. [Google Scholar] [CrossRef] [PubMed]
- Kühl, H.S.; Boesch, C.; Kulik, L.; Haas, F.; Arandjelovic, M.; Dieguez, P.; Bocksberger, G.; McElreath, M.B.; Agbor, A.; Angedakin, S.; et al. Human impact erodes chimpanzee behavioral diversity. Science 2019, 363, 1453–1455. [Google Scholar] [CrossRef] [Green Version]
- Kano, T.; Ogawa, H.; Asato, R.; Kanamori, M. Distribution and Density of Wild Chimpanzees on the Northwestern Bank of the Malagarasi River. Tanzania 1999, 15, 153–162. [Google Scholar]
- Piel, A.K.; Stewart, F. Census and Conservation Status of Chimpanzees (Pan Troglodytes Schweinfurthii) across the Greater Mahale Ecosystem; The Nature Conservancy: Arlington, VA, USA, 2014. [Google Scholar]
- Junker, J.; Blake, S.; Boesch, C.; Campbell, G.; Du Toit, L.; Duvall, C.S.; Ekobo, A.; Etoga, G.; Galat-Luong, A.; Gamys, J.; et al. Recent decline in suitable environmental conditions for African great apes. Divers. Distrib. 2012, 18, 1077–1091. [Google Scholar] [CrossRef]
- Bonnin, N.; Wich, S.; Stewart, F.A.; Bellis, J.; Chitayat, A.; Dickson, R.; Ingram, R.; Jantz, S.M.; Moore, R.; Pintea, L.; et al. Modelling Landscape Connectivity Change for Chimpanzee Conservation in Tanzania. Biol. Conserv. 2020, in press. [Google Scholar]
- Moyer, D.; Plumptre, A.J.; Pintea, L.; Hernandez-Aguilar, A.; Moore, J.; Stewart, F.A.; Davenport, T.R.B.; Piel, A.K.; Kamenya, S.; Mugabe, H.; et al. Surveys of Chimpanzees and Other Biodiversity in Western Tanzania; US Fish and Wildlife Service: Washington, DC, USA; The Jane Goodall Institute: Vienna, VA, USA; Wildlife Conservation Society: New York, NY, USA; UCSD: San Diego, CA, USA, 2006. [Google Scholar]
- Pusey, A.E.; Pintea, L.; Wilson, M.L.; Kamenya, S.; Goodall, J. The Contribution of Long-Term Research at Gombe National Park to Chimpanzee Conservation. Conserv. Biol. 2007, 21, 623–634. [Google Scholar] [CrossRef]
- Nakamura, M.; Hosaka, K.; Itoh, N.; Zamma, K. (Eds.) Mahale Chimpanzees: 50 Years of Research; Cambridge University Press: Cambridge, UK, 2015. [Google Scholar]
- Chimpanzé de Schweinfurth (Pan Troglodytes Schweinfurthii): État de Conservation de l’espèce et Plan D’action 2010–2020. Available online: https://portals.iucn.org/library/sites/library/files/documents/2010-023-Fr.pdf (accessed on 28 October 2020).
- Yoshikawa, M.; Ogawa, H.; Sakamaki, T.; Idani, G. Population density of chimpanzees in Tanzania. Pan Afr. News 2008, 15, 17–20. [Google Scholar] [CrossRef] [Green Version]
- Piel, A.K.; Cohen, N.; Kamenya, S.; Ndimuligo, S.A.; Pintea, L.; Stewart, F.A. Population status of chimpanzees in the Masito-Ugalla Ecosystem, Tanzania. Am. J. Primatol. 2015, 77, 1027–1035. [Google Scholar] [CrossRef]
- Moore, J. Savanna Chimpanzees. In Topics in Primatology; University of Tokyo Press: Tokyo, Japan, 1992; Volume 1, pp. 98–118. [Google Scholar]
- Pruetz, J.D.; Bertolani, P. Chimpanzee (Pan troglodytes verus) Behavioral Responses to Stresses Associated with Living in a Savannah-Mosaic Environment: Implications for Hominin Adaptations to Open Habitats. Paleoanthropology 2009, 2009, 252–262. [Google Scholar] [CrossRef]
- Lehmann, J.; Boesch, C. To fission or to fusion: Effects of community size on wild chimpanzee (Pan troglodytes verus) social organisation. Behav. Ecol. Sociobiol. 2004, 56, 207–216. [Google Scholar] [CrossRef]
- McLester, E.; Pintea, L.; Stewart, F.A.; Piel, A.K. Cercopithecine and Colobine Abundance Across Protected and Unprotected Land in the Greater Mahale Ecosystem, Western Tanzania. Int. J. Primatol. 2019, 40, 687–705. [Google Scholar] [CrossRef] [Green Version]
- Baker, M.; Shoch, D. Ntakata Mountains REDD Project; Verra: Washington, DC, USA, 2017. [Google Scholar]
- Eastman, R. TerrSet; Clark Labs: Worcester, MA, USA, 2016. [Google Scholar]
- Buckland, S.T. Distance Sampling: Methods and Applications; Springer International Publishing: Cham, Switzerland, 2015. [Google Scholar]
- Plumptre, A.J. Monitoring mammal populations with line transect techniques in African forests. J. Appl. Ecol. 2000, 37, 356–368. [Google Scholar] [CrossRef]
- Kramer-Schadt, S.; Niedballa, J.; Pilgrim, J.D.; Schröder, B.; Lindenborn, J.; Reinfelder, V.; Stillfried, M.; Heckmann, I.; Scharf, A.K.; Augeri, D.M.; et al. The importance of correcting for sampling bias in MaxEnt species distribution models. Divers. Distrib. 2013, 19, 1366–1379. [Google Scholar] [CrossRef]
- Nishida, T.; Wrangham, R.W.; Goodall, J.; Uehara, S. Local Differences in plant-feeding Habits of chimpanzees between the Mahale Mountains and Gombe National Park, Tanzania. J. Hum. Evol. 1983, 12, 467–480. [Google Scholar] [CrossRef]
- Piel, A.K.; Strampelli, P.; Greathead, E.; Hernandez-Aguilar, R.A.; Moore, J.; Stewart, F.A. The diet of open-habitat chimpanzees (Pan troglodytes schweinfurthii) in the Issa valley, western Tanzania. J. Hum. Evol. 2017, 112, 57–69. [Google Scholar] [CrossRef] [PubMed] [Green Version]
- Teleki, G. Population Status of Wild Chimpanzees (Pan Troglodytes) and Threats to Survival. In Understanding Chimpanzees; Heltne, P.G., Marquardt, L.A., Eds.; Harvard University Press: Cambridge, MA, USA, 1989; pp. 312–353. [Google Scholar] [CrossRef]
- Plumptre, A.J.; Rose, R.; Nangendo, G.; Williamson, E.A.; Didier, K.; Hart, J.; Mulindahabi, F.; Hicks, C.; Griffin, B.; Ogawa, H.; et al. Eastern Chimpanzee (Pan Troglodytes Schweinfurthii) Status Survey and Conservation Action Plan 2010–2020; IUCN: Glenn, Switzerland, 2010. [Google Scholar]
- Fitzgerald, M.; Coulson, R.; Lawing, A.M.; Matsuzawa, T.; Koops, K. Modeling habitat suitability for chimpanzees (Pan troglodytes verus) in the Greater Nimba Landscape, Guinea, West Africa. Primates 2018, 59, 361–375. [Google Scholar] [CrossRef] [PubMed]
- Jantz, S.M.; Pintea, L.; Nackoney, J.; Hansen, M.C. Landsat ETM+ and SRTM Data Provide Near Real-Time Monitoring of Chimpanzee (Pan troglodytes) Habitats in Africa. Remote. Sens. 2016, 8, 427. [Google Scholar] [CrossRef] [Green Version]
- Hernandez-Aguilar, R.A. Chimpanzee nest distribution and site reuse in a dry habitat: Implications for early hominin ranging. J. Hum. Evol. 2009, 57, 350–364. [Google Scholar] [CrossRef]
- Usdm: Uncertainty Analysis for Species Distribution Models. Available online: https://www.researchgate.net/publication/303174794_Usdm_Uncertainty_analysis_for_species_distribution_models (accessed on 29 October 2020).
- R Core Team. R: A Language and Environment for Statistical Computing; R Foundation for Statistical Computing: Vienna, Austria, 2013. [Google Scholar]
- Araújo, M.B.; New, M. Ensemble forecasting of species distributions. Trends Ecol. Evol. 2007, 22, 42–47. [Google Scholar] [CrossRef] [PubMed]
- Buisson, L.; Thuiller, W.; Casajus, N.; Lek, S.; Grenouillet, G. Uncertainty in ensemble forecasting of species distribution. Glob. Chang. Biol. 2010, 16, 1145–1157. [Google Scholar] [CrossRef]
- Elith, J.; Graham, C.H. Do they? How do they? WHY do they differ? On finding reasons for differing performances of species distribution models. Ecography 2009, 32, 66–77. [Google Scholar] [CrossRef]
- Elith, J.; Graham, C.H.; Anderson, R.P.; Dudík, M.; Ferrier, S.; Guisan, A.; Hijmans, R.J.; Huettmann, F.; Leathwick, J.R.; Lehmann, A.; et al. Novel methods improve prediction of species’ distributions from occurrence data. Ecography 2006, 29, 129–151. [Google Scholar] [CrossRef] [Green Version]
- Biomod2: Ensemble Platform for Species Distribution Modeling. Available online: https://www.researchgate.net/publication/309762991_biomod2_Ensemble_Platform_for_Species_Distribution_Modeling (accessed on 20 October 2020).
- Barbet-Massin, M.; Jiguet, F.; Albert, C.H.; Thuiller, W. Selecting pseudo-absences for species distribution models: How, where and how many? Methods Ecol. Evol. 2012, 3, 327–338. [Google Scholar] [CrossRef]
- Jiménez-Valverde, A.; Lobo, J.M. Threshold criteria for conversion of probability of species presence to either–or presence–absence. Acta Oecol. 2007, 31, 361–369. [Google Scholar] [CrossRef]
- Landis, J.R.; Koch, G.G. The Measurement of Observer Agreement for Categorical Data. Biometrics 1977, 33, 159. [Google Scholar] [CrossRef] [Green Version]
- Baker, M.; Shoch, D. Ntakata Mountains REDD Project. Project Monitoring Report; Verra: Washington, DC, USA, forthcoming.
- Kühl, H.S.; Sop, T.; Williamson, E.A.; Mundry, R.; Brugière, D.; Campbell, G.; Cohen, H.; Danquah, E.; Ginn, L.; Herbinger, I.; et al. The Critically Endangered western chimpanzee declines by 80%. Am. J. Primatol. 2017, 79, e22681. [Google Scholar] [CrossRef]
- Royle, J.A.; Dorazio, R.M. Hierarchical Modeling and Inference in Ecology: The Analysis of Data from Populations, Metapopulations and Communities; Elsevier: Amsterdam, The Netherlands, 2009. [Google Scholar] [CrossRef]
- Mathewson, P.D.; Spehar, S.N.; Meijaard, E.; Nardiyono; Purnomo; Sasmirul, A.; Sudiyanto; Oman; Sulhnudin; Jasary; et al. Evaluating orangutan census techniques using nest decay rates: Implications for population estimates. Ecol. Appl. 2008, 18, 208–221. [Google Scholar] [CrossRef]
- Hashimoto, C. Population census of the chimpanzees in the Kalinzu Forest, Uganda: Comparison between methods with nest counts. Primates 1995, 36, 477–488. [Google Scholar] [CrossRef]
- Plumptre, A.J.; Cox, D.; Mugume, S. The Status of Chimpanzees in Uganda; Albertine Rift Technical Report; Wildlife Conservation Society: New York, NY, USA, 2003. [Google Scholar]
- Wilfred, P.; Kayeye, H.; Magige, F.J.; Kisingo, A.; Nahonyo, C.L. Challenges facing the introduction of SMART patrols in a game reserve, western Tanzania. Afr. J. Ecol. 2019, 57, 523–530. [Google Scholar] [CrossRef]
- Verra Methodologies. Available online: https://verra.org/methodologies/ (accessed on 29 October 2020).
- Songorwa, A. Community-Based Wildlife Management (CWM) in Tanzania: Are the Communities Interested? World Dev. 1999, 27, 2061–2079. [Google Scholar] [CrossRef]
- Mbatu, R.S. REDD + research: Reviewing the literature, limitations and ways forward. For. Policy Econ. 2016, 73, 140–152. [Google Scholar] [CrossRef]
- Angelson, A.; Brockhaus, M.; Sunderlin, W.D.; Verchot, L.V. Analysing REDD+: Challenges and Choices; Center for International Forestry Research (CIFOR): Bogor, Indonesia, 2012. [Google Scholar] [CrossRef] [Green Version]
- Koch, S. International influence on forest governance in Tanzania: Analysing the role of aid experts in the REDD+ process. For. Policy Econ. 2017, 83, 181–190. [Google Scholar] [CrossRef]
- Doggart, N.; Morgan-Brown, T.; Lyimo, E.; Mbilinyi, B.; Meshack, C.K.; Sallu, S.M.; Spracklen, D.V. Agriculture is the main driver of deforestation in Tanzania. Environ. Res. Lett. 2020, 15, 034028. [Google Scholar] [CrossRef]
- Bird Life International. Available online: https://www.birdlife.org/sites/default/files/attachments/cultural_values_surveys_report_june_14.pdf (accessed on 20 October 2020).
- Agwanda, A.; Amani, H. Population Growth, Structure, and Momentum in Tanzania. Available online: http://esrf.or.tz/docs/THDR-BP-7.pdf (accessed on 20 October 2020).
Publisher’s Note: MDPI stays neutral with regard to jurisdictional claims in published maps and institutional affiliations. |
© 2020 by the authors. Licensee MDPI, Basel, Switzerland. This article is an open access article distributed under the terms and conditions of the Creative Commons Attribution (CC BY) license (http://creativecommons.org/licenses/by/4.0/).
Share and Cite
Dickson, R.; Baker, M.; Bonnin, N.; Shoch, D.; Rifkin, B.; Stewart, F.A.; Piel, A.K. Combining Deforestation and Species Distribution Models to Improve Measures of Chimpanzee Conservation Impacts of REDD: A Case Study from Ntakata Mountains, Western Tanzania. Forests 2020, 11, 1195. https://doi.org/10.3390/f11111195
Dickson R, Baker M, Bonnin N, Shoch D, Rifkin B, Stewart FA, Piel AK. Combining Deforestation and Species Distribution Models to Improve Measures of Chimpanzee Conservation Impacts of REDD: A Case Study from Ntakata Mountains, Western Tanzania. Forests. 2020; 11(11):1195. https://doi.org/10.3390/f11111195
Chicago/Turabian StyleDickson, Rebecca, Marc Baker, Noémie Bonnin, David Shoch, Benjamin Rifkin, Fiona A. Stewart, and Alex K. Piel. 2020. "Combining Deforestation and Species Distribution Models to Improve Measures of Chimpanzee Conservation Impacts of REDD: A Case Study from Ntakata Mountains, Western Tanzania" Forests 11, no. 11: 1195. https://doi.org/10.3390/f11111195
APA StyleDickson, R., Baker, M., Bonnin, N., Shoch, D., Rifkin, B., Stewart, F. A., & Piel, A. K. (2020). Combining Deforestation and Species Distribution Models to Improve Measures of Chimpanzee Conservation Impacts of REDD: A Case Study from Ntakata Mountains, Western Tanzania. Forests, 11(11), 1195. https://doi.org/10.3390/f11111195