Article

Growth and Tree Water Deficit of Mixed Norway Spruce and European Beech at Different Heights in a Tree and under Heavy Drought

1
Chair for Forest Growth and Yield Science, Department of Ecology and Ecosystem Management, Technical University of Munich, Hans-Carl-von-Carlowitz-Platz 2, 85354 Freising, Germany
2
Department Soil and Climate, Bavarian State Institute of Forestry (LWF), Hans-Carl-von-Carlowitz-Platz 1, 85354 Freising, Germany
3
Chair for Ecophysiology of Plants, Department of Ecology and Ecosystem Management, Technical University of Munich, Hans-Carl-von-Carlowitz-Platz 2, 85354 Freising, Germany
*
Author to whom correspondence should be addressed.
Forests 2019, 10(7), 577; https://doi.org/10.3390/f10070577
Submission received: 11 May 2019 / Revised: 27 June 2019 / Accepted: 9 July 2019 / Published: 11 July 2019

Abstract

:
Although several studies suggest that tree species in mixed stands resist drought events better than in pure stands, little is known about the impact on growth and the tree water deficit (TWD) in different tree heights at heavy drought. With dendrometer data at the upper and lower stem and coarse roots, we calculated the TWD and growth (ZGmax) (referring to the stem/root basal area) to show (1) the relationship of TWD in different tree heights (50% tree height (H50), breast height (BH), and roots) and the corresponding leaf water potential and (2) how mixture and drought influence the partitioning of growth and tree water. The analyses were made in a mature temperate forest of Norway spruce (Picea abies (L.) Karst.) and European beech (Fagus sylvatica (L.)). Half of the plots were placed under conditions of extreme drought through automatic closing roof systems within the stand. We found a tight relationship of leaf water potentials and TWD at all tree compartments. Through this proven correlation at all tree heights we were also able to study the differences of TWD in all tree compartments next to the growth allocation. Whereas at the beginning of the growing period, trees prioritized growth of the upper stem, during the course of the year the growth of lower stem became a greater priority. Growth allocation of mixed spruces showed a tendency of a higher growth of the roots compared to the BH. However, spruces in interspecific neighborhoods exhibited a lesser TWD in the roots as spruces in intraspecific neighborhood. Beeches in intraspecific neighborhoods showed a higher TWD in BH compared to H50 as beeches in interspecific neighborhoods. Mixture seems to enhance the water supply of spruce trees, which should increase the stability of this species in a time of climatic warming.

1. Introduction

Climate models have predicted an increased number of drought events of longer duration and stronger intensity [1,2] that are likely to alter the growth and stability of forests [3,4,5]. Ciais et al. (2005) [6] gave evidence that precipitation deficits and extreme summer heat are capable of causing a Europe-wide reduction of ecosystem primary productivity. Increasing drought and accompanying changing resource availability lead to shifts in resource allocation within trees [7]. As predicted by functional equilibrium models [8,9] and proven by extensive studies [10], plants allocate additional biomass to those organs that acquire the most limiting resources. Consequently, plants allocate more biomass to the roots in such cases where belowground resources, such as water and nutrients, are limiting. When light or CO2 are the limiting factors, plants allocate more biomass above ground. Tree species sensitive to drought can, therefore, respond to extreme drought with reduced stem growth and increased root growth [10,11].
Drought stress reactions can be determined, inter alia, via the leaf water potential (tree water status). Based on the difficult accessibility of branches, it is very laborious to measure leaf water status in tall trees. Continuous high-resolution measurements of stem radius variations meet this and provide an opportunity to gain deeper insights into the dynamics of tree water relations and growth patterns due to the opportunity to assess tree water status without a canopy crane or other circuitous methods for taking leaf water potential measurements in the tree crown. As such, they offer huge potential for ecological research under a changing climate. Stem radius variations are increasingly used in plant physiology to analyze stem growth and the tree water status [12,13,14,15] and have been analyzed for different tree species [14,16,17].
Usually, diurnal stem radius variations are measured by electronic, high-resolution point or band dendrometers [18,19]. The drought-induced changes can be recognized through modified characteristics of the bark tissue (decreasing cell turgor, which results in stem shrinking) and changes in radial growth [20,21]. When transpiration exceeds the water uptake from the soil, the tree relocates water storages—mainly located in the living cells within the cortex—to maintain the transpiration process. The coordination of stomatal and hydraulic regulations allows for an adjustment of the tree water use. Various environmental factors (e.g., temperature, soil water availability, vapor pressure deficit) control these mechanisms and thus the tree’s water use. On a diurnal scale, shrinking and swelling of the stem is the result of these mechanisms and lead to alternating depletion and replenishment of the involved tissues. This process is driven by the transpiratory demand during daytime and overnight refilling of the living cells of the phloem tissue with water from the soil [22,23,24]. There are many ecophysiology models describing the dynamic radial and vertical water flow between the tree tissues [13,25,26,27]. Zweifel et al. (2000) [17] investigated stem radius changes and their relation to stored water in stems with truncated stem segments of living Norway spruces and were able to attribute the stem contraction to the living tissue outside of the cambium. Shrinking and swelling of the stem can, hence, be used as indicators for the whole tree water status [17,26,28] and can be measured for any species and any tree organ. How trees react during drought at the different tree compartments are very interesting, due to the species-specific strategies to cope with drought stress [29,30]. McCarthy and Enquist (2007) [31] showed that plants allocate biomass to the plant compartment which acquires the most limiting resource.
In addition to site and climatic conditions, the mixture of species also has a significant impact on the water supply and growth of a tree. Species mixture can improve forest ecosystem functions under changing climate through complementary interactions among a pair of species [32,33]. Complementary effects depend on the type of species and the changing resource availability [33,34,35]. The most widespread mixed forest stands in Central Europe consist of Norway spruce (Picea abies (L.) Karst.) and European beech (Fagus sylvatica (L.)). Mixtures of these tree species have been analyzed in many studies [36,37,38,39]. Evergreen spruce is considered to be particularly sensitive to drought stress [40,41], with a drought sensitive stomata closure [29] and correspondingly impeded photosynthesis. Deciduous beech is known to be more drought resistant as compared to spruce [41,42]. The mixture of these two tree species can have several advantages for both tree species. For example, Bolte and Villanueva (2006) [43] detected a deeper rooting system of beech in mixture with spruce compared to monocultures, and consequently, an enhanced water and nutrient availability for beech trees. The improved soil water storage due to the reduced interception of beech in mixture with spruce [44,45,46] can also have a positive effect on the water availability and change the entire stand’s water balance [47].
The knowledge of species interactions in mixed forest stands has increased in recent years, with many investigations about beech and spruce trees [35,37,42,43]. However, most studies have focused on growth-related differences in mixture rather than on changes in tree water status and these were not observed at different tree positions. Further, the differences between stem and root show the shift of growth and tree water under drought conditions for the given species, where water drawn from internal stores during drought is not only from an ecophysiological perspective but also from a remote sensing perspective interesting. Remote sensing captures the water content of tree canopy (CWC), the product of leaf area index, leaf mass per area, and leaf water content [48]. A greater focus on water pools may improve our ability to understand and anticipate drought-induced changing traits or mortality in plants [49,50].
In the present study, we determined the basal area growth (ZGmax) and tree water status (tree water deficit, (TWD), as described by Zweifel et al. (2016) [51], also referred to the basal area) at three tree compartments: the upper stem (50% tree height—H50, at approximately 15 m tree height), the lower stem (breast height (1.3 m), BH), and at the coarse roots (roots) in the growing season. The TWD, as the measurement unit for the tree water status, was analyzed in relation to the leaf water. Subsequently, TWDs at H50, BH, and the roots were employed to analyze species-specific differences between beech and spruce in terms of drought-related changes in root–stem allometry.
The aim of the study was to investigate growth allocation as well as local tree water deficit in the tree compartments under heavy drought, in intra- and interspecific neighborhoods. Therefore, we used a rainfall exclusion experimental setup to provide drought stressed mature trees in the treatment plots and unstressed trees in the control plots. Naturally occurring drought was experimentally enhanced by means of stand scale rainfall exclusion, the Kranzberg ROOF Experiment (KROOF). We demonstrated how the allocation pattern of control and treatment trees or trees in intra- and interspecific neighborhoods during the growing season look.
We hypothesized that: (1) the stem basal area variations and the leaf water potential show a positive relationship at the different tree heights; (2) the relationship between growth response and the respective TWD is the same at the three different positions H50, BH, and root; and (3) interspecific neighborhood with beech trees facilitates spruce trees under drought stress.

2. Materials and Methods

2.1. Site Description

The study was located in southern Germany (longitude: 11°39′42″ E, latitude: 48°25′12″ N, altitude 490 m a.s.l), near Freising (Kranzberg forest) and approximately 35 km northeast of Munich. The soil of the Kranzberg forest is a luvisol developed from loess over tertiary sediments with high nutrient and water availability. The forest stand comprises European beech (Fagus sylvatica (L.)) and Norway spruce (Picea abies (L.) Karst.). The age of trees varies between 64 ± 2 years for spruce and 84 ± 4 years for beech (in 2015). In 2010, twelve plots were established with a total area of 1730 m² with 63 beech trees (mean height 26.1 m, mean diameter 28.9 cm at breast height) and 53 spruce trees (mean height 29 m, mean diameter 34.3 cm at breast height) (Table 1). On each plot, four trees were selected as monitoring trees (48 trees in total) (Table S1). Each of the 12 plots contained zones of spruce or beech trees in an intraspecific neighborhood and zones of spruce or beech trees in an interspecific neighborhood.
For the throughfall exclusion experiment (TE), roof structures were built in six plots below the crown of the trees at a height of about 3 m. The other six plots acted as control plots (CO). In spring 2010, the plots were trenched with a heavy-duty plastic trap to a depth of about 1 m to avoid external effects on and water intake in the experimental plots [52]. The roofs closed only during rainfall through a set of precipitation sensors, to avoid unintended micro-meteorological and physiological effects [38]. The drying cycles with closing roofs lasted from May to December 2014 (570 mm precipitation was excluded) and from March to November 2015 (480.2 mm precipitation was excluded). The annual precipitation average for the Kranzberg forest ranges between 750 and 800 mm for the entire year and between 460 to 500 mm year−1 in the growing season (mid-April to the end of October) (1971–2000) [53]. The annual average temperature is 7.8 °C and the average temperature for the growing season is 13.8 °C (detailed description provided by Pretzsch et al. (2012) [47]).

2.2. Water Potential (Ψ Leaf)

Leaf water potentials at predawn (LWPpre) and midday (LWPmid) were measured on several sunny days during the growing season (April–October) in 2014 and 2015. Leaf water potential measurements were conducted in time windows from 2:00 h to 3:30 h CET for LWPpre and 13:00 to 15:00 h CET for LWPmid. The same experimental trees (n = 31) were used for the dendrometer measurements that could be conducted with the canopy crane. At a height of 25–30 m, south-exposed twigs of about 10–20 cm in length were taken from the sun crown (access through canopy crane) and were enclosed in humid plastic bags to prevent further water loss. The leaves were immediately measured with a pressure chamber (Model 3000 Pressure Extractor, Soil moisture Equipment Corp., Santa Barbara, CA, USA).

2.3. Stem Basal Area Variations (Growth and Tree Water Deficit)

On each of the 48 trees selected for measurement, three automatic dendrometers of two types (Ecomatik, Dachau, Germany) were installed at different tree heights. The DR-type dendrometer (DR, radius dendrometer) was installed at breast height (1.3 m, BH) and 50% tree height (H50). For measurements of the roots, circumference dendrometers of the DC2 type (DC, circumference dendrometer) were used and fixed on one main root per monitoring tree at most 20 cm depth and 30–50 cm distance to the tree. The thermal expansion coefficient of the sensor was <0.2/K µm. All dendrometers were fixed in a northeast direction to avoid environmental influences. From the spruce trees, the outermost tissues of the bark were removed to minimize hygroscopic effects of the outer bark. The frames of the dendrometers were fixed with stainless steel screws on the tree stem, with the linear transducer in direct contact with the stem/root surface. Measurements were recorded every 10 minutes. All measurement errors and proven outliers in the raw data were eliminated prior to further processing. Hourly means of the raw 10 minute measurements of stem radius variations were analyzed during the growing season (April to the end of September, days of the year (DOY) 91–273).
To describe how drought affects the tree organs, we used the tree water deficit (TWD), defined by Zweifel et al. (2016) [51]. First, the “pure” growth (further defined as zero growth, ZGmax) was extracted from the stem or root dendrometer measurements to determine the TWD (water signal). For separation, we used the zero growth concept of Zweifel et al. (2016) [51], which results in growth curves with a stepwise shape (Figure 1). When the current maximum of the stem basal area is exceeded, the increment increases. For our investigations, we used the maximum ZG value per day (ZGmax). The TWD was calculated as the difference between the growth-induced expansion of the stem and the daily shrinking and swelling. The negative values of the TWD revealed increasing shrinking of the stem basal area.
The radial measurements (ZG and TWD) were transformed into basal area fluctuations. This procedure is standard in examinations of tree ring data [54], but new for analysis of dendrometer data. We used this approach because the basal area fluctuation as a two-dimensional measurement better reflects the tree response than the radial fluctuation as a one-dimensional measurement which neglects the respective tree dimension.
Furthermore, we proved the relationship between the stem water signals and the leaf water potentials at midday and predawn. We found the best match for the relationship between LWPpre and TWD minimum (TWDmin, maximum daily shrinkage) during drought conditions (Supplementary Materials, Table S2) and used the LWPpre for further analysis of the relationship between TWDmin and LWPpre.

2.4. Climatic Data

The weather data were collected from two sources. Temperature and relative humidity were measured at 10 min intervals in the forest stand and monitored with a temperature sensor (RFT-2, UMS) at a height of 27 m and stored in a datalogger (Logger Campbell CR100, Multiplexer AM16/32). The sensor was protected against direct irradiation with a ventilated radiation shield. The vapor pressure deficit (VPD) was calculated with these data. Precipitation data were available from the nearby weather station, about 2 km from the study site in Kranzberg forest [55].

2.5. Statistical Analysis

Our experimental setup consisted of time series measurements of individual tree. The individual trees were grouped by different control and treatment plots. Consequently, the analysis was based on nested data. To consider this nesting, we applied linear mixed effect models (lmer) from the package lme4 [56]. The random effects b are the individual tree, with the index i, the plot with the index j and the year abbreviated with the index k. t represents the measurement at which we used the daily maximum value for zero growth (ZGmax) and the daily minimum value for the tree water deficit (TWDmin). ε always represents the residual error of the respective models.
To answer the question of whether the TWDmin at the various tree compartments is able to reflect drought stress, we examined the relationship between the TWDmin and LWPpre at the three different measurement positions. We pooled both years (2014 and 2015) into the same dataset for the analysis.
We applied linear mixed models in a logarithmic form (Equation (1)):
ln ( T W D min ) i j k t = β 0 + β 1 · ln ( L W P p r e i j t ) + b i + b j + b k + ε i j k t
The applied logarithm led to a significantly better fitting of the data and considered the non-linear course of the analyzed relationship. The logarithm of the negative TWDmin values was enabled through a transformation by multiplying by −1. For the depiction, we adapted only the y-axis to negative values. All models where fitted species-specific for a straightforward interpretation.
To show how growth allocation or the TWDmin react between the three tree compartments under drought conditions, we examined the difference ( D i f f ) of ZGmax and TWDmin at a measurement position above to the measurement position below (H50–BH and BH–Root). A value above zero would mean that the upper tree compartment profits, and a value below zero would indicate that the lower tree compartment had a higher growth. We chose to use the difference instead of the ratio because, when using the ratio, meaningful but very low TWDmin or ZGmax values in one compartment can lead to immoderate and meaningless outliers in the analysis.
The resulting difference value of the upper and lower measurements served as the independent variable. Because TWDmin and especially the ZGmax increase over the growing season, the difference between upper and lower compartments ( l o w C o m p ) can be higher at the end of the growing period than at the beginning. Therefore, we always related the difference to the respective measurement of the lower compartment.
To show how mixture and drought treatment influence the growth allocation or TWDmin pattern of the upper and lower compartments, linear mixed models were applied. Mixture ( M i x ) and treatment ( T r e a t ) were included as fixed effects in a model (Equation (2)):
D i f f i j k t = β 0 + β 1 · l o w C o m p i j t + β 2 · M i x · l o w C o m p i j t + β 3 · l o w C o m p i j t · T r e a t + β 4 · l o w C o m p i j t · M i x · T r e a t + b i + b j + b k + ε i j k t
The significances of the fixed effects of the linear mixed models were tested by an F test with Satterthwaite’s approximation ([57], R package lmerTest). To consider the large number of measurements points, we also calculated the conditional coefficient of determination (R2) for the mixed-effect models with the command r.squaredGLMM from the MuMln package. Additionally, the quality of the models was checked using the root mean square error (RMSE). All analyses were performed with R version 3.2.3 [58].

3. Results

3.1. Temperature and Precipitation in 2014 and 2015

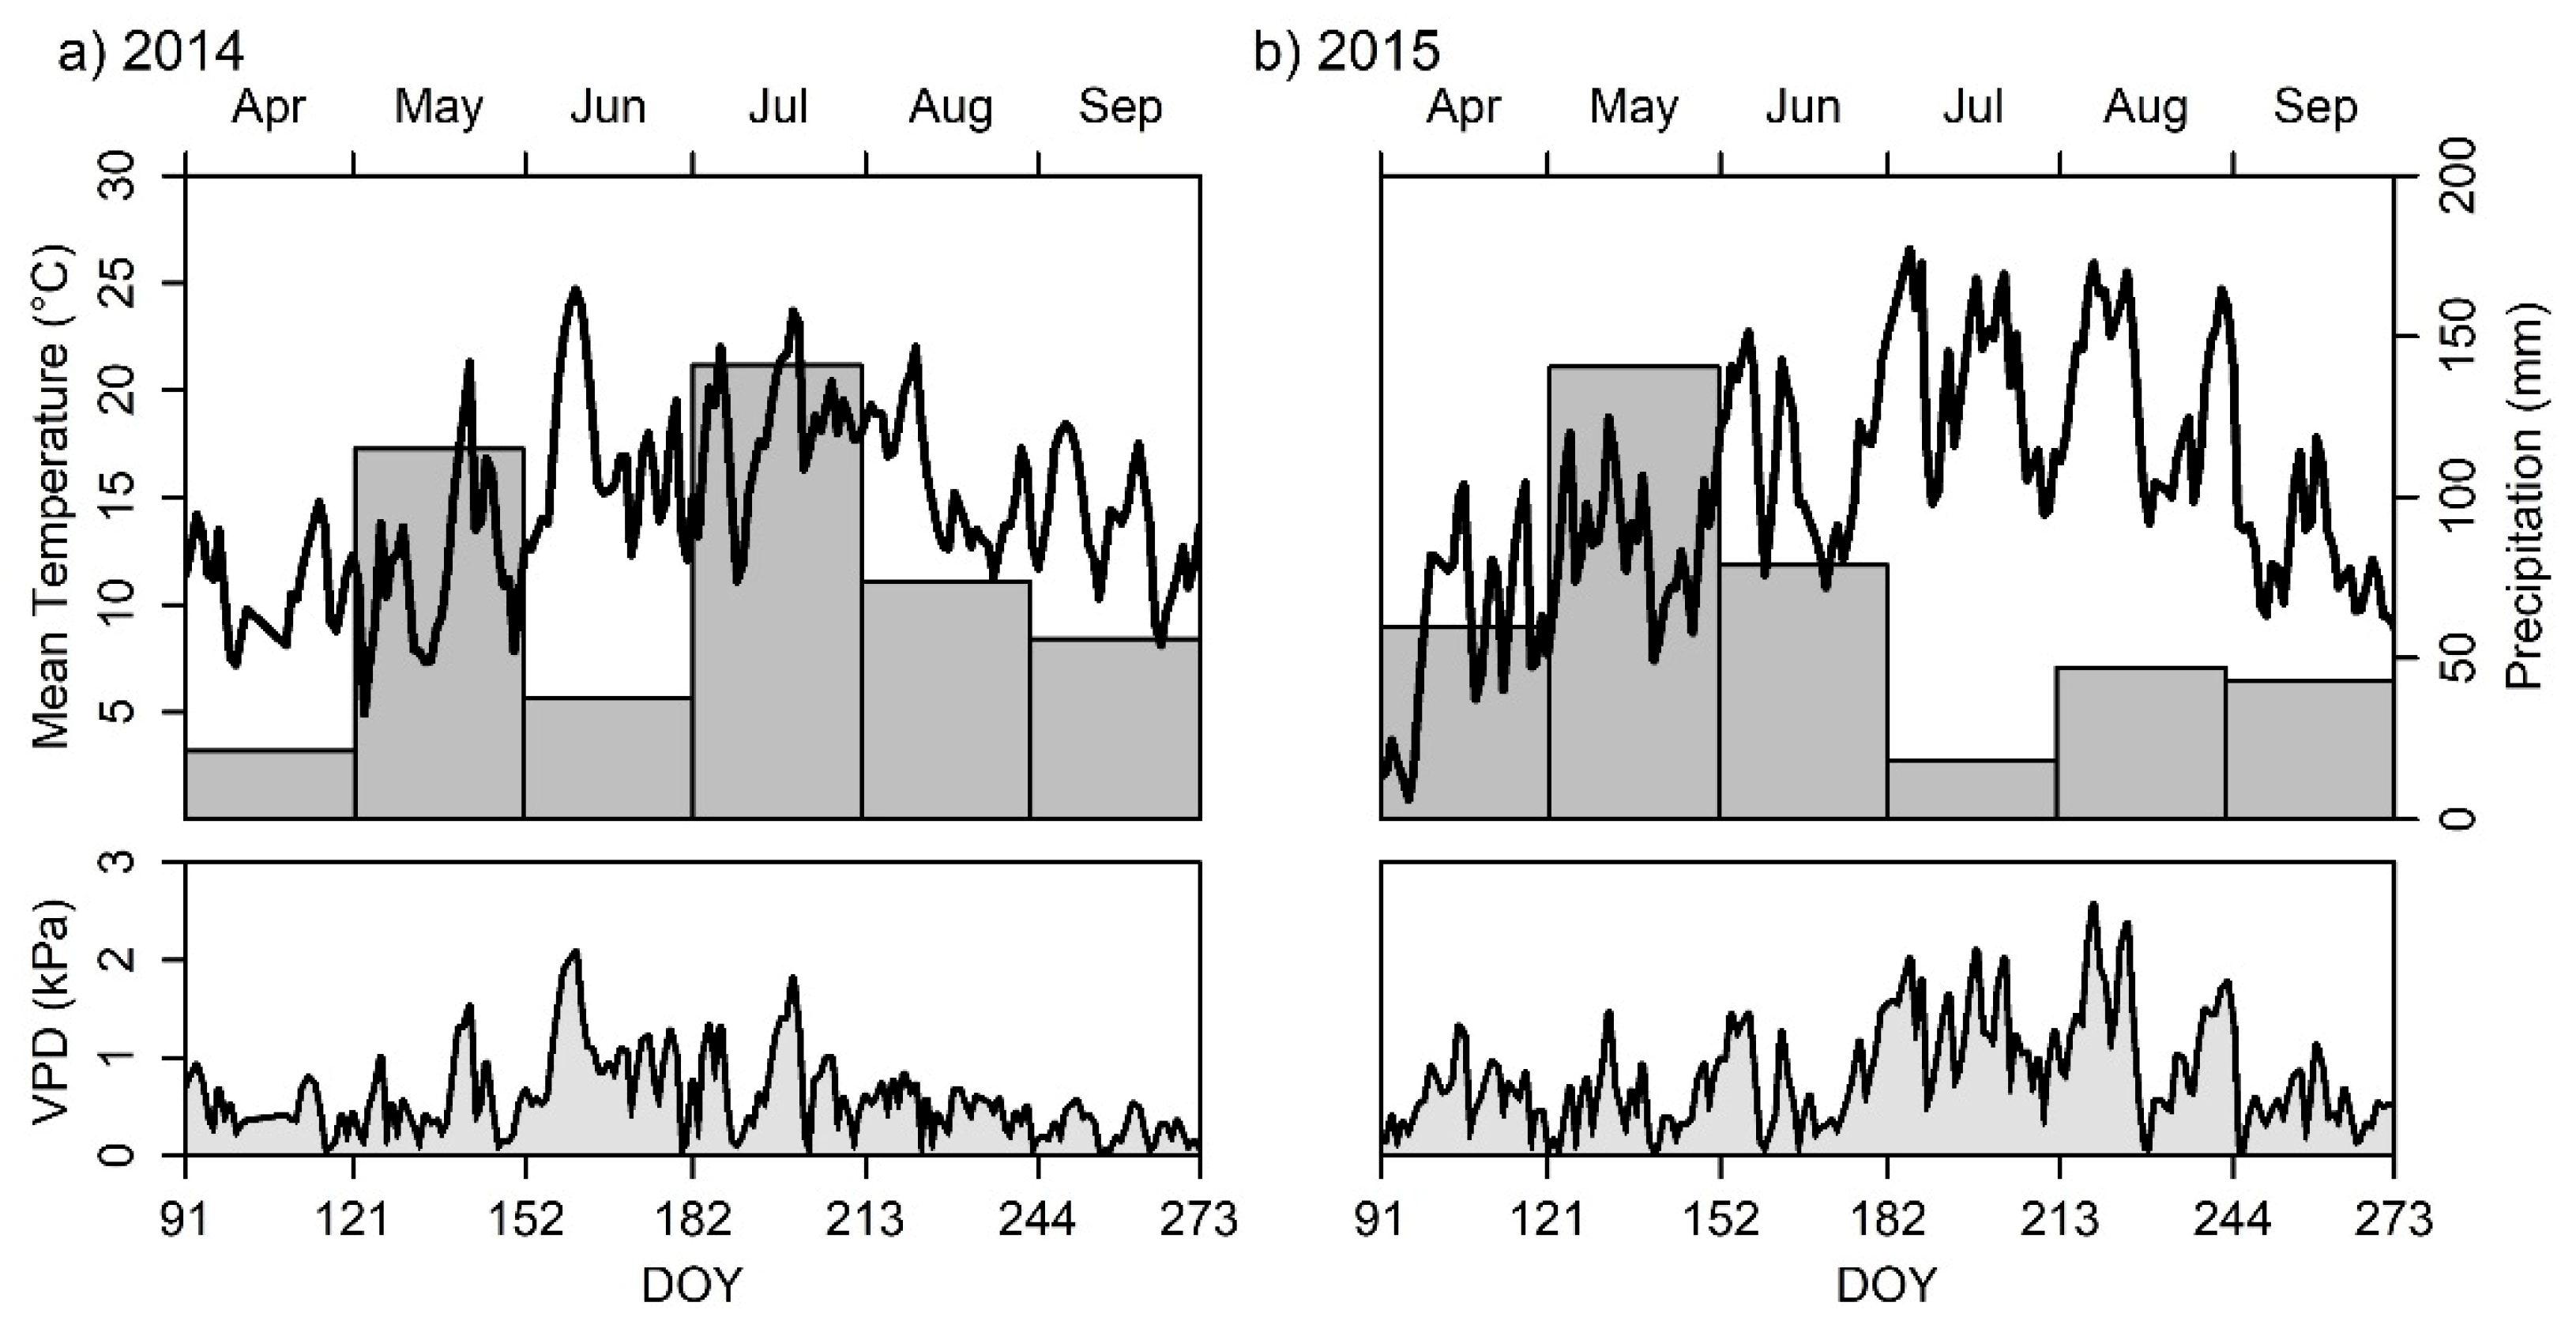
There are clear differences in temperature and precipitation between the analyzed years 2014 and 2015 in the growing season (Figure 2a,b). The air temperature in 2015 was 1.1 °C above the average from 2001 to 2015 [59]. Compared to the year 2014, the summer months of the year 2015 had a higher number of days without rainfall or with low rainfall and simultaneously higher temperatures and higher vapor pressure deficits (VPDs).

3.2. Leaf Water Potentials

Comparing the midday water potentials (LWPmid) for the years 2014 and 2015, the LWPmid were significantly more negative for beech trees than for spruce trees (Supplementary Materials, Figure S1a–d, p < 0.001). Furthermore, we found significant differences between the trees of the drought treatment and control plots (Supplementary Materials, Table S3, p < 0.01), and the predawn water potentials (LWPpre) revealed clearer differences (p < 0.001) compared to LWPmid (Supplementary Materials, Figure S2a–d). The effect of the drought treatment was observable through more negative LWPpre compared to the control plots (Figure S3). No differences were observable between trees in intra- and interspecific neighborhoods.

3.3. Zero Growth and Tree Water Deficit

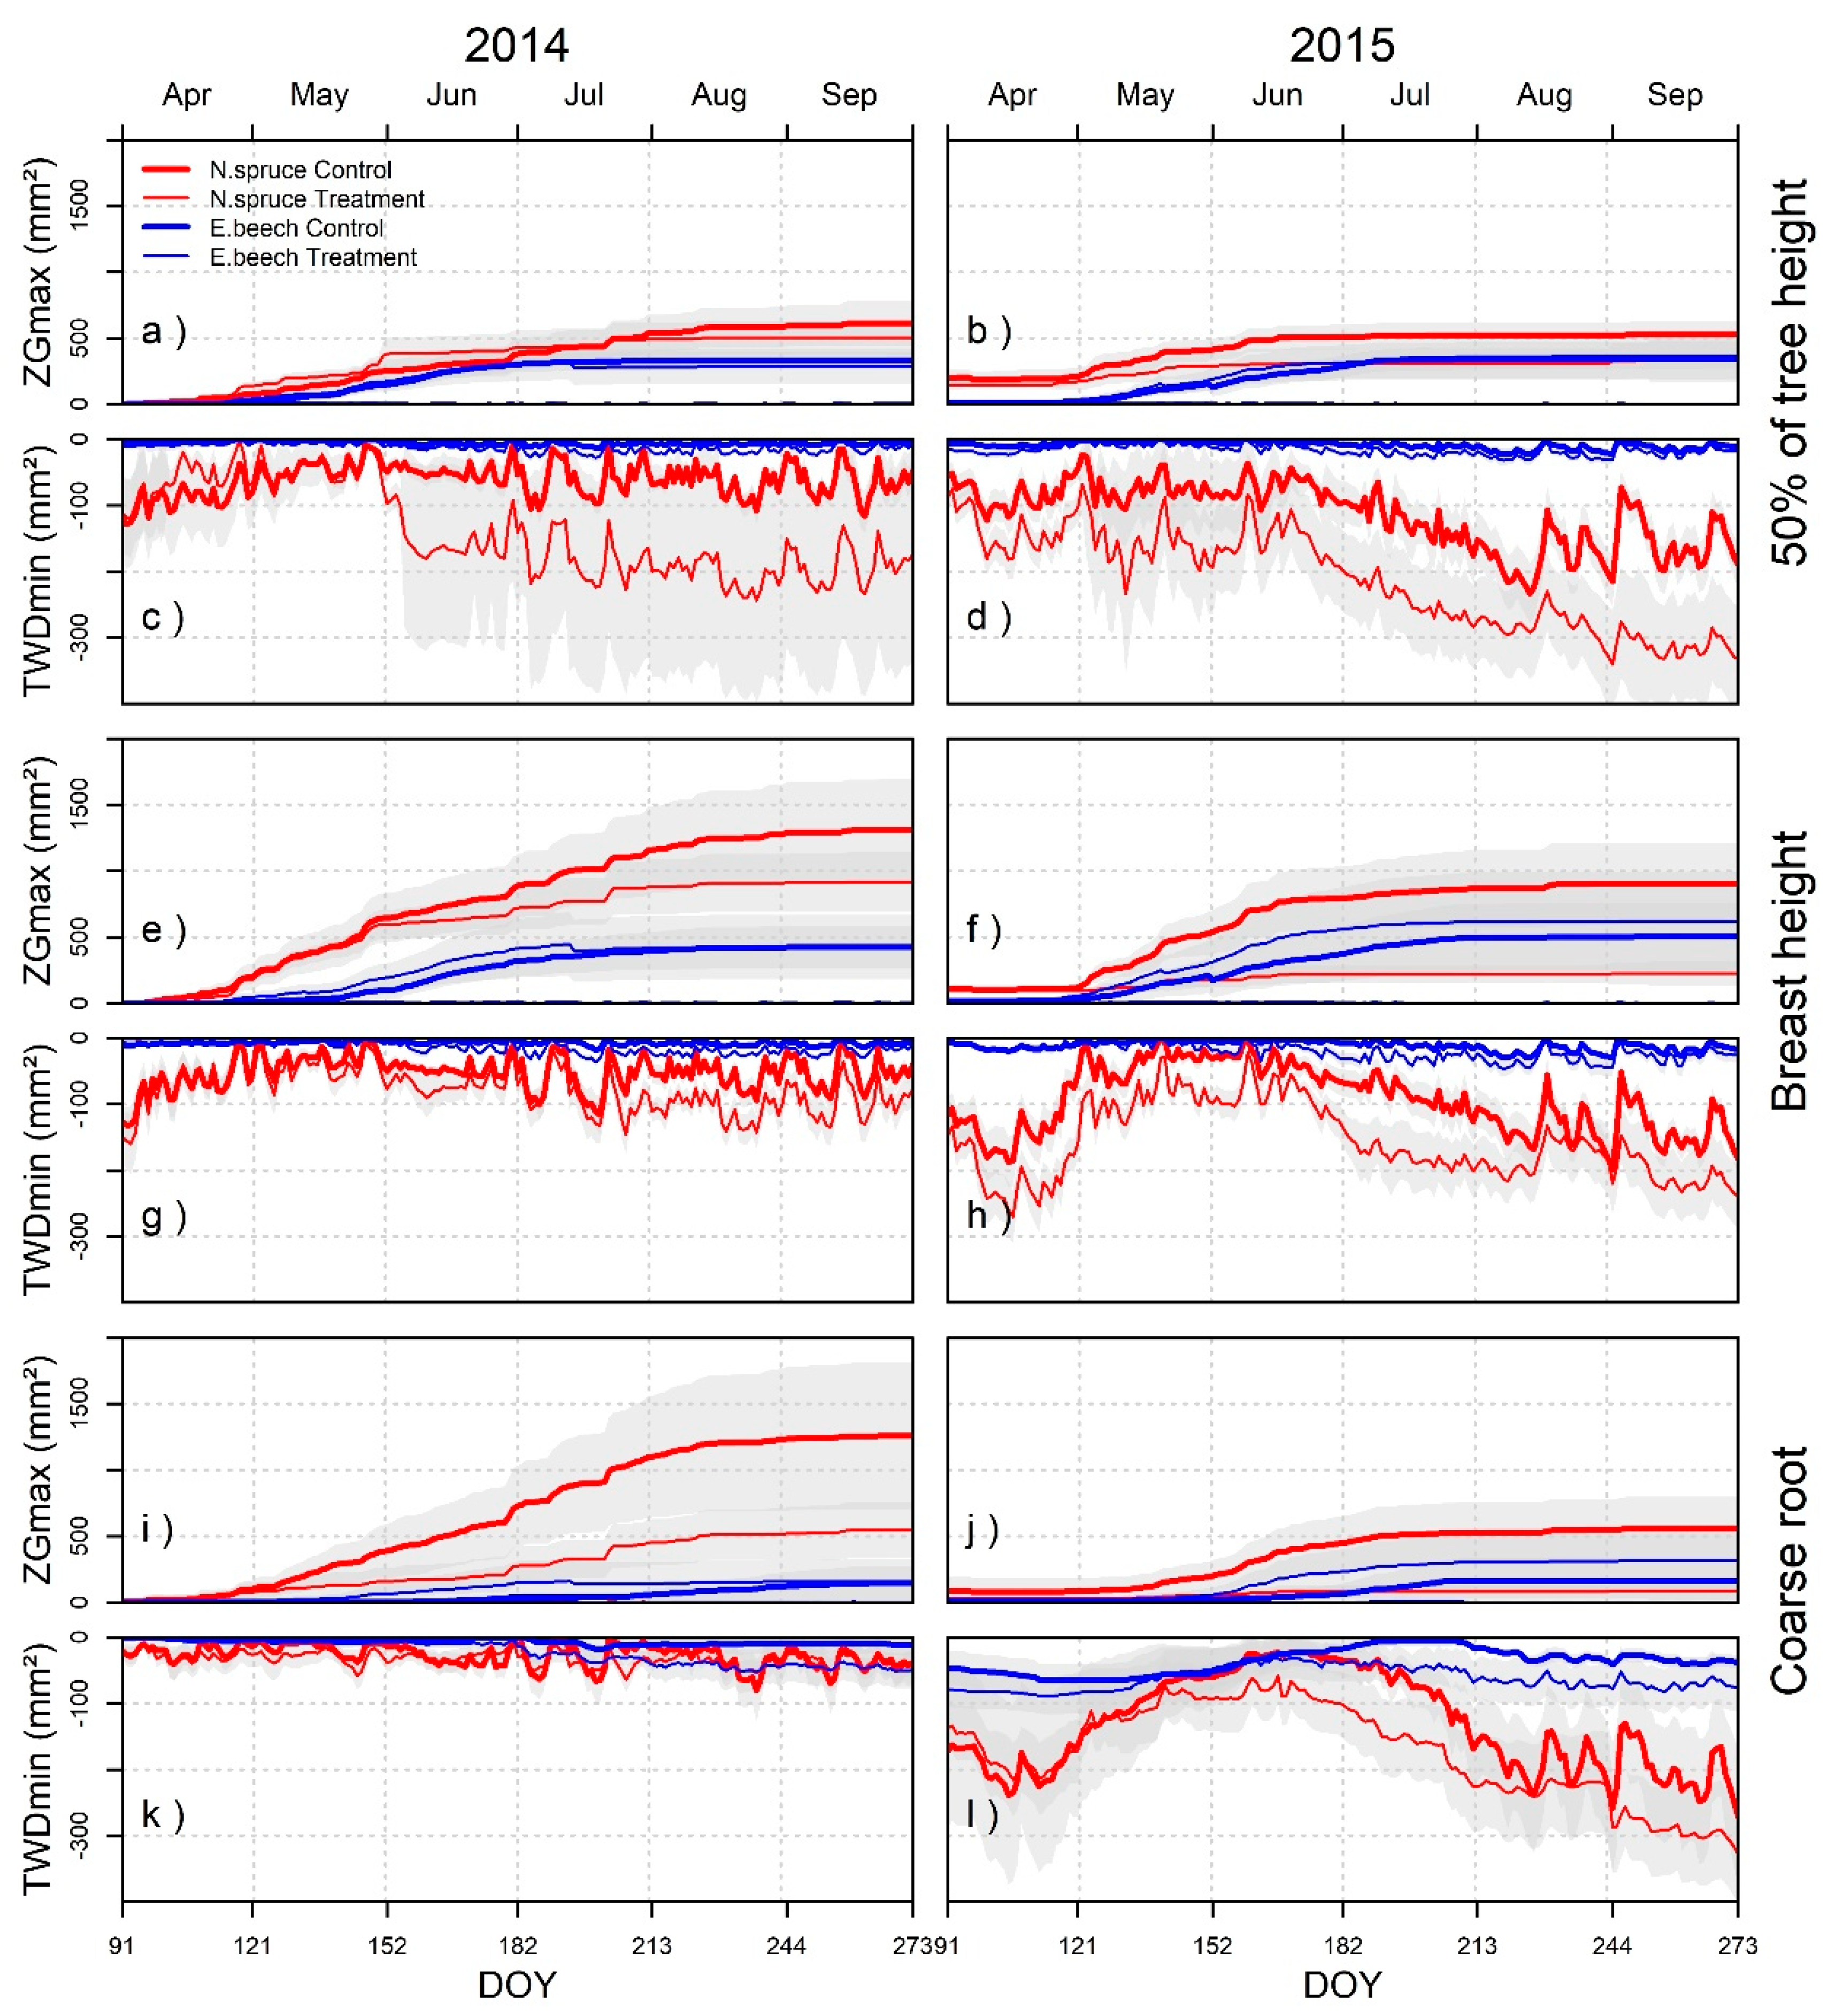
To determine growth and TWDmin, we separated the growth from the daily shrinking and swelling. Figure 3 provides an overview of the data (intra- and interspecific neighborhoods are shown in Figure S4, Supplementary Materials). Spruce trees had a higher diameter increment compared to beech trees in 2014 at all three measuring positions (H50, BH, and roots). The diameter increment of the spruce trees was smaller for the dry year 2015 compared to the year 2014. In beech, by contrast, relevant growth reduction of the trees could not be observed in 2015 compared to 2014. Drought-treated beech trees even showed higher growth in BH and the roots in 2015.
Comparing the daily TWDmin of the growing season in 2014 and 2015, the effect of the drought year 2015 was observable in the intense shrinking in the summer months (DOY 152–243) (Figure 3d,h,l). Furthermore, there was a high shrinkage phase at H50 in 2014 for spruce trees (possibly through an adaptation reaction at the beginning of the drought treatment). The treatment plots indicated a more distinct stem shrinkage compared with the control plots for both years. Species-specific differences can also be seen in the magnitudes of the daily TWD. Spruce trees revealed more distinct stem water changes than beech trees (see daily values of TWD in Figure 3c,d,g,h,k,l). Overall, the stem shrinkage was highest at H50 and roots compared to BH.

3.4. Relationship between Tree Water Deficits and Water Potentials at Different Tree Heights

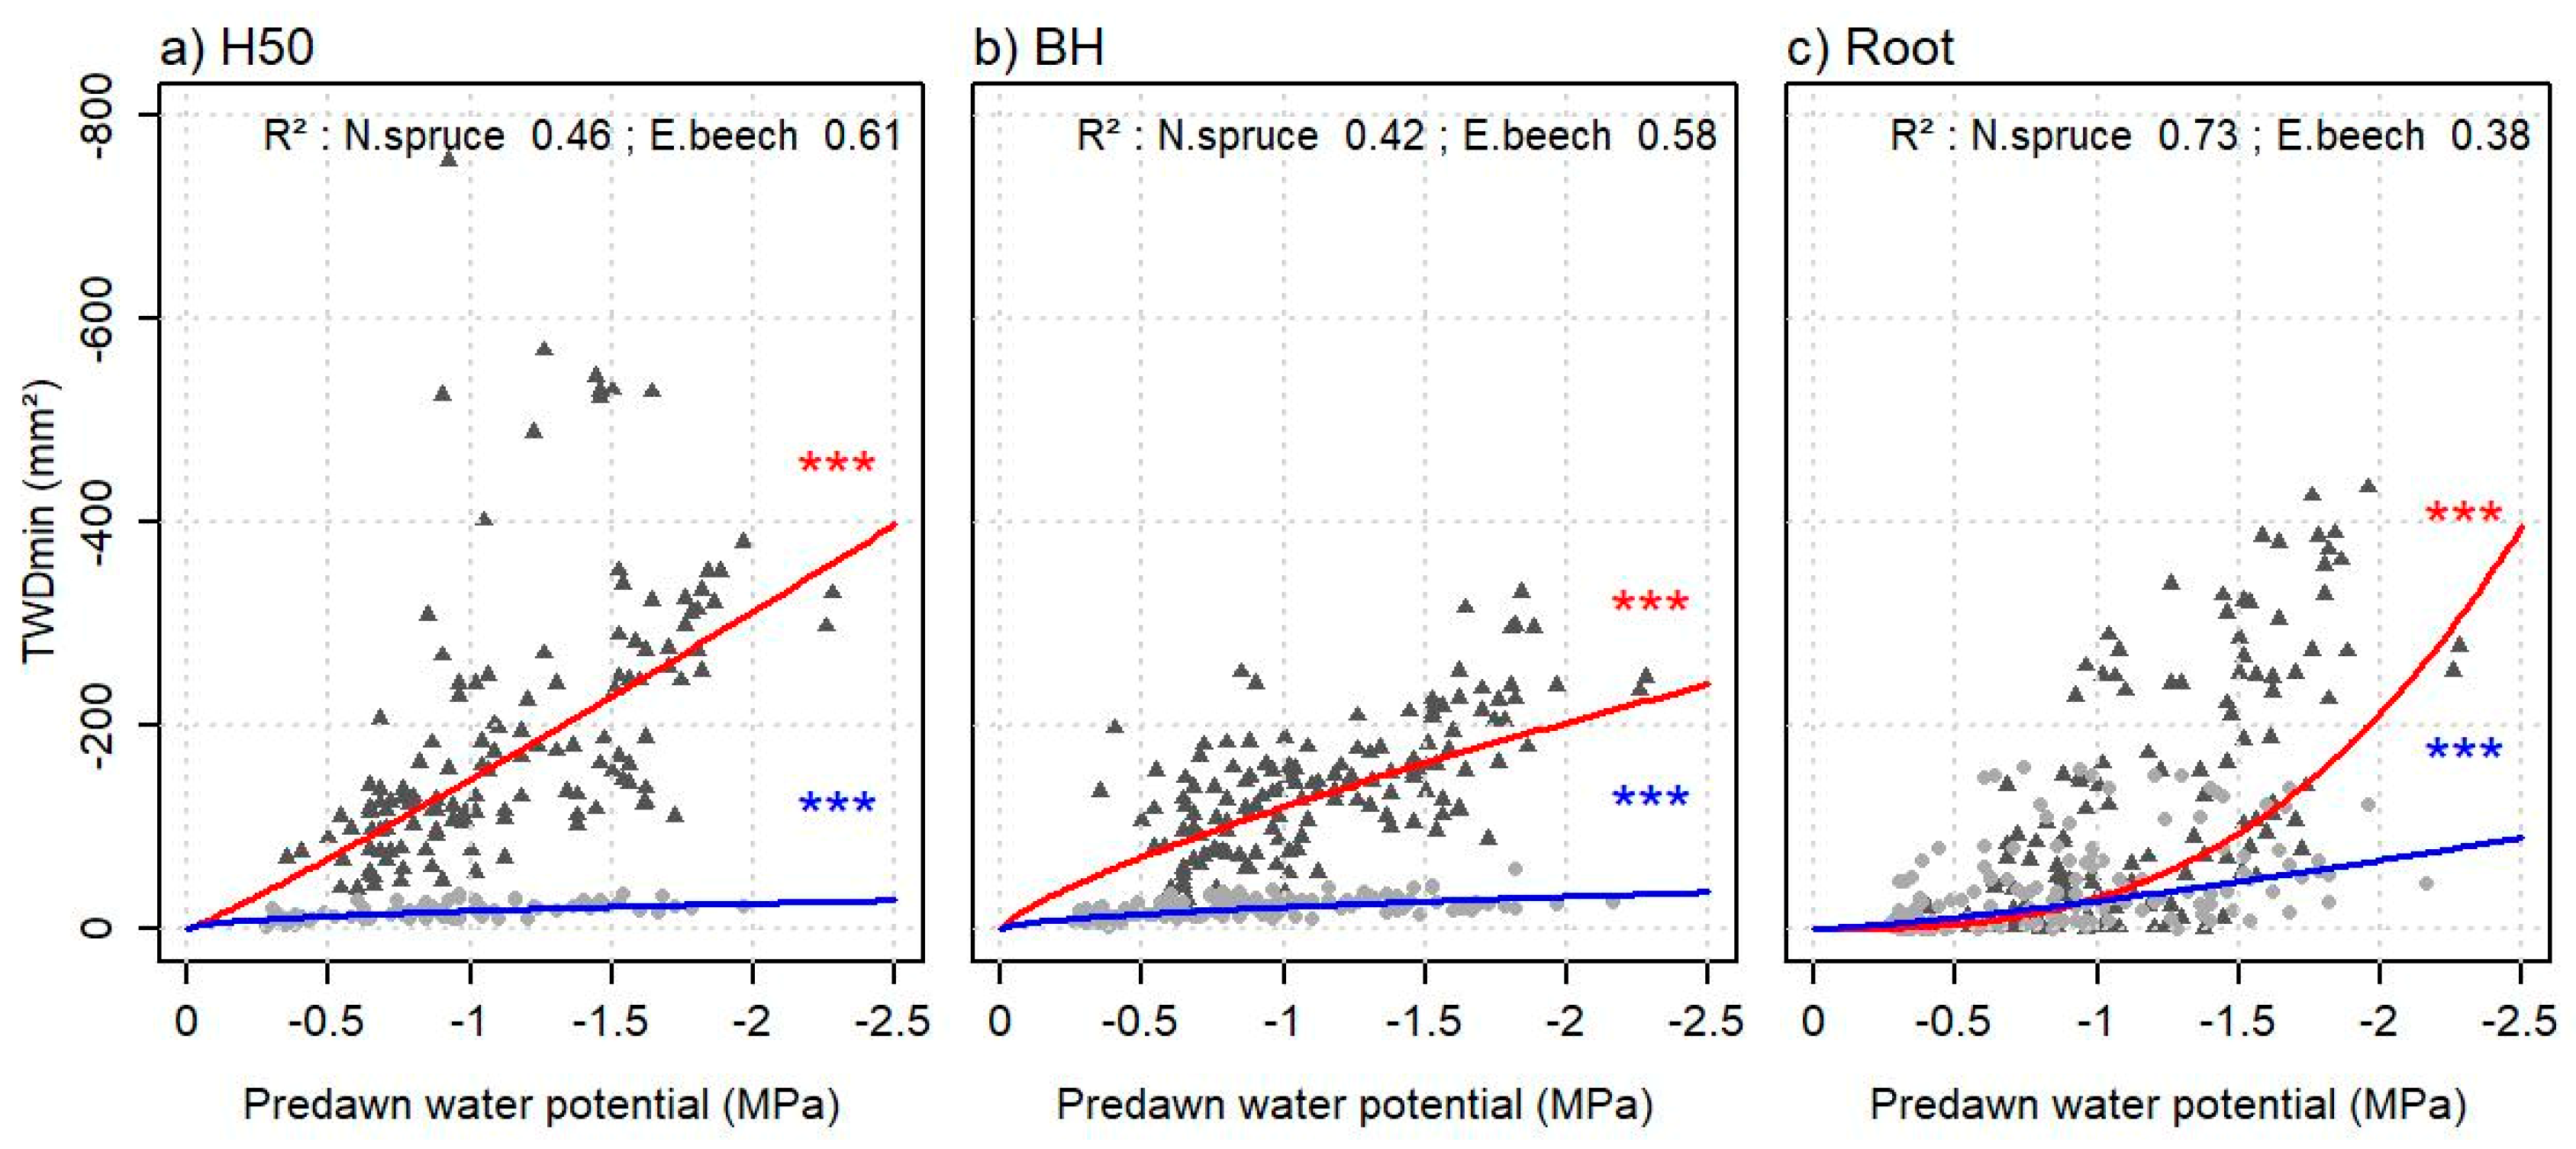
The TWDmin values were more negative when the LWPpre became more negative at the stem (BH, H50) and the roots (Figure 4a–c). Spruce trees revealed a higher TWDmin than beech trees at all positions. The r-squared (R2) of the different models ranged between 0.38 and 0.73. The relationship was significant for both species and all positions (p < 0.001, Table 2). The TWDmin was highest in the crown, but the roots also showed high fluctuations when LWPpre reached −1.2 MPa.

3.5. Stem and Root Growth and TWDmin in Different Tree Compartments

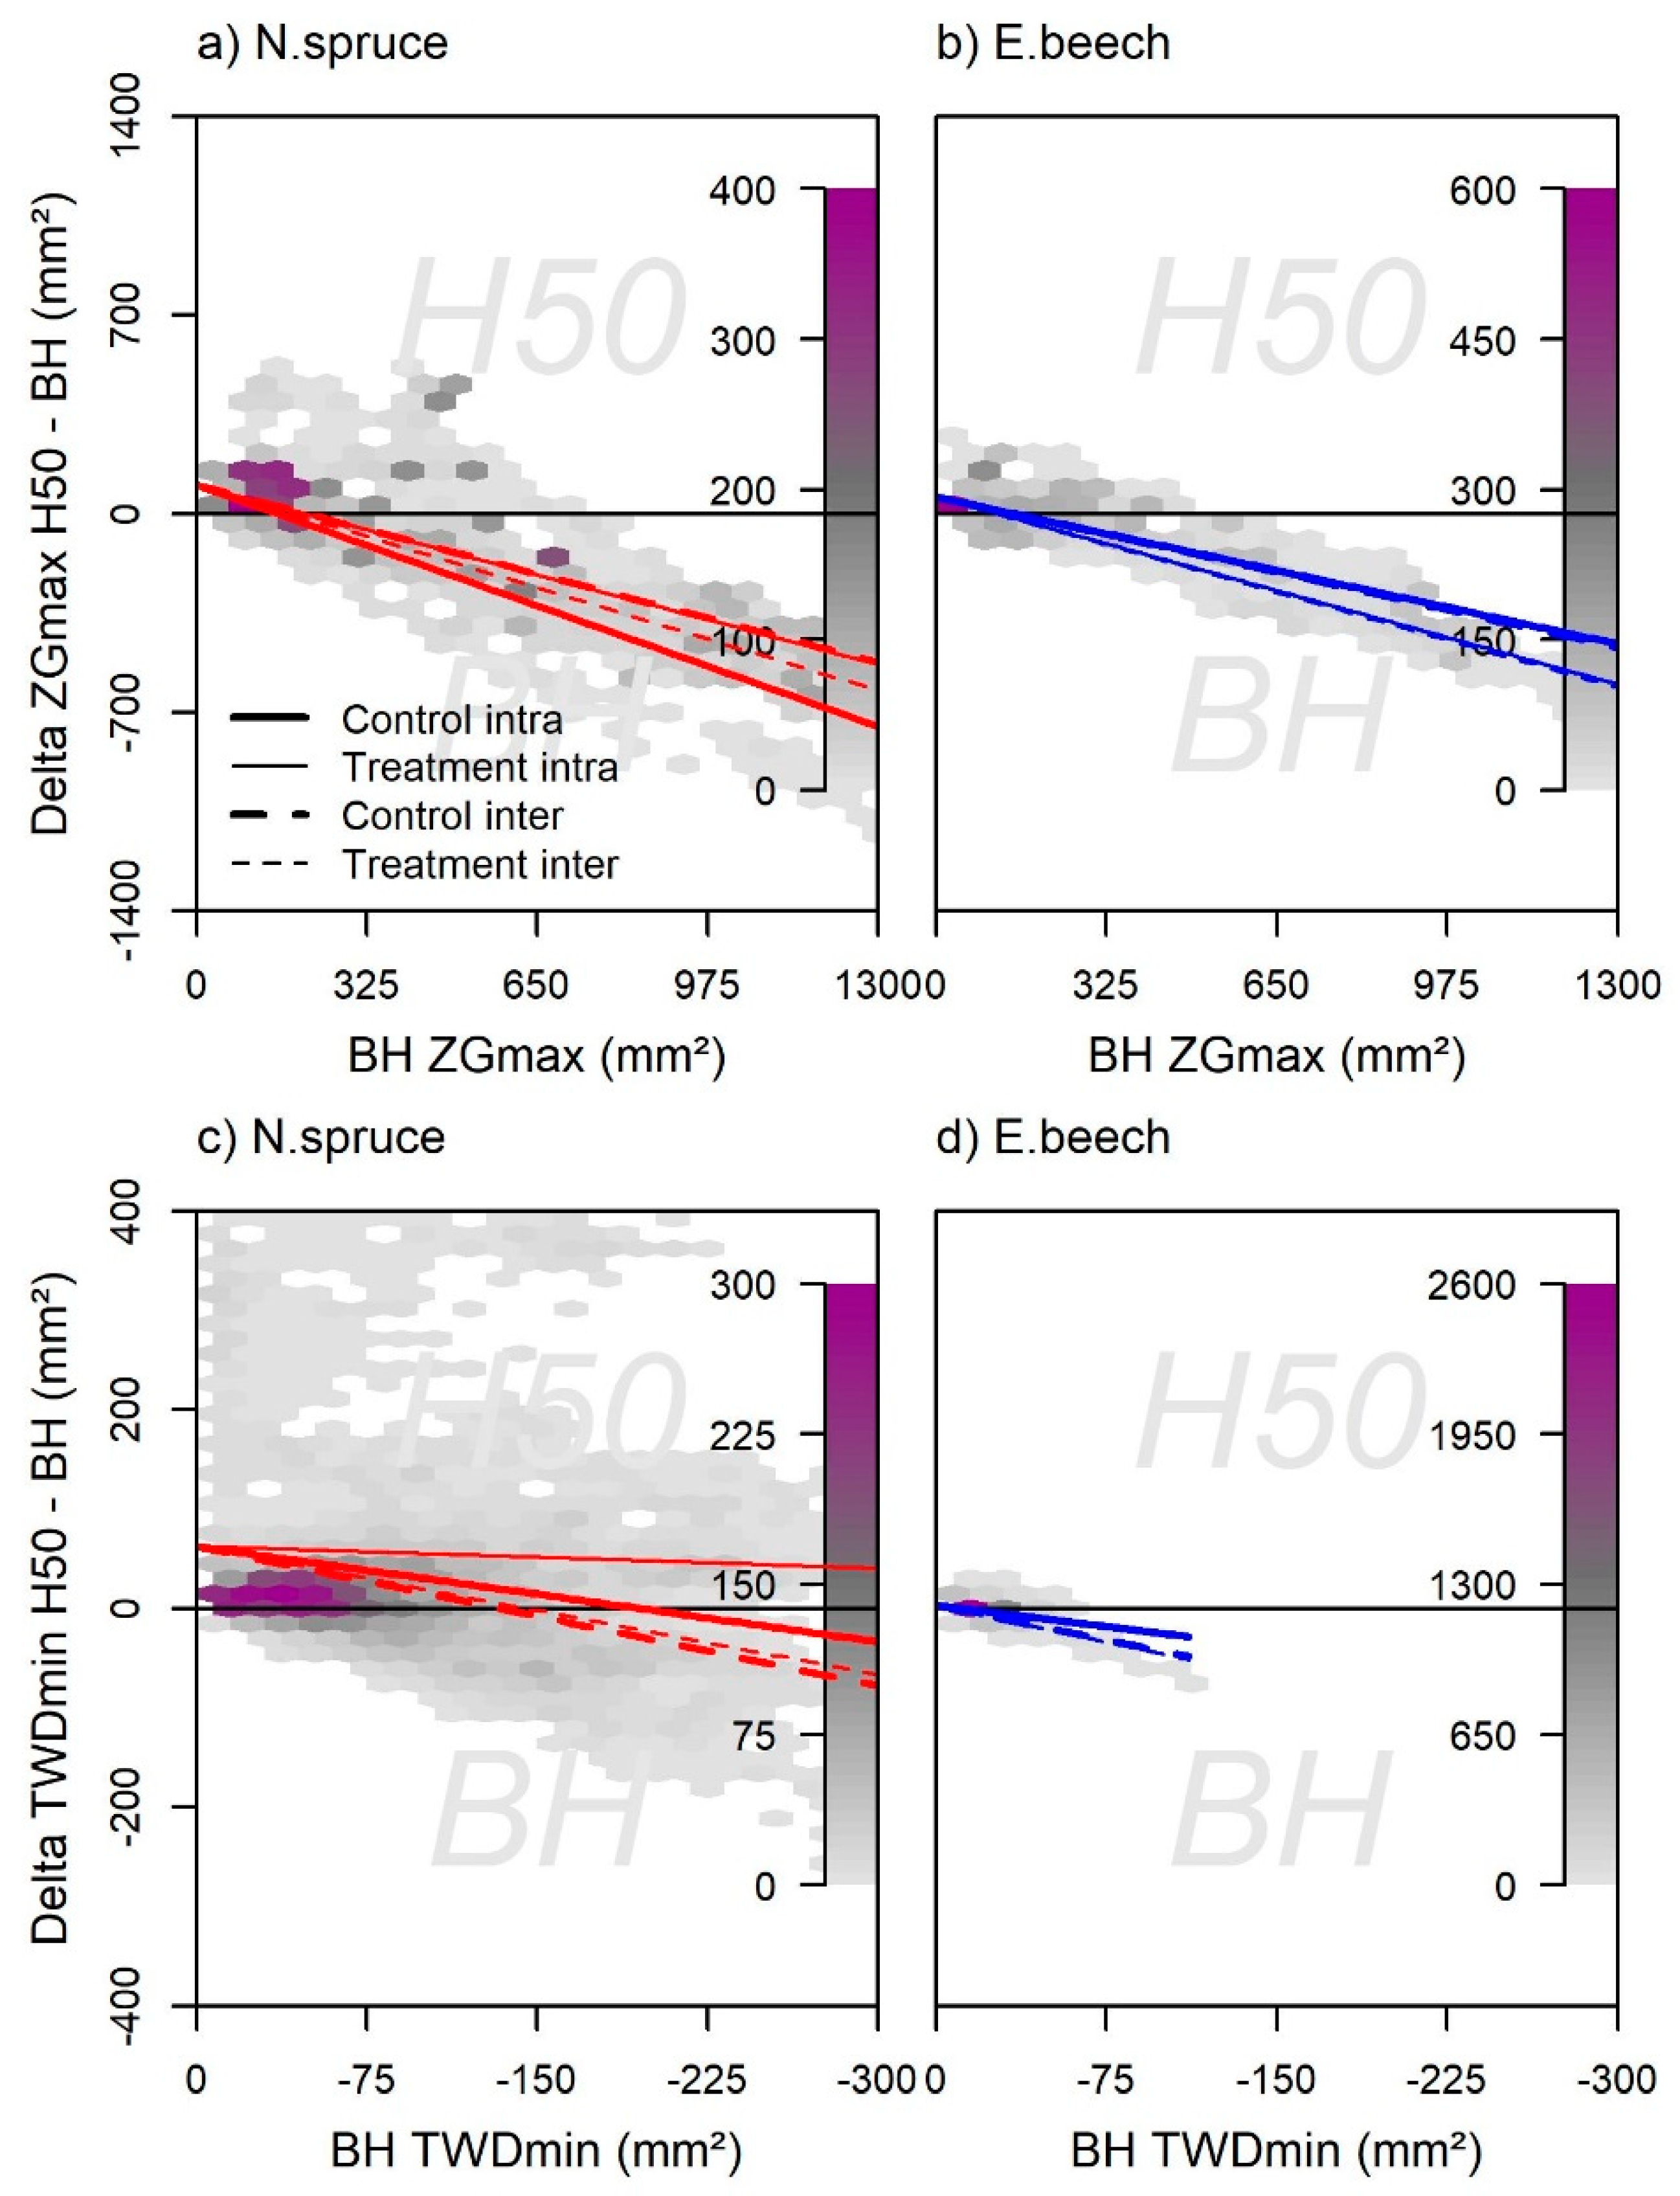
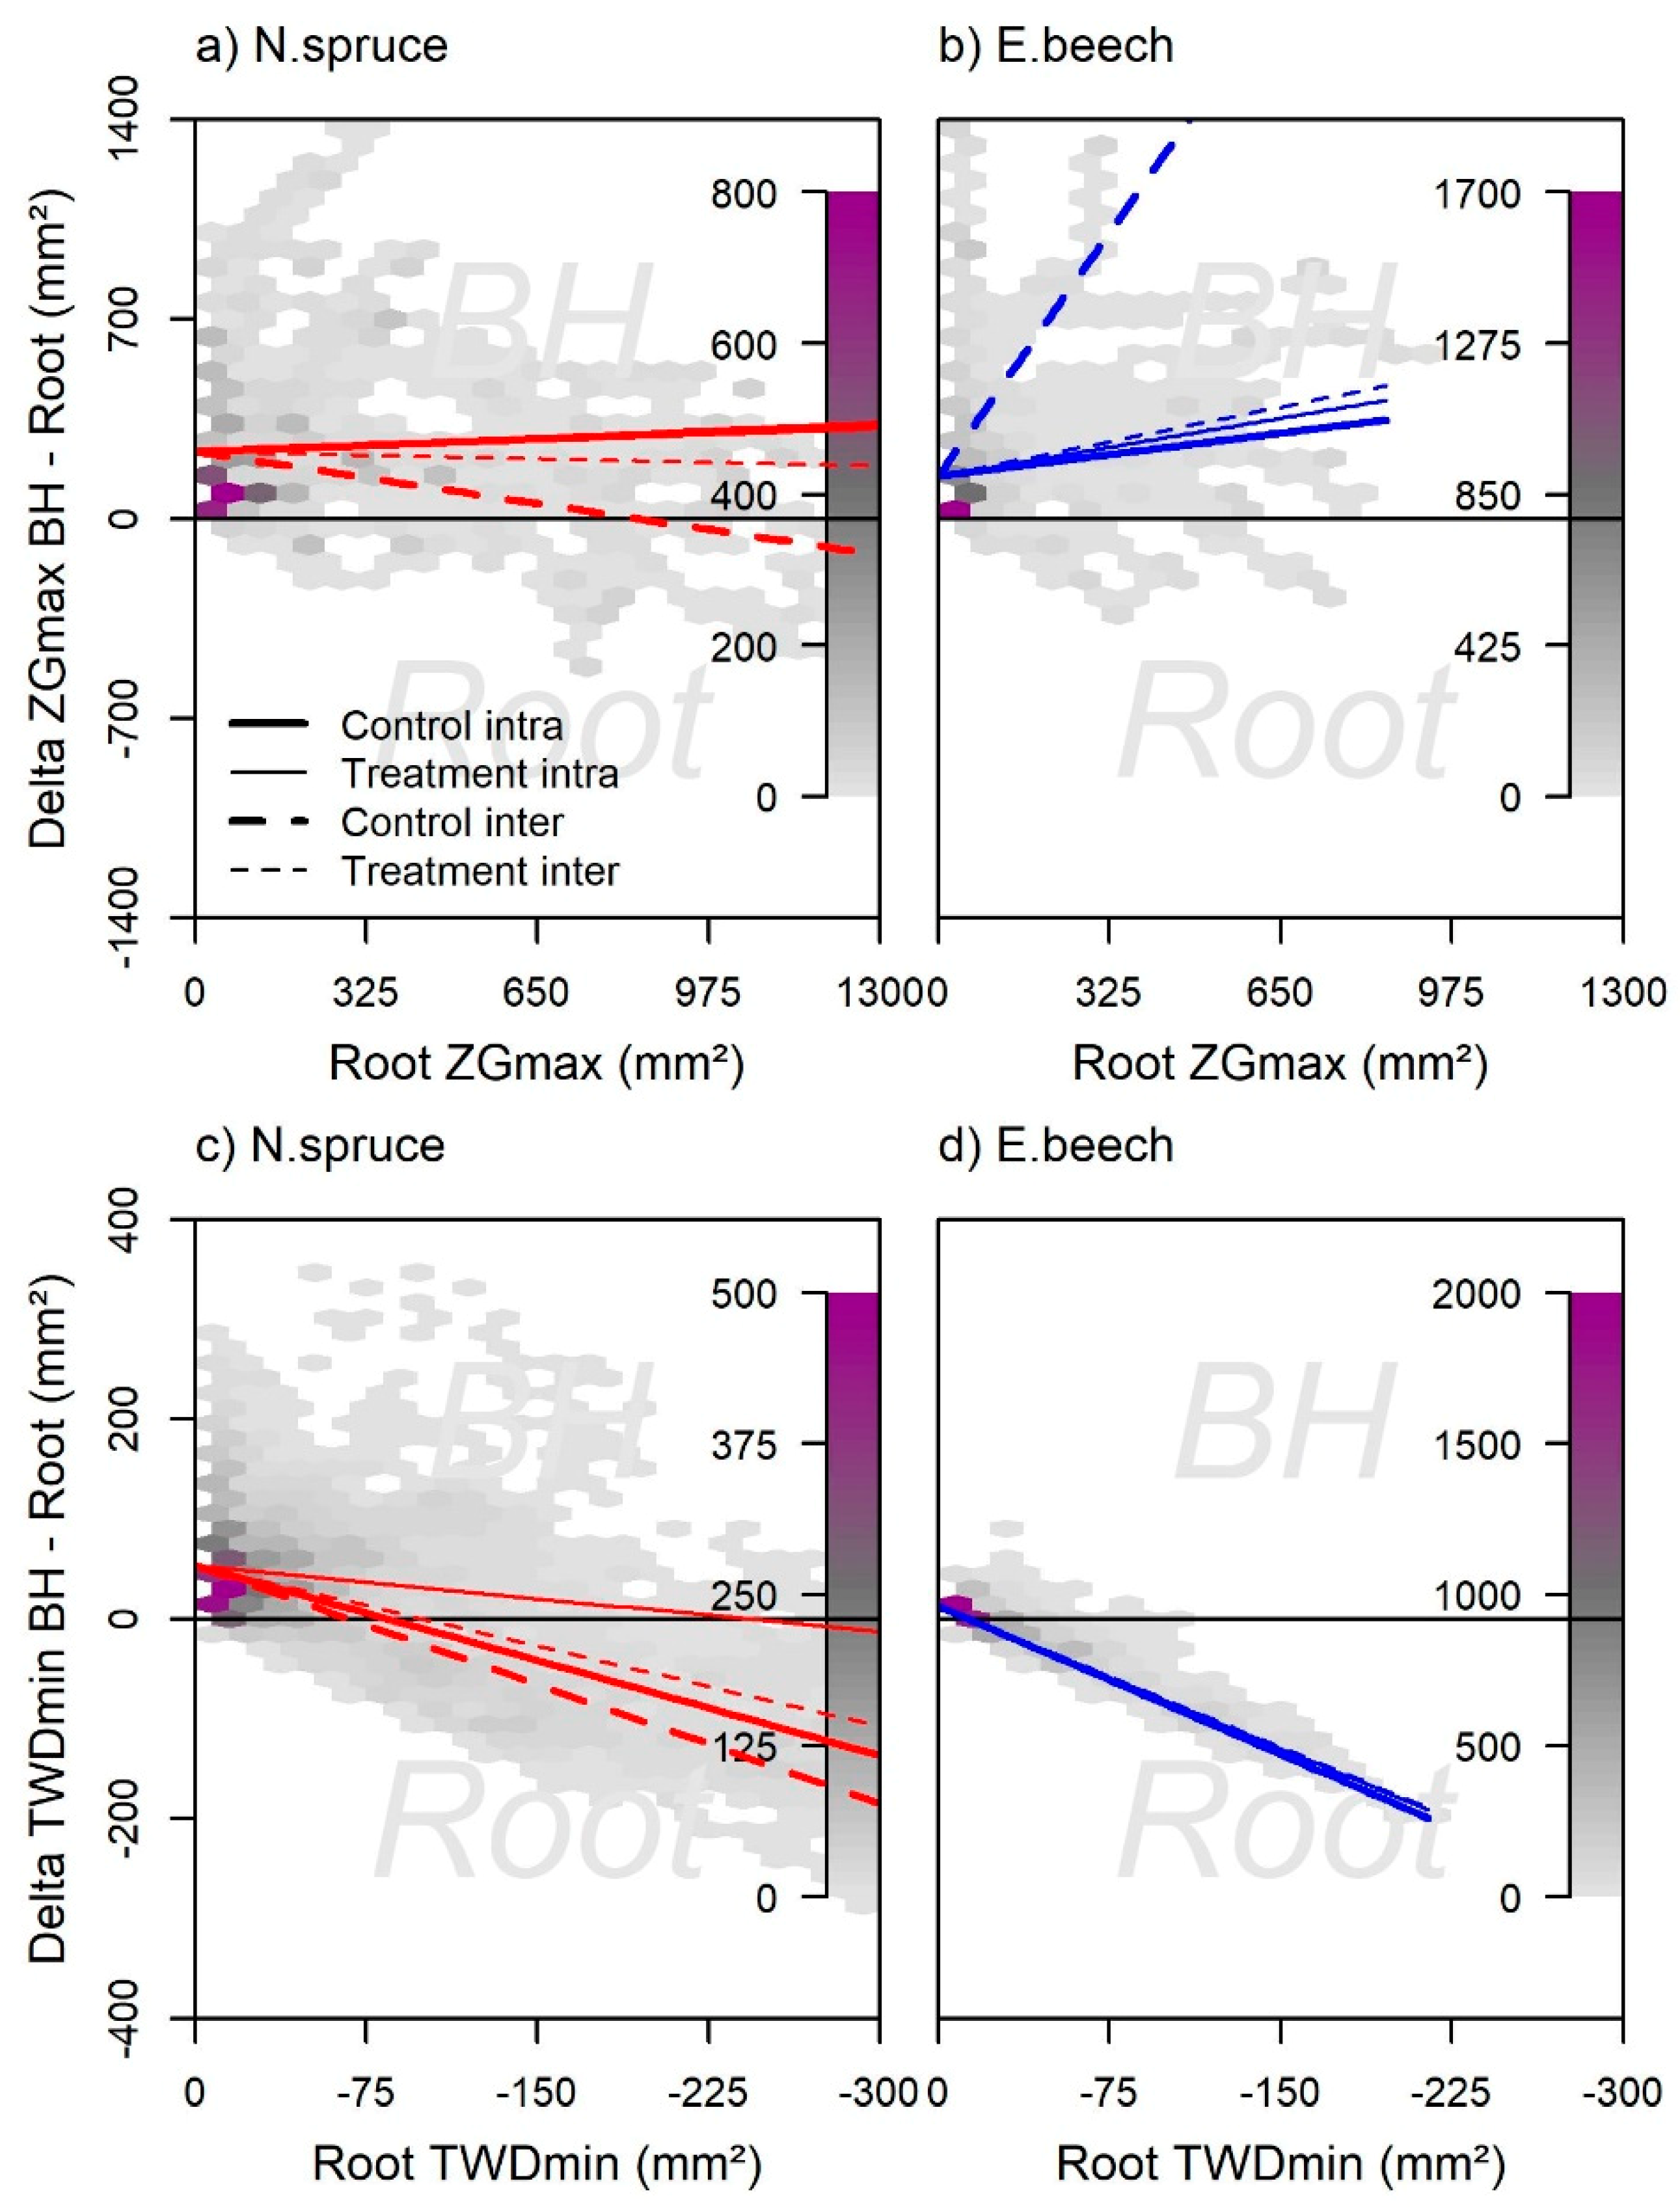
How the allocation was oriented under control or treatment and inter- or intraspecific neighborhoods is illustrated in Figure 5 and Figure 6. On the y-axis, the difference between BH and H50 or BH and the roots is given for the zero growth (panel above) or TWDmin (panel below). On the x-axis, the basal area growth or TWDmin of the respective lower tree compartment is given (BH, Figure 5 or roots, Figure 6). The x-axis of ZGmax is also a proxy for time within the growing period, while the x-axis of TWDmin is a proxy for increasing drought stress which was happening in the middle of the growing period. The significances of the respective linear mixed-effect models are summarized in Table 3.
The model quality can be check in the data provided in Supplementary Materials Figures S5–S12. All in all, the fitted linear regressions show good relationships between observed to predicted values (Figures S5–S12a,b). There was a strong overlapping within the data, especially close to the regression lines, which resulted in high model performances of the p-value and R2. We revealed the overlapping close to the regression lines by hexagon density plots (Figure 5 and Figure 6) and histograms of the residuals (see Supplementary Materials Figures S5–S12c). The model output was nearly normally distributed, which can be seen in the QQ-plots of the residuals (Figures S5–S12e). The deviation of the residuals from normal distribution was under 5%. Nevertheless, we checked these points very carefully to be sure that these outliers did come from measurement inconsistencies.
In general, the interaction of treatment and mixture with the lower tree compartment (x-axis) was significant, except for beech trees in some cases. The interpretation of the influence of treatment and mixture always refers to their dependency on the lower tree compartment. We subsequently looked at this interaction or rather the orientation and position of the control to treatment curves (or intra- to interspecific curves).
The x-axis showed an increasing basal area increment over time within the growing season. We found that the growth in BH was always higher, except for at the beginning of the growing season, where growth in H50 was higher. The tree appears to invest in the upper trunk (H50) at the beginning of the growing season and then more in the BH (Figure 5a,b, Table 3(a),(b)). In the following, we first describe the ZG of spruce, followed by that of beech, and then the TWD of both species.
Treated intraspecific spruce trees showed a tendency to grow more in H50 as interspecific spruces of the control plots (Figure 5a, Table 3). Beech trees at the control plots showed an increasing increment of the upper stem, whereas beeches of the treatment plots revealed a higher growth in BH than in H50 (Figure 5b, Table 3(b)). A tendency of a higher TWD in H50 could be found for spruces in interspecific neighborhoods (control and treatment plots) compared to the intraspecific spruces (Figure 5c, Table 3(c)). The same pattern could be observed for beech trees (Figure 5d, Table 3(d)).
Overall, spruce trees showed a higher root growth than beech trees. Spruces in interspecific neighborhoods showed a higher tendency to root growth than in intraspecific neighborhoods (Figure 6a, Table 3(e)). In contrast, beech tress in intraspecific neighborhoods had a higher increment in the roots than in BH compared to beeches in interspecific neighborhood (Figure 6b, Table 3(f)). The TWD was higher in the roots for both species. Spruce trees of the treatment plots and in intraspecific neighborhoods had the highest TWD in the roots (Figure 6c, Table 3(g)). For beech trees in intra- and interspecific neighborhoods, no differences could be found (Figure 6d, Table 3(h)).

4. Discussion

4.1. Relationship between Tree Water Deficit and Leaf Water Potential

We found a strong relationship between TWDmin and LWP for both species at the three tree positions (H50, BH, roots). Furthermore, the high-resolution TWD measurements could show the differences between intra- and interspecific neighborhoods clearer compared to the LWP. The LWP showed no significant differences between intra- and interspecific spruce and beech trees, but the effect of the drought treatment could be shown compared to the trees of the control plots. Spruce trees, as a more drought sensible tree species, showed the expected higher LWP compared to the more drought resistant beech trees.
We found the best match for TWDmin and LWPpre, but the relationship between TWDmin and LWPmid was also significant. The study of Remorini and Massai (2003) [60] confirmed that the LWPpre is a better tree water status indicator than LWPmid.
Early dendrometer studies, such as Cohen et al. (2001) [61], focused on the maximum daily shrinkage and compared the data with the water potential at midday and predawn. The Cohen study shows the link between maximum daily stem shrinkage (MDS) and predawn and midday LWP. The MDS was closely related to the predawn and midday water potential, similar to the present study. A more recent study by Dietrich et al. (2018) [15] showed the relationship between TWD and LWP of different tree species, which included Norway spruce and European beech. It was illustrated that the daily TWD displayed the tree water status better than the maximum daily shrinkage, in which the stem water signal was not separated from the growth signal. Particularly under dry conditions, the TWD was a consistent proxy for the tree water status of tall trees.
The temporal and spatial patterns of stem radius variations of Norway spruces were determined in Zweifel and Häsler (2001) [62]. As in the present study, they found similar but not identical dynamics of stem and root radius fluctuations at different heights (along the stem at 6, 10, 14, 18 m above ground and on roots). There were differences in the heights of the curves (amplitudes) at different tree heights and there was a time lag between the tree compartments. In the present study, the time offset was not investigated and could be an option for further investigations.
Similar to our study, Zweifel and Häsler (2001) [62] found the greatest fluctuations in the upper stem part, within the crown, due to the proximity to the tree crown and thus transpiration [63], next to the roots which also showed high radius fluctuations as in the present study. High root basal area variations could be caused by a high aridity, as in the drought experiment and the very dry year 2015. Hinckley et al. (1978) [64] stated that the water potential differences between the crown and the soil increases the water movement within the tree, and thus, increases the water movement from the internal stored water in the bark. The water storages near the crown can be reached faster than water storages from the soil due to the more negative leaf water potential than the root water potential. Thus, diurnal water potential fluctuations are larger in the branches than the roots, leading to larger daily shrinkage in the branches.
In the present study, the relationship between TWD and LWP could be illustrated at the stem (at H50, BH) and at the roots. This is in line with the first hypothesis that the stem basal area variations and the leaf water potential show a positive relationship at the different tree heights.

4.2. Root and Stem Growth and TWDmin in Different Tree Heights

The applied method—the difference between upper and lower tree compartments in relation to the lower tree compartment—led to a visible deviation of the measured TWDmin and ZGmax at the different tree compartments. We are aware that the results have to be interpreted with caution due to the included variation. Nevertheless, the applied models considering the offset of the individual trees showed significant relationships. Within our approach, we followed the principle of parsimony, with linear relationships and as few parameters as possible. Also, the R2 and the RMSE provided evidence for a high model explanatory power. The QQ-plots showed us that there were only a few outliers and we checked them carefully to avoid any inconsistencies in our measurements.
We found that the trees invested more in the basal area growth of the upper stem (H50) at the beginning of the growing season. Later in the season, growth investment shifted increasingly to the lower stem (BH). An explanation for this might be the theory of the seasonal distribution of the growth hormone auxin. In spring, it is produced in the apical meristem and transported down to the stem in the phloem of the tree [65,66]. In this way, the strength of radial growth shifts from the top to stem base. During the growing period, the growth of spruce and beech trees were favored in BH than in H50. Beech trees at the control plots showed a tendency of a higher growth in H50 than in BH compared to trees of the drought treatment.
We also found that TWDmin was higher in the upper stem (H50) than in the lower stem (BH), but with an increasing stem shrinkage, the shrinkage in BH was higher. The dendrometer position at H50 was near the crown and more water reserves could be used for transpiration [63]. With increasing water stress, the water storage pools in H50 are possibly exhausted and more water reserves of the storage pool in BH are used. This could be related to the higher diameter growth at BH compared to H50 due to the lesser shrinkage and accordingly higher cell turgor which is important for cell expansion. Zweifel et al. (2016) [51] stated that periods of stem shrinkage allow for very little growth. In addition, Van der Maaten–Theunissen and Bouriaud (2012) [67] revealed a reduced growth of Norway spruce at all stem heights during summer drought in southwestern Germany with the greatest reduction in growth at breast height.
For beech trees, the diameter increments were higher at BH. Despite this, the TWDmin was also higher at BH than at H50. Overall, the TWD was less pronounced for beech trees than for spruce trees. This could be also observed at the LWP and this could be due to the higher resistance of beech trees to drought [14,42]. Beech trees have an anisohydric character and continue growing and transpiring under dry conditions in contrast to spruce trees. Furthermore, spruce and beech trees have different rooting systems [43]. Beech trees have a deeper rooting system than spruce trees and can reach water from deeper soil horizons, which may reduce the use of water from the storage tissue. Spruce trees as an isohydric tree species respond with a reduced stomatal conductance under drought stress, and thus reduced transpiration, which in turn reduces growth [29,68].
Furthermore, spruce and beech trees revealed a higher growth at BH than at the roots and a higher TWDmin in the roots. The roots are affected by drought conditions through the lack of soil water supply and more water from the storage tissue in the roots could be used to maintain the transpiration process. In addition, the growth differences shifted more to the roots for beech in intraspecific neighborhoods and for spruce trees in interspecific neighborhoods. More root growth could imply more water stress, which is explained in McCarthy and Enquist (2007) [31] and Ledo et al. (2018) [69]. The resource supply of plants is determined by the shape of the rooting system, the shape of the tree crown, site conditions, and proximity to other trees [39,70,71,72]. Depending on the prevailing conditions, biomass is allocated differently in the compartments of the tree (crown, stem, and root). The optimal partitioning theory of McCarthy and Enquist (2007) [31] indicates that a limited resource leads to a promotion of growth of the plant organ that receives this resource (roots). Our findings about the allometric relationships for growth—endorsed by the TWDmin results—support optimal partitioning theory and are consistent with the findings of other studies [73,74,75].
In contrast, Schall et al. (2012) [76] found a significant increase of the percentage of belowground compartments for beech seedlings but not for spruce seedlings. When considering the TWDmin of beech trees, no significant differences between control and drought treatment were obvious. Thus, the second hypothesis that the relationship between growth response and the respective TWD is the same at the three different positions H50, BH, and root could be confirmed for spruce trees and for beech trees at the BH–root consideration. Spruces showed a higher growth in BH with a shift to root growth with increasing increment and time at the control and treatment plots and the TWD was respectively higher in the roots.

4.3. Differences in Intra- and Interspecific Neighborhoods

Many studies have pointed out that species mixture can have positive effects on the biodiversity [77], productivity [78], and soil fertility [79] of the whole system and that these effects depend on which species are mixed. Spruce and beech trees have different physiological and morphological traits [43,80]. Pretzsch (2014) [80] stated that plasticity in crown and root architecture appears to be the key to understanding effects of mixed system productivity.
Our investigations showed differences in inter- and intraspecific neighborhoods under drought conditions when considering TWDmin and the root growth. For spruce trees, the stem basal area growth (H50–BH) at BH was highest in intraspecific neighborhood at the control plots. The TWDmin showed a similar pattern and was highest in intraspecific neighborhood at BH. The BH–root comparison indicated a higher growth in BH for spruces in intraspecific neighborhoods compared to the interspecific neighborhoods. The TWD of spruces was in interspecific neighborhoods lesser than in intraspecific neighborhoods at the control and treatment plots at the roots. An explanation for this pattern could be that the growth is influenced by several factors (e.g., soil characteristics, nutrient supply, light) in addition to water availability [33,81]. The TWDmin reflects the water status of the tree. Therefore, spruces are facilitated in an interspecific neighborhood in terms of the tree water status under increasing drought, but not for stem radius growth. Nevertheless, the stem radius growth could be influenced under extreme drought conditions due to the higher TWDmin. A lesser TWDmin in the roots supported growth and offers the opportunity to reach more water resources in deeper soil horizons. Spruce trees, with their mainly shallow rooting systems and only few sinker roots have limited access to deeper soil water resources. Therefore, spruces use more water reserves from the storage tissue within one day. In addition, Bolte and Villanueva (2006) [43] found that beech trees in a neighborhood with spruce trees rooted in deeper soil horizons than in intraspecific neighborhood. That can be a reason for the higher growth of beeches in interspecific neighborhoods in BH than in the roots compared to the intraspecific neighborhoods. Spruce trees may benefit from this favorable characteristic through the effect of hydraulic lift [82,83,84]. Hydraulic lift is the passive movement of water from moist to dry soil horizons by plant root systems. Usually at night when transpiration has ceased, water is released from the roots into the upper soil horizon [82]. Beech trees can redistribute water from deeper to shallower soil horizons with their rooting systems. The reallocated water in the dryer soil layers can be used by beech trees as well as by the surrounding spruce trees [83]. This could be an explanation for the lower TWD of spruce trees in the interspecific neighborhood compared to spruces in the intraspecific neighborhood.
In contrast, the effect of drought treatment and control on the TWD of beeches was not significant. In several studies, positive reactions of mixed beech trees have been detected [39,43,85], but we did not find this positive interaction.
Thus, the third hypothesis that an interspecific neighborhood with beech trees facilitates spruce trees under drought stress could be confirmed for the water status of spruce trees, but not for the radius growth.

5. Conclusions

The present study is one of the first to investigate changing growth at different tree compartments within a single year and with the help of TWDmin and ZGmax.
We found a relationship between the TWDmin and leaf water potentials at the three investigated tree compartments for spruce and beech. This confirms that dendrometer measurements are a good tool for drought stress analyses at different tree compartments. The dendrometer measurements were much easier to handle than the water potential measurements and they were able to provide water status information within a timely and high-resolution manner throughout the whole year. However, the relationship between TWDmin and leaf water potentials included a deviation. Additional measurements, like phloem thickness, might improve the understanding of the relationship among both parameters.
With our investigation of growth and TWDmin in 2014 and 2015, we showed the growth pattern and compared it with the TWDmin pattern. Nevertheless, several studies have shown that the biomass allocation of a plant changes across the life course. Therefore, it is important to extend the measurements and to also include a tree’s juvenile and senescence stages.
Surprisingly, for spruce trees we found that an interspecific neighborhood resulted in a higher root growth and a lesser TWD in the roots than in BH. Beech trees were less affected by drought and showed a higher growth in BH in an interspecific than in an interspecific neighborhood compared to the roots. The TWDmin could showed the effect of neighborhood better than the LWP measurements. The LWP measurements showed no significant differences in intra- and interspecific neighborhoods.
To answer the question of whether spruce benefited from the mixture with beech under drought conditions, we considered the TWDmin and concluded that the mixture of beech could reduce the drought stress for spruce under future climatic warming.

Supplementary Materials

The following are available online at https://www.mdpi.com/1999-4907/10/7/577/s1, Figure S1: Mean water potential at midday for the years 2014 (left) and 2015 (right) for spruce trees in intra- and interspecific neighborhoods at the control and treatment plots (a,b) and for beech trees in intra- and interspecific neighborhoods at the control and treatment plots (c,d). Data is shown for the growing season, Figure S2: Mean predawn water potential for the years 2014 (left) and 2015 (right) for spruce trees in intra- and interspecific neighborhoods at the control and treatment plots (a,b) and for beech trees in intra- and interspecific neighborhoods at the control and treatment plots (c,d). Data is shown for the growing season, Figure S3: Mean predawn water potential for the years 2014 and 2015 for spruce trees in intra- and interspecific neighborhoods at the control and treatment plots (a) and for beech trees in intra- and interspecific neighborhoods at the control and treatment plots (b). Data is shown for the growing season, Figure S4: Mean TWDmin and zero growth (growth without the water signal) referring to the stem/root basal area (mm²) for the years 2014 (left) and 2015 (right) for spruce (red) and beech (blue) in intraspecific (solid line) and interspecific (dashed line) neighborhoods at 50% tree height (a–d), breast height (BH, e–h) and the roots (i–l). Shaded regions are conficence intervals. Data are shown for the growing season, Figure S5: N. spruce ZG H50-BH. Model critism plots for the linear mixed effect models in Table 3 and Figure 5 and Figure 6. The models critism plots are in the same order. Description of the single plots within each Figure: (a) plot of the outermost fitted values against the observed values of the response variable; (b) plot of the innermost fitted values against the innermost Pearson residuals; (c) histogram of the innermost residuals; (d) QQ-plot of the estimated random effects; (e) QQ-plot of the Pearson residual; (f) notched boxplot of the innermost Pearson residuals by the grouping variables plot:indivudal tree:year; (g) scatterplot of the variance of the Pearson residuals within the grouping variables, Figure S6: E. beech ZG H50-BH, Figure S7: N. spruce TWD H50-BH, Figure S8: E. beech TWD H50-BH, Figure S9: N. spruce ZG BH-Root, Figure S10: E. beech ZG BH-Root, Figure S11: N. spruce TWD BH-Root, Figure S12: E. beech TWD BH-Root. Table S1: Characteristics of the individual spruce (n = 24) and beech trees (n = 24), seperated by plot (n = 12, overall 48 trees), drought treatment (6 plots, 24 trees)/control (6 plots, 24 trees) and intra- and interspecific neighborhoods (six control plots and six treatment plots with respectively six intraspecific beech trees; six interspecific beech trees; six intraspecific spruce trees; six interspecific spruce trees) for the year 2014 (DBH: diameter at 1.3 m breast height), Table S2: Coefficient of determination (R2) of TWDmin (tree water deficit, daily minimum), LWPpre (water potential at predawn) and of TWDmax (tree water deficit, daily maximum) and LWPmid (water potential at midday). The R2 based on the relationship between leaf water potential (LWP) and tree water deficit (TWD) at the three different tree heights (H50, BH, Root). The respective models based on Equation (1). The last two rows contain the means of both species and of all tree heights, Table S3: Parameter estimates and statistics for the water potential at midday and predawn dependent on species and drought treatment. Standard deviations are in brackets. The dependent variables are in the columns. Rows show the output of the model with the fixed variables. Significance levels: ***, p < 0.001; **, 0.01; *, 0.05; (*), 0.1.

Author Contributions

Conceptualization, H.P., T.R. and C.S.; Methodology, C.S., E.A.T., T.R. and H.P.; Software, C.S. and E.A.T.; Validation, C.S., E.A.T., T.R., P.B., C.K., and H.P.; Formal Analysis, C.S., E.A.T.; Investigation, C.S. and C.K.; Resources, C.S. and C.K.; Data Curation, C.S.; Writing—Original Draft Preparation, C.S.; Writing—Review and Editing, C.S., E.A.T., T.R., P.B. and H.P.; Visualization, C.S.; Supervision, H.P. and T.R.; Project Administration, H.P. and T.R.; Funding Acquisition, H.P. and T.R.

Funding

This research was funded by the German Science Foundation (Deutsche Forschungsgemeinschaft), grant number PR 292/12-1, MA 1763/7-1, MU 831/23-1 “Tree and stand-level growth reactions on drought in mixed versus pure forests of Norway spruce and European beech”, the Bavarian State Ministry for Nutrition, Agriculture and Forestry, and the Bavarian State Ministry for Environment and Consumer Protection.

Acknowledgments

We thank the German Science Foundation (Deutsche Forschungsgemeinschaft) for providing the funds for the projects PR 292/12-1, MA 1763/7-1, and MU 831/23-1 “Tree and stand-level growth reactions on drought in mixed versus pure forests of Norway spruce and European beech”. Recognition is given to the Bavarian State Ministry for Nutrition, Agriculture and Forestry and to the Bavarian State Ministry for Environment and Consumer Protection for their generous support of the roof buildings. Special thanks go to the KROOF-Team for the great work in the field.

Conflicts of Interest

The authors declare no conflict of interest.

References

  1. IPCC. Climate Change 2013: The Physical Basis. Contribution of Working Group I to the Fifth Assessment Report of the IPCC; Cambrige University Press: Cambridge, UK, 2013; ISBN 978-1-107-66182-0. [Google Scholar]
  2. Meehl, G.A.; Tebaldi, C. More intense, more frequent, and longer lasting heat waves in the 21st century. Science 2004, 305, 994–997. [Google Scholar] [CrossRef] [PubMed]
  3. Fuhrer, J.; Beniston, M.; Fischlin, A.; Frei, C.; Goyette, S.; Jasper, K.; Pfister, C. Climate risks and their impact on agriculture and forests in Switzerland. In Climate Variability, Predictability and Climate Risks: A European Perspecive; Wanner, H., Grosjean, M., Rastlisberg, R., Xoplaki, E., Eds.; Springer Netherlands: Dordrecht, The Netherlands, 2006; pp. 79–102. ISBN 978-1-4020-5713-7. [Google Scholar]
  4. Allen, C.D.; Macalady, A.K.; Chenchouni, H.; Bachelet, D.; McDowell, N.; Vennetier, M.; Kitzberger, T.; Rigling, A.; Breshears, D.D.; Hogg, E.H.; et al. A global overview of drought and heat-induced tree mortality reveals emerging climate change risks for forests. For. Ecol. Manag. 2010, 259, 660–684. [Google Scholar] [CrossRef] [Green Version]
  5. Rötzer, T.; Liao, Y.; Goergen, K.; Schüler, G.; Pretzsch, H. Modelling the impact of climate change on the productivity and water-use efficiency of a central European beech forest. Clim. Res. 2013, 58, 81–95. [Google Scholar] [CrossRef]
  6. Ciais, P.; Reichstein, M.; Viovy, N.; Granier, A.; Ogée, J.; Allard, V.; Aubinet, M.; Buchmann, N.; Bernhofer, C.; Carrara, A.; et al. Europe-wide reduction in primary productivity caused by the heat and drought in 2003. Nature 2005, 437, 529–533. [Google Scholar] [CrossRef] [PubMed]
  7. Dieler, J.; Pretzsch, H. Morphological plasticity of European beech (Fagus sylvatica L.) in pure and mixed-species stands. For. Ecol. Manag. 2013, 295, 97–108. [Google Scholar] [CrossRef]
  8. Chapin, F.S. The Mineral Nutrition of Wild Plants. Annu. Rev. Ecol. Syst. 1980, 11, 233–260. [Google Scholar] [CrossRef]
  9. Thornley, J.H.M. A balanced quantitative model for root: Shoot ratios in vegetative plants. Ann. Bot. 1972, 36, 431–441. [Google Scholar] [CrossRef]
  10. Poorter, H.; Niklas, K.J.; Reich, P.B.; Oleksyn, J.; Poot, P.; Mommer, L. Biomass allocation to leaves, stems and roots: Meta-analyses of interspecific variation and environmental control. New Phytol. 2012, 193, 30–50. [Google Scholar] [CrossRef]
  11. Rötzer, T.; Seifert, T.; Pretzsch, H. Modelling above and below ground carbon dynamics in a mixed beech and spruce stand influenced by climate. Eur. J. Res. 2009, 128, 171–182. [Google Scholar] [CrossRef]
  12. Zweifel, R.; Item, H.; Häsler, R. Link between diurnal stem radius changes and tree water relations. Tree Physiol. 2001, 2, 869–877. [Google Scholar] [CrossRef]
  13. Steppe, K.; De Pauw, D.J.W.; Lemeur, R.; Vanrolleghem, P.A. A mathematical model linking tree sap flow dynamics to daily stem diameter fluctuations and radial stem growth. Tree Physiol. 2006, 26, 257–273. [Google Scholar] [CrossRef] [PubMed] [Green Version]
  14. Brinkmann, N.; Eugster, W.; Zweifel, R.; Buchmann, N.; Kahmen, A. Temperate tree species show identical response in tree water deficit but different sensitivities in sap flow to summer soil drying. Tree Physiol. 2016, 36, 1508–1519. [Google Scholar] [CrossRef] [PubMed] [Green Version]
  15. Dietrich, L.; Zweifel, R.; Kahmen, A. Daily stem diameter variations can predict the canopy water status of mature temperate trees. Tree Physiol. 2018. [Google Scholar] [CrossRef] [PubMed]
  16. Ortuño, M.F.; García-Orellana, Y.; Conejero, W.; Ruiz-Sánchez, M.C.; Mounzer, O.; Alarcón, J.J.; Torrecillas, A. Relationships between Climatic Variables and Sap Flow, Stem Water Potential and Maximum Daily Trunk Shrinkage in Lemon Trees. Plant. Soil 2006, 279, 229–242. [Google Scholar] [CrossRef]
  17. Zweifel, R.; Item, H.; Häsler, R. Stem radius changes and their relation to stored water in stems of young Norway spruce trees. Trees 2000, 15, 50–57. [Google Scholar] [CrossRef] [Green Version]
  18. Zweifel, R.; Zimmermann, L.; Newbery, D.M. Modeling tree water deficit from microclimate: An approach to quantifying drought stress. Tree Physiol. 2005, 25, 147–156. [Google Scholar] [CrossRef] [PubMed]
  19. Ortuño, M.F.; Conejero, W.; Moreno, F.; Moriana, A.; Intrigliolo, D.S.; Biel, C.; Mellisho, C.D.; Pérez-Pastor, A.; Domingo, R.; Ruiz-Sánchez, M.C.; et al. Could trunk diameter sensors be used in woody crops for irrigation scheduling? A review of current knowledge and future perspectives. Agric. Water Manag. 2010, 97, 1–11. [Google Scholar] [CrossRef]
  20. Daudet, F.-A.; Ameglio, T.; Cochard, H.; Archilla, O.; Lacointe, A. Experimental analysis of the role of water and carbon in tree stem diameter variations. J. Exp. Bot. 2005, 56, 135–144. [Google Scholar] [CrossRef]
  21. Vieira, J.; Rossi, S.; Campelo, F.; Freitas, H.; Nabais, C. Seasonal and daily cycles of stem radial variation of Pinus pinaster in a drought-prone environment. Agric. For. Meteorol. 2013, 180, 173–181. [Google Scholar] [CrossRef] [Green Version]
  22. Klepper, B.; Browning, V.D.; Taylor, H.M. Stem Diameter in Relation to Plant Water Status. Plant. Physiol. 1971, 48, 683–685. [Google Scholar] [CrossRef] [Green Version]
  23. Kozlowski, T.T. Water Deficits and Plant Growth. In Shrinking and Swelling of Plant Tissues; Kozlowski, T.T., Ed.; Academic Press: New York, NY, USA, 1976; pp. 1–64. [Google Scholar]
  24. Zweifel, R.; Zimmermann, L.; Zeugin, F.; Newbery, D.M. Intra-annual radial growth and water relations of trees: Implications towards a growth mechanism. J. Exp. Bot. 2006, 57, 1445–1459. [Google Scholar] [CrossRef] [PubMed]
  25. De Schepper, V.; Steppe, K. Development and verification of a water and sugar transport model using measured stem diameter variations. J. Exp. Bot. 2010, 61, 2083–2099. [Google Scholar] [CrossRef] [PubMed] [Green Version]
  26. De Swaef, T.; De Schepper, V.; Vandegehuchte, M.W.; Steppe, K. Stem diameter variations as a versatile research tool in ecophysiology. Tree Physiol. 2015, 35, 1047–1061. [Google Scholar] [CrossRef] [PubMed]
  27. Steppe, K.; Sterck, F.; Deslauriers, A. Diel growth dynamics in tree stems: Linking anatomy and ecophysiology. Trends Plant. Sci. 2015, 20, 335–343. [Google Scholar] [CrossRef] [PubMed]
  28. Irvine, J.; Grace, J. Continuous measurements of water tensions in the xylem of trees based on the elastic properties of wood. Planta 1997, 202, 455–461. [Google Scholar] [CrossRef]
  29. Klein, T. The variability of stomatal sensitivity to leaf water potential across tree species indicates a continuum between isohydric and anisohydric behaviours. Funct. Ecol. 2014, 28, 1313–1320. [Google Scholar] [CrossRef]
  30. Rais, A.; van de Kuilen, J.-W.G.; Pretzsch, H. Growth reaction patterns of tree height, diameter, and volume of Douglas-fir (Pseudotsuga menziesii [Mirb.] Franco) under acute drought stress in Southern Germany. Eur. J. Res. 2014, 133, 1043–1056. [Google Scholar] [CrossRef]
  31. McCarthy, M.C.; Enquist, B.J. Consistency between an allometric approach and optimal partitioning theory in global patterns of plant biomass allocation. Funct. Ecol. 2007, 21, 713–720. [Google Scholar] [CrossRef]
  32. Pretzsch, H. Diversity and Productivity in Forests: Evidence from Long-Term Experimental Plots. In Forest Diversity and Function: Temperate and Boreal Systems; Scherer-Lorenzen, M., Körner, C., Schulze, E.-D., Eds.; Springer: Berlin, Germany; New York, NY, USA, 2005; pp. 41–64. ISBN 3-540-22191-3. [Google Scholar]
  33. Forrester, D.I. The spatial and temporal dynamics of species interactions in mixed-species forests: From pattern to process. For. Ecol. Manag. 2014, 312, 282–292. [Google Scholar] [CrossRef]
  34. Rötzer, T. Mixing patterns of tree species and their effects on resource allocation and growth in forest stands. Nova Acta Leopold 2013, 114, 239–254. [Google Scholar]
  35. Mixed-Species Forests. Ecology and Management; Pretzsch, H.; Forrester, D.I.; Bauhus, J. (Eds.) Springer: Berlin, Germany, 2017; 653p. [Google Scholar]
  36. Wiedemann, E. Der gleichaltrige Fichten-Buchen-Mischbestand. Mitt. Aus Forstwirtsch. Forstwiss. 1942, 1, 1–88. [Google Scholar]
  37. Pretzsch, H.; Block, J.; Dieler, J.; Dong, P.H.; Kohnle, U.; Nagel, J.; Spellmann, H.; Zingg, A. Comparison between the productivity of pure and mixed stands of Norway spruce and European beech along an ecological gradient. Ann. For. Sci. 2010, 67, 712. [Google Scholar] [CrossRef]
  38. Pretzsch, H.; Rötzer, T.; Matyssek, R.; Grams, T.E.E.; Häberle, K.-H.; Pritsch, K.; Kerner, R.; Munch, J.-C. Mixed Norway spruce (Picea abies [L.] Karst) and European beech (Fagus sylvatica [L.]) stands under drought: From reaction pattern to mechanism. Trees 2014. [Google Scholar] [CrossRef]
  39. Metz, J.; Annighöfer, P.; Schall, P.; Zimmermann, J.; Kahl, T.; Schulze, E.-D.; Ammer, C. Site-adapted admixed tree species reduce drought susceptibility of mature European beech. Glob. Chang. Biol. 2016, 22, 903–920. [Google Scholar] [CrossRef] [PubMed]
  40. Zang, C.; Pretzsch, H.; Rothe, A. Size-dependent responses to summer drought in Scots pine, Norway spruce and common oak. Trees 2012, 26, 557–569. [Google Scholar] [CrossRef]
  41. Pretzsch, H.; Schütze, G.; Uhl, E. Resistance of European tree species to drought stress in mixed versus pure forests: Evidence of stress release by inter-specific facilitation. Plant. Biol. 2013, 15, 483–495. [Google Scholar] [CrossRef] [PubMed]
  42. Ammer, C.; Bickel, E.; Kolling, C. Converting Norway spruce stands with beech—A review of arguments and techniques. Austrian J. For. Sci. 2008, 125, 3–26. [Google Scholar]
  43. Bolte, A.; Villanueva, I. Interspecific competition impacts on the morphology and distribution of fine roots in European beech (Fagus sylvatica L.) and Norway spruce (Picea abies (L.) Karst.). Eur. J. For. Res. 2006, 125, 15–26. [Google Scholar] [CrossRef]
  44. Schume, H.; Jost, G.; Hager, H. Soil water depletion and recharge patterns in mixed and pure forest stands of European beech and Norway spruce. J. Hydrol. 2004, 289, 258–274. [Google Scholar] [CrossRef]
  45. Cremer, M.; Prietzel, J. Die Mutter des Waldes und die Fremde: Douglasien-Buchen-Mischbestände: Aus bodenkundlicher Sicht eine attraktive Mischungsoption. LWF Aktuell 2017, 2, 24–25. [Google Scholar]
  46. Rötzer, T.; Häberle, K.H.; Kallenbach, C.; Matyssek, R.; Schütze, G.; Pretzsch, H. Tree species and size drive water consumption of beech/spruce forests—A simulation study highlighting growth under water limitation. Plant. Soil 2017, 183, 327. [Google Scholar] [CrossRef]
  47. Pretzsch, H.; Dieler, J.; Seifert, T.; Rötzer, T. Climate effects on productivity and resource-use efficiency of Norway spruce (Picea abies [L.] Karst.) and European beech (Fagus sylvatica [L.]) in stands with different spatial mixing patterns. Trees 2012, 26, 1343–1360. [Google Scholar] [CrossRef]
  48. Brodrick, P.G.; Anderegg, L.D.L.; Asner, G.P. Forest Drought Resistance at Large Geographic Scales. Geophys. Res. Lett. 2019, 46, 2752–2760. [Google Scholar] [CrossRef] [Green Version]
  49. Rosas, T.; Mencuccini, M.; Barba, J.; Cochard, H.; Saura-Mas, S.; Martínez-Vilalta, J. Adjustments and coordination of hydraulic, leaf and stem traits along a water availability gradient. New Phytol. 2019, 223, 632–646. [Google Scholar] [CrossRef] [PubMed]
  50. Konings, A.G.; Gentine, P. Global variations in ecosystem-scale isohydricity. Glob. Chang. Biol. 2017, 23, 891–905. [Google Scholar] [CrossRef] [PubMed]
  51. Zweifel, R.; Haeni, M.; Buchmann, N.; Eugster, W. Are trees able to grow in periods of stem shrinkage? New Phytol. 2016, 211, 839–849. [Google Scholar] [CrossRef] [PubMed] [Green Version]
  52. Pretzsch, H.; Bauerle, T.; Häberle, K.H.; Matyssek, R.; Schütze, G.; Rötzer, T. Tree diameter growth after root trenching in a mature mixed stand of Norway spruce (Picea abies [L.] Karst) and European beech (Fagus sylvatica [L.]). Trees 2016, 30, 1761–1773. [Google Scholar] [CrossRef]
  53. Hera, U.; Roetzer, T.; Zimmermann, L.; Schulz, C.; Maier, H.; Weber, H.; Kölling, C. Klima en detail—Neue hochaufgelöste Klimakarten zur klimatischen Regionalisierung Bayerns. LWF Aktuell 2011, 86, 34–37. [Google Scholar]
  54. Biondi, F.; Qeadan, F. A Theory-Driven Approach to Tree-Ring Standardization: Defining the Biological Trend from Expected Basal Area Increment. Tree-Ring Res. 2008, 64, 81–96. [Google Scholar] [CrossRef]
  55. Bavarian State Institute of Forestry (LWF). Bavarian Forest Ecosystem Monitoring Plot Freising (WKS). Meteorological Data; Bavarian State Institute of Forestry (LWF): Freising, Germany, 2016. [Google Scholar]
  56. Bates, D.; Maechler, M.; Bolker, B.; Walker, S. Fitting Linear Mixed-Effects Models Using lme4. J. Stat. Softw. 2015, 67, 1–48. [Google Scholar] [CrossRef]
  57. Kuznetsova, A.; Brockhoff, P.B.; Christensen, R.H.B. lmerTest: Tests in Linear Mixed Effects Models. R Package Version 2.0-29. J. Stat. Softw. 2017, 82, 1–26. [Google Scholar] [CrossRef]
  58. R Core Team. R: A Language and Environment for Statistical Computing; R Foundation for Statistical Computing: Vienna, Austria, 2017. [Google Scholar]
  59. Bavarian State Institute of Forestry (LWF). Umweltmonitoring. Available online: www.lwf.bayern.de/boden-klima/umweltmonitoring (accessed on 10 July 2016).
  60. Remorini, D.; Massai, R. Comparison of water status indicators for young peach trees. Irrig. Sci. 2003, 39–46. [Google Scholar] [CrossRef]
  61. Cohen, M.; Goldhamer, D.A.; Fereres, E.; Girona, J.; Mata, M. Assessment of peach tree responses to irrigation water ficits by continuous monitoring of trunk diameter changes. J. Hortic. Sci. Biotechnol. 2001, 76, 55–60. [Google Scholar] [CrossRef]
  62. Zweifel, R.; Häsler, R. Dynamics of water storage in mature subalpine Picea abies: Temporal and spatial patterns of change in stem radius. Tree Physiol. 2001, 21, 561–569. [Google Scholar] [CrossRef] [PubMed]
  63. Xylem Structure and the Ascent of Sap, 2nd ed.; Tyree, M.T.; Zimmermann, M.H. (Eds.) Springer: Berlin, Germany; London, UK, 2011; ISBN 978-3-642-07768-5. [Google Scholar]
  64. Hinckley, T.M.; Lassoie, J.P.; Running, S.W. Temporal and Spatial Variations in the Water Status of Forest Trees. For. Sci Monogr. 1978, 20, 1–72. [Google Scholar]
  65. Kozlowski, T.T. Tree Growth; Ronald Press: New York, NY, USA, 1962. [Google Scholar]
  66. Speer, J.H. Fundamentals of Tree-Ring Research; The University of Arizona Press: Tucson, AZ, USA, 2013; ISBN 0816526850. [Google Scholar]
  67. Van der Maaten-Theunissen, M.; Bouriaud, O. Climate–growth relationships at different stem heights in silver fir and Norway spruce. Can. J. Res. 2012, 42, 958–969. [Google Scholar] [CrossRef]
  68. McDowell, N.; Pockman, W.T.; Allen, C.D.; Breshears, D.D.; Cobb, N.; Kolb, T.; Plaut, J.; Sperry, J.; West, A.; Williams, D.G.; et al. Mechanisms of plant survival and mortality during drought: Why do some plants survive while others succumb to drought? New Phytol. 2008, 178, 719–739. [Google Scholar] [CrossRef]
  69. Ledo, A.; Paul, K.I.; Burslem, D.F.R.P.; Ewel, J.J.; Barton, C.; Battaglia, M.; Brooksbank, K.; Carter, J.; Eid, T.H.; England, J.R.; et al. Tree size and climatic water deficit control root to shoot ratio in individual trees globally. New Phytol. 2018, 217, 8–11. [Google Scholar] [CrossRef]
  70. Bayer, D.; Seifert, S.; Pretzsch, H. Structural crown properties of Norway spruce (Picea abies [L.] Karst.) and European beech (Fagus sylvatica [L.]) in mixed versus pure stands revealed by terrestrial laser scanning. Trees 2013, 27, 1035–1047. [Google Scholar] [CrossRef]
  71. Nickel, U.T.; Weikl, F.; Kerner, R.; Schäfer, C.; Kallenbach, C.; Munch, J.C.; Pritsch, K. Quantitative losses vs. qualitative stability of ectomycorrhizal community responses to 3 years of experimental summer drought in a beech-spruce forest. Glob. Chang. Biol. 2017. [Google Scholar] [CrossRef]
  72. Kelty, M.J. The role of species mixtures in plantation forestry. For. Ecol. Manag. 2006, 233, 195–204. [Google Scholar] [CrossRef]
  73. Thurm, E.A.; Biber, P.; Pretzsch, H. Stem growth is favored at expenses of root growth in mixed stands and humid conditions for Douglas-fir (Pseudotsuga menziesii) and European beech (Fagus sylvatica). Trees 2016. [Google Scholar] [CrossRef]
  74. McConnaughay, K.D.M.; Coleman, J.S. Biomass allocation in plants: Ontogeny or optimality? A test along three resource gradients. Ecology 1999, 80, 2581–2593. [Google Scholar] [CrossRef]
  75. Nikolova, P.S.; Zang, C.; Pretzsch, H. Combining tree-ring analyses on stems and coarse roots to study the growth dynamics of forest trees: A case study on Norway spruce (Picea abies [L.] H. Karst). Trees 2011, 25, 859–872. [Google Scholar] [CrossRef]
  76. Schall, P.; Lödige, C.; Beck, M.; Ammer, C. Biomass allocation to roots and shoots is more sensitive to shade and drought in European beech than in Norway spruce seedlings. For. Ecol. Manag. 2012, 266, 246–253. [Google Scholar] [CrossRef]
  77. Paillet, Y.; Bergès, L.; Hjältén, J.; Odor, P.; Avon, C.; Bernhardt-Römermann, M.; Bijlsma, R.-J.; de Bruyn, L.; Fuhr, M.; Grandin, U.; et al. Biodiversity differences between managed and unmanaged forests: Meta-analysis of species richness in Europe. Conserv. Biol. 2010, 24, 101–112. [Google Scholar] [CrossRef] [PubMed]
  78. Morin, X.; Fahse, L.; Scherer-Lorenzen, M.; Bugmann, H. Tree species richness promotes productivity in temperate forests through strong complementarity between species. Ecol. Lett. 2011, 14, 1211–1219. [Google Scholar] [CrossRef]
  79. Rothe, A.; Binkley, D. Nutritional interactions in mixed species forests: A synthesis. Can. J. Res. 2001, 31, 1855–1870. [Google Scholar] [CrossRef]
  80. Pretzsch, H. Canopy space filling and tree crown morphology in mixed-species stands compared with monocultures. For. Ecol. Manag. 2014, 327, 251–264. [Google Scholar] [CrossRef] [Green Version]
  81. Pretzsch, H.; Forrester, D.I.; Rötzer, T. Representation of species mixing in forest growth models. A review and perspective. Ecol. Model. 2015, 313, 276–292. [Google Scholar] [CrossRef] [Green Version]
  82. Caldwell, M.M.; Dawson, T.E.; Richards, J.H. Hydraulic lift: Consequences of water efflux from the roots of plants. Oecologia 1998, 113, 151–161. [Google Scholar] [CrossRef] [PubMed]
  83. Siqueira, M.; Katul, G.; Porporato, A. Onset of water stress, hysteresis in plant conductance, and hydraulic lift: Scaling soil water dynamics from millimeters to meters. Water Resour. Res. 2008, 44. [Google Scholar] [CrossRef]
  84. Dawson, T.E. Hydraulic lift and water use by plants: Implications for water balance, performance and plant-plant interactions. Oecologia 1993, 95, 565–574. [Google Scholar] [CrossRef] [PubMed]
  85. Mölder, I.; Leuschner, C.; Leuschner, H.H. δ13C signature of tree rings and radial increment of Fagus sylvatica trees as dependent on tree neighborhood and climate. Trees 2011, 25, 215–229. [Google Scholar] [CrossRef]
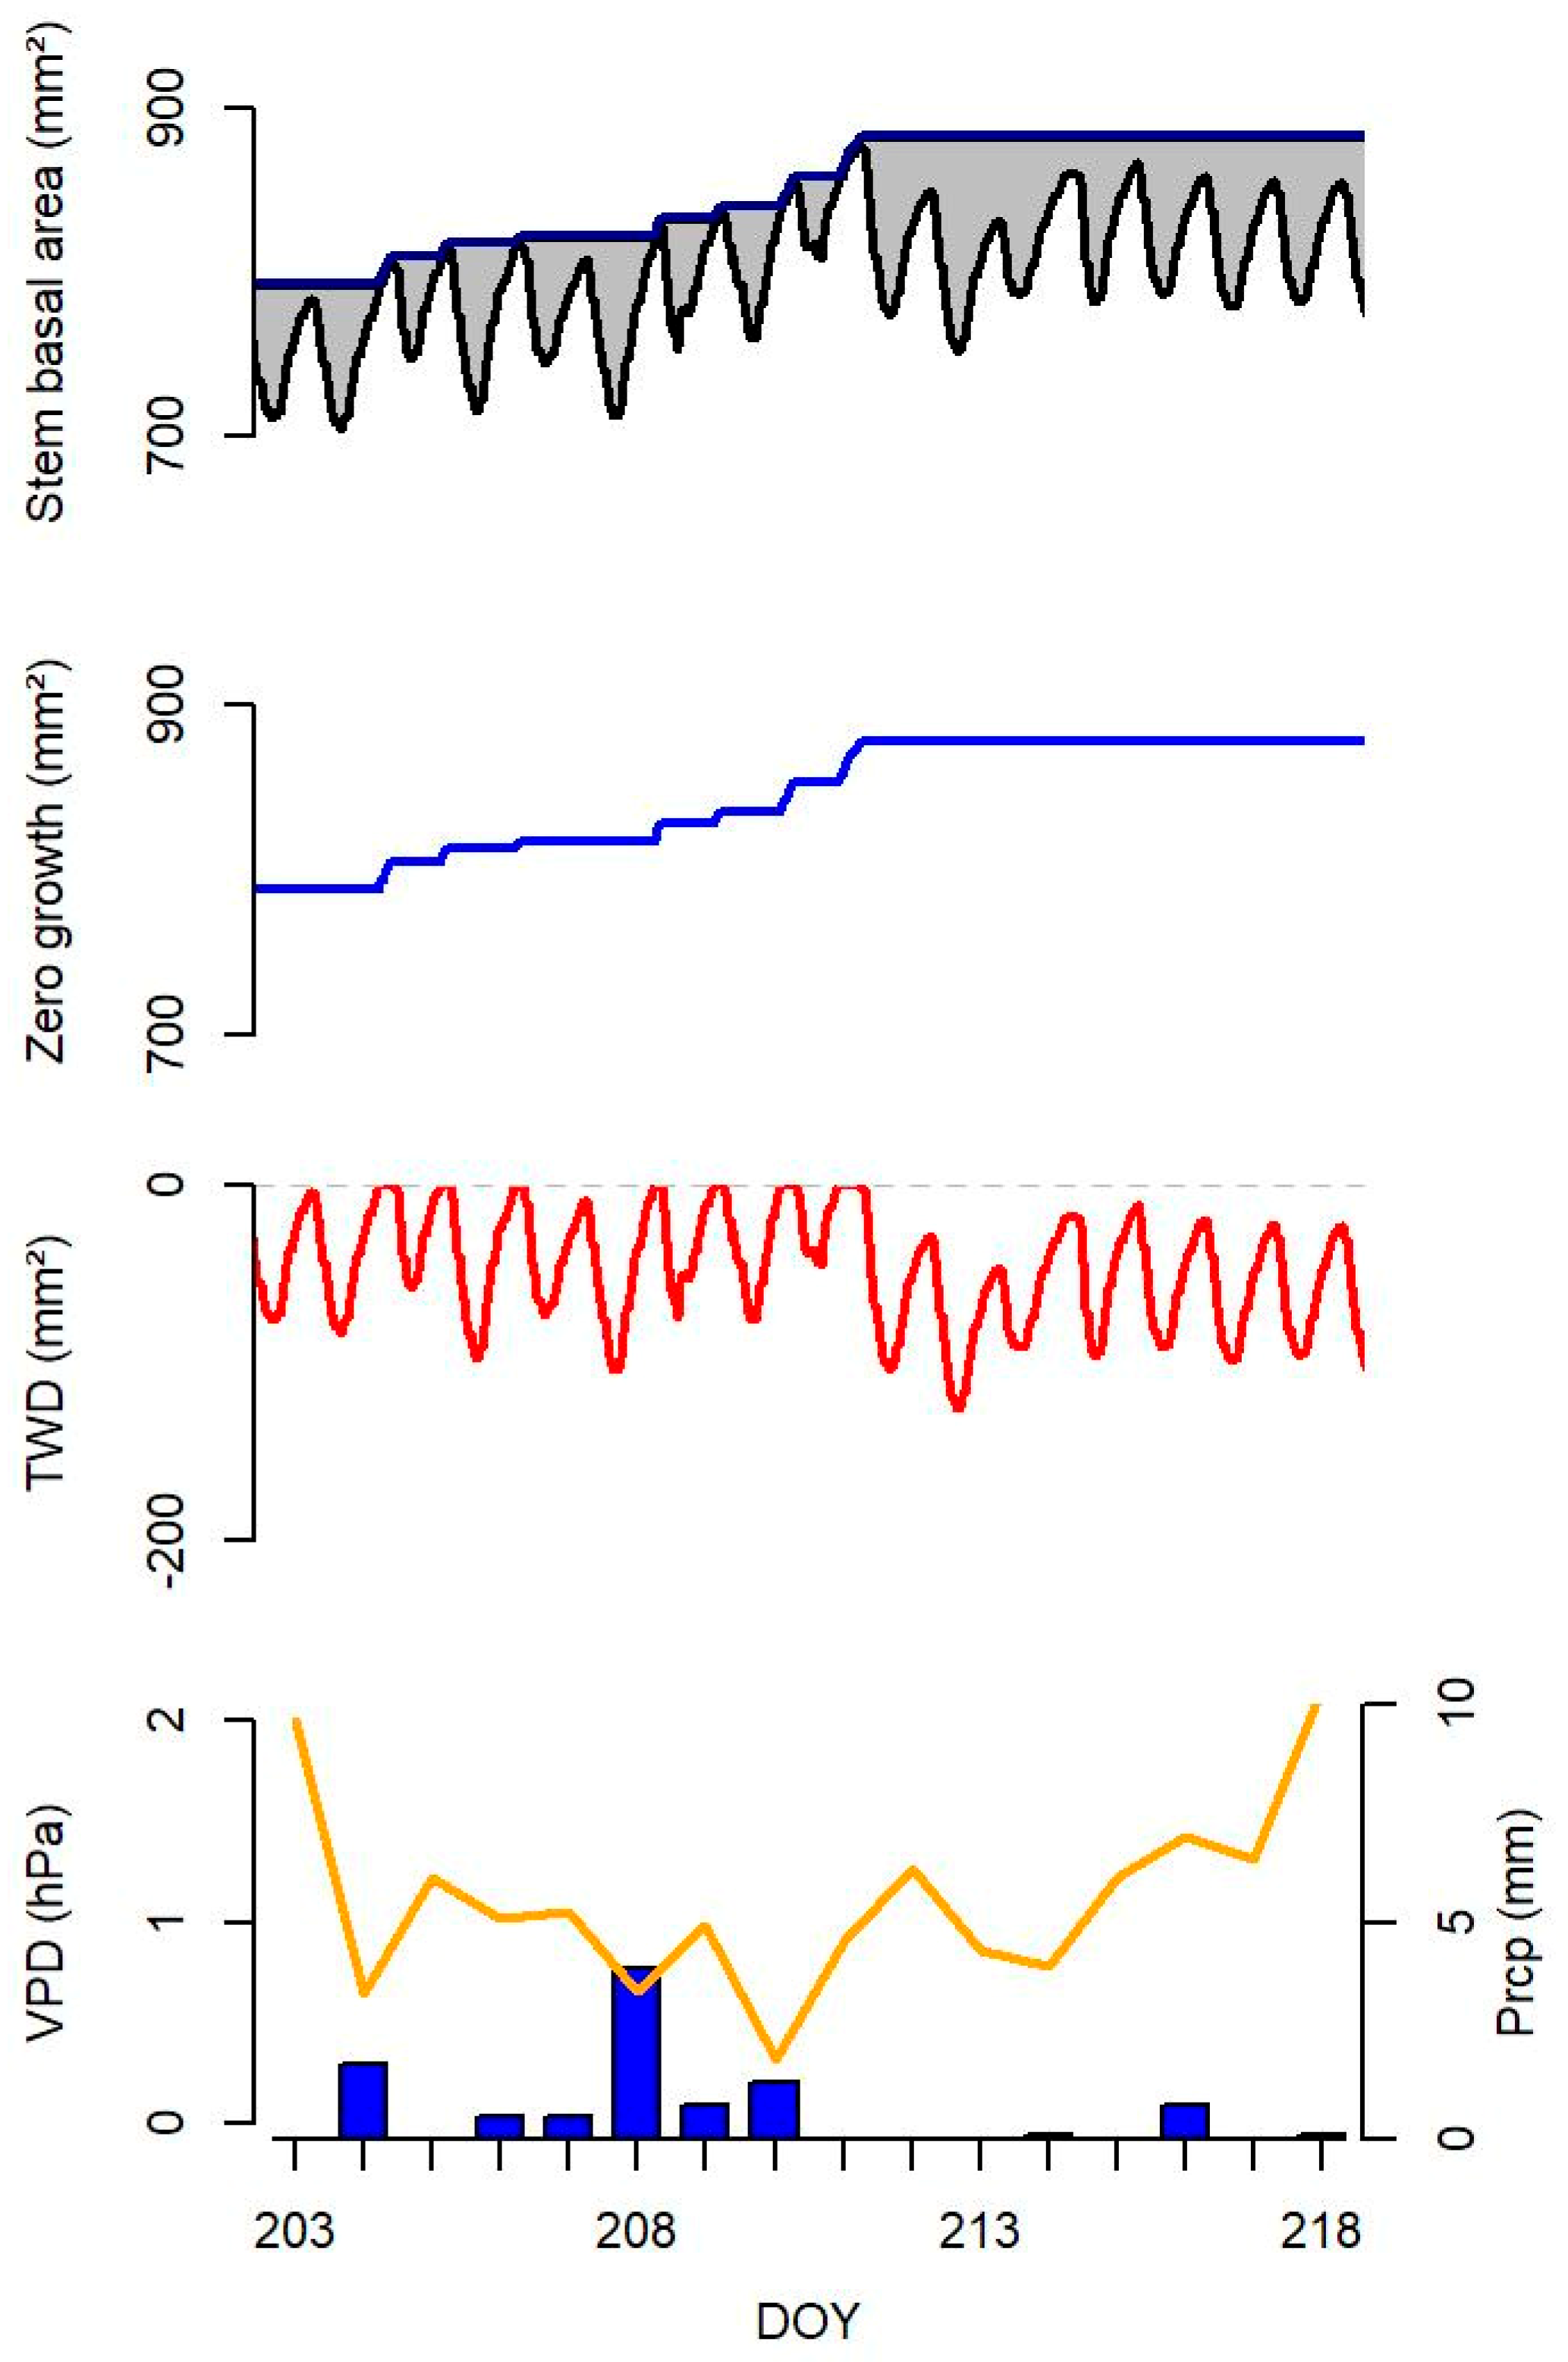
Figure 1. Exemplary illustration of the course of the stem basal area variation and the two applied indices, zero growth (ZG) and tree water deficit (TWD), for a period of 16 days in the growing season 2015 of an example spruce tree. The climatic graph of vapor pressure deficit (VPD) and daily precipitation sum (Prcp) illustrated how the deficit of water led to a stagnation of the zero growth and a decrease in the tree water deficit during the last five days of the example period.
Forests 10 00577 g001
Figure 2. Monthly precipitation sums and daily mean temperature values (a,b, above) and daily vapor pressure deficit (VPD) (a,b, below) in the growing season (April–September) of the years 2014 and 2015.
Forests 10 00577 g002
Figure 3. Mean TWDmin and zero growth (growth without the water signal) referring to the stem/root basal area (mm²) for the years 2014 (left) and 2015 (right) for spruce (red) and beech (blue) at the control (thick line) and treatment (thin line) plots at 50% tree height (ad), breast height (BH, eh), and roots (il). Shaded regions are confidence intervals. Data are shown for the growing season.
Forests 10 00577 g003
Figure 4. Relationship between TWDmin and predawn water potential (LWPpre) for spruce (red, black triangles) and beech (blue, light grey circles) trees for 50% tree height (a), breast height (b), and roots (c) (R² and significance levels based on models from Table 2; *** p < 0.001).
Forests 10 00577 g004
Figure 5. Relationship of growth (ZGmax) (a,b) and the tree water deficit (TWDmin) (c,d) represented by the difference of the measurements at 50% tree height (H50) and breast height (BH), dependent on the breast height measurement. Values below the zero line mean a growth allocation into the lower stem compartment at breast height. For the TWDmin, the negative values represent a lower tree water deficit at breast height. Linear mixed models depict how strongly the allocation was influenced by drought treatment (thick line—control, thin line—treatment) or mixture (intraspecific neighborhood—straight line, interspecific neighborhood—dashed line). The respective models are shown in Table 3.
Forests 10 00577 g005
Figure 6. Relationship of growth (ZGmax) (a,b) and the tree water deficit (TWDmin) (c,d) represented by the difference of the measurements at breast height (BH) and at the roots, dependent on the root measurements. Values below the zero line mean a growth allocation into the roots. For the TWDmin, the negative values represent a lower tree water deficit in the roots. Linear mixed models depict how strongly the allocation is influenced by drought treatment (thick line—control, thin line—treatment) or mixture (intraspecific neighborhood—straight line, interspecific neighborhood—dashed line). The respective models are shown in Table 3.
Forests 10 00577 g006
Table 1. Characteristics of the investigated stand where the treatment and control plots were located. (N: number of trees per ha; n: number of trees with dendrometers; BA: basal area per ha; V: total stem volume per ha; hq: mean height; dq: quadratic mean diameter at 1.3 m breast height).
AreaNnBAVhqdq
(m²) (m²)(m³)(m)(cm)
Drought Treatment
Spruce 3011229.742229.334.8
Beech 3521222.930926.129.1
Total1456532452.6730
Control
Spruce 3101228.840028.733.8
Beech 3561222.63052628.7
Total1446662451.4705
Table 2. Parameter estimates and statistics for the logarithmized relationship of the tree water deficit minimum (TWDmin) and the predawn water potential (LWPpre) at three different tree heights (50% tree height (H50), breast height (BH), and roots). All measurements of the TWDmin referred to the stem/root basal area (mm²). The dependent variables are in the columns. Rows show the output of the model with the fixed variables (N: number of LWPpre and TWDmin measurements). Significance level: *** p < 0.001.
log(TWDmin)
H50BHRoot
SpeciesN. SpruceE. BeechN. SpruceE. BeechN. SpruceE. Beech
Intercept4.995 ***2.876 ***4.786 ***3.071 ***3.412 ***3.317 ***
log(LWPpre)1.081 ***0.501 ***0.760 ***0.563 ***2.804 ***1.292 ***
R20.460.610.420.580.730.38
RMSE126.936.1750.407.93112.2744.47
N13879144134138140
Table 3. Parameter estimates and statistics for the diameter growth (ZGmax) and tree water deficit (TWDmin) of the 50% tree height (H50) and stem at breast height (BH) from Figure 5 and stem at breast height (BH) and root from Figure 6, dependent on drought (treat) and species mixing (mixture). The dependent variables are in the columns. Rows show the output of the model with the fixed variables (N: number of measurements). Significance levels: *** p < 0.001; ** p < 0.01; * p < 0.05; (*) p < 0.1.
PositionH50–BHBH–Root
ZGmax/TWDminZGmaxTWDminZGmaxTWDmin
Art(a)(b)(c)(d)(e)(f)(g)(h)
N. SpruceE. BeechN. SpruceE. BeechN. SpruceE. BeechN. SpruceE. Beech
Intercept100.961 ***59.753 *62.534 **2.908 (*)235.5 **149.09 **53.718 ***13.17 ***
BH−0.481 ***−0.408 ***−0.468 ***−0.463 ***
Treat × BH−0.075 ***−0.109 ***0.037−0.028 (*)
Mixture × BH−0.173 ***0.010.148 **0.18 ***
Mixture × Treat × BH0.243 ***−0.0010.209 **0.026
Root −0.279 ***2.63 ***−0.796 ***−0.992 ***
Treat × Root 0.241 ***−2.257 ***0.258 ***0.048 ***
Mixture × Root 0.347 ***−2.398 ***0.161 ***0.001
Mixture × Treat × Root −0.23 ***2.338 ***0.155 ***−0.011
R20.950.940.560.770.730.670.810.94
RMSE69.649.959.94.2182.1194.842.99.6
N79244866792448668290794082907940