Abstract
The current level of tropospheric ozone (O3) is expected to reduce the net primary production of forest trees. Here, we evaluated the negative effects of O3 on the photosynthetic CO2 uptake of Japanese forest trees species based on their cumulative stomatal O3 uptake, defined as the phytotoxic O3 dose (POD). Seedlings of four representative Japanese deciduous broad-leaved forest tree species (Fagus crenata, Quercus serrata, Quercus mongolica var. crispula and Betula platyphylla var. japonica) were exposed to different O3 concentrations in open-top chambers for two growing seasons. The photosynthesis–light response curves (A-light curves) and stomatal conductance were measured to estimate the leaf-level cumulative photosynthetic CO2 uptake (ΣPn_est) and POD, respectively. The whole-plant-level ΣPn_est were highly correlated with the whole-plant dry mass increments over the two growing seasons. Because whole-plant growth is largely determined by the amount of leaf area per plant and net photosynthetic rate per leaf area, this result suggests that leaf-level ΣPn_est, which was estimated from the monthly A-light curves and hourly PPFD, could reflect the cumulative photosynthetic CO2 uptake of the seedlings per unit leaf area. Although the O3-induced reductions in the leaf-level ΣPn_est were well explained by POD in all four tree species, species-specific responses of leaf-level ΣPn_est to POD were observed. In addition, the flux threshold appropriate for the linear regression of the responses of relative leaf-level ΣPn_est to POD was also species-specific. Therefore, species-specific responses of cumulative photosynthetic CO2 uptake to POD could be used to accurately evaluate O3 impact on the net primary production of deciduous broad-leaved trees.
1. Introduction
Tropospheric ozone (O3) has detrimental effects on vegetation [1,2,3]. Current O3 levels adversely affect growth and physiological functions, such as the photosynthesis of forest tree species [4,5]. Because of this phytotoxicity, net primary production (NPP) and biomass accumulation by temperate forests were estimated to be reduced by 1–16% [6]. Therefore, O3 indirectly affects radiative forcing through its adverse effects on photosynthetic CO2 uptake [7]. Despite robust evidence for the negative impact of O3 on plant productivity, the indirect effect of O3 on radiative forcing was not mentioned in the Intergovernmental Panel on Climate Change Fifth Assessment report because of a lack of corroborating studies [8]. In Asia, an increase in the surface O3 concentration is expected, although the changes in its concentration depend on the emission scenario [9,10,11]. In Japan, despite a decrease in the concentrations of O3 precursors, the surface O3 concentration has been increasing because of a reduction in NO titration and an increase in transboundary air pollution [12]. Therefore, it is necessary to quantify the negative impact of O3 on the photosynthetic CO2 uptake of Japanese forest tree species to account for the indirect effect of O3 on radiative forcing.
Ozone enters leaves through their stomata and damages their cellular components [13,14,15]. Because the real impacts of O3 on plants mainly depend on the amounts of O3 reaching the sites of damage within the leaves, these impacts can be quantified by measuring the cumulative stomatal O3 uptake, defined as phytotoxic O3 dose (POD) and associated response functions [16,17,18]. Because the degree of stomatal opening adjusts continuously to environmental changes [19], this O3 flux-based approach requires the development of mathematical models to estimate the POD in leaves, using stomatal responses to environmental factors [20,21,22]. In Japan, several researchers have established multiplicative models to estimate the POD in the leaves of forest tree species [23,24,25,26,27]. In addition to modeling stomatal O3 uptake, the degree of the O3-induced reduction in photosynthetic CO2 uptake should be evaluated, based on the POD, to quantify the negative impact of O3 on the NPP.
According to a meta-analysis by Wittig et al. (2007) [28], the light-saturated net photosynthetic rate (Asat) decreases at a rate of 0.22% per mmol O3 m−2 leaf area (LA) as POD increases. Because the relationship between POD and the percent change in Asat varies with species and genotypes within species, as well as with locations and experimental conditions, little of the variability in the degree of percent change in Asat is accounted for by the POD [28]. In addition to this variability, seasonal variation in the degree of O3-induced reduction in Asat could explain why POD is responsible for only a small percentage of the changes in Asat measured at a certain time. For example, the degree of O3-induced reduction in Asat of Populus nigra is lower in autumn than in summer [29], whereas POD is greater in autumn than in summer owing to the longer accumulation period. Because POD could be related to cumulative O3 damage, a cumulative O3 effects on net photosynthesis is an appropriate dependent variable in the response function of photosynthetic CO2 uptake to POD. Therefore, it is necessary to evaluate the degree of O3 damage on the cumulative photosynthetic CO2 uptake at leaf-level, which could be easily incorporated into models of the carbon cycling, throughout an entire growing season, taking into consideration of seasonal and diurnal changes in the O3 damage on Asat.
In Japan, temperate deciduous forests have been classified into three forest types: cool temperate deciduous forests, warm temperate deciduous forests and cool temperate mixed deciduous broadleaf/conifer forests [30]. The dominant tree species are Fagus crenata, Quercus serrata and Quercus mongolica var. crispula, respectively [30] and Betula platyphylla var. japonica is a typical early successional species in these forest types [31]. There are considerable differences in the sensitivities of these tree species to O3 concentration, as evaluated by whole-plant growth [32,33]. Although a stomatal conductance model to estimate the PODs in the leaves of these tree species has been established [27], the degree of O3 damage on cumulative photosynthetic CO2 uptake has not been evaluated based on the POD. Therefore, in the present study, we conducted an experimental study on the effects of O3 on cumulative photosynthetic CO2 uptake in the leaves of four representative Japanese deciduous broad-leaved tree species with different O3 sensitivities. To account for seasonal and diurnal changes in the degree of the O3-induced reduction in net photosynthetic rate when estimating the cumulative O3 effects on photosynthetic CO2 uptake, we measured photosynthesis–light response curves (A-light curves) monthly throughout an entire growing season.
2. Materials and Methods
2.1. Plant Materials and Growth Conditions
In December 2011, 3-year-old seedlings of F. crenata and 2-year-old seedlings of Q. serrata, Q. mongolica var. crispula and B. platyphylla var. japonica were individually planted in 1/2000 Wagner’s pots (volume: 12 L, diameter: 240 mm, depth: 258.5 mm) filled with commercial horticultural soil (Takii & Co., Ltd., Kyoto, Japan). The N, P and K contents in the potted soil were 320, 210 and 300 mg L−1, respectively. On 25 April 2012, the seedlings were transferred into 12 rectangular open-top chambers (OTCs, 13.0 m2 of growth space and 2.4 m in height) located at the Akagi Testing Center of the Central Research Institute of Electric Power Industry (Maebashi, Gunma, Japan) and eight seedlings per species were grown in each chamber. To measure the initial whole-plant dry mass (WDM), including belowground parts, the 10 seedlings of each species, which were not assigned to the chamber and whose mean height and stem base diameter were similar with those of the seedlings assigned to the chambers, were harvested, dried at 80°C in an oven for more than 5 days and weighed. The initial WDMs of F. crenata, Q. serrata, Q. mongolica var. crispula and B. platyphylla var. japonica seedlings were 11.1 ± 5.2 g, 36.9 ± 8.1 g, 23.7 ± 5.51 g and 11.1 ± 1.8 g, respectively (±SD, n = 10). The latitude, longitude and elevation above sea level at the experimental site are 36°28′ N, 139°11′ E and 540 m, respectively. In late August 2012 and in late April and late July 2013, the seedlings were rotated among and inside the OTCs to minimize variation among the OTCs for each treatment and among the seedlings within the OTC owing to chamber and positional effects, respectively. All the seedlings were regularly irrigated to keep the potted soil moist. On 12 April and 5 July 2013, all the seedlings were fertilized with 8 g m−2 of a slow-release solid fertilizer (N:P:K = 8:8:8, Ohmiya Green Service Co., Ltd., Saitama, Japan) to avoid the nutrient deficiency, which could limit physiological processes. The air temperature, relative air humidity and photosynthetic photon flux density (PPFD) inside the OTCs were monitored during the experimental period from 26 April 2012 to 14 November 2013 (Table S1). The vapor pressure deficit (VPD) was calculated from the saturated vapor pressure, which was calculated from air temperature and the relative air humidity.
2.2. Gas Treatment
From 26 April to 22 November 2012 and from 29 March to 14 November 2013, the seedlings were exposed to charcoal-filtered (CF) air or O3 at 1.0, 1.5 or 2.0 times the ambient concentration in the OTCs. For each treatment, three chamber replications, for a total of 12 chambers, were used. The ambient O3 concentration was independently monitored by a UV absorption O3 analyzer (ML9810, Teledyne Monitor Labs, Englewood, CO, USA) at the experimental site. Ozone was generated from oxygen-enriched dry air by an electrical discharge O3 generator (Oz-24-UA, Ebara Corporation, Japan) and injected into the OTCs through a water trap that removed the nitrogen byproducts produced by the O3 generator [34]. The O3 concentrations at 90 cm above the OTC floors were monitored using the UV absorption O3 analyzer. The O3 concentration accumulated over a threshold of 40 nmol mol−1 (ppb) (AOT40) is used to investigate the concentration-based critical levels for O3 impact on vegetation. Thus, whether the O3 concentration in the present study was above the level having negative impact on vegetation, could be investigated, even though the AOT40 is biologically less relevant than POD in O3 impact assessments on vegetation [18]. Consequently, we calculated AOT40 as the sum of the differences between the hourly mean O3 concentrations and 40 ppb when the former exceeded 40 ppb during the daylight hours and the solar irradiation was greater than 50 W m−2.
2.3. Measurement of Stomatal Diffusive Conductance
The stomatal diffusive conductance to water vapor (gsw, mmol H2O m−2 LA s−1) in the leaves of the seedlings was measured using an LI-1600 steady-state porometer (LI-COR, Lincoln, NE, USA). Throughout the O3-exposure period, the measurements were conducted on the abaxial sides of the 1st flush leaves of F. crenata, the 1st and 2nd flush leaves of Q. serrata and Q. mongolica var. crispula and the early and late leaves of B. platyphylla var. japonica seedlings. Corresponding PPFD, air temperature, relative air humidity, soil volumetric water content (SWC, %) at a 10-cm depth from the surface of the potted soil and O3 concentration were also recorded. The measurements were conducted throughout the daytime on the representative leaves at a rate of about two days per month during the growing seasons.
2.4. Calculation of POD
The POD with a flux threshold of Y nmol O3 m−2 LA s−1 (PODY, mmol O3 m−2 LA), during one growing season, was calculated according to the method described by CLRTAP (2017) and Kinose et al. (2014) [18,27], with modifications of the parameters in the stomatal conductance model based on the gsw obtained in the present study. The period used to calculate the PODY was from the day of leaf emergence of each leaf type to the day on which the net photosynthetic rate was measured for each growing season. The PODY during the daylight hours was calculated by accumulating stomatal O3 flux (Fst, nmol O3 m−2 LA s−1) with or without a flux threshold of Y nmol O3 m−2 LA s−1 (PODY or POD0, respectively). The Fst was calculated using the following equation:
where [O3]air and [O3]leaf represent O3 concentrations in the air and the intercellular space (nmol O3 mol−1), respectively, and rb_ozone and rs_ozone represent boundary layer resistance and stomatal resistance for O3 diffusion, respectively. For each gas treatment, the average hourly mean O3 concentration of three chambers was used for [O3]air. The [O3]leaf was assumed to be zero [35]. The rb_ozone was calculated from the crosswind leaf dimension (Ld, m) and wind speed (u, m s−1) as follows:
where the factor 1.3 accounts for the difference in diffusivity between heat and O3 [18]. Average Ld values for F. crenata, Q. serrata, Q. mongolica var. crispula and the early and late leaves of B. platyphylla var. japonica seedlings were 0.014, 0.015, 0.023, 0.012 and 0.032 m, respectively. The average wind speed 1.5 m above the OTC floors was 0.17 m s−1. The rs_ozone, the reciprocal of the hourly mean stomatal diffusive conductance to O3 (gsO3, mmol O3 m−2 s−1), was calculated from the hourly mean gsw and a conversion factor of 0.663 was used to account for the difference in the molecular diffusivity of O3 and that of water vapor in air [18,36]. The hourly mean gsw was estimated using the stomatal conductance model reported by Kinose et al. (2014) [27]:
where gsto represents the estimated hourly mean gsw and gmax represents the species-specific maximum gsw. The parameters fphen, flight, fmin, ftemp, fVPD, fSWC and fO3conc were all expressed in relative terms (i.e., values between 0 and 1) as a proportion of gmax, where fphen represents the modification of gmax owing to leaf phenological changes; flight represents the modification of gmax by PPFD (μmol m−2 s−1); fmin represents the relative value of species-specific minimum gsw with respect to gmax; ftemp represents the modification of gmax by air temperature (T, °C); fVPD represents the modification of gmax by VPD (kPa); fSWC represents the modification of gmax owing to SWC (%); and fO3conc represents the reduction in gmax resulting from the acute effect of O3 (ppb). We used the boundary line analysis to define the parameters of each f in the relationships between the ratio of gsw to gmax and environmental factors [37]. For details of each f and how to analyze the relationships using the boundary line analysis, please refer to Kinose et al. (2014) [27]. Results of the parameterization of stomatal conductance models for the leaves of F. crenata, Q. serrata, Q. mongolica var. crispula and B. platyphylla var. japonica seedlings are shown in Table S3. The POD0 in the leaves of the tree species during both growing seasons are presented in Tables S2 and S4.
2.5. Measurement of A-Light Curves
From May to November 2012 and from April to October 2013, the A-light curves of the seedlings were measured monthly using an infrared gas analyzer system (LI-6400, LI-COR Inc, Lincoln, Nebraska, US). Two to four seedlings from each chamber were randomly selected to be measured. The seedlings were moved from the OTCs into an experimental room and the measurements were made using three LI-6400s in the room to avoid the influences of weather conditions at the measurement time. The measurements were conducted on one leaf from each leaf type per seedling for the 1st flush leaves of F. crenata, the 1st and 2nd flush leaves of Q. serrata and Q. mongolica var. crispula and the early and late leaves of B. platyphylla var. japonica seedlings. Because the leaf emergence of B. platyphylla var. japonica is heterophyllous [31] and the late leaves emerge successively, the measurements were conducted for the 4th and 5th, 9th and 10th, 15th and 16th (only in 2013) and 18–20th late leaves, as counted from the base of the 1st or 2nd branch from the top of the seedlings. The last measurement day of each growing season was the time when the leaves were almost yellowed at the end of the growing season. When we did not find target leaf for the measurement of A-light curve due to leaf abscission by the exposure to O3, we did not measure it. The A-light curves were determined at an atmospheric CO2 concentration of 390 µmol CO2 mol−1 and a relative air humidity of approximately 60% inside the leaf chamber. As much as possible, the target air temperature inside the leaf chamber was the 10-year average of the monthly mean of the daily maximum air temperature inside the OTCs used in the present study. The actual air temperatures inside the leaf chamber differed among the month and ranged from 17.5 °C to 26.0 °C in 2012 and from 19.0 °C to 28.9 °C in 2013. For detailed information, please refer to the Table S5. To obtain the response of net photosynthetic rate to PPFD, after acclimation of the leaves to light-saturated conditions at a PPFD of 1500 ± 1 µmol m−2 s−1, PPFD was gradually reduced to zero and the net photosynthetic rates were recorded under PPFDs of 1500, 1,000, 500, 250, 100, 50 and 0 µmol m−2 s−1. To obtain the A-light curve, a non-rectangular hyperbolic function was fitted to the response of the net photosynthetic rate to PPFD. Although photosynthetic parameters other than the A-light curve could offer a better indication of the overall damage of O3 on photosynthesis and its mechanisms, we did not measure the parameters, because we focused on the effects of O3 on the cumulative photosynthetic CO2 uptake rather than the mechanisms underlying the O3-induced reduction in net photosynthesis.
2.6. Calculation of Cumulative Photosynthetic CO2 Uptake
The cumulative photosynthetic CO2 uptake per unit LA (mol CO2 m−2 LA s−1) during each growing season was calculated as the sum of the product of time (1 h) and estimated hourly value of net photosynthetic rate (Pn_est, µmol CO2 m−2 LA s−1) over one growing season (ΣPn_est, mol CO2 m−2 LA). The Pn_est was calculated from the hourly mean PPFD monitored inside the OTCs and the A-light curves that were obtained monthly. The PPFD was the mean value of the 12 OTCs. The A-light curves were the means of the three chamber replicates for each treatment. When the hourly mean of PPFD was 0 µmol m−2 s−1, Pn_est was not calculated and was not summed up for the ΣPn_est. The calculation period was from the first to the last measurement days of the A-light curve for each growing season. In each growing season, the A-light curve obtained from the first measurement was used to calculate Pn_est during the period from the first measurement day to the middle day of the subsequent measurement day. The A-light curve obtained from the last measurement was used to calculate Pn_est during the period from the middle day of the previous measurement day to the last measurement day. The A-light curves, other than those obtained from the first and last measurements in each growing season, were used to calculate Pn_est from the middle day of the previous measurement day to the middle day of the subsequent measurement day (approximately 1 month). This calculation assumed the step-changes in the A-light curve between the two measurement days. Because the ΣPn_est is time integral of Pn_est, ΣPn_est calculated by assuming linear changes in A-light curve between the two measurement days would result in the same value. When there was no target leaf owing to O3-induced early leaf abscission (e.g., Tables S6 and S7), we did not accumulate the Pn_est for ΣPn_est. The monthly A-light curves of each species are shown in Table S6.
The sums of the product of the number of day and the Asat at PPFD of 1500 µmol m−2 s−1 (μmol CO2 m−2 LA s−1) over one growing season (ΣAsat × days, μmol CO2 m−2 LA s−1 day) were calculated for each treatment and each growing season as a possible indicator of O3-induced percent changes in ΣPn_est. The Asat, which was recorded when the A-light curve was measured and the number of days during the growing season were used to calculate ΣAsat × days. The periods for the ΣAsat × days was the same as those for the ΣPn_est. The Asat measured on the first measurement day was multiplied by the number of days during the period from the first measurement day to the middle of the subsequent measurement day. The Asat that was measured on the last measurement day was multiplied by the number of days during the period from the last measurement day to the middle of the previous measurement day. The Asat, other than those measured on the first and last measurement days, were multiplied by the number of days from the middle day of the previous measurement to that of the subsequent measurement (approximately 1 month). The products of the Asat and the number of days were summed for ΣAsat × days during each growing season. The monthly Asat are shown in Table S7. The ΣPn_est and ΣAsat × days in the leaves of F. crenata, Q. serrata, Q. mongolica var. crispula and B. platyphylla var. japonica seedlings are indicated in Table S4.
2.7. Validation of Cumulative Photosynthetic CO2 Uptake
To validate the calculation of leaf-level ΣPn_est, leaf-level ΣPn_est was expanded from a LA basis to a whole-plant basis and we analyzed the relationship of the whole-plant-level ΣPn_est with WDM increments over the two growing seasons. The numbers of each leaf type per plant were counted periodically during the growing seasons. Part of each leaf type was sampled to measure the area per leaf using an area meter (LI-3100, Li-Cor Inc, Lincoln, Nebraska, USA). Leaf area per plant of each leaf type was estimated from the product of leaf number per plant and mean area per leaf. For the calculation of the whole-plant-based ΣPn_est, the product of Pn_est and estimated leaf area per plant was summed up during each growing season. To measure the WDM at the end of the gas exposure, the seedlings of each tree species were harvested in October and November 2013. The harvested seedlings were dried at 80 °C in an oven for more than 5 days and weighed. The WDM increments over the two growing seasons were calculated using the initial and final WDMs. The effects of O3 on the WDMs of F. crenata, Q. serrata, Q. mongolica var. crispula and B. platyphylla var. japonica seedlings in October and November 2013 are shown in Table S8.
2.8. Relationships of POD with ΣPn_est and Asat
For each tree species, the ΣPn_est or Asat in the CF treatment was used as a reference (100%) to calculate the relative value of ΣPn_est or Asat (%), respectively, in each gas treatment. It has been suggested that the form of the Weibull function (Y = a × exp [−(X/ω)λ]) is a biologically realistic response curve through the discussion on the function as a part of the National Crop Loss Assessment Network (NCLAN) in the USA [38]; therefore, this function was fitted to the response of relative ΣPn_est or Asat to POD without a flux threshold (POD0). According to the method of CLRTAP (2017) [18], in addition, the response functions of relative ΣPn_est to POD with different flux thresholds (PODY) were analyzed using a linear regression analysis to determine any species-specific responses of ΣPn_est to POD. In these analyses, the data obtained from different leaf types (i.e., 1st and 2nd flush leaves or early and late leaves) were pooled for each species, because the responses of the different leaf types were similar. The period for the POD calculation was from the leaf emergence day to each measurement day of A-light curves for Asat or to the last measurement day of the A-light curves for ΣPn_est.
3. Results
Table 1 shows the air temperature, VPD and PPFD inside the chambers during the O3-exposure periods from 26 April to 22 November 2012 and from 29 March to 14 November 2013. The climatic conditions inside the OTCs were similar during the exposure periods of 2012 and 2013.

Table 1.
Seasonal means of air temperature, vapor pressure deficit (VPD), and photosynthetic photon flux density (PPFD) inside open-top chambers (OTCs) during the O3-exposure period in 2012 and 2013.
Table 2 shows the average O3 concentrations and AOT40 of O3 in each gas treatment during the O3-exposure periods of 2012 and 2013. The exclusion efficiency of O3 in the CF treatment was about 80%. Averaged across the two growing seasons, even though the seasonal mean O3 concentrations in the 1.5× and 2.0×O3 treatments were 1.62–1.74 and 2.19–2.33 times higher than that in the 1.0×O3 treatment, respectively, the highest 1-h maximum O3 concentration in the two treatments almost reached the target concentration (i.e., 1.53 and 2.02 times, respectively). The average concentration in 2012 was lower than that in 2013, whereas the daily 1-h maximum concentration was higher in 2012 than in 2013. Although this result suggests a stronger diel pattern in 2012, it was not obvious. The daylight AOT40 in the 1.0 × O3 treatments in 2012 and 2013 were 6.0 and 7.5 ppm h and exceeded the concentration-based critical level for O3-sensitive forest trees (5 ppm h) that was adopted by the United Nations Economic Commission for Europe Convention on Long-Range Trans-boundary Air Pollution [18].
Table 2.
O3 concentrations and AOT40 of O3 during the O3-exposure period in 2012 and 2013.
To test the performance of stomatal conductance model for the leaves of F. crenata, Q. serrata, Q. mongolica var. crispula and B. platyphylla var. japonica seedlings, linear regression analyses were conducted between measured gsw and gsw estimated from the model of Kinose et al. (2014) [27], with modifications of gmax and the parameters of each function (Table 3). The model parameterized in the present study accounted for 48.2% of the variation in the 1st flush leaves of F. crenata, 41.6% and 34.7% of the variation in the 1st and 2nd flush leaves of Q. serrata, respectively, 34.6% and 20.9% of the variation in the 1st and 2nd flush leaves of Q. mongolica var. crispula, respectively and 30.6% and 30.1% of the variation in the early and late leaves of B. platyphylla var. japonica, respectively. We did not evaluate the performance of stomatal conductance model using the gsw and corresponding meteorological parameters obtained from the sites different from the present experiment site.
Table 3.
Results of the linear regression analyses of the measured stomatal diffusive conductance to water vapor (gsw, mmol H2O m−2 LA s−1) and gsw estimated from the model of Kinose et al. (2014), using the modifications of gmax and the parameters of each function based on the gsw obtained in the present study.
The relationships between WDM increments and the whole-plant-based ΣPn_est during the two growing seasons are shown in Figure 1. The values are plotted for each species across all the treatments. There were significant positive correlations for F. crenata and Q. mongolica var. crispula but those for Q. serrata and B. platyphylla var. japonica were not significant.
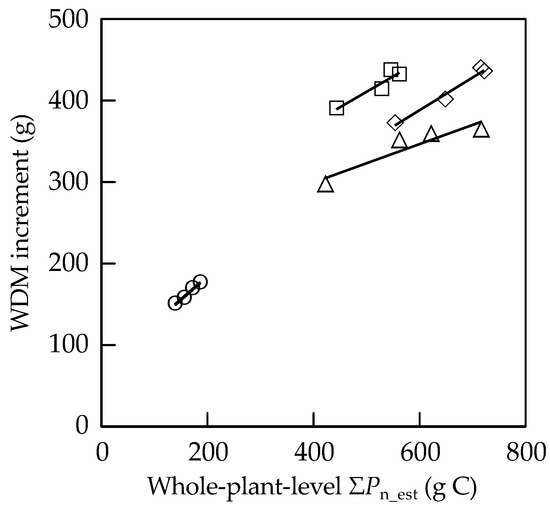
Figure 1.
Relationships between the whole-plant-level ΣPn_est and whole-plant dry mass (WDM) increment over the two growing seasons. Solid lines indicate the regression line for each species. ○: F. crenata (y = 0.569x + 70.5, R2 = 0.984, p < 0.01), □: Q. serrata (y = 0.378x + 222, R2 = 0.890, not significant), ◇: Q. mongolica var. crispula (y = 0.401x + 147, R2 = 0.975, p < 0.05), △: B. platyphylla var. japonica (y = 0.235x + 205, R2 = 0.868, not significant).
The responses of relative Asat or relative ΣPn_est to POD0 in the leaves of F. crenata, Q. serrata, Q. mongolica var. crispula and B. platyphylla var. japonica are shown in Figure 2a–h. The coefficients of determination (R2) for the response functions of relative Asat or relative value of leaf-level ΣPn_est to POD0 were 0.663 and 0.894 in F. crenata, respectively, 0.645 and 0.935 in Q. serrata, respectively, 0.591 and 0.833 in Q. mongolica var. crispula, respectively and 0.602 and 0.760 in B. platyphylla var. japonica, respectively.
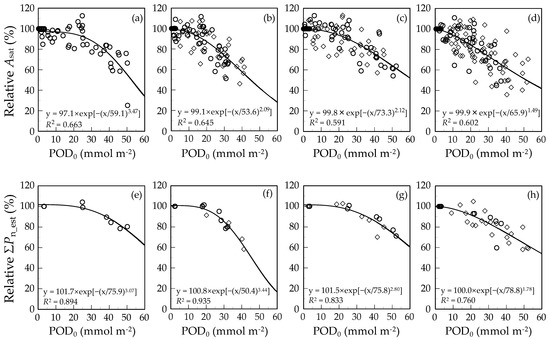
Figure 2.
Relationships between relative Asat (a–d) or ΣPn_est (e–h) and POD without flux threshold (POD0) in the leaves of F. crenata (a,e), Q. serrata (b,f), Q. mongolica var. crispula (c,g) and B. platyphylla var. japonica (d,h). Open circles indicate 1st flush or early leaves, and open diamonds indicate 2nd flush or late leaves. The Weibull function was fitted to the response, and the coefficient of determination (R2) is indicated in each figure. Data in (a)–(d) were from Table S2 (POD0) and S7 (Asat), and in (e)–(h) were from Table S4 (POD0 and ΣPn_est).
To discuss the species-specific responses of ΣPn_est to POD, we examined the flux threshold appropriate for the linear regression of the responses of ΣPn_est to PODY (Table 4). The PODY appropriate for the linear regression of the response were POD7 for F. crenata, POD4 for Q. serrata, POD8 for Q. mongolica var. crispula and POD3 for B. platyphylla var. japonica.
Table 4.
The R2 value for the linear regression line between relative value of leaf-level ΣPn_est and phytotoxic O3 dose (PODY, Y: flux threshold) in the leaves of F. crenata, Q. serrata, Q. mongolica var. crispula and B. platyphylla var. japonica seedlings.
In Figure 3, the relationships between the relative value of ΣPn_est and that of ΣAsat × days in the leaves of F. crenata, Q. serrata, Q. mongolica var. crispula and B. platyphylla var. japonica are shown. There was a significant positive linear correlation between the relative value of ΣPn_est and that of ΣAsat × days.
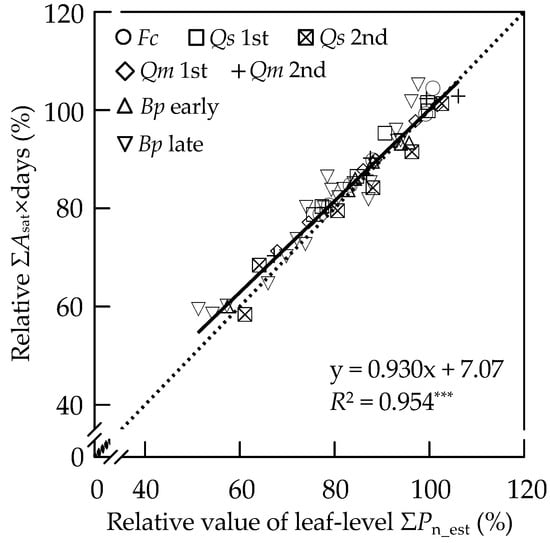
Figure 3.
Relationship between the relative value of leaf-level ΣPn_est (%) and relative ΣAsat × days (%) in the 1st flush leaves of F. crenata (Fc), the 1st and 2nd flush leaves of Q. serrata (Qs 1st and Qs 2nd, respectively), the 1st and 2nd flush leaves of Q. mongolica var. crispula (Qm 1st and Qm 2nd, respectively), and the early and late leaves of B. platyphylla var. japonica (Bp early and Bp late, respectively). Datasets for the charcoal-filtered air (CF) treatment were not plotted. The relationship was analyzed by linear regression. Solid and dashed lines indicate the regression line and 1:1 line, respectively. The equation and the coefficient of determination (R2) of the regression line are indicated in the figure. Significance for the R2 is shown: *** p < 0.001.
4. Discussion
In the present study, we evaluated the negative effects of O3 on leaf-level photosynthetic CO2 uptake, which could be easily incorporated into models of the carbon cycling, in the seedlings of four representative Japanese deciduous broad-leaved forest tree species based on POD. Lombardozzi et al. (2013) [39] compiled and analyzed the response of Asat to POD using data from the peer-reviewed literature. Although the overall decrease in Asat was observed, high variance masked any correlations between the decline in Asat with increase in POD. Because POD could be related to cumulative O3 damages, it could correspond not to O3 effect on net photosynthetic rate at a certain time but to that on cumulative photosynthetic CO2 uptake. Several researchers observed that the extent of the O3-induced reduction in net photosynthetic rate varied seasonally [29,40]. On the other hand, Coleman et al. (1995) [41] observed a greater extent of O3-induced reduction in net photosynthetic rate under high light intensities compared with under low light intensities, indicating variations in the extent of the O3 damage on photosynthetic CO2 uptake during the daytime and among canopy positions owing to diurnal variation in the light intensity and self-shading, respectively. In the present study, to take such seasonal and diurnal variations into account, we estimated ΣPn_est from A-light curves measured monthly and diurnal changes in PPFD throughout the entire growing season. Because this estimation assumes that the A-light curves have been constant for about one month and ignored the diurnal changes in air temperature and relative air humidity, it was necessary to validate the estimation. For this purpose, we expanded the ΣPn_est from a LA basis to the whole-plant basis by considering a roughly estimated LA per plant and whole-plant-level ΣPn_est was compared with WDM increment over two growing seasons. Although not all the species showed significant correlations between WDM increment and the whole-plant-level ΣPn_est during the two growing seasons (Figure 1), all the species had relatively high R2 values. In general, whole-plant growth is largely determined by the amount of leaf area per plant and net photosynthetic rate per leaf area. Although the LA per plant was roughly estimated and calculation of ΣPn_est did not consider the effects of environmental condition other than light intensity on photosynthetic CO2 uptake, these results suggest that the leaf-level ΣPn_est could reflect the cumulative photosynthetic CO2 uptake of the seedlings per unit LA, which could be easily incorporated into models of the carbon cycling.
Because the negative impact of O3 on photosynthetic CO2 uptake can indirectly increase radiative forcing [7], we evaluated the effect of O3 on photosynthetic CO2 uptake based on POD0 in the leaves of representative Japanese deciduous broad-leaved tree species. According to the meta-analysis by Wittig et al. (2007) [28], the 28% of variation in the O3-induced percent changes in Asat measured at a certain time was accounted for by the linear function of POD0 (i.e., R2 value was 0.28). On the other hand, Lombardozzi et al. (2013) [39] did not observe any correlations between changes in Asat and POD owing to the large variability across studies. In the present study, about 60% of O3-induced percent changes in the Asat was accounted for by POD0 (Figure 2a–d), which is greater than Wittig et al. (2007) [28]. However, the POD0 accounted for the O3-induced percent changes in the ΣPn_est rather than those in the Asat (Figure 2e–h). These results suggest that the ΣPn_est is an appropriate dependent variable in the response function of photosynthetic CO2 uptake to POD, which could result from the fact that the cumulative stomatal O3 uptake corresponds to the extent of cumulative O3 effect on photosynthetic CO2 uptake. Therefore, the response function of relative leaf-level ΣPn_est to POD is useful for the quantification of the negative impact of O3 on the NPP of forests.
In the present analysis, there are uncertainties in the calculations of leaf-level ΣPn_est, whole-plant-level ΣPn_est and POD. For the calculation of leaf-level ΣPn_est, the calculation period was from the first day of the first measurement of A-light curve to the last day of the last measurement in each growing season. Because this period was shorter than actual accumulation period, the leaf-level ΣPn_est could underestimate the actual cumulative photosynthetic CO2 uptake per unit LA. It is unclear that the ignorance of the effects of changes in air temperature and air humidity on the A-light curves causes overestimation or underestimation, but it would be the source of the error. Furthermore, it is also unclear the measurement of A-light curve at about one-month interval was enough time resolution to estimate the leaf-level cumulative photosynthetic CO2 uptake. The greater the number of measurements during the growing season, the better for the estimation of absolute value of accumulated photosynthetic CO2 uptake. In the present study, however, we focused on the extent of O3-induced reduction in leaf-level ΣPn_est, rather than absolute value. Because there were relatively high R2 value in the relationship between WDM increment and the whole-plant-level ΣPn_est in all tree species, the monthly measurement of A-light curve could be enough time resolution for the evaluation of O3 effects on cumulative photosynthetic CO2 uptake. For the scaling up ΣPn_est from leaf-level to whole-plant-level, it is necessary to account for the difference in the light condition within the canopy and the changes in the leaf area per plant not only owing to the leaf emergence but also owing to the O3-induced leaf abscission. The calculation of whole-plant-level ΣPn_est did not consider the shelf-shading within the canopy and assumed that all leaves received full sunlight, which could result in the overestimation of the cumulative photosynthetic CO2 uptake at whole-plant level. The estimation of changes in the leaf area per plant of tree species having flush-type leaf emergence, such as F. crenata, Q. serrata and Q. mongolica var. crispula, could be relatively easy. However, changes in the leaf area of B. platyphylla var. japonica having heterophyllous leaf emergence type is not easy to estimate, because it is difficult to identify the emergence day of each leaf, which could result in the higher variability than the other three tree species. The source of error in the calculation of POD could be estimation of gsw in addition to the difficulty in the definition of leaf emergence day (i.e., start day of accumulation period) especially in B. platyphylla var. japonica. In the present study, the accuracy of estimation of gsw was relatively low, especially for 2nd flush leaves of Q. mongolica var. crispula and early and late leaves of B. platyphylla var. japonica. On the other hand, mean bias error (MBE) in the relationship between estimated and measured gsw were higher than 0 in all tree species (Table 3), indicating the overestimation of gsw and thus resulting in overestimation of POD. Although we did not try adjusting other parameters to get a better fit, higher accuracy in the estimation of gsw is foundational to calculating the POD. Further study is required to improve the accuracy of the estimation of gsw by modification of the stomatal conductance model, considering the other parameters such as O3-induced stomatal sluggishness (e.g., Hoshika et al., 2014 [42]).
Sitch et al. (2007) [7] quantitatively evaluated the O3-induced reduction in global gross primary production (GPP) using the sensitivity to O3 of the whole-plant growth of European beech, birch and oak and Norway spruce for forest trees. In their report, there was considerable difference in the O3-induced reduction in GPP between the estimations considering a low or high plant O3 sensitivity. Thus, an uncertainty in the estimation of the O3-induced reduction in GPP could result from different sensitivities to O3 among tree species. There are many forest tree species with species-specific O3 sensitivity in Asia [32,33,43]. In the present study, the species-specific responses (i.e., O3 sensitivities) of cumulative photosynthetic CO2 uptake to stomatal O3 uptake were clearly demonstrated (Figure 2e–h). In addition, the flux threshold appropriate for the linear regression of the responses of relative ΣPn_est to PODY was also species-specific (Table 4). Therefore, the differences in the O3-sensitivity among the representative temperate forest tree species should be taken into account for more accurate and quantitative evaluations of O3 effects on photosynthetic CO2 uptake.
According to a meta-analysis by Wittig et al. (2007) [28], the O3 sensitivity of Asat in the leaves of trees as assessed by the POD was 0.21% per mmol O3 m−2 LA. To compare the POD-based O3 sensitivities, we conducted a linear regression analysis of the relationship between POD0 and relative Asat. The slopes of the regression lines for each tree species were −0.69, −0.95, −0.66 and −0.98% per mmol O3 m−2 LA for F. crenata, Q. serrata, Q. mongolica var. crispula and B. platyphylla var. japonica, respectively. These results indicate that the POD-based O3 sensitivity of the Asat of Japanese deciduous broad-leaved forest tree species is high compared with those of the tree species reported by Wittig et al. (2007) [28], although the POD-based O3 sensitivity reported by Wittig et al. (2007) [28] varied greatly owing to differences in species, genotypes, locations and experimental conditions. Because it has been suggested that the degree of O3 damage is determined by the balance between stomatal O3 flux and leaf cellular detoxification [14,44,45], the higher POD-based O3 sensitivity of the net photosynthesis in the leaves of Japanese deciduous broad-leaved tree species could be attributed to the lower detoxification capacity of O3 in the leaves.
Among the four tree species used in the present study, there were obvious differences in the POD-based O3 sensitivities of cumulative photosynthetic CO2 uptake (Figure 2e–h). At a lower POD0 up to around 20–30 mmol O3 m−2, ΣPn_est of F. crenata, Q. serrata and Q. mongolica var. crispula were less responsive to increasing POD0 as compared with that of B. platyphylla var. japonica which showed an almost constant reduction as POD0 increased (Figure 2e–h). The extent of the pronounced plateau at a lower POD0 suggests a tolerance to the O3 taken into the leaves and is represented by the variable λ in the Weibull function [37], which were 3.07, 3.44, 2.80 and 1.78 in F. crenata, Q. serrata, Q. mongolica var. crispula and B. platyphylla var. japonica, respectively (Figure 2e–h). Matyssek et al. (2007) [46] supposed that leaf mass per area (LMA) reflects the depth of the biochemical defenses against O3 taken into the leaves, and thus it could be used as an indicator of the leaf cellular detoxification capacity of O3. In the present study, we measured LMA at the end of each growing season (data not shown). Although there was considerable variation in the LMA between the years and among the treatments within one species, there was a significant positive correlation between the λ and median LMA of each species (R = 0.970, n = 4, p < 0.05). This result suggests that, among the four tree species, different responses at a lower POD0 might result from differences in detoxification capacity in the leaves.
Among the three tree species showing λ of around 3, the response of relative ΣPn_est to increasing POD0 of Q. serrata become drastically sensitive above the POD0 of around 30 mmol O3 m−2. Because the activity of antioxidative enzymes and antioxidant concentration increases in response to O3 exposure [15,47,48], the different responses of ΣPn_est to increasing POD0 above the POD0 of around 30 mmol O3 m−2 might be caused by the difference in the inducible antioxidative capacity. On the other hand, differences in the flux threshold of PODY appropriate for the linear regression could also suggest differences in the detoxification capacity in the leaves among the tree species, because the flux threshold could focus the POD to the portion of the O3 flux that is thought to be not detoxified in the leaves. However, the rank in descending order of the flux threshold was Q. mongolica var. crispula, F. crenata, Q. serrata and B. platyphylla var. japonica (Table 4) and did not match with that of the λ (Figure 2). The flux threshold of Y is the cut-off O3 flux at a constant value throughout the growing season, even though the detoxification capacity in the leaves changes not only owing to O3 exposure but also owing to leaf aging. Thus, the flux threshold of Y might not be biologically relevant. To make quantification of O3 damage on photosynthetic CO2 uptake more mechanistic and biologically relevant, therefore, further study is required to clarifying the mechanisms underlying the different response of ΣPn_est to POD0 among the species with emphasis not only on constitutive but also on inducible and phenological changes in antioxidative capacity in the leaves [14,15,44].
Although Lombardozzi et al. (2013) [39] did not observe any correlations between changes in Asat and POD based on the data from the peer-reviewed literature, part of the literature could be useful for establishment of photosynthetic responses to POD, which could be easily incorporated into models of the carbon cycling. In the present study, O3-induced reductions in net photosynthetic rate were greater under relatively high light intensities and tended to be similar above a PPFD of approximately 500 μmol m−2 s−1 (e.g., Figure S1), which was also observed in a study by Coleman et al. (1995) [41]. This result suggests that the O3-induced reduction in Asat considerably accounts for the reduction in the ΣPn_est. Across the species and leaf types, we found a significant linear correlation, with a slope of 0.93, between the relative value of ΣPn_est and that of ΣAsat × days, which is parameter similar to seasonal mean percent reduction in Asat as reported by Novak et al. (2005) [29] (Figure 3). Several data points, which were obtained from the leaves with a short cumulative period, such as the 2nd flush leaves of Q. serrata and Q. mongolica var. crispula and the late leaves of B. platyphylla var. japonica, were plotted slightly away from the 1:1 line. This could result from the low number of measurements taken during the accumulation period. Therefore, the Asat, if measured at appropriate intervals throughout the growing season, could be used to evaluate the O3-induced percent change in ΣPn_est. Several researchers have reported such seasonal measurements of Asat in the leaves of deciduous broad-leaved tree species [40,49,50,51]. These data sets could be used to estimate the degree of O3-induced reduction in cumulative photosynthetic CO2 uptake and its response to stomatal O3 uptake, which is useful in the quantification of the negative impact of O3 on the NPP of deciduous broad-leaved forest trees.
5. Conclusions
In the present study, the cumulative photosynthetic CO2 uptake of four representative Japanese deciduous broad-leaved forest tree species was estimated from A-light curves measured periodically during the growing season. The whole-plant-level ΣPn_est were highly correlated with the whole-plant dry mass increments over the two growing seasons. Because whole-plant growth is largely determined by the amount of leaf area per plant and net photosynthetic rate per leaf area, this result suggests that leaf-level ΣPn_est, which was estimated from the monthly A-light curves and hourly PPFD, could reflect the cumulative photosynthetic CO2 uptake of the seedlings per unit LA. The ΣAsat×days calculated from periodically measured Asat could be used to evaluate the O3-induced percent change in leaf-level ΣPn_est. Although the O3-induced percent changes in leaf-level ΣPn_est were well explained by POD0 in all the tree species, species-specific responses of leaf-level ΣPn_est to POD0 were observed. In addition, the flux threshold appropriate for the linear regression of the responses of relative leaf-level ΣPn_est to POD was also species-specific. Therefore, species-specific responses of cumulative photosynthetic CO2 uptake to stomatal O3 uptake could be used for more accurate evaluations of O3 impact on the NPP of Japanese deciduous broad-leaved forest tree species.
Supplementary Materials
The following are available online at https://www.mdpi.com/1999-4907/10/7/556/s1: Table S1: Monthly means of air temperature, vapor pressure deficit (VPD) and photosynthetic photon flux density (PPFD) inside the chambers during the O3-exposure periods in 2012 and 2013, Table S2: SUM00, AOT40 and POD0 corresponding to each Asat in 2012 and 2013, Table S3: Results of the parameterization of the stomatal conductance models, Table S4: POD0, ΣPn_est and ΣAsat×days in 2012 and 2013, Table S5: Actual air temperatures inside the leaf chamber for measuring gas exchange rates, Table S6: Results of fitting the light-response curve of photosynthesis with non-rectangular hyperbolic function, Table S7: Light-saturated net photosynthetic rate at photosynthetic photon flux density of 1500 μmol m−2 s−1 (Asat, μmol m−2 s−1) in 2012 and 2013, Table S8: Effects of O3 on the whole-plant dry mass at the end of the exposure in October and November 2013, Figure S1: Typical effect of O3 on light response curve of net photosynthesis (A-light curve) observed in the present study.
Author Contributions
Conceptualization, T.I. and H.M.; Methodology, T.I. and H.M.; Investigation, H.M., M.Y. and Y.K.; Resources, H.M.; Writing—Original draft preparation, M.Y. and Y.K.; Writing—Review & editing, T.I. and H.M.; Visualization, M.Y.; Supervision, T.I.; Funding acquisition, T.I.
Funding
This research was funded by the Ministry of the Environment, Japan, through the Program of the Environment Research and Technology Development Fund, grant number 5B-1105.
Acknowledgments
The authors acknowledge Takeshi Tange (The University of Tokyo) for his valuable suggestions. We also acknowledge Takayoshi Koike (Hokkaido University) and Mitsutoshi Kitao (Forestry and Forest Products Research Institute) for their valuable suggestions and technical support. The authors are greatly indebted to Isamu Nouchi (Association of International Research Initiatives for Environmental Studies) for his comprehensive guidance. The authors also acknowledge Nobutaka Nakamachi (Civil Engineering Research & Environmental Studies) for his technical support.
Conflicts of Interest
The authors declare no conflict of interest. The funders had no role in the design of the study; in the collection, analyses or interpretation of data; in the writing of the manuscript or in the decision to publish the results.
References
- Fuhrer, J. Ozone risk for crops and pastures in present and future climates. Naturwissenschaften 2009, 96, 173–194. [Google Scholar] [CrossRef] [PubMed]
- Matyssek, R.; Karnosky, D.F.; Wieser, G.; Percy, K.; Oksanen, E.; Grams, T.E.E.; Kubiske, M.; Hanke, D.; Pretzsch, H. Advances in understanding ozone impact on forest trees: Messages from novel phytotron and free-air fumigation studies. Environ. Pollut. 2010, 158, 1990–2006. [Google Scholar] [CrossRef] [PubMed]
- Emberson, L.D.; Kitwiroon, N.; Beevers, S.; Büker, P.; Cinderby, S. Scorched Earth: How will changes in the strength of the vegetation sink to ozone deposition affect human health and ecosystems? Atmos. Chem. Phys. 2013, 13, 6741–6755. [Google Scholar] [CrossRef]
- Wittig, V.E.; Ainsworth, E.A.; Naidu, S.L.; Karnosky, D.F.; Long, S.P. Quantifying the impact of current and future tropospheric ozone on tree biomass, growth, physiology and biochemistry: A quantitative meta-analysis. Global Change Biol. 2009, 14, 396–424. [Google Scholar] [CrossRef]
- Watanabe, M.; Hoshika, Y.; Koike, T.; Izuta, T. Combined effects of ozone and other environmental factors on Japanese trees. In Air pollution impacts on plant in East Asia; Izuta, T., Ed.; Springer: Tokyo, Japan, 2017; pp. 101–110. [Google Scholar]
- Ainsworth, E.A.; Yendrek, C.R.; Sitch, S.; Colling, W.J.; Emberson, L.D. The effects of tropospheric ozone on net primary productivity and implications for climate change. Annu. Rev. Plant Biol. 2012, 63, 637–661. [Google Scholar] [CrossRef] [PubMed]
- Sitch, S.; Cox, P.M.; Collins, W.J.; Huntingford, C. Indirect radiative forcing of climate change through ozone effects on the land-carbon sink. Nature 2007, 448, 791–795. [Google Scholar] [CrossRef]
- Myhre, G.; Shindell, D.; Bréon, F.-M.; Collin, W.; Fuglestvedt, J.; Huang, J.; Koch, D.; Lamarque, J.-F.; Lee, D.; Mendoza, B.; et al. Anthropogenic and Natural Radiative Forcing. In Climate Change 2013: The Physical Science Basis. Contribution of Working Group I to the Fifth Assessment Report of the Intergovernmental Panel on Climate Change; Stocker, T.F., Qin, D., Plattner, G.-K., Tignor, M., Allen, S.K., Boschung, J., Nauels, A., Xia, Y., Bex, V., Midgley, P.M., Eds.; Cambridge University Press: Cambridge, UK; New York, NY, USA, 2013; pp. 679–681. [Google Scholar]
- Ohara, T.; Akimoto, H.; Kurokawa, J.; Horii, N.; Yamaji, K.; Yan, X.; Hayasaka, T. An Asian emission inventory of anthropogenic emission sources for the period 1980–2020. Atomos. Chem. Phys. 2007, 7, 4419–4444. [Google Scholar] [CrossRef]
- Yamaji, K.; Ohara, T.; Uno, I.; Kurokawa, J.; Pochanart, P.; Akimoto, H. Future prediction of surface ozone over east Asia using Models-3 Community Multiscale Air Quality Modeling System and Regional Emission Inventory in Asia. J Geophys.l Res. 2008, 113, D08306. [Google Scholar] [CrossRef]
- Wild, O.; Fiore, A.M.; Shindell, D.T.; Doherty, R.M.; Collins, W.J.; Dentener, F.J.; Schultz, M.G.; Gong, S.; MacKenzie, I.A.; Zeng, G.; et al. Modelling future changes in surface ozone: A parameterized approach. Atmos. Chem. Phys. 2012, 12, 2037–2054. [Google Scholar] [CrossRef]
- Akimoto, H.; Mori, Y.; Sasaki, K.; Nakanishi, H.; Ohizumi, T.; Itano, Y. Analysis of monitoring data of ground-level ozone in Japan for long-term trend during 1990–2010: Causes of temporal and spatial variation. Atmos. Environ. 2015, 102, 302–310. [Google Scholar] [CrossRef]
- Nouchi, I. Responses of whole plants to air pollutants. In Air pollution and plant biotechnology—Prospects for phytomonitoring and phytoremediation; Omasa, K., Saji, H., Youssefian, S., Kondo, N., Eds.; Springer: Tokyo, Japan, 2002; pp. 3–39. [Google Scholar]
- Musselman, R.C.; Lefohn, A.S.; Massman, W.J.; Heath, R.L. A critical review and analysis of the use of exposure- and flux-based ozone indices for predicting vegetation effects. Atmos. Environ. 2006, 40, 1869–1888. [Google Scholar] [CrossRef]
- Heath, R.L.; Lefohn, A.S.; Musselman, R.C. Temporal processes that contribute to nonlinearity in vegetation responses to ozone exposure and dose. Atmos. Environ. 2009, 43, 2919–2928. [Google Scholar] [CrossRef]
- Pleijel, H.; Danielsson, H.; Karlsson, G.P.; Gelang, J.; Karlsson, P.E.; Selldén, G. An ozone flux-response relationship for wheat. Environ. Pollut. 2000, 109, 453–462. [Google Scholar] [CrossRef]
- Büker, P.; Feng, Z.; Uddling, J.; Briolat, A.; Alonso, R.; Braun, S.; Elvira, S.; Gerosa, G.; Karlsson, P.E.; Le Thiec, D.; et al. New flux based dose-response relationships for ozone for European forest tree species. Environ. Pollut. 2015, 206, 163–174. [Google Scholar] [CrossRef] [PubMed]
- CLRTAP. Mapping critical levels for vegetation. Chapter III of Manual on methodologies and criteria for modelling and mapping critical loads and levels and air pollution effects, risks and trends. 2017. UNECE Convention on Long-range Transboundary Air Pollution. Available online: www.icpmapping.org (accessed on 5 May 2019).
- Larcher, W. The exchange of carbon dioxide and oxygen. In Physiological Plant Ecology, 4th ed.; Larcher, W., Ed.; Springer: Berlin/Heidelberg, Germany, 2003; pp. 91–100. [Google Scholar]
- Jarvis, P.G. The interpretation of the variations in leaf water potential and stomatal conductance found in canopies in the field. Philos. Trans. R. Soc. Lond. B. Biol. Sci. 1976, 273, 593–610. [Google Scholar] [CrossRef]
- Grüters, U.; Fangmeier, A.; Jäger, H.-J. Modelling stomatal responses of spring wheat (Triticum aestivum L. cv. Turbo) to ozone and different levels of water supply. Environ. Pollut. 1995, 87, 141–149. [Google Scholar] [CrossRef]
- Emberson, L.D.; Wieser, G.; Ashmore, M.R. Modelling of stomatal conductance and ozone flux of Norway spruce: Comparison with field data. Environ. Pollut. 2000, 109, 393–402. [Google Scholar] [CrossRef]
- Hoshika, Y.; Hajima, T.; Shimizu, Y.; Takigawa, M.; Omasa, K. Estimation of stomatal ozone uptake of deciduous trees in East Asia. Ann. For. Sci. 2011, 68, 607–616. [Google Scholar] [CrossRef]
- Hoshika, Y.; Paoletti, E.; Omasa, K. Parameterization of Zelkova serrata stomatal conductance model to estimate stomatal ozone uptake in Japan. Atmos. Environ. 2012, 55, 271–278. [Google Scholar] [CrossRef]
- Hoshika, Y.; Watanabe, M.; Inada, N.; Koike, T. Modeling of stomatal conductance for estimating ozone uptake of Fagus crenata under experimentally enhanced free-air ozone exposure. Water Air Soil Pollut. 2012, 223, 3893–3901. [Google Scholar] [CrossRef]
- Azuchi, F.; Kinose, Y.; Matsumura, T.; Kanomata, T.; Uehara, Y.; Kobayashi, A.; Yamaguchi, M.; Izuta, T. Modeling stomatal conductance and ozone uptake of Fagus crenata grown under different nitrogen loads. Environ. Pollut. 2014, 184, 481–487. [Google Scholar] [CrossRef] [PubMed]
- Kinose, Y.; Azuchi, F.; Uehara, Y.; Kanomata, T.; Kobayashi, A.; Yamaguchi, M.; Izuta, T. Modeling of stomatal conductance to estimate stomatal ozone uptake by Fagus crenata, Quercus serrata, Quercus mongolica var. crispula and Betula platyphylla. Environ. Pollut. 2014, 194, 235–245. [Google Scholar] [CrossRef] [PubMed]
- Wittig, V.E.; Ainsworth, E.A.; Long, S.P. To what extent do current and projected increases in surface ozone affect photosynthesis and stomatal conductance of trees? A meta-analytic review of the last 3 decades of experiments. Plant Cell Environ. 2007, 30, 1150–1162. [Google Scholar] [CrossRef] [PubMed]
- Novak, K.; Schaub, M.; Fuhrer, J.; Skelly, J.M.; Hug, C.; Landolt, W.; Bleuler, P.; Kräuchi, N. Seasonal trends in reduced leaf gas exchange and ozone-induced foliar injury in three ozone sensitive woody plant species. Environ. Pollut. 2005, 136, 33–45. [Google Scholar] [CrossRef] [PubMed]
- Nakashizuka, T.; Iida, S. Composition, dynamics and disturbance regime of temperate deciduous forests in Monsoon Asia. Vegetatio 1995, 121, 23–30. [Google Scholar] [CrossRef]
- Koike, T. Leaf structure and photosynthetic performance as related to the forest succession of deciduous broad-leaved trees. Plant Species Biol. 1988, 3, 77–87. [Google Scholar] [CrossRef]
- Kohno, Y.; Matsumura, H.; Ishii, T.; Izuta, T. Establishing critical levels of air pollutants for protecting East Asian vegetation—A challenge. In Plant Responses to Air Pollution and Global Change; Omasa, K., Nouchi, I., De Kok, L.J., Eds.; Springer: Tokyo, Japan, 2005; pp. 243–250. [Google Scholar]
- Yamaguchi, M.; Watanabe, M.; Matsumura, H.; Kohno, Y.; Izuta, T. Experimental studies on the effects of ozone on growth and photosynthetic activity of Japanese forest tree species. Asian J. Atmos. Environ. 2011, 5, 65–78. [Google Scholar] [CrossRef]
- Brown, K.A.; Roberts, T.M. Effects of ozone on foliar leaching in Norway spruce (Picea abies L. Karst): Confounding factors due to NOx production during ozone generation. Environ. Pollut. 1988, 55, 55–73. [Google Scholar] [CrossRef]
- Laisk, A.; Kull, O.; Moldau, H. Ozone concentration in leaf intercellular air spaces is close to zero. Plant Physiol. 1989, 90, 1163–1167. [Google Scholar] [CrossRef] [PubMed]
- Massman, W.J. A review of the molecular diffusivities of H2O, CO2, CH4, CO, O3, SO2, NH3, N2O, NO and NO2 in air, O2 and N2 near STP. Atmos. Environ. 1998, 32, 1111–1127. [Google Scholar] [CrossRef]
- Webb, R.A. Use of the boundary line in the analysis of biological data. J. Hortic. Sci. 1972, 47, 309–319. [Google Scholar] [CrossRef]
- Rawlings, J.O.; Lesser, V.M.; Dassel, K. Statistical approaches to assessing crop losses. In Assessment of Crop Loss from Air Pollutants; Heck, W.W., Taylor, O.C., Tingey, D.T., Eds.; Elsevier Science Publishers: Essex, UK, 1988; pp. 389–416. [Google Scholar]
- Lombardozzi, D.; Sparks, J.P.; Bonan, G. Integrating O3 influences on terrestrial processes: Photosynthetic and stomatal response data available for regional and global modeling. Biogeosciences 2013, 10, 6815–6831. [Google Scholar] [CrossRef]
- Yonekura, T.; Honda, Y.; Oksanen, E.; Yoshidome, M.; Watanabe, M.; Funada, R.; Koike, T.; Izuta, T. The influences of ozone and soil water stress, singly and in combination, on leaf gas exchange rates, leaf ultrastructural characteristics and annual ring width of Fagus crenata seedlings. J. Jpn. Soc. Atmos. Environ. 2001, 36, 333–351. [Google Scholar]
- Coleman, M.D.; Isebrands, J.G.; Dickson, R.E.; Karnosky, D.F. Photosynthetic productivity of aspen clones varying in sensitivity to tropospheric ozone. Tree Physiol. 1995, 15, 585–592. [Google Scholar] [CrossRef] [PubMed]
- Hoshika, Y.; Carriero, G.; Feng, Z.; Zhang, Y.; Paoletti, E. Determinants of stomatal sluggishness in ozone-exposed deciduous tree species. Sci. Tot. Environ. 2014, 481, 453–458. [Google Scholar] [CrossRef]
- Zhang, W.; Feng, Z.; Wang, X.; Niu, J. Responses of native broadleaved woody species to elevated ozone in subtropical China. Environ. Pollut. 2012, 163, 149–157. [Google Scholar] [CrossRef] [PubMed]
- Matyssek, R.; Sandermann, H.; Wieser, G.; Booker, F.; Cieslik, S.; Musselman, R.; Ernst, D. The challenge of making ozone risk assessment for forest trees more mechanistic. Environ. Pollut. 2008, 156, 567–582. [Google Scholar] [CrossRef]
- Dizengremel, P.; Thiec, D.L.; Hasenfratz-Sauder, M.-P.; Vaultier, M.-N.; Bagard, M.; Jolivet, Y. Metabolic-dependent changes in plant cell redox power after ozone exposure. Plant Biol. 2009, 11, 35–42. [Google Scholar] [CrossRef]
- Matyssek, R.; Bytnerowicz, A.; Karlsson, P.-E.; Paoletti, E.; Sanz, M.; Schaub, M.; Wieser, G. Promoting the O3 flux concept for European forest trees. Environ. Pollut. 2007, 146, 587–607. [Google Scholar] [CrossRef]
- Long, S.P.; Naidu, S.L. Effects of oxidants at the biochemical, cell and physiological levels, with particular reference to ozone. In Air Pollution and Plant Life, 2nd ed.; Bell, J.N.B., Treshow, M., Eds.; John Wiley & Sons Ltd.: Chichester, UK, 2002; pp. 69–88. [Google Scholar]
- Wieser, G.; Matyssek, R. Linking ozone uptake and defense towards a mechanistic risk assessment for forest trees. New Phytol 2007, 174, 7–9. [Google Scholar] [CrossRef]
- Bortier, K.; Ceulemans, R.; De Temmerman, L. Effects of ozone exposure on growth and photosynthesis of beach seedlings (Fagus sylvatica). New Phytol 2000, 146, 271–280. [Google Scholar] [CrossRef]
- Oksanen, E. Responses of selected birch (Betula pendula Roth) clones to ozone change over time. Plant Cell Environ. 2003, 26, 875–886. [Google Scholar] [CrossRef] [PubMed]
- Uddling, J.; Karlsson, P.E.; Glorvigen, A.; Sellden, G. Ozone impairs autumnal resorption of nitrogen from birch (Betula pendula) leaves, causing an increase in whole-tree nitrogen loss through litter fall. Tree Physiol. 2006, 26, 113–120. [Google Scholar] [CrossRef] [PubMed]
© 2019 by the authors. Licensee MDPI, Basel, Switzerland. This article is an open access article distributed under the terms and conditions of the Creative Commons Attribution (CC BY) license (http://creativecommons.org/licenses/by/4.0/).