Article

Does Drought Stress on Seedlings Have Longer Term Effects on Sapling Phenology, Reshooting, Growth and Plant Architecture in Quercus robur, Q. petraea and Their Morphological Intermediates?

by
Kristine Vander Mijnsbrugge
1,*,
Arion Turcsan
1,2,3,
Stefaan Moreels
1,
Michiel Van Goethem
1,†,
Steven Meeus
4 and
Beatrijs Van der Aa
1
1
Department of Forest Ecology and Management, Research Institute for Nature and Forest, 9500 Geraardsbergen, Belgium
2
Department of Biometrics and Agricultural Informatics, Szent István University, 1118 Budapest, Hungary
3
Department of Forest Reproductive Material and Plantation Management, Institute of Silviculture and Forest Protection, West-Hungarian University, 9400 Sopron, Hungary
4
Department of Agro- and Biotechnology, School of Technology, Odisee University College, 9100 Sint-Niklaas, Belgium
*
Author to whom correspondence should be addressed.
Current address: Polenlaan 32, 9190 Stekene, Belgium.
Forests 2019, 10(11), 1012; https://doi.org/10.3390/f10111012
Submission received: 6 October 2019 / Revised: 28 October 2019 / Accepted: 8 November 2019 / Published: 13 November 2019
(This article belongs to the Special Issue Effects of Climate Change and Air Pollutants on Forest Tree Species)

Abstract

:
Background and Objectives: Summer droughts are expected to increase in central and western Europe both in terms of frequency and intensity, justifying studies on longer term legacies of drought stress on tree species and their hybrids. Materials and Methods: We studied the longer-term after effects of water withholding and re-watering in the first growing season of potted seedlings from the sympatric species Quercus robur L., Q. petraea (Matt.) Liebl. and their morphological intermediates. Phenology, growth, and plant architecture were examined after a cut-back of the stems at the end of the third growing season. Results: The legacy of the first-year water limitation is faded in the phenological response. Nonetheless, leaf senescence occurred later in offspring from Q. robur than in offspring from Q. petraea at the end of the fourth growing season and leafing out tended to be later in the subsequent growing season. Offspring from the intermediate forms displayed variable phenological responses. Height and radial growth were still affected by the drought stress in a taxon-dependent way, with the offspring from Q. petraea displaying growth reduction both in height and diameter, whereas offspring from Q. robur did not show any differences anymore between control and treated plants, demonstrating better post-stress recovery in Q. robur. Offspring from morphological intermediates responded again in a variable way. Although the number of reshoots after cutting back the stems was not affected anymore by the drought treatment in the first growing season, the number of side shoots on the reshoots was still reduced in the drought treated group of plants, independent of the taxon of the mother tree. Conclusions: Together, our results demonstrate the longer-lasting effects of drought stress on oak saplings with regard to growth and plant architecture, with the first being taxon dependent.

1. Introduction

Climate change will affect forest ecosystems worldwide. For European forests, an increase in frequency and intensity of drought might become a major constraint for their productivity and species composition [1,2]. Water limitation together with raising temperatures, are considered to increase tree mortality in temperate forests [3]. As forest ecosystems play a crucial role in the water-cycle, and are the key capital of carbon stocks world-wide, forest declines due to climate change induced droughts could have serious repercussions on both the global water balance and the global carbon cycle [4,5]. The response of tree species and provenances to drought includes not only their ability to overcome variable periods of water limitation, but also the way that they recover after the drought stress, including longer term legacies [6].
The genus Quercus harbors approximately 415 species across the northern hemisphere [7]. Quercus robur and Q. petraea are two sympatric tree species with a pan-European distribution, implying substantial sylvicultural relevance mainly in western and central European forest ecosystems, both in terms of ecological and economic aspects. Both species are considered to be drought tolerant in their natural range [8,9]. Hence, it is suggested that drought sensitive species, such as beech (Fagus sylvatica) or spruce (Picea abies), will be replaced by oaks at warm and dry growth sites in Europe [10]. When compared with each other, differences are, in any case, small, but Q. robur is advocated to be the more water demanding species [11,12], being more sensitive to drought stress [13]. In natural conditions, Q. robur thrives on nutrient rich and humid sites, while Q. petraea can be found in dryer, warmer, and less nutrient rich sites [14].
Periods of drought affect adaptive traits of trees, such as growth and phenology. A detailed correlation study between tree-ring widths and climate data in Switzerland revealed that several dominant forest species (Abies alba, P. abies, F. sylvatica) reacted on periods of drought with radial growth reduction already in the year of water limitation itself [15]. In the studied Quercus spp., the growth decreases were more likely to occur in the years following the drought stress [15]. Both oak species belong to the anisohydric species, being able to sustain photosynthesis under moderate drought mainly by regulating stomatal conductance [9,16]. Under more severe drought, a decrease in the net-assimilation was found to be mainly due to stomatal closure rather than a decrease in photosynthetic capacity [17], and it was suggested that this capacity leads to the observed delay of drought-induced effects in these oak species [18]. Apart from the affected growth traits, oaks may react on drought periods by altering the timing of several seasonal life cycle events. Several phenological effects of water limitation have been described. Height and radial growth stopped earlier in dry growing conditions [19,20,21]. Bud burst was advanced in the spring following a growing season with drought stress [22]. A delayed autumnal senescence, together with a delayed bud burst in the subsequent spring, were observed upon re-watering after drought stress in late summer [23].
The most vulnerable phase in a tree’s life cycle is the seedling stage. Hence, understanding drought stress responses in seedlings is essential in the prediction of forest tree growth and survival [24,25]. In Flanders, a significant annual average raise in temperature has been detected with respect to the pre-industrial period and a further raise is predicted in all seasons, including an increase in the number of extremely hot days (heat waves) [26]. For the summer months, the climate scenarios indicate a decrease in average precipitation together with an increase in extreme short rainfall events [26]. The experimental set-up of our experiment mimicked the summer scenario by withholding any watering to potted seedlings from the sympatric species Q. petraea, Q. robur, and their morphological intermediates, interrupted by plentiful re-watering. Short-term effects, up to one year after the drought treatment, have been published before [27]. We were specifically interested in the longer term reactions of oak seedlings upon water limitation, while considering the importance of forest regeneration because adult trees in general display effects of drought up to several years after the event, a phenomenon already described in 1929 [28]. Many experiments with oak seedlings and saplings described in literature do not extend much longer than funding periods for projects, while dendrochronological studies on adult trees indicate that oak responses on experienced drought can last longer [15]. Specifically for oak, periods of drought have been suggested as the triggers for growth reduction [11,29]. Here, we focused on the responses of the treated and non-treated oak saplings up to four years after drought treatment (Figure 1). Our main hypothesis is that severe drought in the first growing season of oak seedlings, followed by plentiful re-watering, might result in longer term responses. For this, we focused on the already described short term responses in the adaptive traits growth and phenology [27], questioning whether these lasted for a longer period, and we additionally looked at the reshooting ability and plant architecture, questioning whether these traits were affected by the drought treatment. As the ecological niches of Q. petraea and Q. robur deviate from each other in terms of water balance and, as both species are known to hybridise spontaneously in nature [30], we hypothesise taxon dependencies of the longer-term responses to drought of seedlings from both species and their morphological intermediates. The study presented here is, to our knowledge, the first experiment dealing with offspring from the four taxa, Q. petrae, Q. robur, and two types of intermediate forms between these two species, all originating from the same natural population (thus implying the same provenance).

2. Materials and Methods

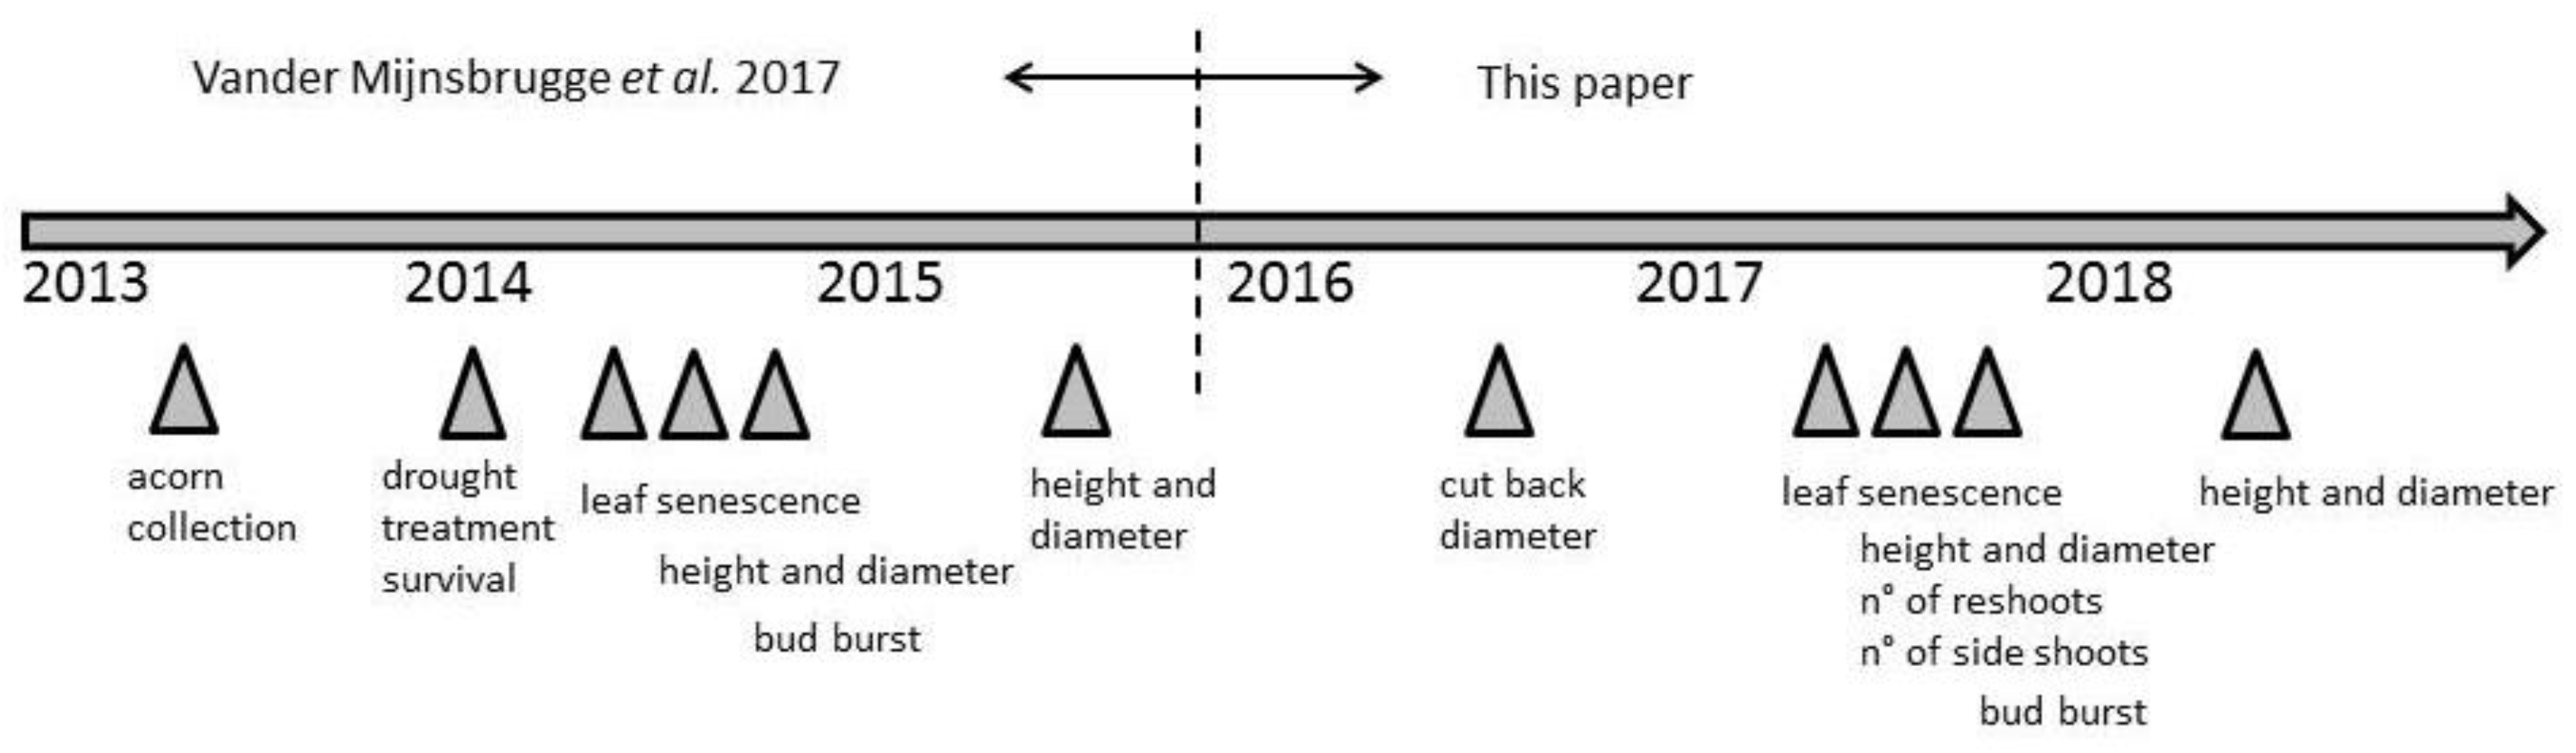
2.1. Source Material and Experimental Set-Up

This study builds upon already published data describing the early responses of Q. petraea, Q. robur and their morphological intermediates upon water limitation and subsequent re-watering (Figure 1) [27]. In short, acorns were collected in 2013 in a natural population that was located in the northern part of Belgium (51°0′57.8556″N, 5°31′57.0384″E), which is considered of local origin [31]. A uniform haplotype, as revealed by a cpDNA analysis, fits in the reconstructed postglacial migration routes [32]. The population consisted of the sympatric species Q. petraea and Q. robur, together with their morphological intermediates [33]. A leaf stalk that was larger than 1 cm and an infructescence stalk smaller than 2 cm was considered as Q. petraea (six mother trees, abbreviation: p). Q. robur showed a leaf stalk smaller than 1 cm and an infructescence stalk larger than 2 cm (six mother trees, abbreviation: r). Two types of intermediates were identified: long leaf stalks (> 1 cm) together with long infructescence stalks (> 2 cm), further called the long stalked intermediates (one mother tree, abbreviation: pr), and short leaf stalks (< 1 cm) together with short infructescence stalks (< 2 cm), further called the short-stalked intermediates (five mother trees, abbreviation: rp).
Germinated seedlings (Table 1) were potted in one-litre pots of 12 × 11 × 11 cm while using standard nursery potting soil (organic matter 20%, pH 5.0–6.5, Electrical Conductivity (EC): 450 µS/cm, dry matter 25%, fertilization: 1.5 kg/m3 powdered compound fertilizer NPK 12 + 14 + 24). In the first two years of the experiment, the plants were grown in a greenhouse with automatic temperature regulation, keeping the greenhouse frost-free in wintertime, but without additional heating during the rest of the year. An automatic grey shade cloth system protected the seedlings from high levels of insolation. In this first year, 2014, two successive periods of total water withholding were imposed on half of the potted seedlings, from DOY 134 till DOY 182 (48 days) and from DOY 217 till DOY 290 (73 days). The other half of the plants (control group) were given water at regular times, according to the visual needs of the seedlings, as judged by experienced greenhouse workers. Growth and phenological responses were monitored in 2014 and 2015 (Figure 1) [27]. A number of seedlings died during or after the drought treatment (Table 1). After the drought treatment, at the end of 2014, seedlings from the treated and non-treated group of plants were randomly intermingled. At the end of 2015, all of the plants were repotted to four-litre pots (21 cm diameter × 20 cm height) while using standard nursery potting soil and they were transferred to an out-door container field, which is located next to the experimental greenhouse, with an automatic sprinkler system for watering. The pots were again randomly intermingled. The pots stayed at the container field during 2017 and 2018 and were watered with the automatic sprinkler system operated by experienced greenhouse workers. In the winter of 2017–2018, they were again randomly intermingled.

2.2. Measurements and Scoring

At the end of 2016 the height and the diameter (1 cm above soil level) of all plants (control and stressed group) were measured (Figure S1) and, at this point, all of the plants were cut back with a pruning scissors at soil level for a wood anatomical analysis (will be published elsewhere). Most of the plants resprouted in the beginning of 2017 (Table 1). At the end of 2017, the number of reshoots per plant were counted, and also the number of side shoots on the reshoots. From each reshoot, the height and the diameter (1 cm above soil level) were measured at the end of 2017 and at the end of 2018. This means that for each plant the total height of each stem that sprouted on the stump was measured at the end of 2017 and at the end of 2018. The basal area was calculated from the diameter measurements. The leaf senescence on the whole plants was scored following an six-level scoring protocol (Table 2) on DOY 325 in 2017. The bud burst of the apical buds of all reshoots per plant were scored following a six-level scoring protocol (Table 2) on DOY 116 in 2018.

2.3. Data Analysis

All of the statistical analyses were performed in the open source software R 3.1.2 [34].
The scorings of bud burst in 2018 (from buds in winter rest to unfolded leaves, Table 3) were modelled using cumulative logistic regression in the package ordinal [35]. The command clmm in the package ordinal fits a model for the cumulative probability of the ith observation falling in the jth category or below, with the i indexing all observations and j indexing the response categories. This cumulative probability is the probability to maximally have reached a given category of the ordinal response variable. The probability of having reached maximally for instance bud burst score 3 equals the probability of having reached scores 1, 2, or 3.
The taxon of the mother tree (T, factor variable with four levels: Q. petraea, Q. robur and the two types of morphological intermediates) was in the fixed part of the model in interaction with the treatment in 2014 (S, factor variable with two levels: treated plants and control plants). The interaction term allowed for a variable response between the offspring from mother trees belonging to different taxa upon the treatment in 2014. Additionally, the sum of the heights of all reshoots on one plant in the winter of 2017–2018 (H) was included as a covariate in the fixed part of the model. The random part of the model consisted of the mother plant from which the acorns were collected.
The chance (p) to have reached at least a given phenological score level on the day of observation was calculated following a cumulative logistic regression:
log(p/(1-p)) = αT − βTT − βSS − βTSTS − βHH
with αT as an estimated threshold value for the passing on from one level of the phenological variable to the next, and the β’s as the estimated parameters of the fitted model. T was the taxon of the mother tree (r: Q. robur, p: Q. petraea, pr: long stalked intermediate, rp: short stalked intermediate), S was the treatment in 2014, and H was the sum of the reshoot heights per plant in the winter of 2017–2018.
The number of reshoots per plant in the winter of 2017–2018 was modelled while using a generalised poisson mixed model with the package lme4 [36]. Modelling the raw count data would result in a model displaying underdispersion because of the absence of zero’s in the count data. Therefore, we modelled the response variable as the count of reshoots per plant—1 (NR). Again, the taxon of the mother tree (T) was in the fixed part of the model in interaction with the treatment in 2014 (S). Here, the diameter of the stem that was cut back in the winter of 2016–2017 (D) was included as a covariable in the fixed part of the model. The random part of the model consisted of the mother plant from which the acorns were collected.
log(NR) = α + βTT + βSS + βTSTS + βDD
with α as the estimated intercept.
Modelling the number of side shoots on all reshoots per plant (NS) while using a generalised poisson mixed model would result in an overdispersion because the standard deviation was higher than the mean. Therefore, this count variable was modelled with a quasipoisson mixed model in the package MASS [37]. A similar model structure was followed as for the reshoot counts per plant, except that not diameter of the original stem before cutting back was used in the fixed part, but the sum of the heights of all reshoots of a plant at the end of 2017 (H). The random part of the model consisted of the mother plant from which the acorns were collected.
log(NS) = α + βTT + βSS + βTSTS + βHH
Both basal area and height growth (I) were analysed with linear mixed models in the package lme4 [36]. All of the measurements (height) and calculations (area) on the different reshoots per plant were summed per plant. The measurements (height) and calculations (area) from the end of 2017 and from the end of 2018 were taken together in a model for height growth and in a model for basal area. Therefore, a covariate year (Y, factor variable with two levels, one for each winter) was added, next to the treatment in 2014 (S) in the fixed part of the models. Separate models were run for saplings that were derived from each taxon of mother trees (four models for height growth and four models for basal area). Models were run with “restricted maximum likelihood”. The random part of the models consisted of the mother plant from which acorns were collected and the individual seedling nested in mother plant, to account for repeated measurements (2017 and 2018) on the same plants.
I = α + βSS + βYY
Confidence intervals were calculated based on the variance covariance matrix of the models in all cases.

3. Results

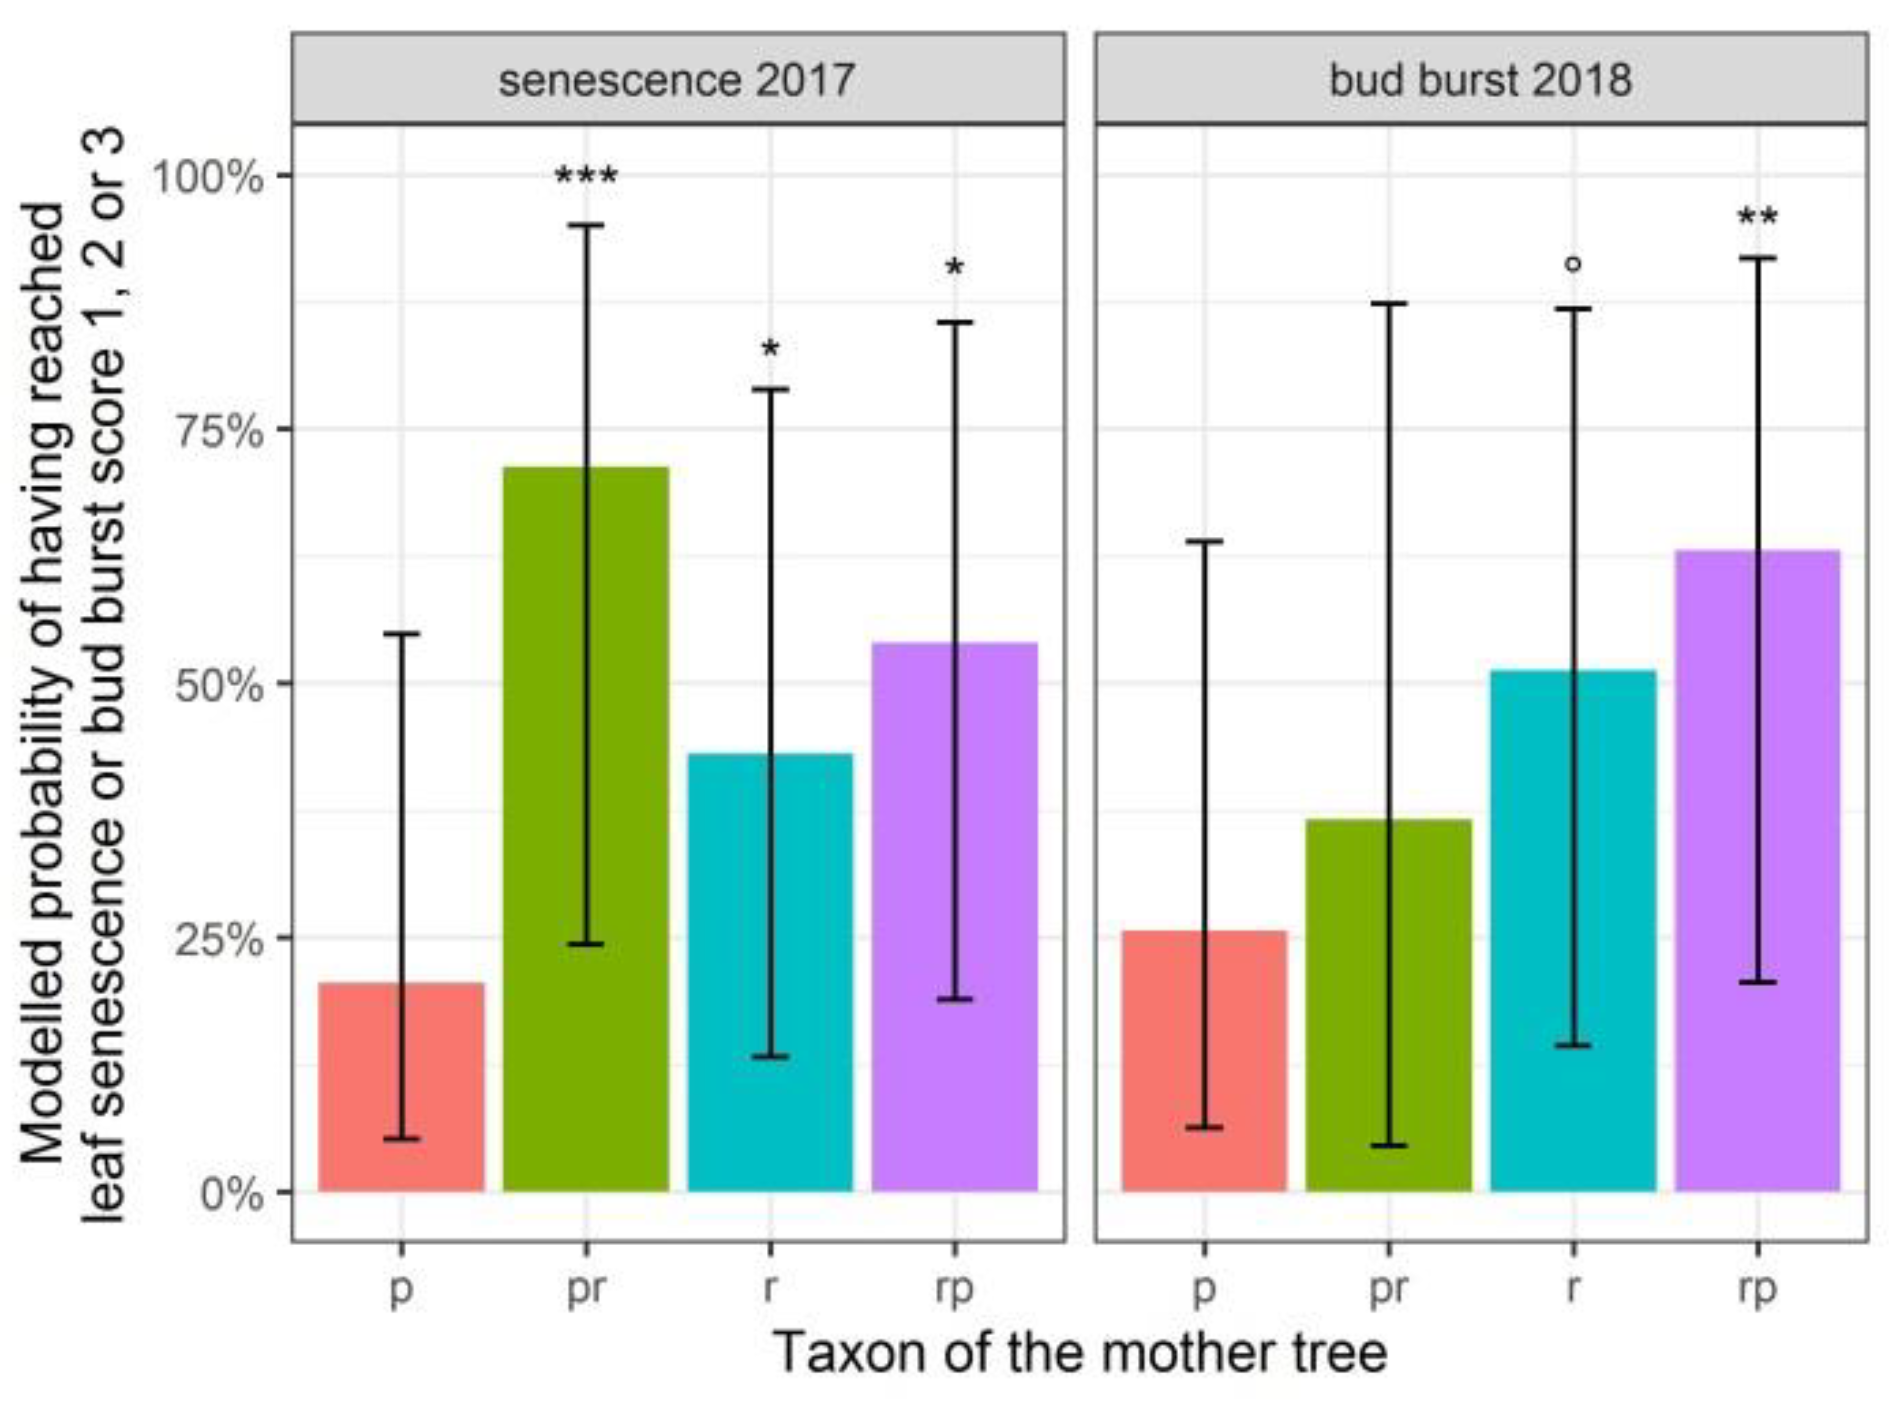
3.1. Leaf Senescence and Bud Burst

The treatment of water limitation in 2014 did not affect leaf senescence in 2017 or bud burst in 2018 anymore (Table 3: treatment and treatment in interaction with the taxon of the mother trees are not significant in the model statistics). Additionally, bud burst appeared independent of the plant height. Only offspring from the short stalked intermediate displayed a bud burst significantly later than offspring from Q. petraea (p-value of 0.005), whereas the offspring from Q. robur showed a tendency to burst buds later than offspring from Q. petraea (not significant, a p-value of 0.074) (Figure 2, a higher probability of having reached bud burst score levels 1, 2, or 3 implies a lower probability of having reached a higher score level, indicating a later bud burst).

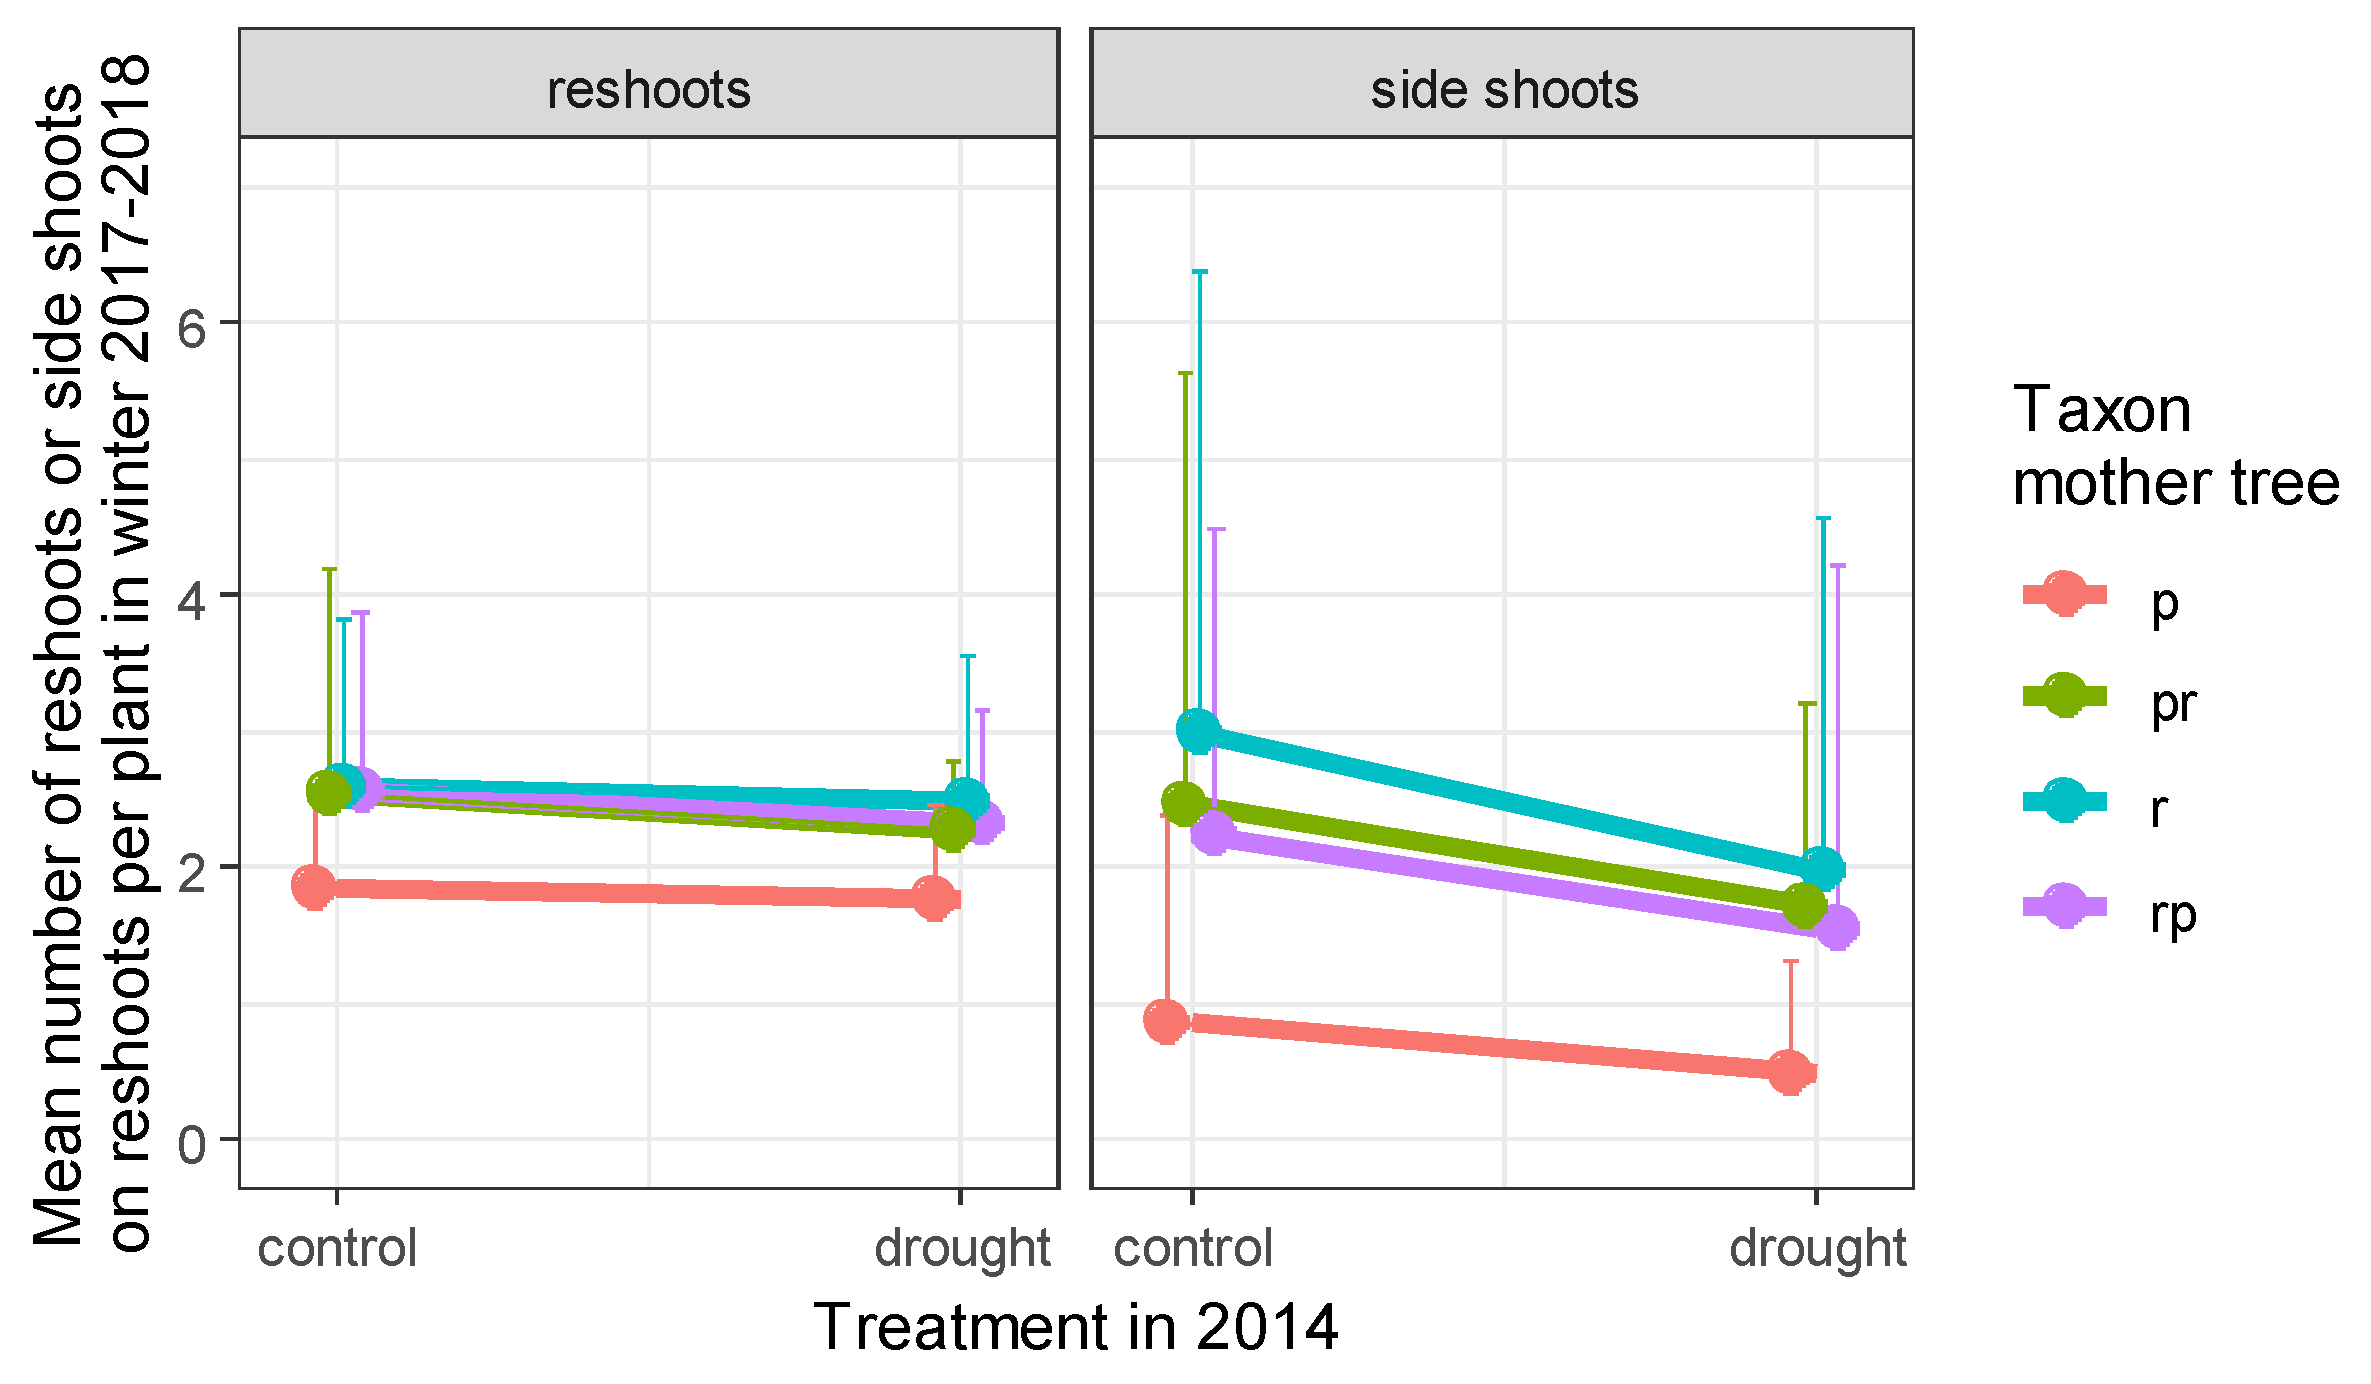
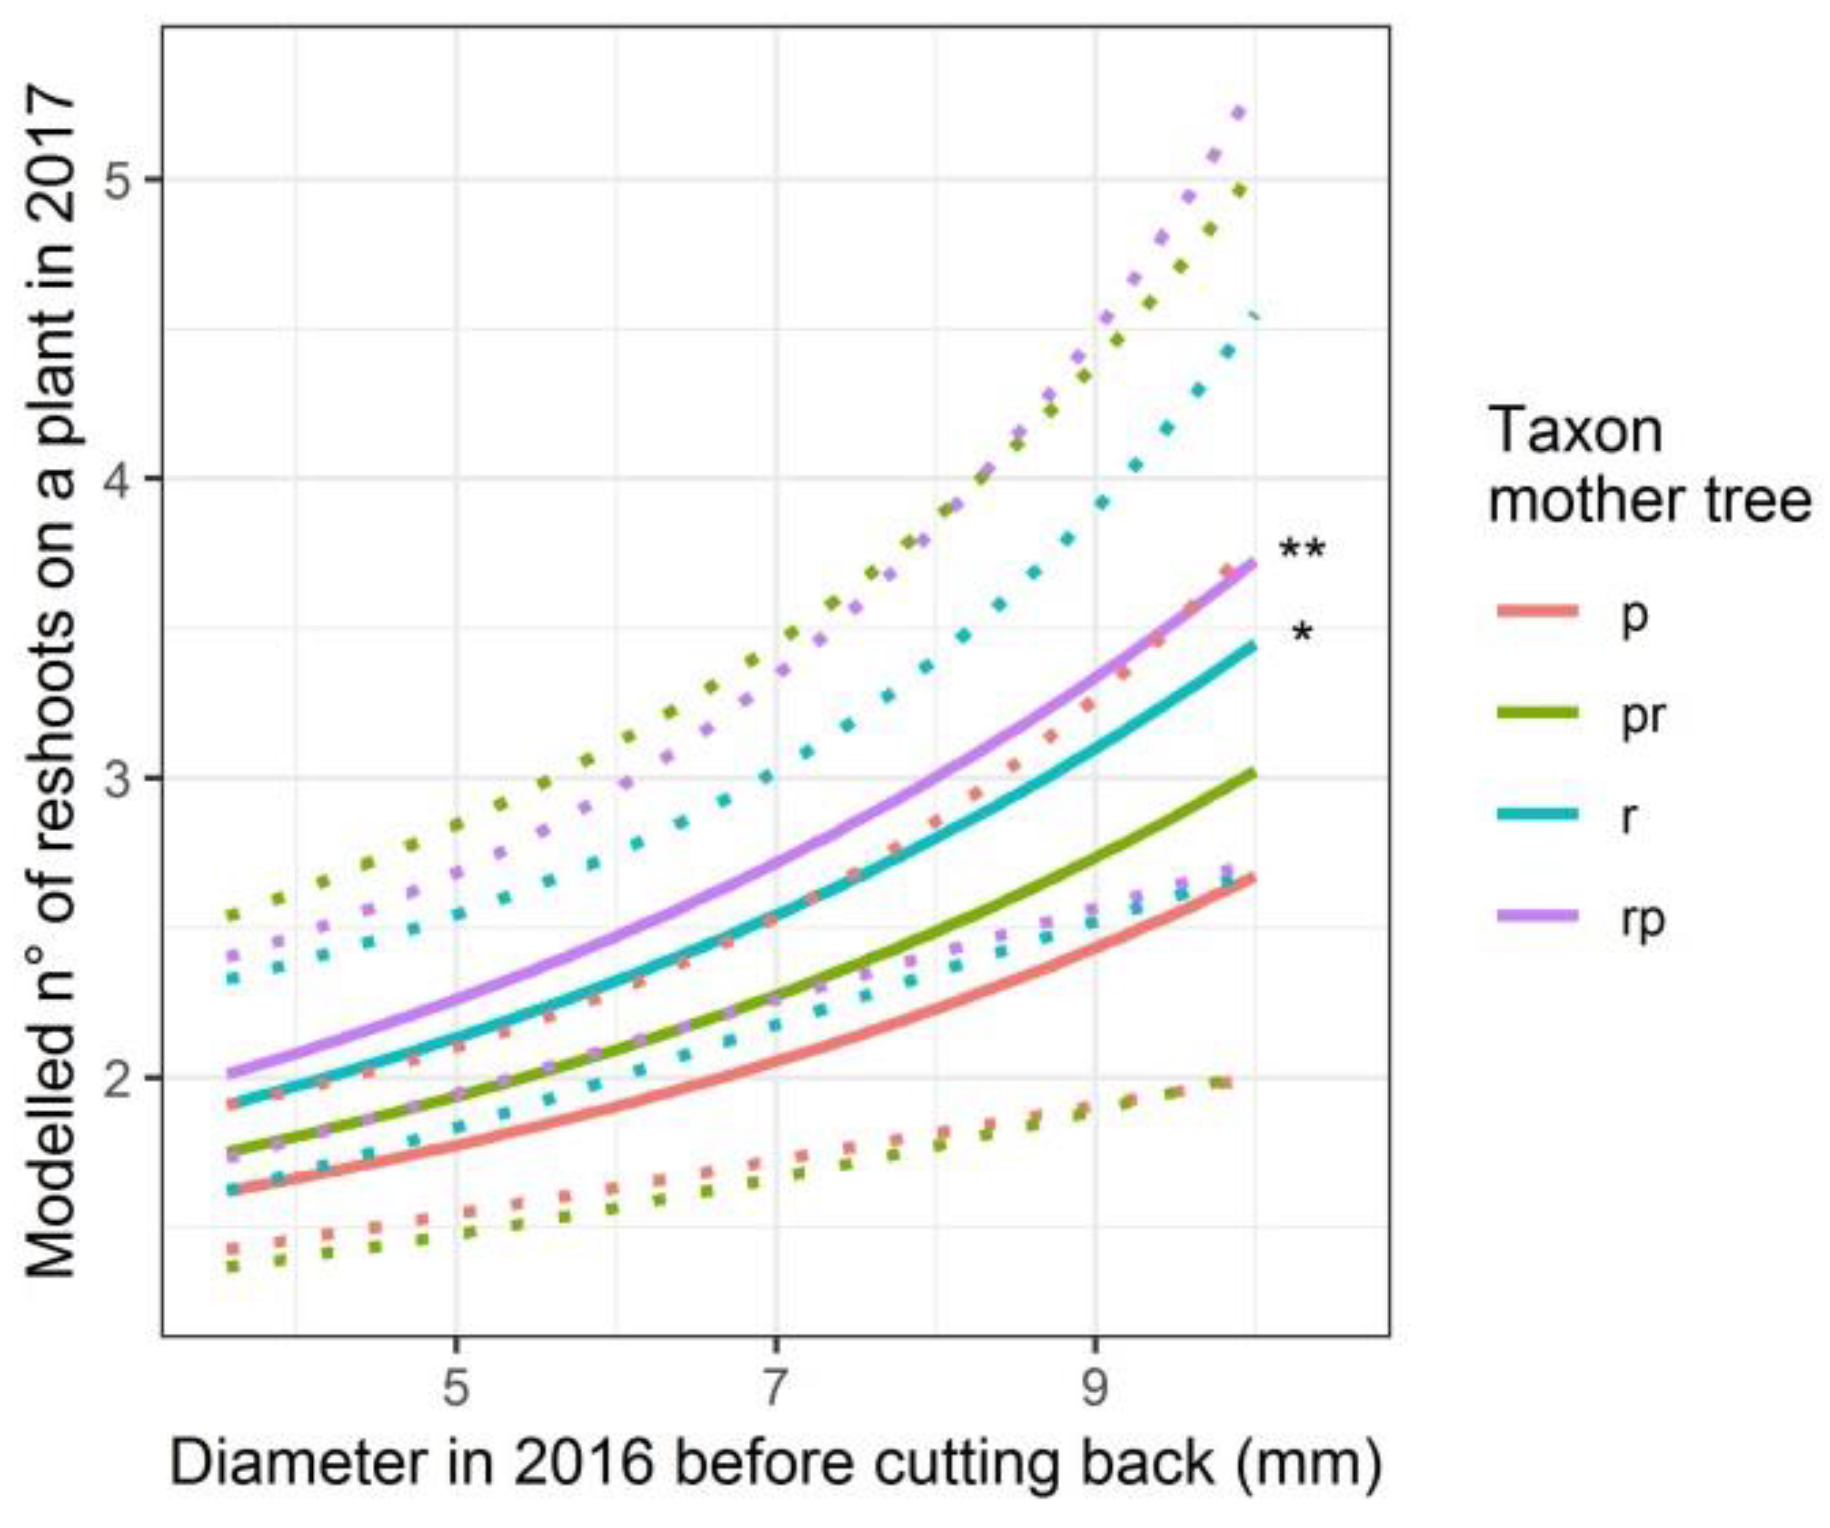
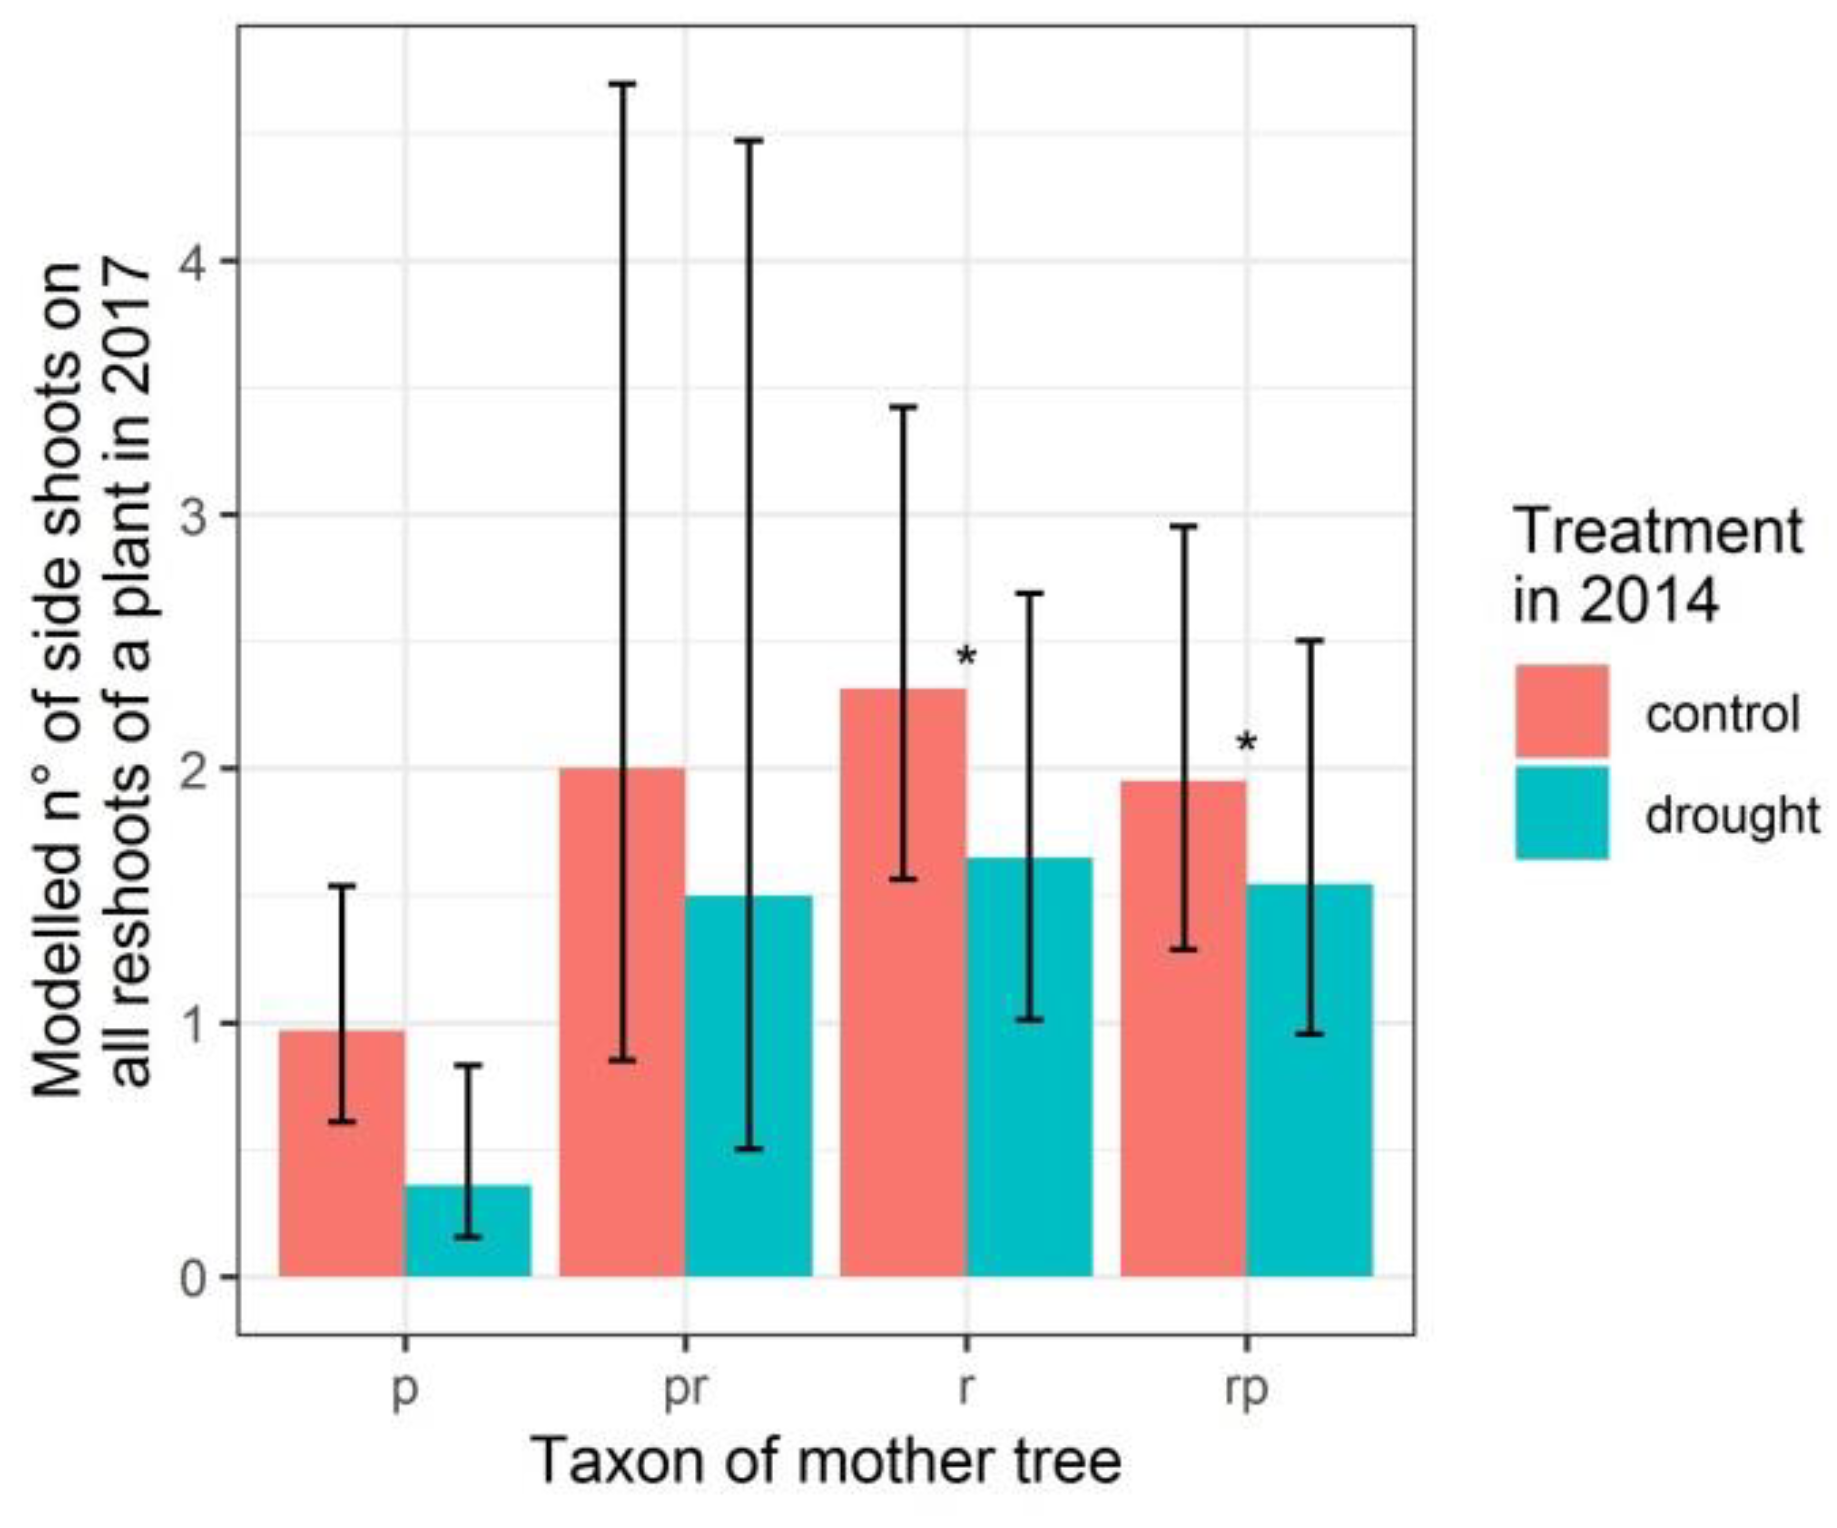
3.2. Number of Reshoots and Number of Side Shoots on Reshoots Per Plant

The number of reshoots and the number of side shoots on all reshoots on a plant after cutting back the stems were counted to assess the putative influence of the drought treatment in 2014 on the plant architecture (Figure 3).
In the modelling analysis, the treatment in 2014 appeared not to have affected the number of reshoots per plant after cutting back the stems in the winter of 2016–2017 (treatment and treatment in interaction with the taxon of the mother trees are not significant in the model statistics, Table 4 and Figure 4). The offspring from Q. robur and from the short stalked intermediate resprouted with significantly more reshoots as compared to the offspring from Q. petraea (p-values of 0.038 and 0.003 respectively, Table 4). In addition, the larger the diameter of the stems before cutting back (winter of 2016–2017), the more reshoots appeared (p-value < 0.001) (Table 4).
The treatment in 2014 did significantly affect the number of side shoots on all reshoots per plant at the end of 2017 (p-value of 0.036) (Table 4 and Figure 5). In addition, the offspring from Q. robur and from the short stalked intermediate produced significantly more side shoots on all of the reshoots per plant when compared with the offspring from Q. petraea (p-values of 0.015 and 0.048, respectively, Table 4).

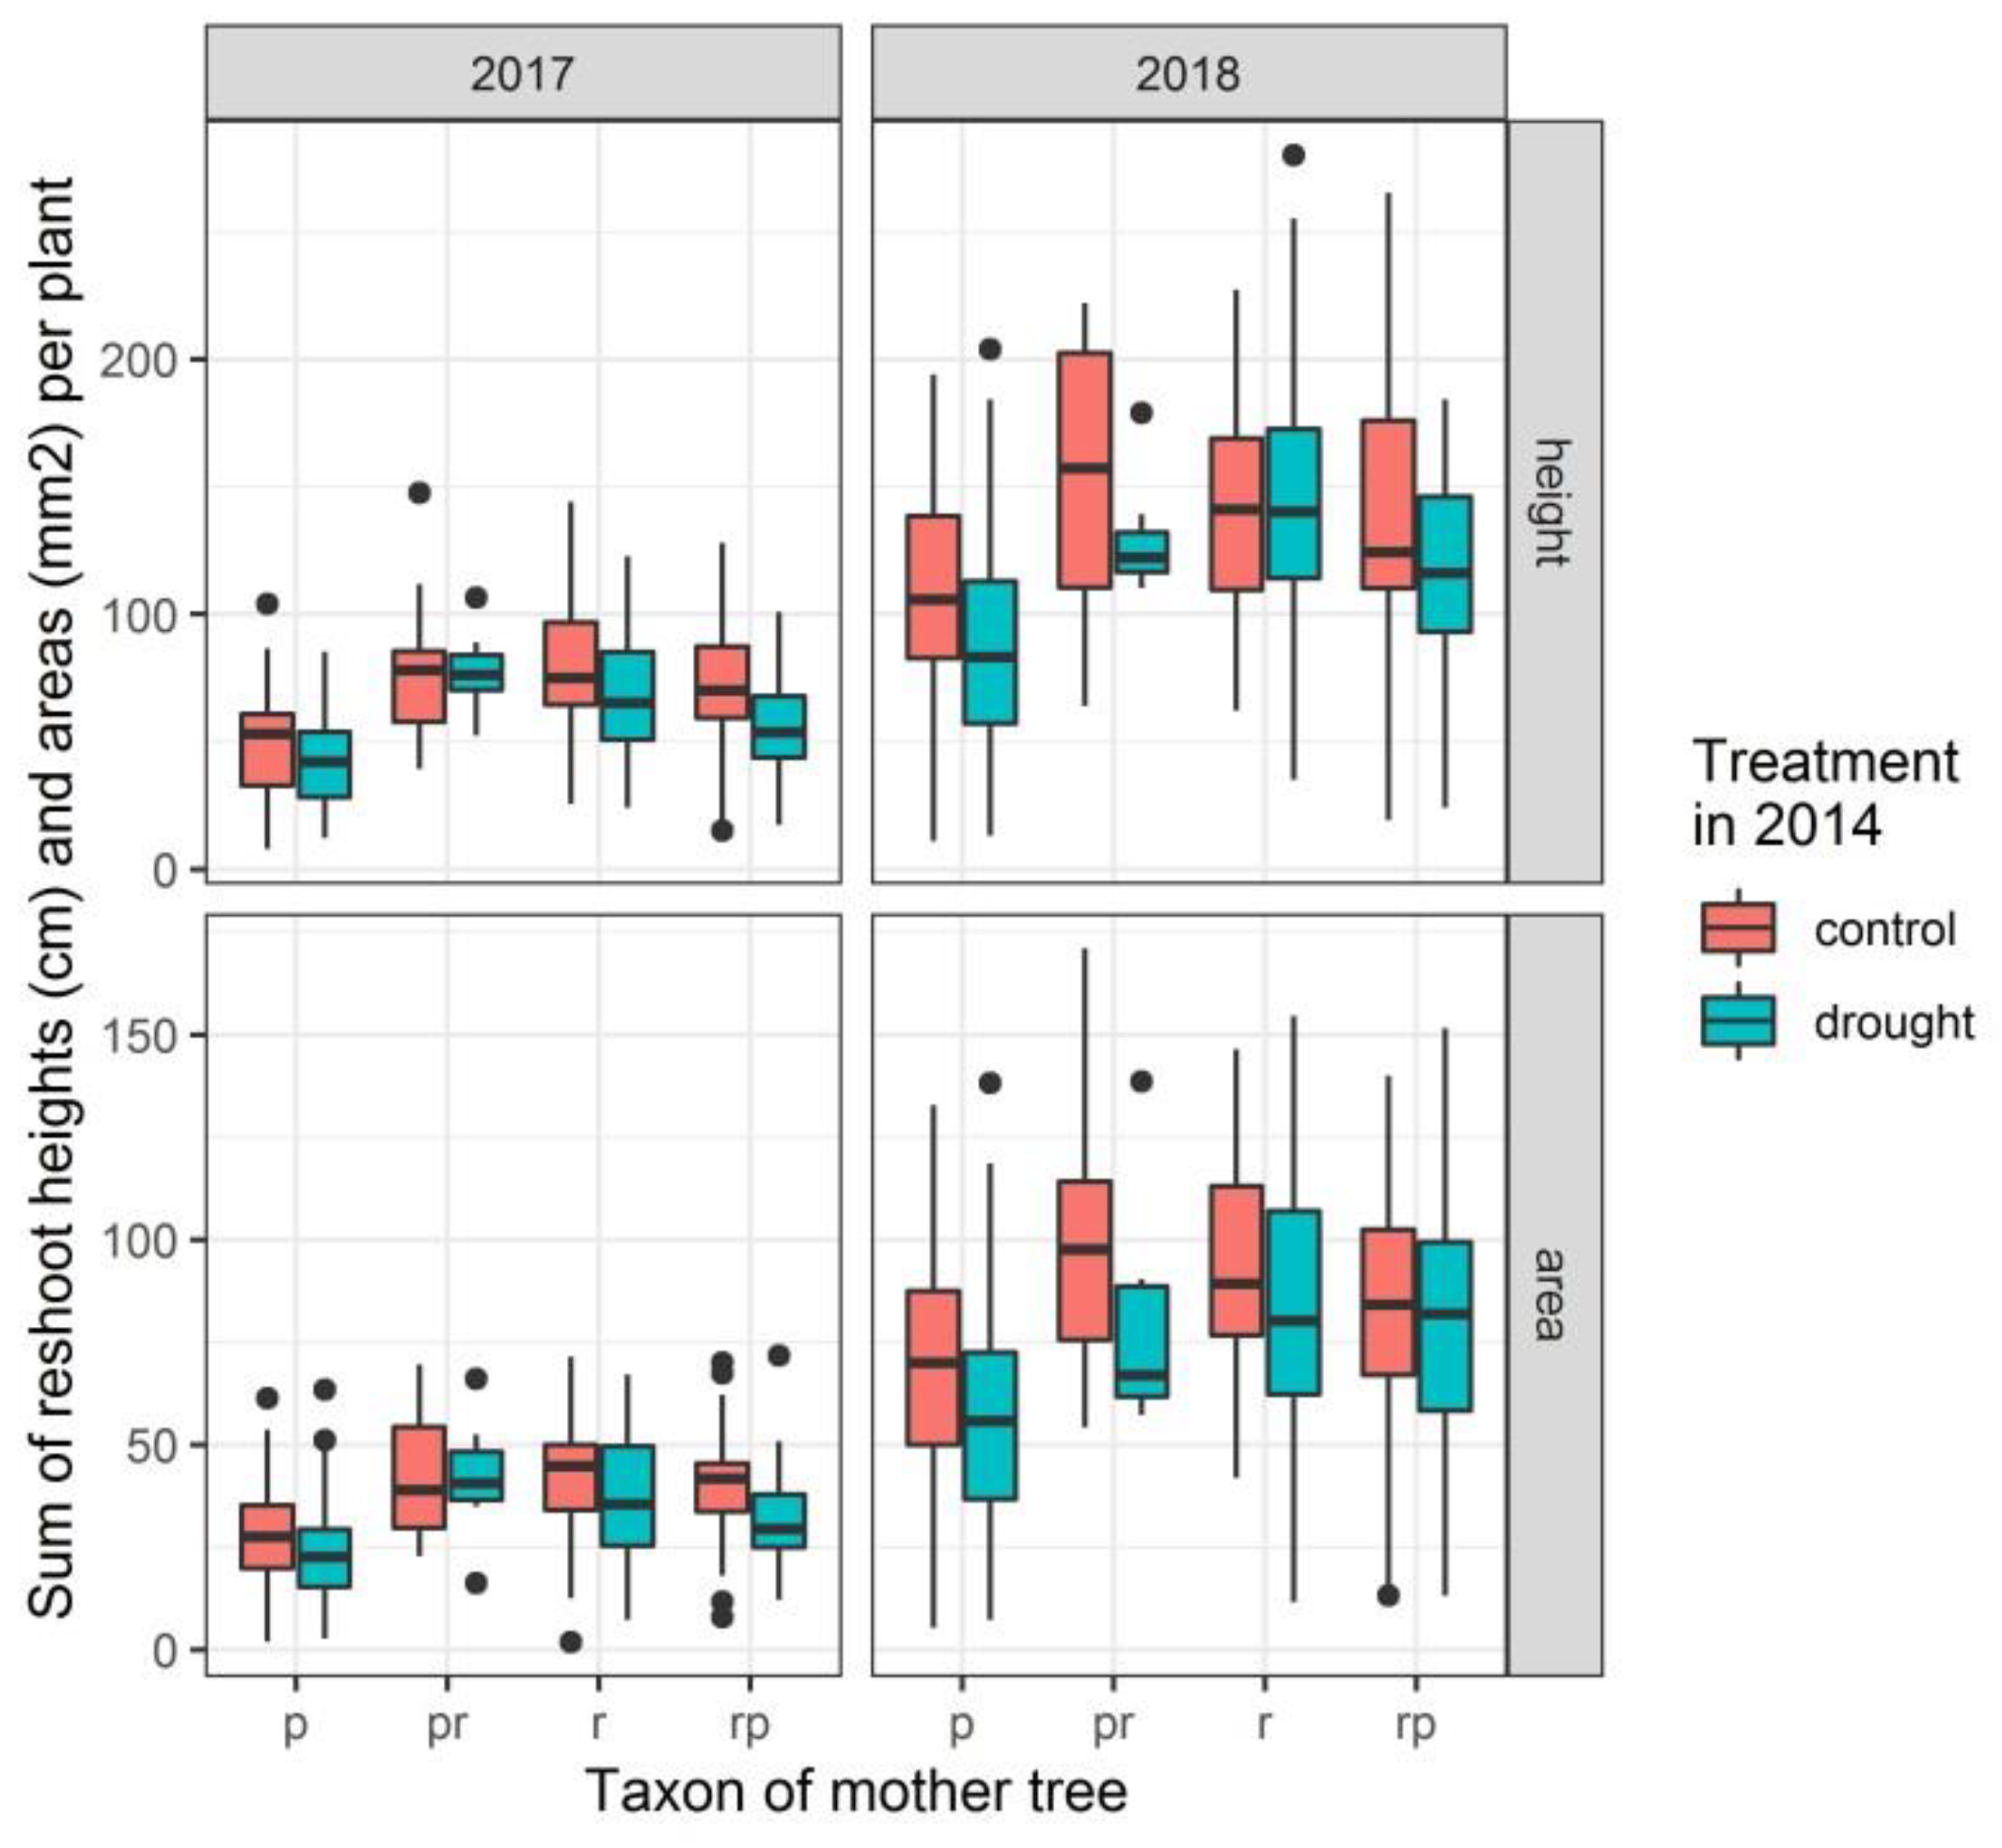
3.3. Height and Radial Growth of the Reshoots

To evaluate the putative longer-term effect of the treatment in 2014 on growth, the heights of all reshoots per plant were measured, and the basal area was calculated from the diameter measurements, in the two years following the cut back of the stems at the end of 2016 (Figure 6).
The sum of the heights of all reshoots per plant in the two years (2017 and 2018) following the cutting back at the end of 2016 was modelled. Only for offspring from Q. petraea and from the short stalked intermediate, a significant difference in height growth was detected between drought treated and control plants (treatment in 2014 significant in the model statistics with p-values of 0.013 and 0.035, respectively) (Table 5).
As for the height growth, the sum of the areas of all reshoots per plant was also modelled. Similar to the height growth, the sum of the areas of all reshoots per plant proved to differ between the treated and non-treated plants for offspring from Q. petraea (p-value of 0.021 for treatment in 2014 in the model statistics, Table 6). Treatment in 2014 was not significant for the offspring from the short stalked intermediate.

4. Discussion

We describe the longer-term consequences of a simulation of the predicted climate change effects, by applying two drought periods, followed by plentiful re-watering in the first growing season of oak seedlings originating from a natural population comprising Q. petraea, Q. robur, and intermediate morphological forms.

4.1. Faded Phenological Responses to Drought

The two water withholding periods with a subsequent re-watering of the oak seedlings in 2014 affected the phenological responses with a delay in leaf senescence in 2014, and a delay of bud burst and an earlier leaf senescence in 2015, all being independent of the taxon of the mother tree [27]. Another two years later and, after cutting back the stems at the end of 2016, no impact on leaf senescence and the subsequent bud burst was detected anymore. Additionally, in contrast to the first two growing seasons (2014 and 2015), we detected a treatment-independent small differentiation in phenological response between offspring from the different taxa in the autumnal leaf senescence in 2017. Leaf senescence in the offspring of Q. robur is later. Offspring from the morphological intermediate forms behaves beyond the variability of the parents, with offspring from the long-stalked intermediate displaying the latest leaf senescence and offspring from the short-stalked intermediate leafing out the latest. Hybrids are known for their ability to express phenotypes that are outside the scope of their parental phenotypes, putatively allowing for extensions of the parental ecological niches [38]. For instance, Rhododendron ponticum in the northern part of its British range hybridised and introgressed with another exotic Rhododendron species, which resulted in enhanced tolerance to low temperatures [39].

4.2. Height and Basal Area

In the first year after the drought treatment, the height and radial growth were reduced in the treated oak seedlings as compared to the control plants, which was dependent on the taxon of the mother tree [27]. Here, we report that following a cut-back of the stems of the saplings after two normally watered growing seasons in 2015 and 2016, the water limitation in 2014 still displayed a legacy in both height and radial growth (basal area) of the reshoots in offspring from Q. petraea, but not in the offspring from Q. robur. The faster disappearance of the retardation of height growth in the drought treated offspring from Q. robur, as compared to the non-treated group of plants, can be related to the results of a defoliation experiment, in which a quicker post-stress recovery in the young plants of Q. robur was detected in comparison with Q. petraea [40]. The effects of defoliation disappeared in the treated group of Q. robur already after one year, whereas the defoliated Q. petraea seedlings still displayed lower leaf biomass and smaller stem diameter increment as compared with the control plants. Therefore, it is suggested that Q. petraea limits water loss under high transpirational demand at the expense of biomass production [40]. The offspring from the long stalked intermediate displayed a strong height and radial growth, both in treated and non-treated plants, without any legacies of the drought stress in 2014. Treatment did still affect the offspring from the short stalked intermediate, but only in the height growth, not in the radial growth (basal area). This variable longer-term response to drought in the offspring from the intermediate forms that differ from the responses displayed by offspring from Q. petraea and Q. robur, could be ascribed to the more hybridogenic origin of the plants, similar to the variable, but drought independent, phenological responses. A trade-off can be hypothesized between a faster growing offspring from Q. robur in the seedling and sapling phase of the trees, which seems to concur with a quicker post-stress recovery of height growth, which provides a competitive advantage in normal growing conditions and a relatively slower youth growth in offspring of Q. petraea concurring with a slower growth recovery, but offering higher chances of survival in less favorable growing conditions. In more stressful conditions, smaller plants may have a higher chance to survive than larger seedlings. This finding might suggest putative shifts in the composition of naturally mixed populations of the studied oak species upon an increase in the duration and the intensity of periods with precipitation deficit.

4.3. Plant Architecture

The drought treatment in 2014 did not leave any traces in the number of reshoots after cutting back the stems at the end of 2016. However, irrespective of the taxon of the mother tree, drought treated seedlings in 2014 resprouted after cutting back the stems at the end of 2016, with less side shoots on the reshoots per plant, even though the number of reshoots per plant was not affected. This difference in responsiveness to drought stress four years after the treatment between the reshoot count and the count of side shoots on these reshoots can be, at least partially, hormonal in origin. Strigolactones are a recently described class of plant hormones that regulate shoot branching in herbaceous [41] and in woody plants [42]. In Arabidopsis thaliana, the strigolactones were shown to cross-talk with the plant hormone ABA, influencing stomatal density and the rate of ABA induced stomatal closure [43]. Our results may suggest a role for strigolactone in the longer-term response of oak seedlings to drought stress, which can be interpreted as a promotion of height growth at the expense of side shoot formation. Although taxon-independent, height growth in this young stage in the life of a tree seems to be favored. Accelerated extension growth, apical dominance, and reduced branching were also found to be typical for plants that were shaded by competitor plants, the so-called “shade avoidance syndrome” [44]. A putative additional effect that has to be mentioned here is that the growth of the potted control plants could have been hampered more than for the potted stressed seedlings in the years following the drought treatment, due to a quicker consumption of soil nutrients. This would mean that growth differentiation due to the legacy of the drought treatment between the control and stressed plants might have been attenuated in our experiment. Independent from the legacy of drought treatment, an influence of the taxon of the mother tree was present in both the reshoot counts as in the counts of the side shoots on the reshoots. At the same diameter of the stem before cutting back, offspring from Q. robur and from the short stalked intermediate form displayed a higher mean number of reshoots on a cut stem as compared with offspring from Q. petraea. Additionally, the offspring of these taxa also displayed a higher number of side shoots on the reshoots.

5. Conclusions

Periods of drought are likely to intensify both in terms of duration and severity. Together with other biotic and abiotic stressors, the vulnerability of European forest stands will most probably augment in the future. We aimed to assess the putative impacts on forest regeneration specifically for the economic and ecological valuable oak species in western en central Europe. We show that, in a few years’ time, the legacy of the first-year water limitation in oak seedlings is faded in the phenological response, but it is still persistent in their growth (taxon dependent) and plant architecture (taxon independent). Seedlings from morphological intermediates tend to display more variable responses in both phenology as in growth characteristics when compared to seedlings from Q. petraea and Q. robur, which suggests that hybridogenic individuals may display deviating capacities to adapt to particular aspects of growth sites as compared with the parental species.

Supplementary Materials

The following are available online at https://www.mdpi.com/1999-4907/10/11/1012/s1, Figure S1. Box plots displaying the height and the diameter measurements on the oak seedlings at the end of 2016, before cutting back the stems. p: Q. petraea, pr: long stalked intermediate, rp: short stalked intermediate, r: Q. robur. Table S1: Raw data. Taxon: taxon of the mother tree; moID: n° of identity of the mother tree; treat: treatment received in 2014 with 1 = control and 2 = drought treatment; se_17: leaf senescence score in 2017; bb_18: bud burst score in 2018; h1_17 till h6_17 (cm): height of reshoots in the winter of 2017-2018; sumh_17 (cm): sum of heights of reshoots in the winter of 2017-2018; h1_18 till h6_18 (cm): height of reshoots in the winter of 2018-2019; sumh_18 (cm): sum of heights of reshoots in the winter of 2018-2019; d_16 (mm): diameter of the stem in the winter of 2016-2017; d1_17 till d6_17 (mm): diameter of reshoots in the winter of 2017-2018; suma_17 (mm2): sum of areas of reshoots in the winter of 2017-2018; d1_18 till d6_18 (mm): diameter of reshoots in the winter of 2018-2019; suma_18 (mm2): sum of areas of reshoots in the winter of 2018-2019; resh: n° of reshoots per plant; sidesh: total n° of sideshoots on all reshoots per plant.

Author Contributions

K.V.M., A.T., B.V.d.A. and S.M. (Steven Meeus) concepted and supervised the whole study, while A.T., K.V.M., M.V.G. and S.M. (Stefaan Moreels) organised plant growth, took care of the experimental set-up and conducted the measurements and observations on the saplings. A.T., S.M. (Stefaan Moreels), M.V.G. and K.V.M. performed measurements of diameter and height. K.V.M., M.V.G. and S.M. (Stefaan Moreels) observed leaf senescence and bud burst and counted reshoots and side shoots on reshoots. K.V.M. and A.T. performed the statistical analyses. All authors (K.V.M., A.T., S.M. (Steven Meeus), S.M. (Stefaan Moreels), B.V.d.A., M.V.G.) contributed substantially to the manuscript preparation.

Funding

This research received no external funding

Acknowledgments

We are grateful to Kathy Steppe who helped us with the set-up of the experiment. We thank Ghislain Mees, Marc Missoorten and Eddy Hubrechts from the Agency for Nature and Forest for facilitating the seed collections.

Conflicts of Interest

The authors declare that they have no conflict of interest.

References

  1. Allen, C.D.; Macalady, A.K.; Chenchouni, H.; Bachelet, D.; McDowell, N.; Vennetier, M.; Kitzberger, T.; Rigling, A.; Breshears, D.D.; Hogg, E.H.; et al. A global overview of drought and heat-induced tree mortality reveals emerging climate change risks for forests. Forest Ecol. Manag. 2010, 259, 660–684. [Google Scholar] [CrossRef]
  2. Lindner, M.; Fitzgerald, J.B.; Zimmermann, N.E.; Reyer, C.; Delzon, S.; van der Maaten, E.; Schelhaas, M.J.; Lasch, P.; Eggers, J.; van der Maaten-Theunissen, M.; et al. Climate change and European forests: What do we know, what are the uncertainties, and what are the implications for forest management? J. Environ. Manag. 2014, 146, 69–83. [Google Scholar] [CrossRef] [PubMed]
  3. Anderegg, W.R.L.; Berry, J.A.; Field, C.B. Linking definitions, mechanisms, and modeling of drought-induced tree death. Trends Plant. Sci. 2012, 17, 693–700. [Google Scholar] [CrossRef] [PubMed]
  4. Sheil, D. Forests, atmospheric water and an uncertain future: The new biology of the global water cycle. Ecosyst 2018, 5, 1–22. [Google Scholar] [CrossRef]
  5. Anderegg, W.R.L.; Schwalm, C.; Biondi, F.; Camarero, J.J.; Koch, G.; Litvak, M.; Ogle, K.; Shaw, J.D.; Shevliakova, E.; Williams, A.P.; et al. Pervasive drought legacies in forest ecosystems and their implications for carbon cycle models. Science 2015, 349, 528–532. [Google Scholar] [CrossRef] [PubMed]
  6. Kannenberg, S.A.; Maxwell, J.T.; Pederson, N.; D’Orangeville, L.; Ficklin, D.L.; Phillips, R.P. Drought legacies are dependent on water table depth, wood anatomy and drought timing across the eastern us. Ecol. Lett. 2019, 22, 119–127. [Google Scholar] [CrossRef] [PubMed]
  7. Hubert, F.; Grimm, G.W.; Jousselin, E.; Berry, V.; Franc, A.; Kremer, A. Multiple nuclear genes stabilize the phylogenetic backbone of the genus Quercus. Syst. Biodivers. 2014, 12, 405–423. [Google Scholar] [CrossRef]
  8. Pretzsch, H.; Schutze, G.; Uhl, E. Resistance of European tree species to drought stress in mixed versus pure forests: Evidence of stress release by inter-specific facilitation. Plant. Biol. 2013, 15, 483–495. [Google Scholar] [CrossRef] [PubMed]
  9. Epron, D.; Dreyer, E. Long-term effects of drought on photosynthesis of adult oak trees [Quercus petraea (Matt) Liebl and Quercus robur L] in a natural stand. New Phytol. 1993, 125, 381–389. [Google Scholar] [CrossRef]
  10. Leuschner, C.; Backes, K.; Hertel, D.; Schipka, F.; Schmitt, U.; Terborg, O.; Runge, M. Drought responses at leaf, stem and fine root levels of competitive Fagus sylvatica L. and Quercus petraea (Matt.) Liebl. Trees in dry and wet years. For. Ecol. Manag. 2001, 149, 33–46. [Google Scholar] [CrossRef]
  11. Levy, G.; Becker, M.; Duhamel, D. A comparison of the ecology of pedunculate and sessile oaks-radial growth in the center and northwest of france. For. Ecol. Manag. 1992, 55, 51–63. [Google Scholar] [CrossRef]
  12. Cochard, H.; Breda, N.; Granier, A.; Aussenac, G. Vulnerability to air-embolism of 3 European oak species (Quercus petraea (Matt) Liebl, Quercus pubescens Willd, Quercus robur L.). Ann. Sci. For. 1992, 49, 225–233. [Google Scholar] [CrossRef]
  13. Vivin, P.; Aussenac, G.; Levy, G. Differences in drought resistance among 3 deciduous oak species grown in large boxes. Ann. Sci. For. 1993, 50, 221–233. [Google Scholar] [CrossRef]
  14. Kleinschmit, J.R.G.; Bacilieri, R.; Kremer, A.; Roloff, A. Comparison of morphological and genetic traits of pedunculate oak (Q. robur L.) and sessile oak (Q. petraea (Matt) Liebl). Silvaec. Genet. 1995, 44, 256–269. [Google Scholar]
  15. Vanoni, M.; Bugmann, H.; Notzli, M.; Bigler, C. Quantifying the effects of drought on abrupt growth decreases of major tree species in Switzerland. Ecol. Evol. 2016, 6, 3555–3570. [Google Scholar] [CrossRef] [PubMed]
  16. Thomas, F.M.; Gausling, T. Morphological and physiological responses of oak seedlings (Quercus petraea and Q. robur) to moderate drought. Ann. Sci. 2000, 57, 325–333. [Google Scholar] [CrossRef]
  17. Scheidegger, Y.; Saurer, M.; Bahn, M.; Siegwolf, R. Linking stable oxygen and carbon isotopes with stomatal conductance and photosynthetic capacity: A conceptual model. Oecologia 2000, 125, 350–357. [Google Scholar] [CrossRef] [PubMed]
  18. Perkins, D.; Uhl, E.; Biber, P.; du Toit, B.; Carraro, V.; Rotzer, T.; Pretzsch, H. Impact of climate trends and drought events on the growth of oaks (Quercus robur L. and Quercus petraea (Matt.) Liebl.) within and beyond their natural range. Forests 2018, 9, 108. [Google Scholar] [CrossRef]
  19. Spiess, N.; Oufir, M.; Matusikova, I.; Stierschneider, M.; Kopecky, D.; Homolka, A.; Burg, K.; Fluch, S.; Hausman, J.F.; Wilhelm, E. Ecophysiological and transcriptomic responses of oak (Quercus robur) to long-term drought exposure and rewatering. Environ. Exp. Bot. 2012, 77, 117–126. [Google Scholar] [CrossRef]
  20. Jensen, J.S.; Hansen, J.K. Genetic variation in responses to different soil water treatments in Quercus robur L. Scand. J. For. Res. 2010, 25, 400–411. [Google Scholar] [CrossRef]
  21. Pflug, E.E.; Siegwolf, R.; Buchmann, N.; Dobbertin, M.; Kuster, T.M.; Gunthardt-Goerg, M.S.; Arend, M. Growth cessation uncouples isotopic signals in leaves and tree rings of drought-exposed oak trees. Tree Physiol. 2015, 35, 1095–1105. [Google Scholar] [CrossRef] [PubMed]
  22. Kuster, T.M.; Dobbertin, M.; Gunthardt-Goerg, M.S.; Schaub, M.; Arend, M. A phenological timetable of oak growth under experimental drought and air warming. PLoS ONE 2014, 9. [Google Scholar] [CrossRef] [PubMed]
  23. Vander Mijnsbrugge, K.; Turcsan, A.; Maes, J.; Duchene, N.; Meeus, S.; Steppe, K.; Steenackers, M. Repeated summer drought and re-watering during the first growing year of oak (Quercus petraea) delay autumn senescence and bud burst in the following spring. Front. Plant. Sci. 2016, 7. [Google Scholar] [CrossRef] [PubMed]
  24. Niinemets, U. Responses of forest trees to single and multiple environmental stresses from seedlings to mature plants: Past stress history, stress interactions, tolerance and acclimation. For. Ecol. Manag. 2010, 260, 1623–1639. [Google Scholar] [CrossRef]
  25. Psidova, E.; Ditmarova, L.; Jamnicka, G.; Kurjak, D.; Majerova, J.; Czajkowski, T.; Bolte, A. Photosynthetic response of beech seedlings of different origin to water deficit. Photosynthetica 2015, 53, 187–194. [Google Scholar] [CrossRef]
  26. Brouwers, J.; Peeters, B.; Van Steertegem, M.; van Lipzig, N.; Wouters, H.; Beullens, J.; Demuzere, M.; Willems, P.; De Ridder, K.; Maiheu, B.; et al. Mira Climate Report 2015: About Observed and Future Climate Changes in Flanders and Belgium; Flanders Environment Agency: Aalst, Belgium, 2015. [Google Scholar]
  27. Vander Mijnsbrugge, K.; Turcsan, A.; Maes, J.; Duchene, N.; Meeus, S.; Van der Aa, B.; Steppe, K.; Steenackers, M. Taxon-independent and taxon-dependent responses to drought in seedlings from Quercus robur L., Q. -petraea (Matt.) Liebl. and their morphological intermediates. Forests 2017, 8, 407. [Google Scholar]
  28. Büsgen, M.; Münch, E.; Thomson, T. Structure Life Forest Trees; Chapman and Hall: London, UK, 1929. [Google Scholar]
  29. Tainter, F.H.; Retzlaff, W.A.; Starkey, D.A.; Oak, S.W. Decline of radial growth in red oaks is associated with short-term changes in climate. Eur. J. Pathol. 1990, 20, 95–105. [Google Scholar] [CrossRef]
  30. Bacilieri, R.; Ducousso, A.; Petit, R.J.; Kremer, A. Mating system and asymmetric hybridization in a mixed stand of European oaks. Evolution 1996, 50, 900–908. [Google Scholar] [CrossRef] [PubMed]
  31. Vander Mijnsbrugge, K.; Cox, K.; Van Slycken, J. Conservation approaches for autochthonous woody plants in Flanders. Silvaec. Genet. 2005, 54, 197–206. [Google Scholar] [CrossRef]
  32. Vander Mijnsbrugge, K.; Coart, E.; Beeckman, H.; Van Slycken, J. Conservation measures for autochthonous oaks in Flanders. For. Genet. 2003, 10, 207–217. [Google Scholar]
  33. Vander Mijnsbrugge, K.; De Cleene, L.; Beeckman, H. A combination of fruit and leaf morphology enables taxonomic classification of the complex Q. robur L.-Q. × rosacea Bechst.-Q. petraea (Matt.) Liebl. in autochthonous stands in flanders. Silvaec. Genet. 2011, 60, 139–148. [Google Scholar] [CrossRef]
  34. R Core Team. A Language and Environment for Statistical Computing. R Foundation for Statistical Computing; Vienna, Austria. 2014. Available online: http://www.R-project.org/ (accessed on 5 July 2019).
  35. Christensen, R.H.B. Ordinal: Regression Models for Ordinal Data. R Package Version. 2013. Available online: http://www.Cran.R-project.Org/package=ordinal/ (accessed on 31 October 2013).
  36. Bates, D.; Machler, M.; Bolker, B.M.; Walker, S.C. Fitting linear mixed-effects models using lme4. J. Stat. Softw. 2015, 67, 1–48. [Google Scholar] [CrossRef]
  37. Venables, W.N.; Ripley, B.D. Modern Applied Statistics with S; Springer: New York, NY, USA, 2002. [Google Scholar]
  38. Alberto, F.J.; Aitken, S.N.; Alia, R.; Gonzalez-Martinez, S.C.; Hanninen, H.; Kremer, A.; Lefevre, F.; Lenormand, T.; Yeaman, S.; Whetten, R.; et al. Potential for evolutionary responses to climate change - Evidence from tree populations. Glob. Chang. Biol. 2013, 19, 1645–1661. [Google Scholar] [CrossRef] [PubMed]
  39. Milne, R.I.; Abbott, R.J. Origin and evolution of invasive naturalized material of Rhododendron ponticum L. in the British Isles. Mol. Ecol. 2000, 9, 541–556. [Google Scholar] [CrossRef] [PubMed]
  40. Gieger, T.; Thomas, F.M. Effects of defoliation and drought stress on biomass partitioning and water relations of Quercus robur and Quercus petraea. Basic Appl. Ecol. 2002, 3, 171–181. [Google Scholar] [CrossRef]
  41. Umehara, M.; Hanada, A.; Yoshida, S.; Akiyama, K.; Arite, T.; Takeda-Kamiya, N.; Magome, H.; Kamiya, Y.; Shirasu, K.; Yoneyama, K.; et al. Inhibition of shoot branching by new terpenoid plant hormones. Nature 2008, 455, 195–200. [Google Scholar] [CrossRef] [PubMed]
  42. Zheng, K.J.; Wang, X.P.; Weighill, D.A.; Guo, H.B.; Xie, M.; Yang, Y.G.; Yang, J.; Wang, S.C.; Jacobson, D.A.; Guo, H.; et al. Characterization of dwarf14 genes in Populus. Sci. Rep. UK 2016, 6, 20593. [Google Scholar] [CrossRef] [PubMed] [Green Version]
  43. Ha, C.V.; Leyva-Gonzalez, M.A.; Osakabe, Y.; Tran, U.T.; Nishiyama, R.; Watanabe, Y.; Tanaka, M.; Seki, M.; Yamaguchi, S.; Dong, N.V.; et al. Positive regulatory role of strigolactone in plant responses to drought and salt stress. Proc. Natl. Acad. Sci. USA 2014, 111, 851–856. [Google Scholar] [CrossRef] [PubMed] [Green Version]
  44. Ammer, C. Growth and biomass partitioning of fagus sylvatica l. And quercus robur l. Seedlings in response to shading and small changes in the r/fr-ratio of radiation. Ann. Sci. 2003, 60, 163–171. [Google Scholar] [CrossRef]
Figure 1. Schematic representation of the experiment indicating the major measurements and scorings along a time line.
Forests 10 01012 g001
Figure 2. Modelled probability of having reached maximally leaf senescence or bud burst score 3 (light green leaves with yellow parts and bud opening, leaves not yet protruding, respectively) depending on the taxon of the mother tree. p: Q. petraea. pr: long stalked intermediate. r: Q. robur. rp: short stalked intermediate. Q. petraea is the standard level of the categorical variable taxon of the mother tree to which other taxa of mother trees are compared with. Confidence intervals are indicated with black lines. Taxa significantly differing from Q. petraea are indicated. *** p < 0.001; ** p < 0.01; * p < 0.05; . p < 0.1.
Forests 10 01012 g002
Figure 3. Mean number of reshoots per plant and mean number of side shoots on all reshoots per plant at the end of 2017. Mean count and standard deviation (error bars) are shown for the different groups of offspring from Q. petraea, from Q. robur and from their morphological intermediates, and according to the treatment in 2014. p: Q. petraea. pr: long stalked intermediate. r: Q. robur. rp: short stalked intermediate.
Forests 10 01012 g003
Figure 4. Modelled number of reshoots on a plant at the end of 2017, after cutting back the stem at the end of 2016, depending on the taxon of the mother tree (p: Q. petraea. pr: long stalked intermediate. r: Q. robur. rp: short stalked intermediate) and on the diameter of the stem at the end of 2016 before cutting back. Q. petraea is the standard level of the categorical variable taxon of the mother tree, to which other taxa of mother trees are compared with. Confidence intervals are indicated with dotted lines. Taxa significantly differing from Q. petraea are indicated. ** p < 0.01; * p < 0.05.
Forests 10 01012 g004
Figure 5. Modelled number of side shoots on the reshoots of a plant at the end of 2017 after cutting back the stems in the previous winter, depending on the taxon of the mother trees (p: Q. petraea. pr: long stalked intermediate. r: Q. robur. rp: short stalked intermediate) and on the treatment in 2014. Q. petraea is the standard level of the categorical variable taxon of the mother tree to which the other taxa of mother trees are compared with. Confidence intervals are indicated with black lines. Taxa significantly differing from Q. petraea are indicated. * p < 0.05.
Forests 10 01012 g005
Figure 6. Box plots displaying the sum of heights and the sum of areas of all reshoots per plant in the two years following the cutting back of the stems at the end of 2016. p: Q. petraea, pr: long stalked intermediate, rp: short stalked intermediate, r: Q. robur.
Forests 10 01012 g006
Table 1. Number of germinated oak seedlings (n2014), number of seedlings that survived the first growing season (n2015) and number of oak saplings that resprouted at the beginning of 2017 (n2017), according to the treatment in 2014 and the taxon of the mother tree.
TreatmentTaxon Mother Tree *n2014n2015n2017
controlp696860
pr131311
rp555553
r585851
droughtp745042
pr14117
rp583835
r513636
* p: Q. petraea, pr: long stalked intermediate, rp: short stalked intermediate, r: Q. robur.
Table 2. Description of the leaf senescence and bud burst score levels.
PhenophaseScore LevelDescription
leaf senescence 1light green leaves
2light green leaves with yellow parts
3yellow leaves still having green parts
4yellow leaves with brown parts
5brown leaves still having yellow parts
6brown leaves
bud burst 1apical bud in winter rest
2apical bud swollen
3apical bud opening, leaves not yet protruding
4leaves protruding but not yet unfolding
5leaves unfolding but not yet fully unfolded
6leaves fully unfolded
Table 3. Model statistics for the general linear mixed models of the ordinal phenological response variables leaf senescence and bud burst. T: taxon of the mother tree (categorical variable with Q. petraea as standard level to which the other taxa of mother trees are compared with, pr: long stalked intermediate, r: Q. robur, rp: short stalked intermediate), S: drought treatment in 2014 (categorical variable with control as standard level to which the drought treatment is compared with), H: sum of the heights of the reshoots per plant at the end of 2017 (continuous variable).
Leaf Senescence 2017 Bud Burst 2018
VariableEstimateStd. errorz-Valuep-ValueEstimateStd. Errorz-Valuep-Value
Tpr−2.610.74−3.52<0.001 ***0.660.920.720.472
Tr−1.020.44−2.330.020 *0.940.531.780.074.
Trp−0.920.45−2.030.043 *1.500.542.790.005 **
S−0.270.36−0.740.461−0.310.40−0.790.432
H0.000.000.880.3820.000.001.010.315
S:Tpr0.340.920.370.712−0.150.99−0.150.878
S:Tr−0.060.56−0.110.9120.170.580.300.766
S:Trp−0.600.54−1.110.2660.100.550.190.849
*** p < 0.001; ** p < 0.01; * p < 0.05; . p < 0.1.
Table 4. Model statistics for the general linear mixed models with response variables the counts of reshoots per plant and the counts of side shoots on the reshoots per plant. T: taxon of the mother tree (categorical variable with Q. petraea as standard level to which the other taxa of mother trees are compared with, pr: long stalked intermediate, r: Q. robur, rp: short stalked intermediate), S: drought treatment in 2014 (categorical variable with control as standard level to which the drought treatment is compared with), D: diameter of the stem before the cut-back at the end of 2016 (continuous variable in the model of n° of reshoots per plant), H: sum of the heights of the reshoots per plant at the end of 2017 (continuous variable in the model of n° of side shoots on the reshoots per plant).
n° of Reshoots per Plant (2017) n° of Side Shoots on Reshoots per Plant (2017)
VariableEstimateStd. Errorz−Valuep−ValueVariableEstimateStd. Errort−Valuep−Value
(Intercept)−1.110.30−3.75<0.001 ***(Intercept)−0.120.29−0.410.681
Tpr0.330.291.150.252Tpr0.730.501.440.172
Tr0.400.192.080.038 *Tr0.870.322.770.015 *
Trp0.540.192.910.004 **Trp0.700.322.170.048 *
S0.080.230.350.730S−0.990.47−2.110.036 *
D0.150.043.76<0.001 ***H0.000.000.540.590
S:Tpr−0.140.47−0.300.764S:Tpr0.700.760.930.354
S:Tr−0.020.29−0.050.958S:Tr0.650.531.220.222
S:Trp−0.050.30−0.170.868S:Trp0.760.541.410.161
*** p < 0.001; ** p < 0.01; * p < 0.05; . p < 0.1.
Table 5. Model statistics for the linear mixed models of the sum of the heights of the reshoots per plant for every taxon of mother trees. S: drought treatment in 2014 (categorical variable with control as standard level to which drought treatment is compared with), Y: year of measurement (categorical variable with 2017 as standard level to which 2018 is compared with).
Taxon Mother TreeVariableEstimateSt. Errordft−Valuep−Value
Q. petraea(Intercept)49.906.64977.52<0.001 ***
S−13.965.4995−2.540.013 *
Y53.693.029717.80<0.001 ***
long stalked intermediate(Intercept)79.8210.85167.35<0.001 ***
S−9.2416.0316−0.580.572
Y66.058.77167.53<0.001 ***
Q. robur(Intercept)76.746.017212.77<0.001 ***
S−5.278.3069−0.630.528
Y71.073.817218.65<0.001 ***
short stalked intermediate(Intercept)71.716.058611.86<0.001 ***
S−14.776.8981−2.140.035 *
Y59.513.578616.67<0.001 ***
*** p < 0.001; ** p < 0.01; * p < 0.05.
Table 6. Model statistics for the linear mixed models of the sum of the basal areas of the reshoots per plant for every taxon of mother trees. S: drought treatment in 2014 (categorical variable with control as standard level to which the drought treatment is compared with), Y: year of measurement (categorical variable with 2017 as standard level to which 2018 is compared with).
Taxon mother treeVariableEstimateSt. Errordft−Valuep−Value
Q. petraea(Intercept)2.860.44966.45<0.001 ***
S−0.850.3695−2.340.021 *
Y3.770.209618.69<0.001 ***
long stalked intermediate(Intercept)4.640.67326.89<0.001 ***
S−0.990.8632−1.150.257
Y4.920.84325.86<0.001 ***
Q. robur(Intercept)4.360.53718.16<0.001 ***
S−0.890.4669−1.920.059
Y4.870.257119.26<0.001 ***
short stalked intermediate(Intercept)3.870.348611.42<0.001 ***
S−0.600.4481−1.360.177
Y4.600.258618.51<0.001 ***
*** p < 0.001; ** p < 0.01; * p < 0.05.

