Article

Leaf and Soil δ15N Patterns Along Elevational Gradients at Both Treelines and Shrublines in Three Different Climate Zones

1
Institute of Wetland Ecology & Clone Ecology/Zhejiang Provincial Key Laboratory of Plant Evolutionary Ecology and Conservation, Taizhou University, Taizhou 318000, China
2
Institute of Applied Ecology, Chinese Academy of Sciences, Shenyang 110016, China
3
College of Grassland, Resources and Environment, Key Laboratory of Grassland Resources of the Ministry of Education, Key Laboratory of Forage Cultivation, Processing and High Efficient Utilization of the Ministry of Agriculture, and Key Laboratory of Grassland Management and Utilization of Inner Mongolia Autonomous Region, Inner Mongolia Agricultural University, Hohhot 010011, China
4
Forest Dynamics, Swiss Federal Research Institute WSL, Zuercherstrasse 111, CH-8903 Birmensdorf, Switzerland
*
Author to whom correspondence should be addressed.
Forests 2019, 10(7), 557; https://doi.org/10.3390/f10070557
Submission received: 16 May 2019 / Revised: 20 June 2019 / Accepted: 2 July 2019 / Published: 3 July 2019
(This article belongs to the Special Issue Alpine and Polar Treelines in a Changing Environment)

Abstract

:
The natural abundance of stable nitrogen (N) isotope (δ15N) in plants and soils can reflect N cycling processes in ecosystems. However, we still do not fully understand patterns of plant and soil δ15N at alpine treelines and shrublines in different climate zones. We measured δ15N and N concentration in leaves of trees and shrubs and also in soils along elevational gradients from lower altitudes to the upper limits of treelines and shrublines in subtropical, dry- and wet-temperate regions in China. The patterns of leaf δ15N in trees and shrubs in response to altitude changes were consistent, with lower values occurring at higher altitude in all three climate zones, but such patterns did not exist for leaf Δδ15N and soil δ15N. Average δ15N values of leaves (−1.2‰) and soils (5.6‰) in the subtropical region were significantly higher than those in the two temperate regions (−3.4‰ and 3.2‰, respectively). Significant higher δ15N values in subtro4pical forest compared with temperate forests prove that N cycles are more open in warm regions. The different responses of leaf and soil δ15N to altitude indicate complex mechanisms of soil biogeochemical process and N sources uptake with environmental variations.

1. Introduction

Variation in natural abundance of the stable isotope 15N (δ15N) in plants and soils can reflect N cycling in ecosystems [1] because it is related to the isotope compositions of N inputs and outputs and the internal N transformations [2]. Moreover, δ15N can reflect the degree of the ‘openness’ of the N cycles, with higher values indicating greater N losses and a more open N cycling [3,4]. Thus, assessing patterns of δ15N may help understand the process of N cycling in ecosystems [1,5].
Many studies have examined the variations of spatial patterns of δ15N in plants and soils [6,7,8,9] and showed correlations of δ15N and environmental factors. Elevation appears to be a major influence on leaf and soil δ15N due to its natural environmental variations, such as soil water and temperature. At lower elevations where temperature tends to be higher, δ15N values are likely to be higher [10,11]. Since litter decomposition and N mineralization can be accelerated by a direct increase in temperature at lower elevations [12]. However, an increasing trend or no change of δ15N with elevational gradients has also been observed in some regions [4,13]. This is because not only the local microclimate but the primary physiological and biogeochemical processes regulate the N transformations in soils [2]. The soil processes including N mineralization, nitrification, denitrification and NH3 volatilization all discriminate against 15N and lead to different leaf and soil δ15N signatures [7]. In addition, mycorrhizal fungi types and various N uptake sources can influence leaf δ15N signatures [14,15,16]. Therefore, the mechanisms of elevational response for δ15N could be complex.
In particular, at high elevations in alpine ecosystems, where are expected to be active in N dynamics with the increasing global warming [17]. The distributions of plant species on alpine ecosystems are constrained by upper altitude limits, resulting in markedly boundaries such as treelines and shrublines [18,19]. Although temperature has been suggested as a primary driver underlying the formation of such boundaries [20], low soil nutrient availability may also be responsible for reduced growth of trees and shrubs at their upper limits [21]. A recent study found that the growth of trees and shrubs in an alpine ecosystem increased with slightly increased nutrient availability [22], which in turn suggesting the potential increasing nutrient dynamics with the expansion of trees or shrubs. Thus, understanding changes of N cycling at alpine ecosystems is particularly important as both alpine treelines and shrublines may shift in the face of global climate change [23,24,25]. The signature of δ15N at alpine ecosystems could serve as a powerful signal for potential effects of climate change on N cycling. For instance, experimental warming increased foliar δ15N in the Swiss Alps [26], indicating an opening of N cycles with climate warming. However, we still do not fully understand the patterns of δ15N in plants and soils at high altitudes of alpine ecosystems and whether plant and soil δ15N at alpine treelines and shrublines show similar patterns.
We sampled leaves of trees and shrubs and soils at the upper limits of alpine treelines and shrublines and the lower altitudes in three different climate zones (subtropical, dry-temperate and wet-temperate) and measured their δ15N values. Specifically, we address the following questions: (1) Do leaf and soil δ15N patterns change with climatic zones? We hypothesized that leaf and soil δ15N values are higher in subtropical zones than in temperate zones as temperature is higher and available N is richer in subtropical forests than in temperate forests. (2) Do leaf and soil δ15N vary with altitude? We hypothesized that leaf and soil δ15N would decrease with altitude as temperature decreases with increasing altitude. (3) Do leaf δ15N values of trees and shrubs respond differently to changing altitude? We hypothesized that the response of leaf δ15N to altitude was similar in trees and shrubs as the distribution of trees and shrubs are both restrained to the cold temperature.

2. Materials and Methods

2.1. Site Description and Sample Collection

The study sites were three mountains in China (Balang Mts., Qilian Mts. and Changbai Mts.), located in three climate zones (summarized in Table 1, Figure 1): Balang Mts. (102°52′–103°24′ E, 30°45′–31°25′ N) are located in Wolong Nature Reserve in southwestern China. The climate is subtropical, with the mean annual precipitation of about 995 mm and the annual mean temperature of 12.8 °C (measured at 1920 m a.s.l. according to the data from Wolong Nature Reserve Authority) [27]. Qilian Mts. (102°58′–103°01′ E, 37°14′–37°20′ N) are located in northwestern China. Its climate is dry-temperate, with the mean annual precipitation of about 435 mm and the annual mean temperature of 0.6 °C (measured at 2787 m a.s.l. by the Qilian weather station) [28]. Changbai Mts. (126°55′–129°00′ E, 41°23′–42′36° N) are located in northeastern China, with wet-temperate climate. For Changbai Mts., the mean annual precipitation increases from 1000 to 1100 mm and annual mean temperature decreases from −2.3 to −3.8 °C at the altitude from 1950 m to 2000 m a.s.l [29].
In this study, the alpine treelines and shrublines were defined as the upper limits of individuals without visible disturbance and suppression. For Balang Mts., the treeline species was Abies faxoniana Rehder & E.H.Wilson and the shrubline species was Quercus aquifolioides Rehd. et Wils., and the altitude ranged from 2840 to 3670 m asl., (Table 1). For Qilian Mts., the treeline species was Picea crassifolia Kom. and the shrubline species was Salix gilashanica C. Wang, P.Y. Fu, and the altitude ranged from 2540 to 3540 m (Table 1). For Changbai Mts., the treeline species was Betula ermanii Cham. and the shrubline species was Vaccinium uliginosum Linn., and the altitude ranged from 1430 to 2380 m (Table 1). The soil was classified as Umbric Cryic Cambisols on Balang Mts., Calcaric Ustic Cambisols on Qilian Mts. and Andic Gelic Cambisols on Changbai Mts. [30].
At each site, leaf samples from the treeline and shrubline species were collected at three altitudes, i.e., the upper limit, the middle altitude and the lower altitude. At each altitude, soils (0–10 cm depth) under the canopy of the sampled trees or shrubs were collected after removing the layer of soil organic matter. They passed through a 2 mm sieve to remove stones and plant residues. At each altitude from each site, leaf samples were collected from six trees or shrubs, and a composite soil sample was collected from three randomly locations around corresponding trees or shrubs selected.

2.2. Chemical Analysis

Samples of leaves were ground into a fine powder after being oven-dried at 65 °C for 48 h, and then stored for the measurement of 15N values and N concentration. For each soil sample, a fresh subsample was used for testing soil inorganic N (IN, NO3 + NH4+), and the remaining part was air dried and then milled to powder for the measurement of soil organic carbon (SOC), total carbon (TC), total N (TN) and 15N abundance.
The 15N abundance in leaves and soils, and concentrations of leaf N, soil TN and soil TC were analyzed in an elemental analyzer (Elementar Vario MICRO cube, Hanau, Germany) coupled with a stable isotope ratio mass spectrometer (Isoprime 100, Stockport, UK). Calibrated DL-alanine (δ15N = −1.7‰), glycine (δ15N = 10.0‰) and histidine (δ15N = −8.0‰) were used as the internal standards.
δ15N (‰) = [(RsampleRstandard)/Rstandard] × 103,
where Rsample is the 15N/14N ratio of the sample and Rstandard is the 15N/14N ratio of the atmospheric N2 [31]. Precision of duplicate measurements was <0.2%.
The soil IN was determined colorimetrically using an Auto Continuous Flow Analyzer (Bran and Luebbe, Norderstedt, Germany) after exacting fresh soil samples in 1 M KCL. For subtropical and wet temperate mountain zones, SOC was determined on ground soils using an elemental analyzer (Vario MACRO Cube, Elementar, Germany). For the dry temperate mountain, the ground soil samples were treated with 12 M HCl to remove inorganic C before organic C determination on the elemental analyzer [32]. Soil pH was determined in a 1:5 (soil:water) solution (w/v).

2.3. Statistical Analyses

The normality of the distribution and the homogeneity of the data were checked (Kolmogorov–Smirnov test) before statistical analyses. We used a three-way ANOVA to test the effects of life form (trees vs. shrubs), altitude (upper, middle and lower) and climatic zone (Balang Mts., Qilian Mts. and Changbai Mts.) on leaf and soil δ15N, leaf Δδ15N (calculated as δ15Nleaf − δ15Nsoil), leaf N, soil inorganic N, soil total N and soil C:N. Multiple comparisons of means were conducted with Duncan’s significant difference to test the different responses between altitudes. The correlations between variables were investigated with Pearson’s correlation coefficient. All statistical analyses were performed using SPSS 22.0 (SPSS, Inc., Chicago, IL, USA).

3. Results

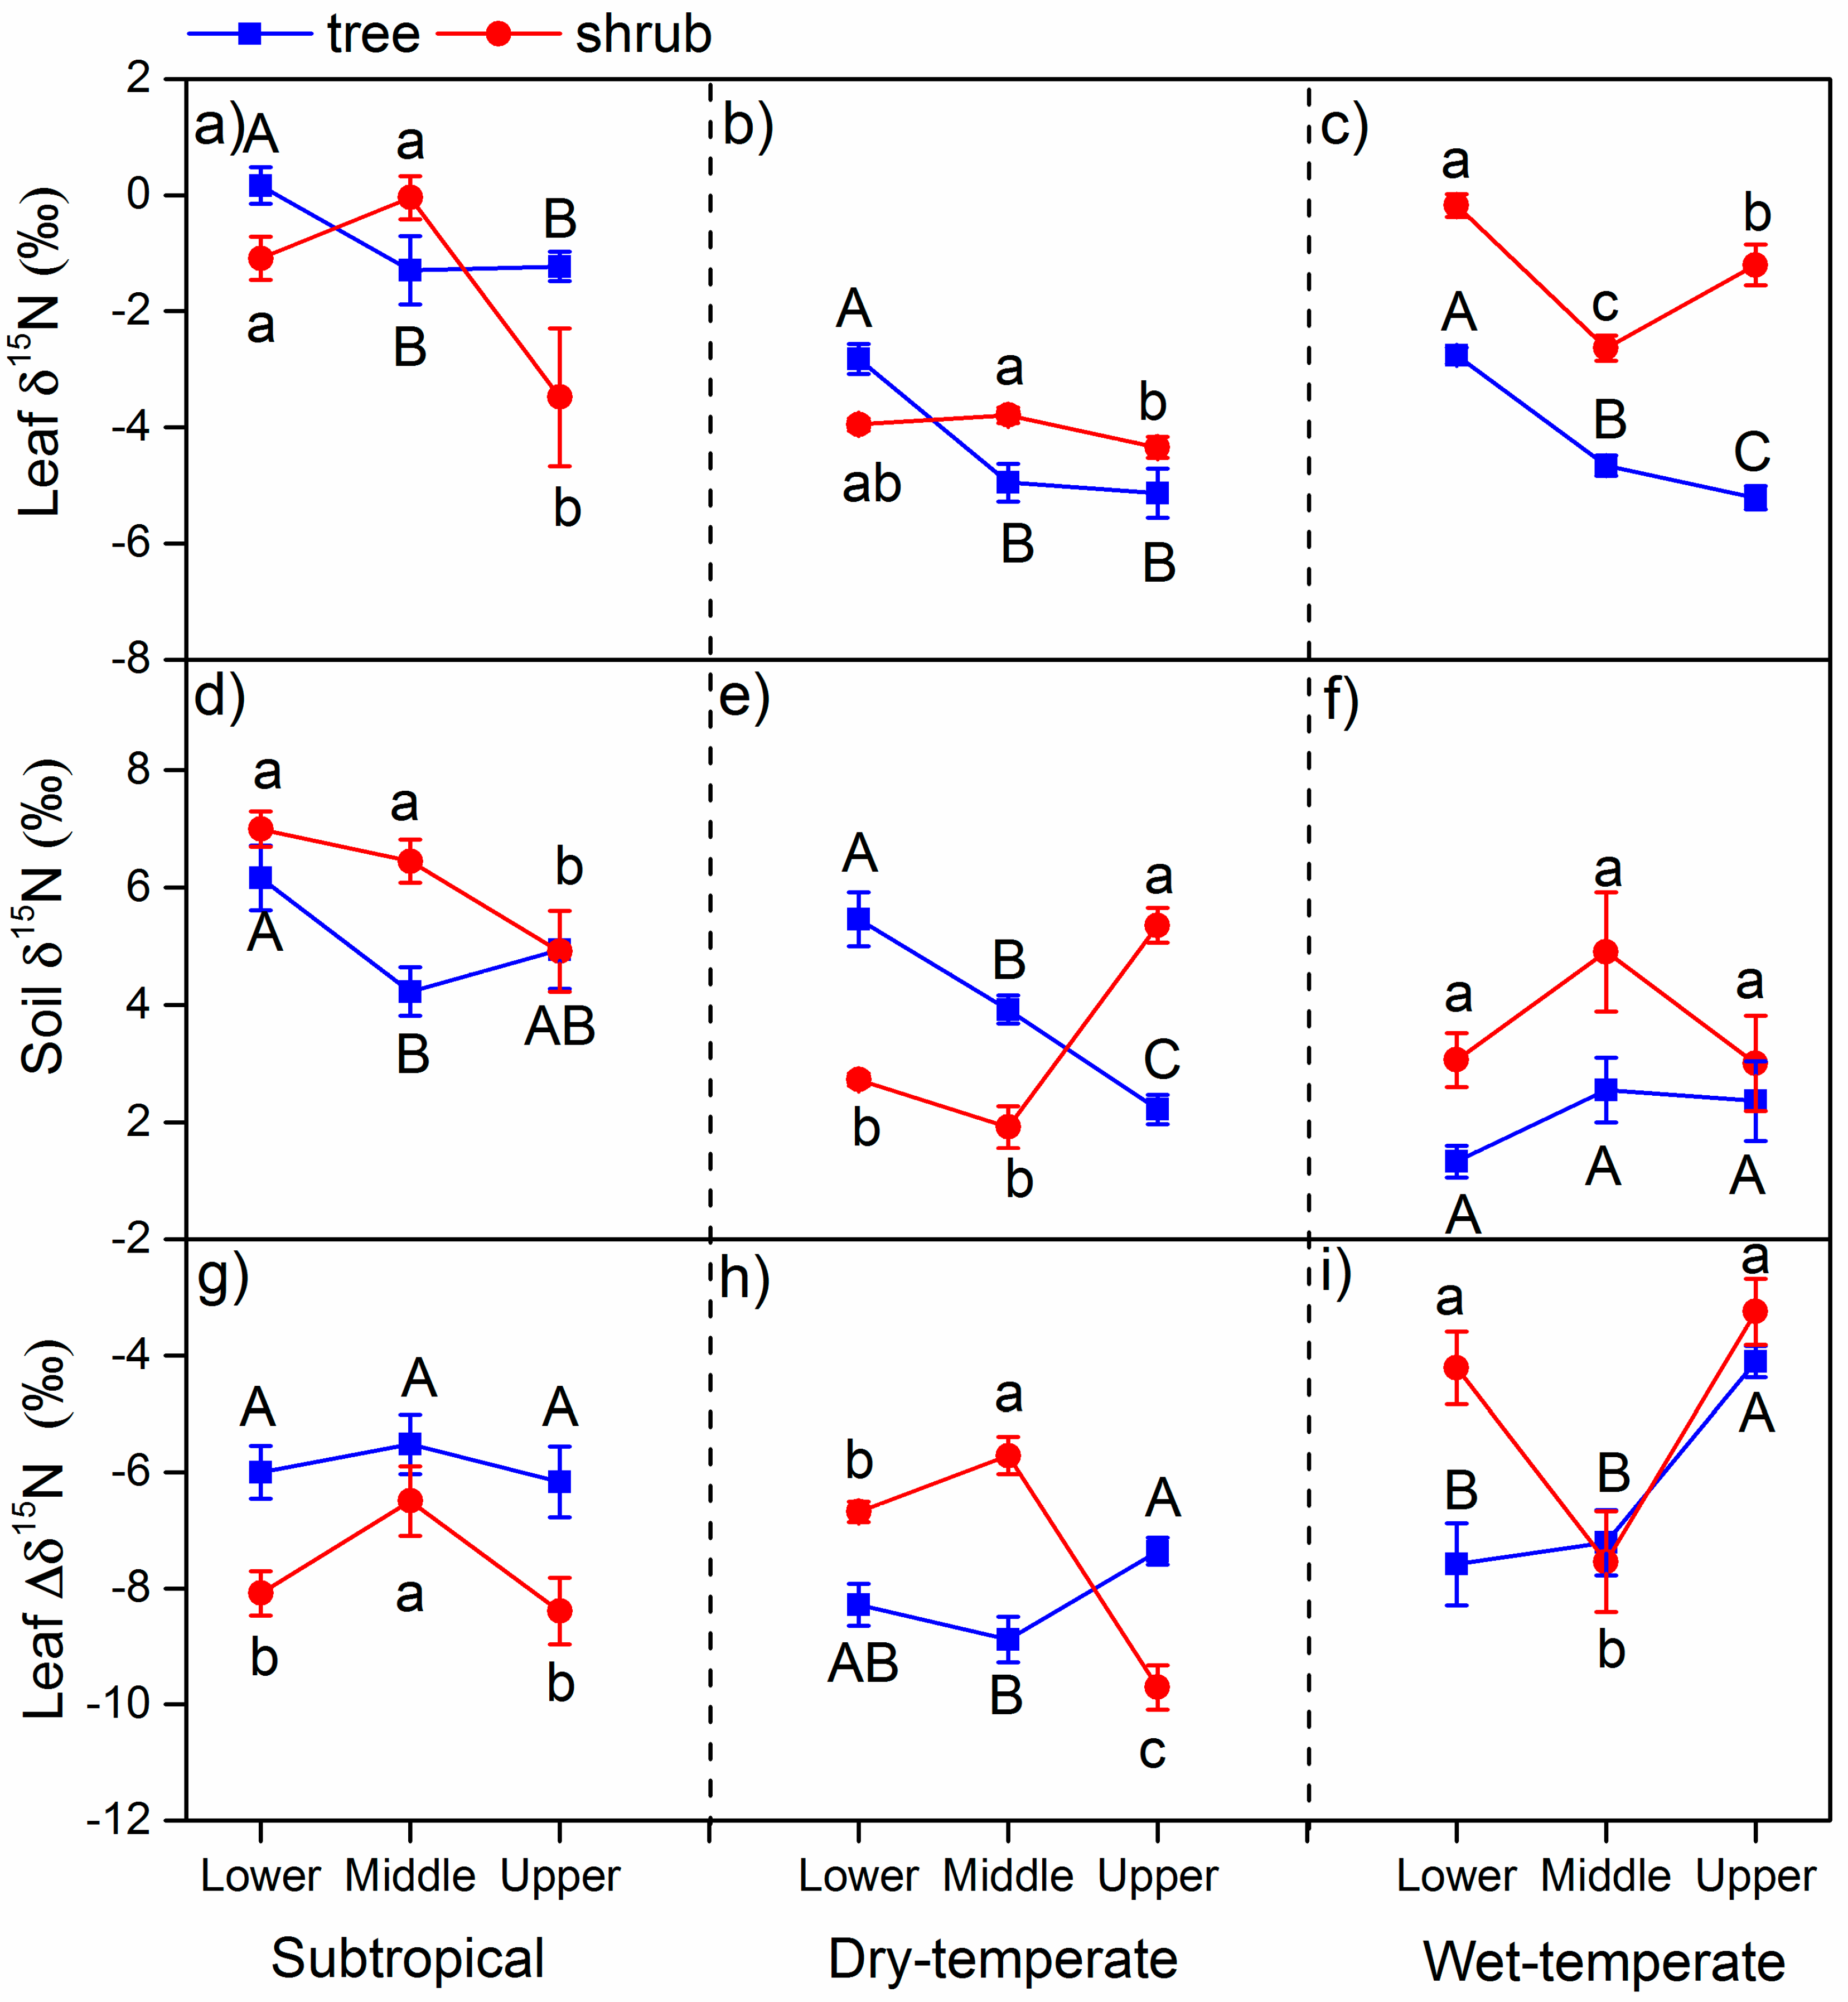
3.1. δ15N in Leaves and Soils

δ15N values varied significantly in different climate zones (sites; Table 2). Altitude and life form had significant effects on δ15N in leaves and soils (Table 2). The two- and three-way interactions among variables also significantly influenced the δ15N in leaves and soils (Table 2). Leaf δ15N values of both trees and shrubs were lower at the upper limits than at lower altitudes in all three climate zones (Table 2, Figure 2a–c). There was no significant difference for leaf δ15N between trees and shrubs in subtropical and dry-temperate forests, but leaf δ15N of shrub (−1.3‰) was significantly higher than that of tree (−4.2‰) in wet-temperate forest (Table 2, Figure 2c). Leaf δ15N was significantly different among climate zones (p < 0.05, Figure 2a–c), with that average δ15N values of leaves in dry-temperate (−4.2‰) were lower than those in subtropical (−1.2‰) and wet-temperate (−2.8‰), but there was no difference of leaf δ15N between subtropical and wet-temperate forest (Figure 2a–c).
The increasing altitude significantly decreased the value of soil δ15N in subtropical forest but had no effect on that in wet-temperate forest (Table 2, Figure 2d–f). Soil δ15N under the tree canopy decreased, however soil δ15N under shrub canopy increased, with increasing altitude in dry-temperate forest because of the significant interaction between life form and altitude (Table 2, Figure 2e). In wet-temperate forest, soil δ15N was significantly higher under shrub canopy than under tree canopy (Table 2, Figure 2f). The soil δ15N in subtropical forest (5.6‰) was higher than those in dry-temperate (3.6‰) and wet-temperate forests (2.9‰) and there was no difference for soil δ15N between dry- and wet-temperate forests (Figure 2d–f).
Altitude had a significant effect on leaf Δδ15N values (i.e., the difference of leaf δ15N and soil δ15N), however, this effect was changed by site and life form due to the significant two-way and three-way interactions (Table 2). For example, leaf Δδ15N values for shrubs were lower at the upper limits than at lower elevations, whereas Δδ15N values for trees tended to be higher at the upper limits in dry-temperate forest (Figure 2h). No significant difference for leaf Δδ15N values of trees and shrubs was found between the upper limits and lower elevations in subtropical forest, but leaf Δδ15N values for trees tended to be higher than those for shrubs in the subtropical forest (Figure 2g). Leaf Δδ15N values were all negative for all trees and shrubs across the climate zones (Figure 2g–i).

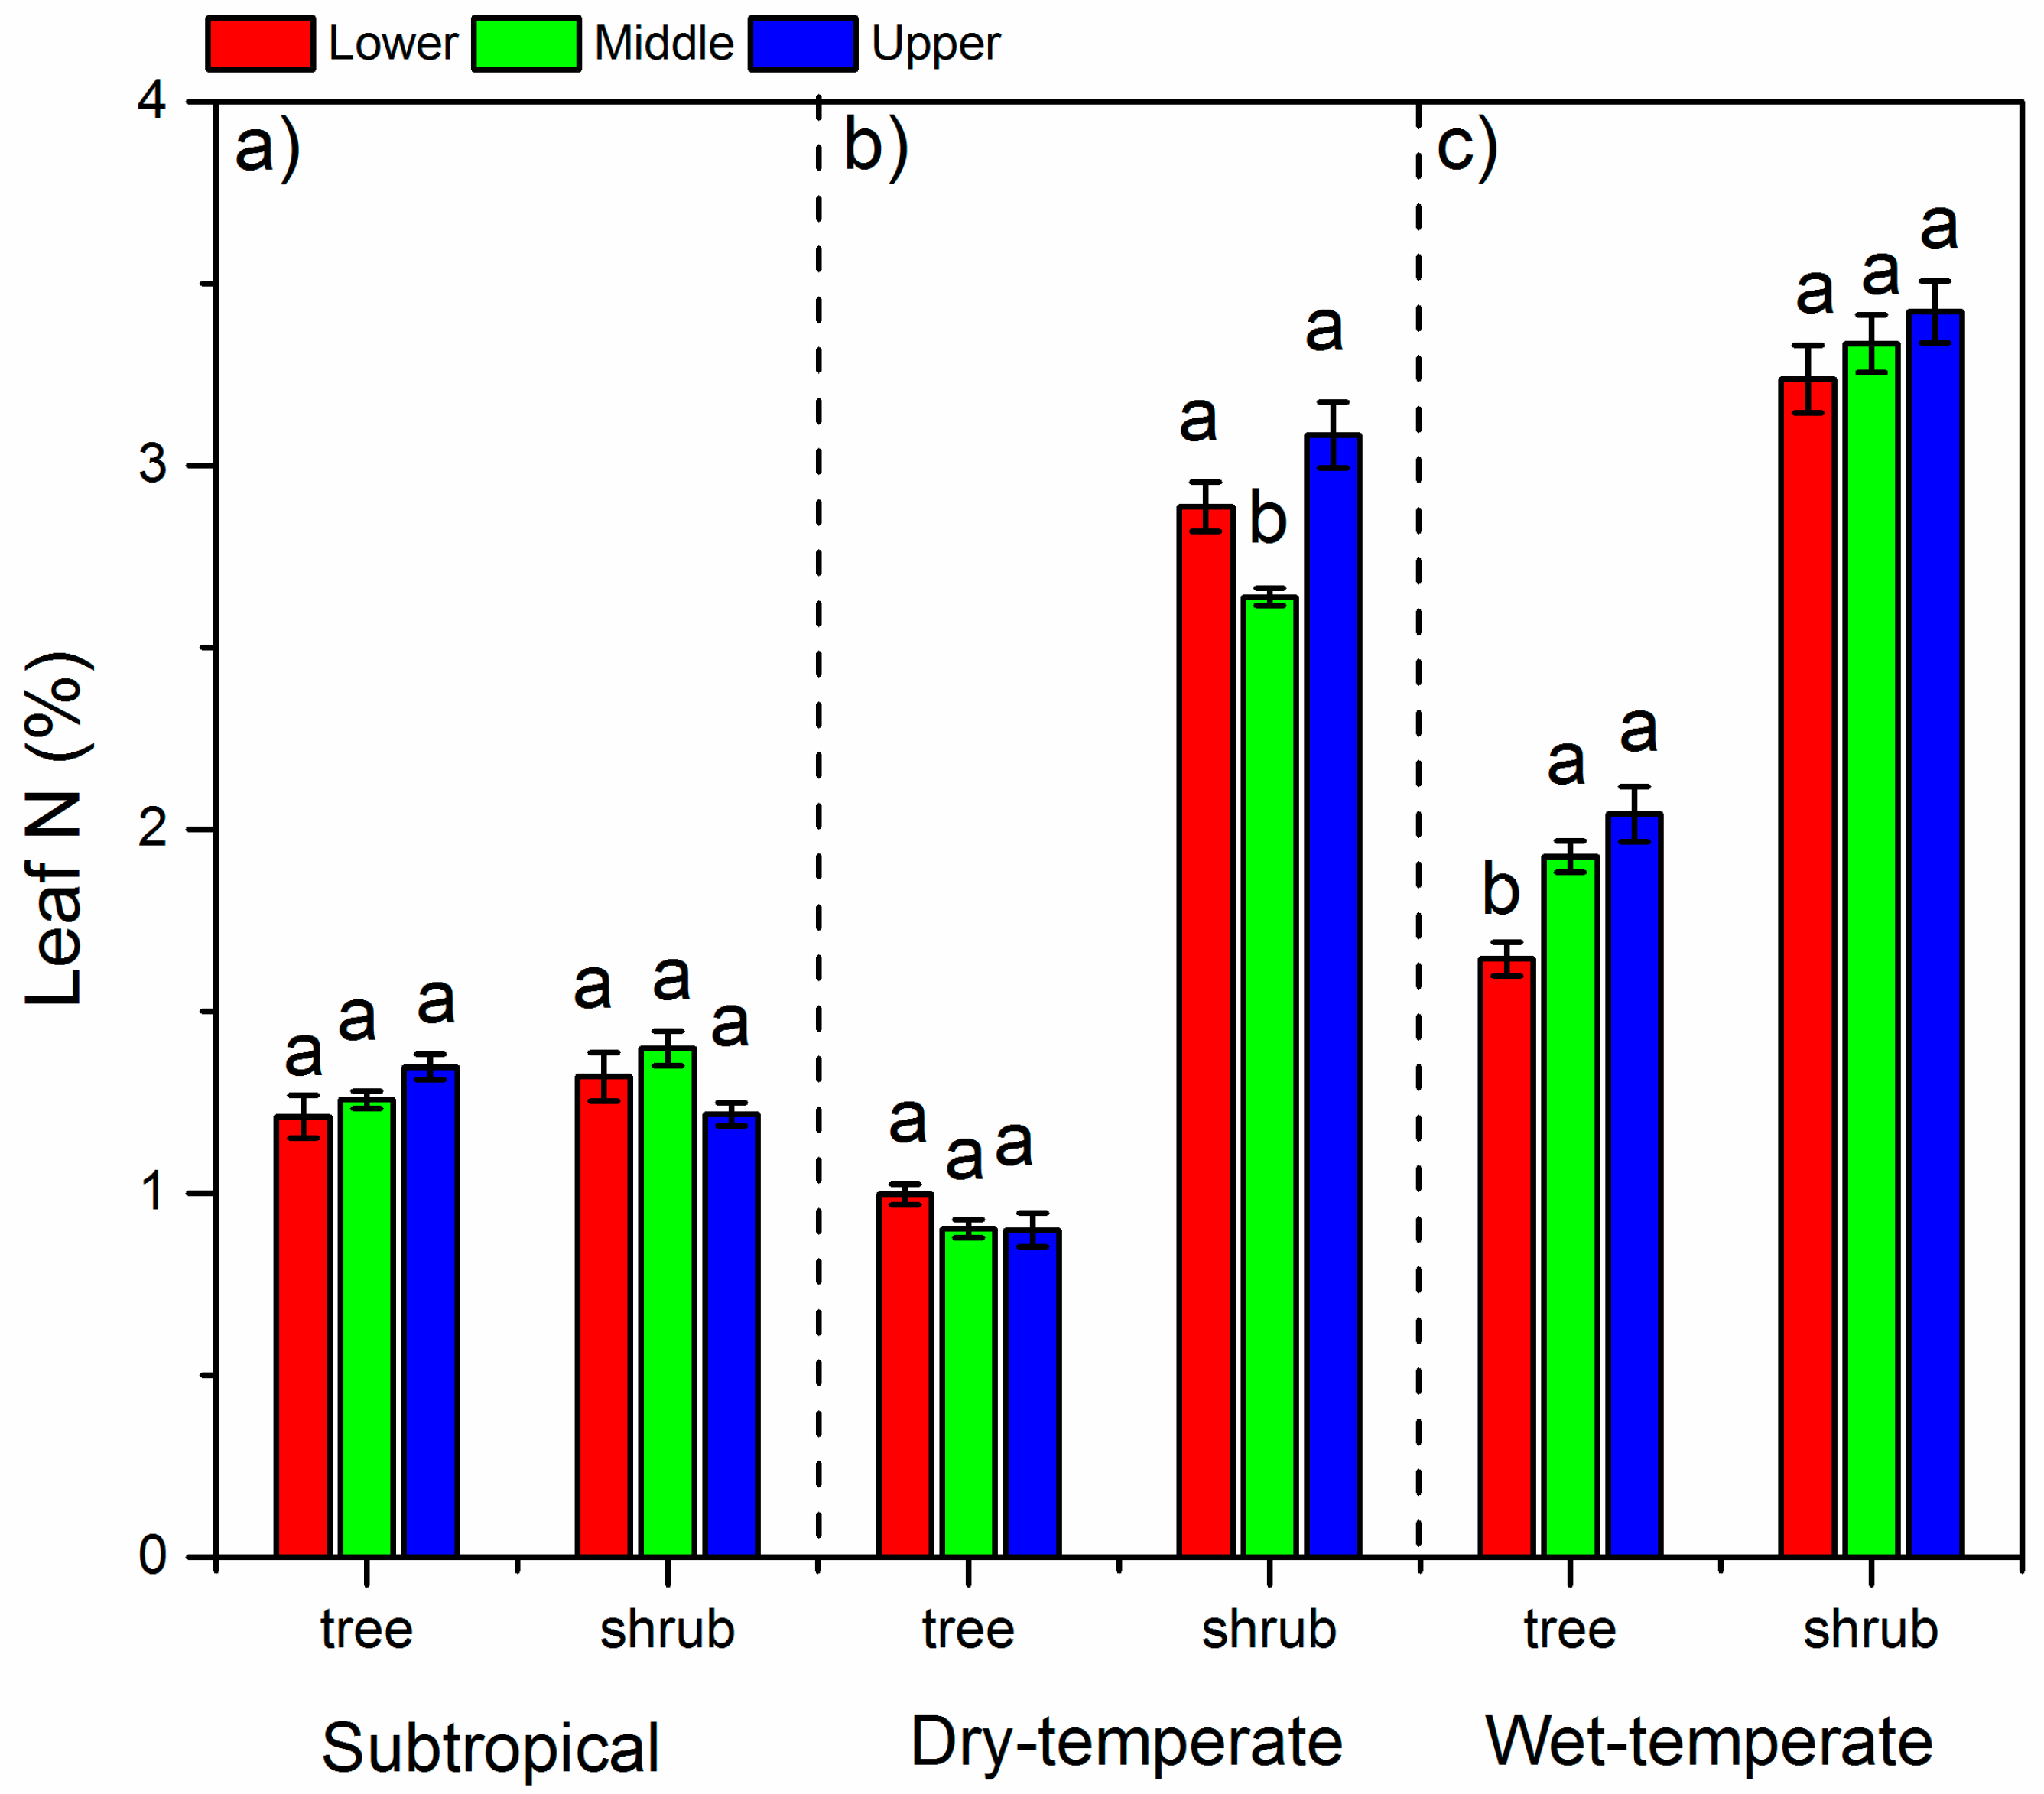
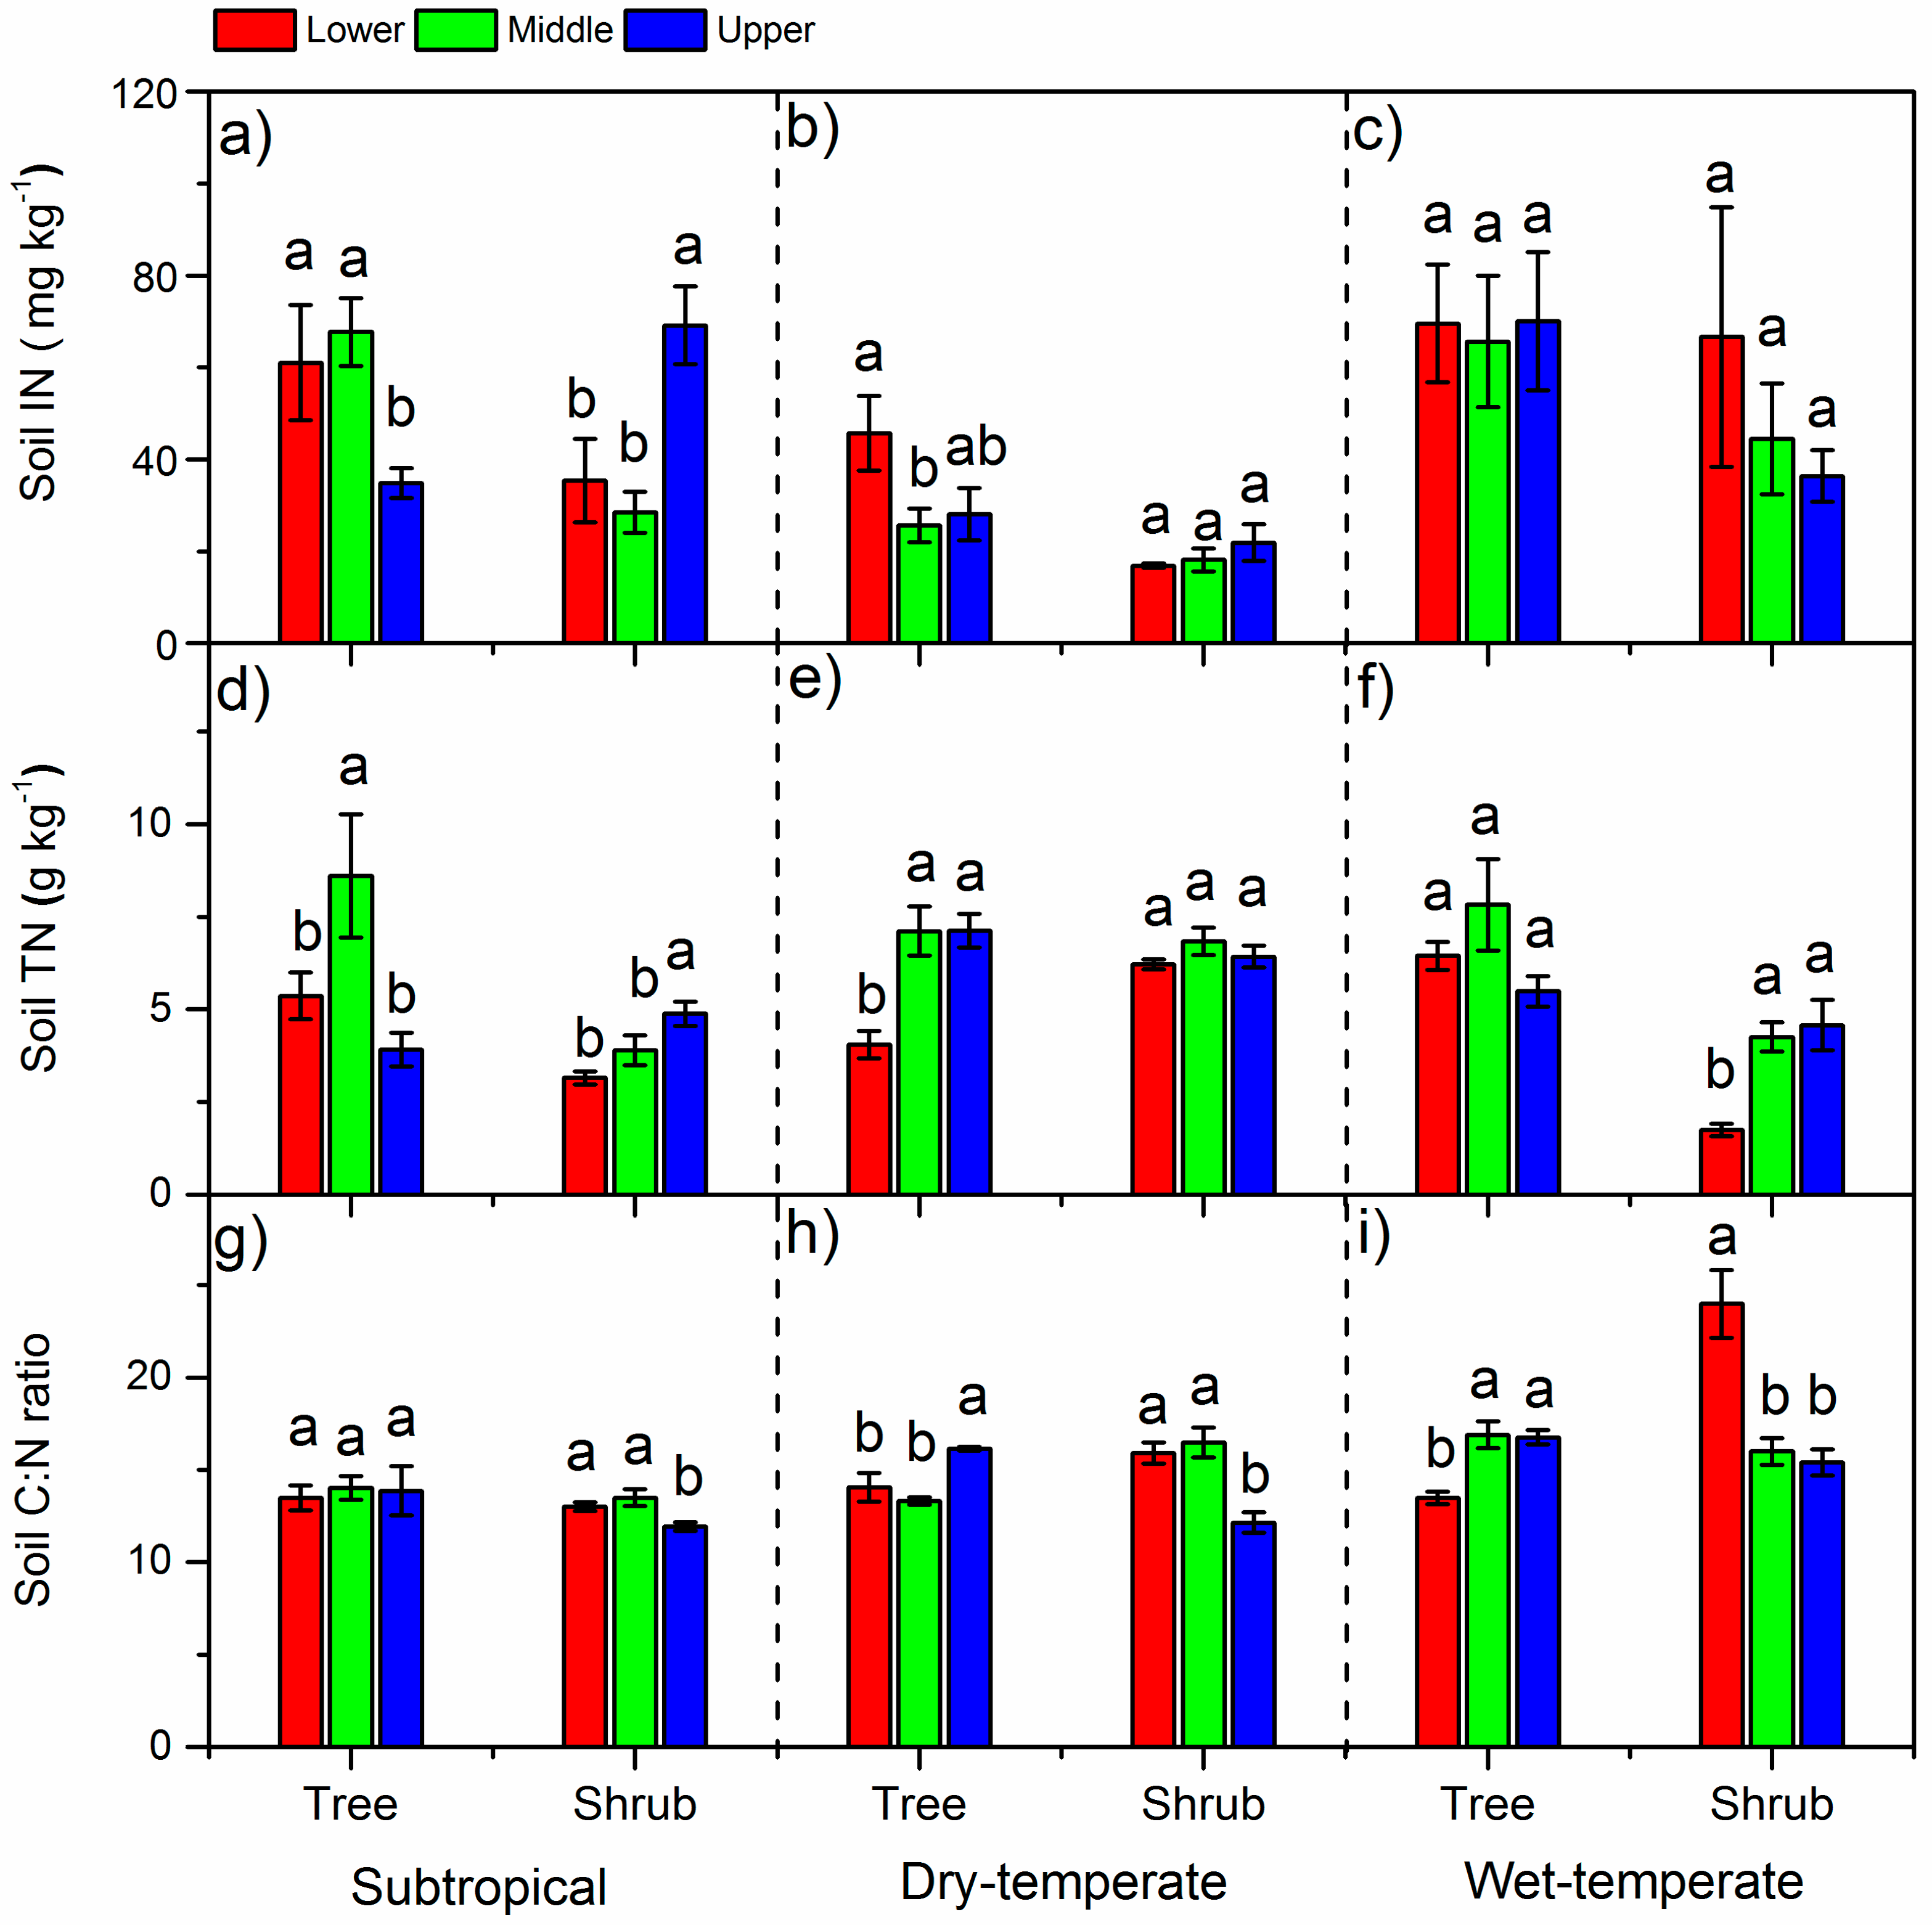
3.2. N Concentrations in Leaves and Soils and Soil C:N Ratios

N concentrations in leaves varied in different climate zones (Table 2). Altitude had the significant effect on leaf N for dry- and wet-temperate forests but had no effect on that for subtropical forest (Table 2, Figure 3). Leaf N concentrations of shrubs were significantly higher than those of trees in both dry- and wet-temperate forests (Figure 3b–c). Average leaf N in wet-temperate forest was among the highest, and followed by dry-temperate forest and then subtropical had the least leaf N (Figure 3).
Different climate zones had different soil total inorganic N (IN) and TN concentrations and soil C:N ratios (Table 2). There were significant two-way interactions of site and life form and three-way interactions of site, altitude and life form (Table 2). The response of soil available N to altitude was more sensitive in subtropical and dry-temperate forests than in wet-temperate where soil IN showed no change with increasing altitude (Figure 4a–c). Soil IN under tree canopy decreased but those under shrub canopy increased with increasing altitude in subtropical and dry-temperate forests, except that IN under shrub canopy in dry-temperate forest stabilized with increasing altitude (Figure 4a,b). The increasing altitude decreased soil TN under tree canopy but increased soil TN under shrub canopy in subtropical forest (Figure 4d). The increasing altitude increased soil TN under tree canopy but had no effect on soil TN under shrub canopy in dry-temperate forest, which was opposite in wet-temperate forest (Table 2, Figure 4e, f). Soil IN was lower but soil TN was higher in dry-temperate forest than those in subtropical and wet-temperate forests (p < 0.05, Figure 4). The soil C:N ratio under tree canopy increased but that under shrub canopy decreased with increasing altitude (Table 2; Figure 4h,i). Soil C:N ratio in wet-temperate forest (17) was the highest, followed by dry-temperate forest (15) and then subtropical forest (13; p < 0.05, Figure 4g–i).

3.3. Correlations between δ15N and Parameters in Leaves and Soils

Across all sampling mountains and plant types, both leaf δ15N and soil δ15N were negatively correlated with SOC and soil TN (Figure 5b–c); leaf δ15N was negatively affected by pH (Figure 5a), however, soil δ15N was negatively related to soil C:N (Figure 5d). Both leaf δ15N and soil δ15N were significantly correlated with leaf N in wet-temperate mountain forest (Table 3). Soil IN had a positive effect on leaf δ15N and soil δ15N in dry-temperate mountain forest (Table 3).

4. Discussion

4.1. The δ15N and N in Different Climate Zones

The average δ15N values in leaves and soils for subtropical forest was higher than the averages for both dry-and wet-temperate forests (Figure 2, p < 0.05). This finding is opposite to the synthesis of leaf δ15N values in eastern Asian forests conducted by Fang et al. [33], in which no difference of leaf δ15N values was found among tropical, subtropical and temperate forests. The opposite results may be due to the differences of the site size and species selected, since we only selected one mountain and two species in each climate zone. However, our result is consistent with the global compilation of Martinelli et al. [34], in which average leaf δ15N and soil δ15N values in tropical forests were respectively 6.5‰ and 8‰ higher than those in temperate forests. Similarly, another two global compilations have found the positive correlations of leaf and soil δ15N with increasing MAT gradients when MAT was more than −0.5 °C and 9.8 °C, respectively [11,35].
The higher mean annual temperature in subtropical mountain forest might contribute to higher leaf δ15N and soil δ15N (Table 1). Since temperature has been suggested to be a critical factor to regulate the δ15N by influencing the processes of soil mineralization, nitrification and denitrification [17,26]. These processes all fractionate nitrogen, in which more 15N-depleted nitrogen can lose and consequently the nitrogen remaining is 15N-enriched [2]. Previous studies also suggested that the δ15N was related to soil N [36] because higher soil N concentrations can accelerate the rates of microbial N transformations [37], which probably resulted in greater potential for losses of 14N and therefore higher 15N retention in leaves and soils [36]. Subtropical forest has been suggested to have more available N in soils [34], however, both soil available N and total N in the subtropical forest in our study were not higher, and we even found the negative relationship between δ15N and soil TN across the climate zones (Figure 5c), indicating that soil N is not the main cause for the higher δ15N. In addition, δ15N has also suggested to be associated with N sources [2]. Atmospheric N deposition are the main sources for both plant and soil N pools. From the review of N deposition in China by Liu et al. [38], subtropical forest had a higher N deposition than temperate forest, which might cause plant δ15N depletion because the deposited N is usually 15N-depleted [39,40]. Therefore, more atmospheric N should lead to 15N more depleted in leaves and soils. However, enhanced N deposition could also increase the soil N availability, which may further stimulate soil N biogeochemical process and thereafter lead to more enriched 15N in soils.

4.2. Variation of δ15N and N Along the Altitude

Although the relationship of leaf δ15N and altitude was not linear in all the three climate zones, we found that leaf δ15N of both trees and shrubs was consistently lower at the upper limit than at lower altitude. Unlike the patterns of leaf δ15N along the altitude, the response of leaf Δδ15N and soil δ15N to altitude was climate zone-depended, showing no consistent trend for the three climate zones. Previous studies have observed a significant relationship between δ15N and altitude. For example, Sah and Brume [41] found leaf δ15N of Pinus roxburghii was negatively correlated with altitude (ranging from 1200 to 2200 m a.s.l.) in a pine forest in Nepal. Similarly, leaf δ15N was more negative at higher altitude, which has been observed in Gongga Mountain in southwest China, ranging from 1100 to 4900 m a.s.l. [42]. However, leaf δ15N decreased with altitude from 400 to 1350 m a.s.l. and then increased above 1350 m a.s.l. in Dongling mountain [43]. The previous study of Vitousek et al. [4] also found that there was no relationship between leaf δ15N and altitude.
The altitudes in the present study ranged from 2840 to 3670 m a.s.l., 2540 to 3550 m a.s.l. and 1430 to 2380 m a.s.l. in subtropical, dry-temperate and wet-temperate mountain forests, respectively (Table 1). The lower leaf δ15N at higher altitude might be attributed to decreased temperature induced by high altitude because cold temperature could weaken the activity of soil microbes and thereafter reduce the N uptake for plants and soil N loss from ammonia volatilization and other gas N losses (such as N2O, NO), and thereby more 14N-enriched retains in soils [41]. However, the response of leaf Δδ15N values to elevation was inconsistent in three climate zones. The negative Δδ15N values for all trees and shrubs indicated the mineral N uptake during 15N discrimination processes, and different plants discriminate against 15N via associations with mycorrhizal fungus, which deliver 15N-depleted N to plants [14,44]. For soil δ15N along the altitude, however, not only temperature but also other factors tended to have effect on soil δ15N in our study areas (Figure 2f). In general, soil δ15N could index long-term dynamics of N cycling, and other factors, such as, soil pH, SOC and soil C:N ratio, might co-regulate soil δ15N (Table 3, Figure 5).

4.3. Variation of δ15N and N between Life Forms

Across the climate zones, leaf δ15N of both shrubs and trees were more depleted at the upper limits than at lower altitudes. This result indicates that in spite of different species, the depleted δ15N at higher altitude might be a general pattern.
However, the values of δ15N varied between life forms in our study, especially the significant difference of δ15N between shrub and tree in wet-temperate mountain forest. Different δ15N values indicated different use of N sources in the same regions. The shrub Vaccinium uliginosum is a typical ericoid mycorrhizal plant, which could be more depleted in 15N [11,15,45]. Since ericoid plants have been considered to be more reliant on mycorrhizal fungi and thereafter obtained more depleted 15N [46]. However, Vaccinium uliginosum was more enriched than Betula ermanii (ectomycorrhizal plant) in wet-temperate forest and even other plants (ectomycorrhizal plants or arbuscular mycorrhizal plants) selected in both subtropical and dry-temperate forest in the present study. This is consistent with the study of δ15N among life forms conducted by Schulze et al. [47], in which Vaccinium was more enriched than other plants at the northern treeline of Alaska. The authors attributed it to more organic N (normally 15N enriched) uptake by ericoid mycorrhizae. In addition, leaf δ15N in trees were not more enriched than in shrubs at their corresponding upper limits (i.e., treeline and shrubline), although the shrublines are higher than the treelines. It has been suggested that higher leaf N concentrations tend to higher leaf δ15N [48,49]. For instance, from the synthesis of the global patterns of N isotope compositions, a large proportion of the variation in leaf δ15N was explained by leaf N concentrations, although only occurring above a mean annual temperature (MAT) of −0.5 °C [11]. In the present study, higher leaf δ15N in shrub might be attributed to its higher leaf N concentration (Table 3). However, higher leaf N in shrub in dry-temperate did not lead to its higher leaf δ15N. This suggests that δ15N is species- and site-determined in our study.

5. Conclusions

Our results showed that leaf δ15N and soil δ15N were higher in subtropical forest than in dry- and wet-temperate forests. Leaf δ15N of both treeline and shrubline species in three climate zones decreased with increasing altitude, whereas the response of leaf Δδ15N and soil δ15N to altitude varied in different climate zones. δ15N values differed between trees and shrubs in different climate zones. Different responses of leaf and soil δ15N to altitude indicate the complexity of soil biogeochemical process and N sources uptake along with environmental variations. Higher δ15N values in subtropical forest indicate that N cycles are more open in warm regions. The nutrient-related effect can also explain the patterns of δ15N, but their effects are species- and site-dependent. Overall, the patterns of N isotopes give insights into understanding the potential climate and edaphic influence on N cycles in high-latitude and high-altitude ecosystems.

Author Contributions

Funding acquisition, X.W. and M.-H.L.; Methodology, F.-H.Y.; Supervision, Y.J. and M.-H.L.; Writing—original draft, X.W.; Writing—review & editing, H.R. and F.-H.Y.

Funding

This work was funded by Research and Innovation Initiatives of Taizhou University (2017PY033), the National Natural Science Foundation of China (41371076), and Sino-Swiss Science and Technology Cooperation (SSSTC) program (EG 06-032015).

Acknowledgments

We would like to thank Yun-Ting Fang for the comments on earlier versions of the manuscript. We appreciate the help of Xiao-bin Li on the field sampling.

Conflicts of Interest

The authors declare that they have no conflict of interest.

References

  1. Robinson, D. δ15N as an integrator of the nitrogen cycle. Trends Ecol. Evol. 2001, 16, 153–162. [Google Scholar] [CrossRef]
  2. Högberg, P. 15N natural abundance in soil-plant systems. New Phytol. 1997, 137, 179–203. [Google Scholar] [CrossRef]
  3. Austin, A.; Vitousek, P.M. Nutrient dynamics on a precipitation gradient in Hawai’i. Oecologia 1998, 113, 519–529. [Google Scholar] [CrossRef] [PubMed]
  4. Vitousek, P.M.; Shearer, G.; Kohl, D.H. Foliar 15N natural abundance in Hawaiian rainforest: Patterns and possible mechanisms. Oecologia 1989, 78, 383–388. [Google Scholar] [CrossRef] [PubMed]
  5. Handley, L.L.; Austin, A.T.; Stewart, G.R.; Robinson, D.; Scrimgeour, C.M.; Raven, J.A.; Schmidt, S. The 15-N natural abundance (δ15N) of ecosystem samples reflects measures of water availability. Aust. J. Plant. Phys. 1999, 26, 185–199. [Google Scholar]
  6. Mizutani, H.; Kabaya, Y.; Wada, E. Linear correlation netween latitude and soil 15N enrichment at seabird rookeries. Naturwissenschaften 1991, 78, 34–36. [Google Scholar] [CrossRef]
  7. Craine, J.M.; Brookshire, E.N.J.; Cramer, M.D.; Hasselquist, N.J.; Koba, K.; Marin-Spiotta, E.; Wang, L. Ecological interpretations of nitrogen isotope ratios of terrestrial plants and soils. Plant Soil 2015, 396, 1–26. [Google Scholar] [CrossRef] [Green Version]
  8. Gavazov, K.; Hagedorn, F.; Buttler, A.; Siegwolf, R.; Bragazza, L. Environmental drivers of carbon and nitrogen isotopic signatures in peatland vascular plants along an altitude gradient. Oecologia 2016, 180, 257–264. [Google Scholar] [CrossRef] [PubMed]
  9. Bai, E.; Boutton, T.W.; Liu, F.; Wu, X.B.; Archer, S.R.; Hallmark, C.T. Spatial variation of the stable nitrogen isotope ratio of woody plants along a topoedaphic gradient in a subtropical savanna. Oecologia 2009, 159, 493–503. [Google Scholar] [CrossRef] [PubMed]
  10. Amundson, R.; Austin, A.T.; Schuur, E.A.G.; Yoo, K.; Matzek, V.; Kendall, C.; Uebersax, A.; Brenner, D.L.; Baisden, W.T. Global patterns of theisotopic composition of soil and plant nitrogen. Glob. Biogeochem. Cycles 2003, 17, 1031. [Google Scholar] [CrossRef]
  11. Craine, J.M.; Elmore, A.J.; Aidar, M.P.M.; Bustamante, M.; Dawson, T.E.; Hobbie, E.A.; Kahmen, A.; Mack, M.C.; McLauchlan, K.K.; Michelsen, A.; et al. Global patterns of foliar nitrogen isotopes and their relationships with climate, mycorrhizal fungi, foliar nutrient concentrations, and nitrogen availability. New Phytol. 2009, 183, 980–992. [Google Scholar] [CrossRef] [PubMed]
  12. Rustad, L.; Campbell JLMarion, G.; Norby, R.; Mitchell, M.; Hartley, A. A meta-analysis of the response of soil respiration, net nitrogenmineralization, and aboveground plant growth to experimental ecosystemwarming. Oecologia 2001, 126, 543–562. [Google Scholar] [CrossRef] [PubMed]
  13. Yi, X.F.; Yang, Y.Q. Enrichment of stable carbon and nitrogen isotopes of plant populations and plateau pikas along altitudes. J. Anim. Feed Sci. 2006, 15, 661–667. [Google Scholar] [CrossRef] [Green Version]
  14. Hobbie, E.A.; Peter, H. Nitrogen isotopes link mycorrhizal fungi and plants to nitrogen dynamics. New Phytol. 2012, 196, 367–382. [Google Scholar] [CrossRef] [PubMed]
  15. He, X.H.; Xu, M.G.; Qiu, G.Y.; Zhou, J.B. Use of 15N stable isotope to quantify nitrogen transfer between mycorrhizal plants. J. Plant Ecol. 2009, 2, 107–118. [Google Scholar] [CrossRef] [Green Version]
  16. Michelsen, A.; Schmidt, I.K.; Jonasson, S.; Quarmby, C.; Sleep, D. Leaf 15 N abundance of subarctic plants provides field evidence that ericoid, ectomycorrhizal and non-and arbuscular mycorrhizal species access different sources of soil nitrogen. Oecologia 1996, 105, 53–63. [Google Scholar] [CrossRef] [PubMed]
  17. Chang, R.; Wang, G.; Yang, Y.; Chen, X. Experimental warming increased soil nitrogen sink in the Tibetan permafrost. J. Geophys. Res. Biogeosci. 2017, 122, 1870–1879. [Google Scholar] [CrossRef]
  18. Dial, R.J.; Smeltz, T.S.; Sullivan, P.F.; Rinas, C.L.; Timm, K.; Geck, J.E.; Tobin, S.C.; Golden, T.S.; Berg, E.C. Shrubline but not treeline advance matches climate velocity in montane ecosystems of south-central Alaska. Glob. Chang. Biol. 2016, 22, 1841–1856. [Google Scholar] [CrossRef]
  19. Myers-Smith, I.H.; Hik, D.S. Climate warming as a driver of tundra shrubline advance. J. Ecol. 2018, 106, 547–560. [Google Scholar] [CrossRef]
  20. Körner, C. A re-assessment of high elevation treeline positions and their explanation. Oecologia 1998, 115, 445–459. [Google Scholar] [CrossRef] [Green Version]
  21. Sullivan, P.F.; Ellison, S.B.Z.; McNown, R.W.; Brownlee, A.H.; Sveinbjoernsson, B. Evidence of soil nutrient availability as the proximate constraint on growth of treeline trees in northwest Alaska. Ecology 2015, 96, 716–727. [Google Scholar] [CrossRef] [PubMed]
  22. Mohl, P.; Morsdorf, M.A.; Dawes, M.A.; Hagedorn, F.; Bebi, P.; Viglietti, D.; Freppaz, M.; Wipf, S.; Korner, C.; Thomas, F.M.; et al. Twelve years of low nutrient input stimulates growth of trees and dwarf shrubs in the treeline ecotone. J. Ecol. 2019, 107, 768–780. [Google Scholar] [CrossRef]
  23. Myers-Smith, I. Shrub Line Advance in Alpine Tundra of the Kluane Region: Mechanisms of Expansion and Ecosystem Impacts. Arctic 2007, 60, 447–451. [Google Scholar] [CrossRef]
  24. Harsch, M.A.; Hulme, P.E.; McGlone, M.S.; Duncan, R.P. Are treelines advancing? A global meta-analysis of treeline response to climate warming. Ecol. Lett. 2009, 12, 1040–1049. [Google Scholar] [CrossRef] [PubMed]
  25. Hagedorn, F.; Shiyatov, S.G.; Mazepa, V.S.; Devi, N.M.; Grigor’ev, A.A.; Bartysh, A.A.; Fomin, V.V.; Kapralov, D.S.; Terent’ev, M.; Bugman, H.; et al. Treeline advances along the Urals mountain range—Driven by improved winter conditions? Glob. Chang. Biol. 2014, 20, 3530–3543. [Google Scholar] [CrossRef] [PubMed]
  26. Dawes, M.A.; Schleppi, P.; Hattenschwiler, S.; Rixen, C.; Hagedorn, F. Soil warming opens the nitrogen cycle at the alpine treeline. Glob. Chang. Biol. 2017, 23, 421–434. [Google Scholar] [CrossRef] [PubMed]
  27. Wang, A.; Wang, X.; Tognetti, R.; Lei, J.P.; Pan, H.L.; Liu, X.L.; Jiang, Y.; Wang, X.Y.; He, P.; Yu, F.H.; et al. Elevation alters carbon and nutrient concentrations and stoichiometry in Quercus aquifolioides in southwestern China. Sci. Total Environ. 2018, 622, 1463–1475. [Google Scholar] [CrossRef] [PubMed]
  28. Qiang, W.Y.; Wang, X.L.; Chen, T.; Feng, H.Y.; An, L.Z.; He, Y.Q.; Wang, G. Variations of stomatal density and carbon isotope values of Picea crassifolia at different altitudes in the Qilian Mountains. Trees 2003, 17, 258–262. [Google Scholar]
  29. Yu, D.; Wang, Q.; Liu, J.; Zhou, W.; Qi, L.; Wang, X.; Zhou, L.; Dai, L. Formation mechanisms of the alpine Erman’s birch (Betula ermanii) treeline on Changbai Mountain in Northeast China. Trees 2014, 28, 935–947. [Google Scholar] [CrossRef]
  30. WRB, I.W.G. World Reference Base for Soil Resource 2014, International Soil Classification System for Naming Soils and Creating Legends for Soil Maps; World Soil Resources Reports No. 106; FAO: Rome, Italy, 2014. [Google Scholar]
  31. Mariotti, A. Atmospheric nitrogen is a reliable standard for natural 15N abundance measurements. Nature 1983, 303, 685–687. [Google Scholar] [CrossRef]
  32. Wang, R.; Dungait, J.A.J.; Creamer, C.A.; Cai, J.; Bo, L.; Xu, Z.; Zhang, Y.; Ma, Y.; Yong, J. Carbon and nitrogen dynamics in soil aggregates under long-term nitrogen and water addition in a temperate steppe. Soil Sci. Soc. Am. J. 2015, 79, 527–535. [Google Scholar] [CrossRef]
  33. Fang, Y.; Koba, K.; Yoh, M.; Makabe, A.; Liu, X. Patterns of foliar delta δ15N and their control in Eastern Asian forests. Ecol. Res. 2013, 28, 735–748. [Google Scholar] [CrossRef]
  34. Martinelli, L.A.; Piccolo, M.C.; Townsend, A.R.; Vitousek, P.M.; Cuevas, E.; Mcdowell, W.; Robertson, G.P.; Santos, O.C.; Treseder, K. Nitrogen stable isotopic composition of leaves and soil: Tropical versus temperate forests. Biogeochemistry 1999, 46, 45–65. [Google Scholar] [CrossRef]
  35. Craine, J.M.; Elmore, A.J.; Wang, L.; Augusto, L.; Baisden, W.T.; Brookshire, E.N.J.; Cramer, M.D.; Hasselquist, N.J.; Hobbie, E.A.; Kahmen, A.; et al. Convergence of soil nitrogen isotopes across global climate gradients. Sci. Rep. 2015, 5, 8280. [Google Scholar] [CrossRef] [PubMed]
  36. Pardo, L.H.; Templer, P.H.; Goodale, C.L.; Duke, S.; Groffman, P.M.; Adams, M.B.; Boeckx, P.; Boggs, J.; Campbell, J.; Colman, B. Regional Assessment of N Saturation using Foliar and Root δ15N. Biogeochemistry 2006, 80, 143–171. [Google Scholar] [CrossRef]
  37. Booth, M.; Stark, J.E. Controls on nitrogen cycling in terrestrial ecosystems: A synthetic analysis of literature data. Ecol. Monogr. 2005, 75, 139–157. [Google Scholar] [CrossRef]
  38. Liu, X.; Duan, L.; Mo, J.; Du, E.; Shen, J.; Lu, X.; Zhang, Y.; Zhou, X.; He, C.; Zhang, F. Nitrogen deposition and its ecological impact in China: An overview. Environ. Pollut. 2011, 159, 2251–2264. [Google Scholar] [CrossRef] [PubMed]
  39. Garten, C.T.J. Nitrogen isotope composition of ammonium and nitrate in bulk precipitation and forest throughfall. Int. J. Environ. Anal. Chem. 1992, 47, 33–45. [Google Scholar] [CrossRef]
  40. Houlton, B.Z.; Edith, B. Imprint of denitrifying bacteria on the global terrestrial biosphere. Proc. Natl. Acad. Sci. USA 2009, 106, 21713–21716. [Google Scholar] [CrossRef] [PubMed] [Green Version]
  41. Sah, S.; Brume, R. Altitudinal gradients of natural abundance of stable isotopes of nitrogen and carbon in the needles and soil of a pine forest in Nepal. J. For. Sci. 2003, 49, 19–26. [Google Scholar] [CrossRef]
  42. Liu, X.-Z.; Wang, G. Measurements of nitrogen isotope composition of plants and surface soils along the altitudinal transect of the eastern slope of Mount Gongga in southwest China. Rapid Commun. Mass Spectrom. 2010, 24, 3063–3071. [Google Scholar] [CrossRef] [PubMed]
  43. Liu, X.Z.; Wang, G.A. Nitrogen isotope composition characteristics of modern plants and their variations along an altitudinal gradient in Dongling Mountain in Beijing. Sci. China 2010, 53, 128–140. [Google Scholar] [CrossRef]
  44. Hobbie, E.A.; Colpaert, J.V. Nitrogen Availability and Colonization by Mycorrhizal Fungi Correlate with Nitrogen Isotope Patterns in Plants. New Phytol. 2003, 157, 115–126. [Google Scholar] [CrossRef]
  45. He, X.H.; Critchley, C.; Bledsoe, C. Nitrogen Transfer Within and Between Plants Through Common Mycorrhizal Networks (CMNs). Crit. Rev. Plant Sci. 2003, 22, 531–567. [Google Scholar] [CrossRef]
  46. Hobbie, E.A.; Jumpponen, A.J. Foliar and fungal 15N:14N ratios reflect development of mycorrhizae and nitrogen supply during primary succession: Testing analytical models. Oecologia 2005, 146, 258–268. [Google Scholar] [CrossRef]
  47. Schulze, E.D.; Chapin, F.S.; Gebauer, G. Nitrogen nutrition and isotope differences among life forms at the northern treeline of Alaska. Oecologia 1994, 100, 406–412. [Google Scholar] [CrossRef]
  48. Pardo, L.H.; McNulty, S.G.; Boggs, J.L.; Duke, S. Regional patterns in foliar 15N across a gradient of nitrogen deposition in the northeastern US. Environ. Pollut. 2007, 149, 293–302. [Google Scholar] [CrossRef]
  49. Kang, H.; Liu, C.; Yu, W.; Wu, L.; Chen, D.; Sun, X.; Ma, X.; Hu, H.; Zhu, X. Variation in foliar δ 15N among oriental oak (Quercus variabilis) stands over eastern China: Patterns and interactions. J. Geochem. Explor. 2011, 110, 8–14. [Google Scholar] [CrossRef]
Figure 1. Location of three sampling sites of Balang Mt. (subtropical), Qilian Mt. (dry-temperate) and Changbai Mt. (wet-temperate).
Forests 10 00557 g001
Figure 2. Leaf δ15N, soil δ15N and leaf Δδ15N (i.e., δ15Nleaf − δ15Nsoil) of trees and shrubs along the altitude in subtropical (a,d,g), dry-temperate (b,e,h) and wet-temperate mountain forest (c,f,i), different lower case letters indicate the difference for shrub δ15N between altitudes and upper case letters indicate the difference for tree δ15N between altitudes.
Forests 10 00557 g002
Figure 3. Leaf N of trees and shrubs along the altitude in subtropical (a), dry-temperate (b) and wet-temperate mountain forest (c), different lower case letters indicate the difference for leaf N concentration between altitudes.
Forests 10 00557 g003
Figure 4. Soil IN, TN and C:N ratio under the canopy of trees and shrubs along the altitude in subtropical (a,d,g), dry-temperate (b,e,h) and wet-temperate mountain forest (c,f,i), lower case letters indicate the difference for the parameters between altitudes.
Forests 10 00557 g004
Figure 5. Relationships of δ15N in leaves and soils and soil physicochemical parameters across three sampling sites.
Forests 10 00557 g005
Table 1. The characteristics of sampling sites.
MountainClimate ZoneMAT (°C)MAP (mm)Longitude (E)Latitude (N)SpeciesLife FormElevation (m)
a.s.l.) *
Height (m)
Balang Sup-tropical12.8995102°58′ 30°51′ Abies faxoniana Rehder & E.H.Wilson Tree286014 ± 1.7
32909.2 ± 0.9
367011.5 ± 0.4
102°45′ 30°53′ Quercus aquifolioides Rehd. et Wils. Shrub28404.9 ± 0.1
31602.8 ± 0.4
35902.9 ± 0.2
Qilian Dry-temperate0.6435100°17′ 38°34′ Picea crassifolia Kom.Tree254013.7 ± 0.9
287015.5 ± 1.4
325011.2 ± 0.5
100°18′38°31′Salix gilashanica C. Wang, P.Y. FuShrub30001.4 ± 0.2
32501.2 ± 0.0
35501.5 ± 0.2
Changbai Wet-temperate−2.3–−3.81000128°04′ 42°03′ Betula ermanii Cham. Tree170018.9 ± 5.2
186013 ± 0.8
20306.4 ± 4.5
128°04′42°02′Vaccinium uliginosum Linn.Shrub14300.5 ± 0.0
20000.2 ± 0.0
23800.1 ± 0.0
* The elevations showed from low to high for each tree and shrub are presented as “lower”, “middle” and “upper”.
Table 2. Three-way ANONAs of the effects of climate zones (site), altitude, life form and their interactions on Leaf Δδ15N (δ15Nleaf − δ15Nsoil), and δ15N and N concentration in leaves and soils.
Source Leaf δ15NSoil δ15NLeaf Δδ15NLeaf NSoil INSoil TNSoil C:N
dfFFFFFFF
Site (S)283.4 ***44.2 ***26.0 ***790.6 ***27.7 ***4.5 *45.3 ***
Life form (L)117.8 ***7.7 **0.2ns1776.8 ***19.8 ***0.0 ns2.2 ns
Altitude (A)226.7 ***1.4 ns8.2 ***7.7 ***0.8 ns1.1 ns4.1 *
S × L24.7 *2.5 ns1.5 ns1.0 ns4.1 *4.4 *30.5 ***
S × A44.6 **5.7 ***12.8 ***7.3 ***0.6 ns5.8 ***1.1 ns
L × A232.3 ***6.5 **15.3 ***450.9 ***0.5 ns0.8 ns8.6 ***
S × L × A46.7 ***10.0 ***11.0 ***6.6 ***3.8 **3.6 **12.7 ***
*** p < 0.001, ** p < 0.01, * p < 0.05, ns p > 0.05.
Table 3. Correlation analyses (R values) of leaf δ15N and soil δ15N with leaf N and soil physicochemical parameters for each sampling site.
Leaf NSoil INSoil TNSoil pHSOCSoil C:N
Subtropical
Leaf δ15N0.249–0.2920.058–0.439 **0.036–0.015
Soil δ15N0.072–0.432 **–0.508 **–0.089–0.555 **–0.393 *
Dry-temperate
Leaf δ15N0.1720.496 **–0.484 **0.115–0.340 *0.006
Soil δ15N–0.050.476 **–0.464 **0.404 *–0.578 **–0.373 *
Wet-temperate
Leaf δ15N0.682 **–0.144–0.629 **–0.123–0.612 **0.402 *
Soil δ15N0.459 **–0.031–0.433 **–0.087–0.388 *0.099
** p < 0.01, * p < 0.05.

