Article

Nitrogen and Phosphorus Resorption in Relation to Nutrition Limitation along the Chronosequence of Black Locust (Robinia pseudoacacia L.) Plantation

1
Shaanxi Key Laboratory of Chinese Jujube, Yan’an University, Yan’an 716000, China
2
College of Life Science, Yan’an University, Yan’an 716000, China
3
College of Agronomy, Northwest A&F University, Yangling 712100, China
4
College of Urban and Environmental Science, Northwest University, Xi’an 710069, China
*
Author to whom correspondence should be addressed.
Forests 2019, 10(3), 261; https://doi.org/10.3390/f10030261
Submission received: 2 February 2019 / Revised: 1 March 2019 / Accepted: 12 March 2019 / Published: 15 March 2019
(This article belongs to the Special Issue Nutrient Cycling in Forest Ecosystems)

Abstract

:
Plant nitrogen (N) and phosphorus (P) resorption is an important strategy to conserve N and P in the face of nutrient limitation. However, little is known about the variation of N and P resorption efficiency (NRE and PRE) and their correlation with leaves and soil C:N:P stoichiometry in black locust forests (Robinia pseudoacacia L.) of different ages. In this study, we measured C, N, and P concentrations in soil, green leaves, and senesced leaves from black locust forests of different ages (i.e, 10-, 20-, 30-, 36-, and 45-year-old), and calculated the NRE, PRE, and C:N:P stoichiometry ratios. The NRE and PRE tended to increase and then decrease with stand age, ranging from 46.8% to 57.4% and from 37.4% to 58.5%, with averages of 52.61 and 51.89, respectively. The PRE:NRE decreased with increased stand ages. The C:P and N:P of soil and green leaves increased with stand ages, indicating the increase of P limitation. In the senesced leaves, C:P and N:P were lower than in green leaves and first increased and then decreased with stand age. The PRE was significantly negatively correlated with the C:P and N:P of soil and green leaves. The NRE was significantly correlated with the C concentration of green leaves, P of the senesced leaves, and C:N. Results suggested that the NRE and PRE responded differently to soil and plant nutrients in black locust forests of different ages. In addition, the black locust plantations would alter the conservation and use strategy of nutrients in the ecosystem through a plant-mediated pathway. Future studies should elucidate the central nutrient utilization strategy of black locust in response to a nutrient-poor environment and determine how it is involved in regulating nutrient resorption.

Graphical Abstract

1. Introduction

Plant nutrient resorption is the process by which a plant transfers nutrients to its growing tissues before the branches and leaves wither, effectively lengthening the retention time of nutrients in plants [1,2]. This process reduces the reliance of plants on soil nutrients, helping to maintain the ecological stoichiometry balance in plants; it also reduces nutrient leaching after litter decomposition, minimizing the ecosystem nutrient loss [2,3]. Nutrient resorption from senescing organs is one of the most important mechanisms for plants to adapt to nutrient limitation and improve nutrient utilization efficiency through conserving and optimizing the use of nutrients. This is also an important strategy to regulate nutrient cycling within plant–soil systems. Nutrient resorption can be defined as nutrient resorption efficiency (NuRE), i.e, the proportion of nutrients withdrawn from green leaves prior to senescence [4]. Therefore, research on the plant NuRE is helpful to reveal the response mechanism of plants to a nutrient-poor environment.
Nitrogen (N) and phosphorus (P), strong limiting factors of natural ecosystems, play an important role in plant growth and metabolism [5,6]. Previous studies have reported that natural forests in low latitudes areas (e.g., tropical forests) are usually limited by N [7] and those in high latitudes are limited by P [6]. In addition, chronosequence studies have shown that young forests are usually vulnerable to N limitation, while ageing forests are usually vulnerable to P limitation, especially in areas with nutrient deficiency or imbalanced N and P input [8,9]. Plant N and P resorption efficiency (NRE and PRE, respectively) attract ample attention because they play an important role in revealing the adaptability of plants to a nutrient limiting environment [10,11]. Vergutz estimated that the mean NRE and PRE for global terrestrial plants were 62.1% and 64.9%, respectively [12]. However, the NRE and PRE varies greatly depending on the species [13] and life-form [14]; NRE and PRE are also easily influenced by environmental factors (e.g., soil nutrient availability, elevation, temperature, precipitation, etc.) [13,15,16] or disturbances [17].
In forest plantations, plant photosynthetic characteristics, soil nutrient supply, and plant nutrition demands usually vary with stand age [18]. These changes may have substantial effects on plant nutrient conservation strategies, thus leading to the change of NuRE with stand age [10,19]. However, previous studies have shown inconsistent trends (e.g., increase [18], decrease [20], and no significant change [21]) of NuRE in response to stand age, which may be related to the tree species and nutrition status [10,21]. The measurement of C:N:P stoichiometry is an effective way to investigate plant and soil nutrient status. For instance, leaf N:P was used in a previous study to indicate the N (N:P < 14) or P (N:P > 16) limitation of the plants [22]. Therefore, studying NRE and PRE characteristics and their possible links with nutrition stoichiometry, together with forest age changes, may help to reveal the adaptability of forests to varying levels of nutrients [18,19]. This is of great significance to the sustainable management of plantations that are subject to nutrient restriction [10].
Due to its nitrogen fixation, fast growth, and tolerance to drought and barren lands, black locust (Robinia pseudoacacia L.) has become one of the most widely introduced tree species for ecological restoration and timber production worldwide [23,24,25]. The Loess Plateau, China, is a very ecologically fragile region that suffers from severe soil erosion and low availability of nutrients [26]. To restore the region, black locust has been introduced as the dominant plantation species with the aim to aid in soil and water conservation [27,28]. Black locust can significantly improve the soil quality by accumulating soil C and N [25,29]. However, black locust plantations grown in the long-term (for approximately 35 years) suffer from withering branches and a decline in productivity, which may indicate forest degradation [30]. Soil nutrient limitation (usually P limitation in the arid areas) [29,31] and water deficits [32,33] also may become serious with stand development. However, few studies have been conducted on how the resorption of N and P vary with the age of the black locust plantation. Therefore, we studied the adaptability of black locust to the changing nutrient status, especially the variation of NuRE with stand age, which may reveal the possible mechanism of degradation of the black locust plantation.
In this study, we examined the changes of nutrients in soil and leaves (both mature leaves and withered leaves) of black locust plantations covering an age range from 10 to 45 years old in the Loess Plateau of China. The objectives of this study were to quantify the variations of N and P resorption across the black locust plantation chronosequence and to find out whether there are any relationships between NuRE and nutrient stoichiometry indexes in leaves and soil. These data were then used to reveal the responses of plant nutrient use strategy to the altered leaf and soil nutrient status in black locust plantations of different ages. Because nutrient resorption is an important nutrient conservation mechanism and the plant nutrient demand may increase with stand age, we hypothesized that the N and P resorption will: (1) increase across the black locust plantation chronosequence, and (2) show significant negative relationships with leaf and soil N and P contents. The results may provide novel insight into the understanding of the nutrient cycling of black locust forests in arid and semi-arid areas.

2. Materials and Methods

2.1. Research Area

The research was conducted in the Loess Plateau at the Wuliwan catchment of Ansai County, Shaanxi Province, China (36°39′–36°52′ N, 109°20′–109°21′ E). The site has a hilly loess landscape and an elevation of 1010–1400 m above sea level. The study area has a typical semiarid climate with a mean annual rainfall of 505 mm, an annual average temperature of 8.8 °C, and a frost-free period of 159 days. Approximately 60% of the precipitation occurs between July and September, and the precipitation varies greatly in different years. The soil in this region is mainly loessal soil, developed from wind-accumulated loess, which has extremely poor resistance to erosion. The proportion of the differently sized soil particles in the 0–20 cm layer was 63.6% sand, 29.2% silt, and 7.2% clay. Artificial forests have been planted at the study site since the 1970s to mitigate the serious soil erosion on steeply sloped crop land [29]; therefore, the large area of plantations have different stand ages. The dominant plantation species is black locust and Caragana korshinskii Kom.

2.2. Experimental Design and Sampling

Based on the afforestation records of the local forestry department, black locust forests of five age classes (i.e., 10, 20, 30, 36, and 45 years old during field sampling in 2016, hereafter referred to as RP10, RP20, RP30, RP36, and RP45, respectively) were selected to represent a chronosequence. All of the sample lands were converted from cropland subjected to similar farming practices, namely, mainly planting maize (Zea mays L.), foxtail millet (Setaria italic L.), and broomcorn millet (Panicum miliaceum L.) with watering mainly through the rainfall and a small amount of manure was the main fertilizer. After trees were planted, the sample lands were fenced to prevent grazing and other human disturbance including thinning, wood usage, or other practices. Detailed information of the sampled lands is shown in Table 1. The climatic and edaphic conditions of the forests of five age classes were similar. Three replicate fields were measured for each black locust stand age. The three replicate fields for each stand age were within 1.5 km of one another to ensure consistent climatic variables and other conditions. In each replicate field, we randomly selected three replicated plots (20 m × 20 m) for sampling. All sites were topographically similar (i.e., slope aspect and slope degree) with similar elevation. Finally, we established 45 sampling plots (5 stand ages × 3 replicate fields × 3 sample plots).
Green and senesced leaves were collected in mid-August and mid-October 2016, respectively, when the green leaves were at peak biomass, and senesced leaves were ready to fall. At least five individual trees were selected in each sample plot. At least 20 branches were chosen around each tree from the lower, middle, and upper canopy. Approximately 50 g leaves were sampled from each individual (picked using a long reach pruner), all the leaves from the same sample plots were mixed (about 250–300 g), and then a quantity sufficient for chemical analysis (about 100 g) was taken out for analysis. The leaves with obvious diseases and/or insect pests were excluded. To avoid nutrient decomposition and leaching, the fully senesced leaves were collected from trees rather than from litter in mid-October, when they were completely yellow, dry, without any signs of deterioration, and would fall from the branch with a gentle touch [10,34]. The sample leaves were transfer to the laboratory in paper bags, then oven-dried at 105 °C for 30 min and maintained at 60 °C until a constant mass was reached. Dried sample leaves were ground and sieved with a 0.1 mm sieve.
The soil samples were collected in mid-August 2016. In each sample plot, we selected five sample points along the diagonal. Because the surface soil (0–10 cm) is the most closely related to plant nutrients [10,29], we collected soil samples at each point from the 0–10 cm layer using a soil auger with a 4 cm diameter. The soil samples from the same plot were adequately mixed and reduced by coning and quartering to achieve appropriate quantities (about 400 g). Then, the soil samples were transported to the laboratory, air-dried at room temperature (25–28 °C), and passed through a 0.25 mm sieve in preparation for soil C, N, and P analysis. To avoid the impact of roots and litter, all samples were collected 80 cm from trees after the litter layer was removed and the plant roots, stones and debris were removed before drying through hand picking and sieving. A vegetation survey was also conducted in each plot in August 2016 using five randomly selected 1 m × 1 m small plots.

2.3. Laboratory Analysis and Determination

The TOC analyzer (Total organic carbon analyzer, Shimadzu Corp., Kyoto, Japan) was used to measure the total C from soil and leaf samples (0.1 mol L−1 HCl were used to destroy the carbonates in soil). The total nitrogen (TN) content was measured using the semimicro-Kjeldahl method with a Kjeldahl auto-analyzer (KDY-9830, Beijing, China) after digestion in sulfuric acid hydrogen peroxide (for leaves) or sulfuric acid perchloric acid (for soil). Total phosphorus (TP) content was measured using the molybdenum antimony colorimetric method by using an ultraviolet spectrometer subsystem (UV-6100, Shanghai, China) after digestion following the methods as in TN measurement [35].

2.4. Calculations and Statistical Analysis

NuRE was used to quantify the nutrient resorption, which was calculated as follows [19]:
NuRE = ( 1 W 1 W 2 × MLCF ) × 100 %
where NuRE is the nutrient resorption efficiency, and W1 and W2 are the nutrient concentrations (TN or TP, g kg−1) in senesced and green leaves, respectively. MLCF is the mass loss correction factor to correct the unbiased resorption value, which is 0.784 for broad-leaved deciduous trees as introduced by Vergutz et al. [12].
The soil and leaf C:N:P stoichiometry ratios were calculated as the mass ratio. There were no missing values in our data. All data were distributed normally after the Kolmogorov–Smirnov test (p > 0.05 for each null hypothesis). Then, the Bartlett test was used to investigate the homogeneity of variance, and p > 0.05 for each null hypothesis. There were no significant differences for each soil and leaf properties between different replicate fields of the same stand ages, or between different sample plots of the same replicate fields (p > 0.05). Therefore, one-way analysis of variance (ANOVA) was used to test the differences of NuRE, nutrients and stoichiometric ratios among the plantations of different ages (the significant level was p < 0.05). A least significant difference (LSD) test was conducted for post-hoc multiple comparisons. A Pearson correlation analysis was used to estimate the relationship between NuRE and other leaf or soil nutrition properties. The relationships between the stand age and other properties were estimated by linear regression. All of the statistical analyses were conducted using SAS (SAS Institute Inc., Cary, NC, USA), and the figures were plotted in Origin 2016 (OriginLab Corporation, Northampton, MA, USA).

3. Results

3.1. Leaf and Soil C, N, and P Concentrations

The concentrations of the C and N in green leaves significantly increased from RP10 to RP36; however, the concentrations were decreased from RP36 to RP45 (p < 0.05). The concentrations of C and N ranged from 380.81–475.38 g kg−1 and 22.38–32.49 g kg−1 in all stand ages, respectively (Table 2). The P concentration of green leaves showed no significant variation among the different stand ages, except P concentration in RP45 was significantly lower (p < 0.05).
The C and N concentrations of senesced leaves increased from RP20 to RP45 with stand age (p < 0.05). The concentrations of C and N ranged from 347.27–453.97 g kg−1 and 11.64–19.40 g kg−1 in all stand ages (Table 2). The P concentration of senesced leaves showed an increasing trend with stand age, with a range of 1.14–1.37 g kg−1. The C, N, and P concentrations were all higher in green leaves than that in senesced leaves in each stand age. The only exception was the C concentrations in RP45, which was higher in senesced leaves (p < 0.05).
The C and N concentrations of soil significantly increased with stand ages (p < 0.05), ranging from 4.56–14.41 g kg−1 and 0.50–1.20 g kg−1, respectively. The soil P concentrations showed no significant changes with stand ages (Table 2).

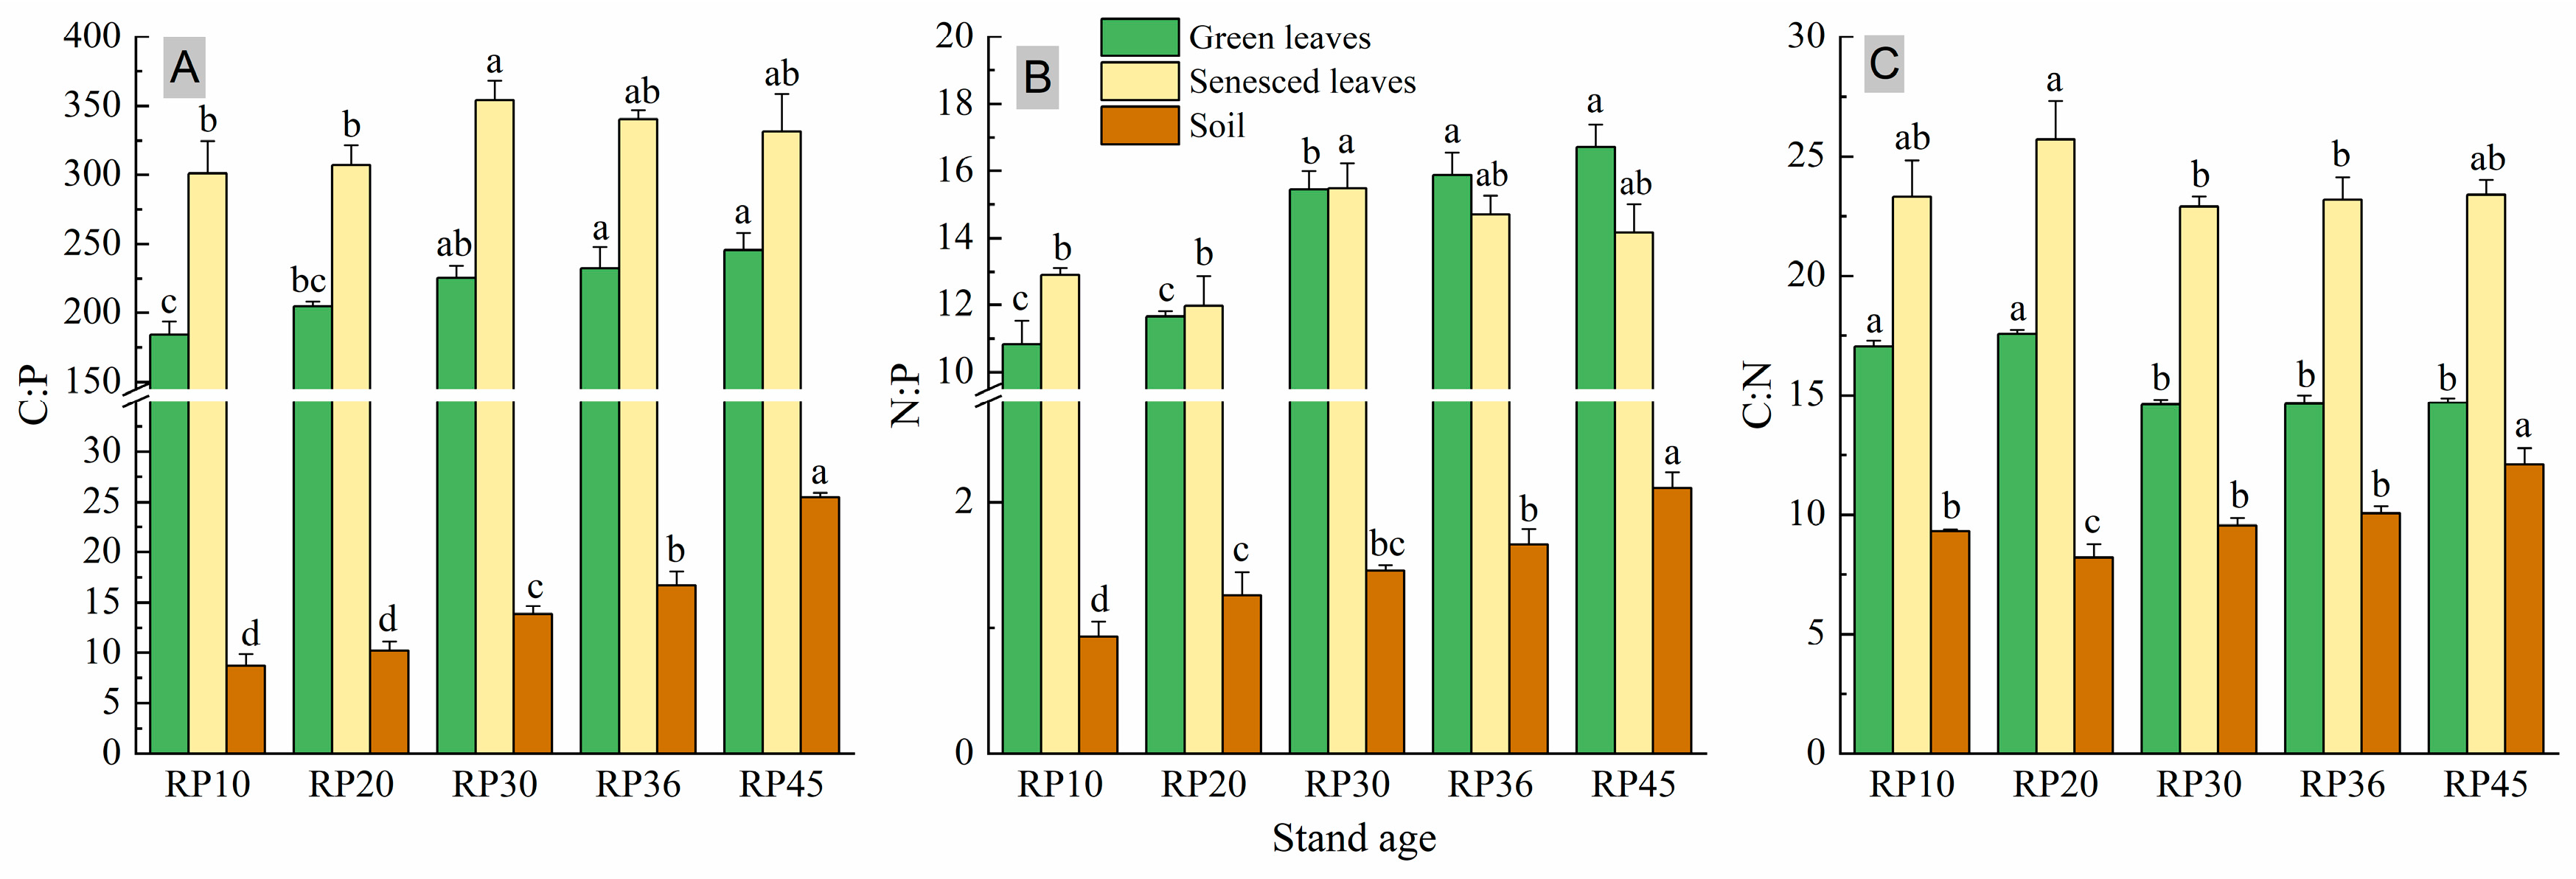
3.2. Leaf and Soil C:N:P Stoichiometry Ratios

The C:P and N:P in green leaves increased with stand age (p < 0.05), ranging from 184.22–245.60 and 10.83–16.72 with an average of 218.50 and 14.11, respectively (Figure 1). The C:N of green leaves declined as a whole with stand age (p < 0.05), ranging from 14.60–17.56 with an average of 15.70. The C:N, C:P, and N:P of senesced leaves all increased and then decreased with stand age (p < 0.05), with ranges of 22.62–29.95, 274.35–355.60, and 10.73–15.54 with averages of 23.69, 326.77, and 13.84, respectively (Figure 1). The highest C:N values in senesced leaves were measured in RP20; the highest C:P and N:P in senesced leaves were measured in RP30. Generally, the C:N and C:P of senesced leaves were higher than that of green leaves in all stand ages (p < 0.05), and the N:P of senesced leaves were higher from RP10 to RP30 and lower from RP36 to RP45 compared with that of green leaves (p < 0.05).
The soil C:P and N:P increased with stand age (p < 0.05), ranging from 8.66–25.47 and 0.93–2.11 with averages of 14.98 and 1.48, respectively. The soil C:N decreased by 11.8% from RP10 to RP20, and then increased by 47.8% from RP30 to RP45 (p < 0.05), with an average C:N of 9.83 (Figure 1).

3.3. NRE and PRE in Forests of Different Stand Ages and Their Relationship

The NRE and PRE varied among stands of different ages, with the tendency to increase and then decrease with stand age (p < 0.05). The NRE and PRE values ranged from 46.8% to 57.4% and from 37.4% to 58.5%, with averages of 52.61 and 51.89, respectively. The highest values for NRE and PRE were obtained in RP20 (Figure 2A). The NRE was higher than the PRE in RP10 and RP20, and lower in other stand ages (p < 0.05). A significantly positive correlation was found between NRE and PRE (R2 = 0.316, p < 0.05) (Figure 2B). In addition, the PRE:NRE decreased with the age of the stand (p < 0.05) (Figure 2C).

3.4. Relationships between NuRE, Nutrient Concentrations, and Stoichiometry Ratios in Leaves and Soil

Results from the Pearson correlation analysis showed that the NRE was significantly positively correlated with the C of green leaves and P of senesced leaves (p < 0.05); the NRE was significantly negatively correlated with the C:N of senesced leaves among the different stand ages (p < 0.05), whereas no significant correlation was found with other indicators (Table 3). The PRE was significantly correlated with most of the nutrient concentration and stoichiometry indicators in leaves and soil (p < 0.05). The exception for this was that the soil P; C, N, and C:N of green leaves; and C:N, C:P, and N:P of senesced leaves were not significant. The PRE was positively correlated with the P concentrations of green leaves, whereas it was negatively correlated with other significant related indicators (Table 3).

4. Discussion

4.1. Leaf and Soil Nutrient Concentration and Stoichiometry of Black Locust Forests of Different Ages

The nutrient cycle and transformation process of C, N, and P between soil and plants during vegetation restoration is the basis of material circulation in terrestrial ecosystems [36]. Soil provides the necessary nutrients for plant growth, and plants impact the soil nutrients through litter restitution, root growth, and secretions. As a result of plant growth, this correlation would also change with stand ages [37]. Previous studies have shown that the artificial vegetation in the Loess Plateau may face a nutrient imbalance with the increase of stand age, mainly manifesting as P limitation in restored ecosystems [29]. In this study, the soil C and N concentrations increased by 209.9% and 139.2% (p < 0.05) from 10-year-old to 45-year-old black locust forests, respectively (Table 1), whereas the soil P concentrations showed no significant variation among the stand ages. The different variation of soil C, N, and P may have occurred because the accumulation of soil C and N are primarily driven by biological factors (e.g., decomposition of plant litter and dead roots), but P transformations in soil are mainly driven by biochemical mineralization (e.g., phosphate decomposition, which takes a long time [29]. Compared to P, the black locust trees can more effectively import N into the soil with symbiosis of N-fixing microbes [38]. Therefore, a significant increase in soil C:P and N:P ratios was found in the older black locust forests (p < 0.05) (Figure 1). Our previous study has found a significant decrease of soil-available P and increase of available N along with the increased stand age [39]; therefore, we can speculate that the soil may be relatively deficient in P in older black locust plantations on the Loess Plateau. This provides further support for conclusions from previous studies [29,31,40].
Nutrient concentrations and stoichiometry ratios in leaves change in different growth stages [40,41]. The results showed that the average concentrations of C and N in leaves from black locust forests of different ages were 436.98 g kg−1 and 28.13 g kg−1, respectively (Table 2). The C concentration was similar to the average C content of leaves (438 g kg−1) in the Loess Plateau [42], whereas the N content was much higher than the average level in both the Loess Plateau (21.61 g kg−1) [43] and in China (18.60 g kg−1) [44]. The C and N concentration of green leaves increased and then decreased with the increase of stand ages. The concentrations peaked in the RP36 (Table 2). The overall change of C and N in black locust leaves showed the following trend: middle age forest > older forest > young forest, which was consistent with Ma et al.’s results [40]. This may be due to the accumulation of structural substances with more C in the middle- and older-aged plants compared with younger plants. The average P concentrations in green leaves from black locust forests of different ages was 2.01 g kg−1 (Table 2), which was close to or slightly less than the global average P content (2.00 g kg−1) [45] and the average of leaves from the Loess Plateau (2.09 g kg−1) [43]. However, P concentration of the green leaves did not show significant differences with the change of stand ages. The N:P ratios of green leaves increased significantly from 10.83 to 16.72 along the chronosequence of black locust forests (p < 0.05) (Figure 1). Our results suggested that the black locust plantations would shift from relative N-limitation to relative P-limitation across the chronosequence based on the criteria proposed by Güsewell [22] (i.e., leaves N:P <14, 14–16, and >16 indicating N limitation, N and P co-limitation, and P limitation, respectively). In other words, the young black locust plantations were relatively more N-limited, and the older plantations were relatively more P-limited. Similar findings have also been reported in Larix olgensis A. Henry [9], Larix kaempferi (Lamb.) Carr. [10], and other plantations [46], which showed that long-term ecosystem development tended to cause a shift from N- to P-limitation. This may be a result of the relatively easy absorption of soil N (with N-fixing microbes in the rhizosphere), but relatively inadequate P absorption by the black locust [38]. However, our research only tested the soil properties in the top layer, thus further study on nutrient effectiveness and root absorption characteristics of deep soil should also be investigated.
Leaf litter is an important way for plants to return nutrients to the soil. Typically, at least some of the nutrients in senesced leaves will be transferred to the branches before falling, resulting in lower levels of nutrients in the senesced leaves compared to the green leaves [12,14,47]. The data obtained in our study also agreed with this rule. The average concentrations of C, N, and P of senesced leaves in stands of different ages were 398.07 g kg−1, 16.89 g kg−1, and 1.22 g kg−1 (Table 2), respectively. Compared with the average level of nutrients of senesced leaves in broad-leaved forests in China (the C, N, and P concentrations was 479.9 g kg−1, 13.2 g kg−1, and 1.06 g kg−1, respectively) [48], our results showed relatively high concentrations of N and P, and low concentrations of C. Previous studies have concluded that the abundance of N and P in litter is conducive to microbial (especially bacterial) activity, thereby promoting rapid decomposition of litter, facilitating nutrient release [49,50]. In this study, the C:N and C:P of senesced leaves was 22.62–29.95 and 274.35–355.60 in black locust forests of different ages, respectively (Figure 1). These ratios are significantly lower than the average value of C:N and C:P in senesced leaves in the broad-leaved forests of China (36.36 and 452.73, respectively), demonstrating that the leaf litter in black locust forests are easy to decompose and are beneficial to nutrient release. In addition, our findings showed increasing N and P contents in senesced leaves in older stands, indicating that more N and P would be returned to the soil through litter decomposition.

4.2. N and P Resorption Correlated with Soil and Leaf Nutrients across the Plantation Chronosequence

Plants absorb nutrients from the soil and allocate them to different organs to accumulate or participate in various life activities; the nutrients will be reabsorbed before the leaves fall, thus, prolonging the retention time of nutrients in plants [14]. In this study, the N and P resorption efficiency of black locust forests of different ages were 46.8%–57.4% and 37.4%–58.5%, respectively (Figure 2A); these efficiencies are significantly lower than that of global terrestrial forests (62.1% and 64.9%, respectively) [12], and this may be due to species-dependent differences. The NRE and PRE were significant correlated with each other, and both of the NRE and PRE showed significantly increasing and then decreasing trends along the chronosequence of black locust forests (Figure 2), which was consistent with previous research in Pinus massoniana Lamb and Metasequoia glyptostroboides Hu et Cheng plantations of different ages [19,51]. This variation may be because young plants have rapid biomass production, thus need a higher N and P resorption efficiency to supply an appropriate amount of nutrients [19]. Black locust has greater N absorbing efficiency than P absorbing efficiency with symbiosis of N-fixing microbes around roots. Meanwhile, the rapid growth of young trees requires more P for production of genetic material. These reasons may likely result in a greater PRE than NRE in 10-year-old and 20-year-old forests [40]. A similar trend was also reported in Eucalyptus urophylla S.T. Blake × E. grandis W. Mill ex Maiden forests [20]. In the older growth stage of black locust forests, the PRE significantly decreased with the increasing stand ages, causing a deficit of P in the soil and trees. This disagrees with our first hypothesis, which may be because the wood biomass became an effective reservoir of P in the later stage of plant growth, thus reducing the P resorption from fallen leaves [52,53]. This indicated that nutrient resorption may not be the main strategy for the preservation of P elements in the older black locust forests. In addition, the NRE decreased with the age of the stand, which is contrary to our first hypothesis. Previous research does not support that tree growth depended more on N resorption to supply its N requirements with the development of the stand [18,37], but it is consistent with the view that decreased NRE was a result of sufficient soil N supply after decomposition [19]. The increased N concentration in soil and senesced leaves with the older stands and relatively low C:N of senesced leaves in our study also supported this view.
The nutrition resorption may be individually or collectively affected by soil nutrient conditions and nutrient contents of green leaves and senesced leaves [12,54]. There is still great uncertainty about the degree of influence and direction of these factors. For example, a study conducted by Aerts reported that there was no significant correlation between NuRE and nutrient concentrations in soil and green leaves, but a negative correlation was found with the nutrient content in senesced leaves [1,55]. However, a study conducted by Vergutz et al. based on data at a global scale concluded that the NuRE depends more on the nutrient state of green leaves than on the senesced leaves [12]. In addition, other studies have also shown that plants subject to N or P limitation should have higher N or P resorption efficiency [56,57]. Killingbeck proposed that nutrient transfer and resorption may be only an inherent feature of species [58], indicating that genetic differences in plants may be the main factor determining nutrient resorption [54,59]. Our results demonstrated that the NRE of black locust forests was significantly correlated with the C concentration in green leaves, P in senesced leaves, and C:N (p < 0.05). No significant correlations were found with soil nutrients (Table 3). This was consistent with a previous study that reported no impact of soil nutrients on NRE [11,55], whereas the PRE was significantly correlated with most of the nutrient content and C:N:P stoichiometry ratios of soil and leaves (p < 0.05). Intriguingly, the PRE was negatively correlated with P limitation indicators (i.e., N:P and C:P of soil and leaves) (Figure 3), suggesting that the PRE would be lower with greater P limitation. The decreasing PRE:NRE also indicated relatively lower rates of P resorption with increased plantation age. This was partly in accordance with our second hypothesis but in contrast with the “relative resorption hypothesis”. The “relative resorption hypothesis” revealed that N and P would show an increase in resorption when plants are growing in N- or P-limited conditions [11,60], indicating that the leaves nutrients resorption may be not be the main strategy of black locust to cope the P-limited conditions. Similar results were also observed in Metasequoia glyptostroboides and Larix gmelinii Rupr. plantations [10,19]. These studies suggested that more efficient nutrient absorption by roots should also be considered.
Though the NRE and PRE respond differently to soil and plant nutrients, the results revealed that black locust plantations would alter the conservation and use strategy of nutrients in the ecosystem through a plant-mediated pathway in different stand ages. Based on the present study and previously published studies, we speculate that more nutrients stay in senesced leaves of trees in older forests, possibly prolonging the P cycle and increasing the risk of nutrition loss by leaching in the process of litter decomposition [17,61]. However, litter decomposition may induce increased incorporation of P into the soil microbial biomass, which can promote the recycling speed of nutrients and availability of P in ecosystems [62,63]. Recent studies in P-deficient deciduous forests in Europe have shown that the absorption and return of nutrients also depend on soil P availability [62,64,65]. Our study provided limited information about how the release of litter nutrients and root nutrient absorption affect and react to soil available nutrient change in black locust forests. Since plant nutrient absorption and utilization is a complex process [17,21], future experimental studies considering certain soil nutrient species (e.g., plant available/labile forms, organically-bound forms, etc.), root nutrients absorption, and soil microbes are needed to elucidate the central nutrient utilization strategy of black locust in response to a nutrient-poor environment and how these factors are involved in regulating NuRE in different growth stages.

5. Conclusions

Along with the chronosequence of black locust plantations, the NRE and PRE both increased and then decreased. Imbalanced C, N, and P variation with the increase in stand ages may result in P limitation. The NRE was significantly correlated with the C of green leaves and the P content and C:N of senesced leaves, whereas the PRE was significantly negatively correlated with the C:P and N:P of soil and green leaves. The PRE:NRE decreased with increased stand ages. In summary, our result showed that the NRE and PRE were both changed as the stand aged. The middle-aged black locust trees (approximately 30 years) were more efficient at resorbing P and N from senesced leaves than younger and older stands, but the NRE and PRE responded differently in soil and plant nutrients. The black locust plantations would alter the conservation and use strategy of nutrients in the ecosystem through a plant-mediated pathway with increasing stand age.

Author Contributions

Conceptualization, J.D., X.L., and X.H.; Formal analysis, S.W. and F.Z.; Investigation, J.D., S.W., C.R., and W.Z.; Writing—original draft, J.D. and D.Z.; Writing—review and editing, C.R., F.Z., X.H., and G.Y.

Funding

The study was funded by the Natural Science Basic Research Program of Shaanxi Province, China (2018JQ3041); Young Talent fund of University Association for Science and Technology in Shaanxi; Scientific Research Program Funded by Shaanxi Provincial Education Department (18JK0871), and Innovation and entrepreneurship Training Program of Shaanxi Province (201820086).

Conflicts of Interest

The authors declare no conflict of interest. The funders had no role in the design of the study; in the collection, analyses, or interpretation of data; in the writing of the manuscript, or in the decision to publish the results.

References

  1. Aerts, R. Nutrient resorption from senescing leaves of perennials: Are there general patterns? J. Ecol. 1996, 84, 597–608. [Google Scholar] [CrossRef]
  2. Deng, M.; Liu, L.; Jiang, L.; Liu, W.; Wang, X.; Li, S.; Yang, S.; Wang, B. Ecosystem scale trade-off in nitrogen acquisition pathways. Nat. Ecol. Evol. 2018, 2, 1724–1734. [Google Scholar] [CrossRef] [PubMed]
  3. Lü, X.; Reed, S.C.; Yu, Q.; Han, X. Nutrient resorption helps drive intra-specific coupling of foliar nitrogen and phosphorus under nutrient-enriched conditions. Plant Soil 2016, 398, 111–120. [Google Scholar] [CrossRef]
  4. Wang, L.; Wang, L.; He, W.; An, L.; Xu, S. Nutrient resorption or accumulation of desert plants with contrasting sodium regulation strategies. Sci. Rep. UK 2017, 7, 17035. [Google Scholar] [CrossRef] [Green Version]
  5. Vitousek, P.M.; Porder, S.; Houlton, B.Z.; Chadwick, O.A. Terrestrial phosphorus limitation: Mechanisms, implications, and nitrogen and phosphorus interactions. Ecol. Appl. 2010, 20, 5–15. [Google Scholar] [CrossRef] [PubMed]
  6. Elser, J.J.; Bracken, M.E.; Cleland, E.E.; Gruner, D.S.; Harpole, W.S.; Hillebrand, H.; Ngai, J.T.; Seabloom, E.W.; Shurin, J.B.; Smith, J.E. Global analysis of nitrogen and phosphorus limitation of primary producers in freshwater, marine and terrestrial ecosystems. Ecol. Lett. 2007, 10, 1135–1142. [Google Scholar] [CrossRef] [Green Version]
  7. Campo, J. Shift from ecosystem P to N limitation at precipitation gradient in tropical dry forests at Yucatan, Mexico. Environ. Res. Lett. 2016, 11, 95006. [Google Scholar] [CrossRef]
  8. Mediavilla, S.; García-Iglesias, J.; González-Zurdo, P.; Escudero, A. Nitrogen resorption efficiency in mature trees and seedlings of four tree species co-occurring in a Mediterranean environment. Plant Soil 2014, 385, 205–215. [Google Scholar] [CrossRef]
  9. Chen, L.; Zhang, C.; Duan, W. Temporal variations in phosphorus fractions and phosphatase activities in rhizosphere and bulk soil during the development of Larix olgensis plantations. J. Plant Nutr. Soil Sci. 2015, 179, 67–77. [Google Scholar] [CrossRef]
  10. Yan, T.; Lü, X.; Zhu, J.; Yang, K.; Yu, L.; Gao, T. Changes in nitrogen and phosphorus cycling suggest a transition to phosphorus limitation with the stand development of larch plantations. Plant Soil 2018, 422, 385–396. [Google Scholar] [CrossRef]
  11. Yuan, Z.Y.; Chen, H.Y.H. Changes in nitrogen resorption of trembling aspen (Populus tremuloides) with stand development. Plant Soil 2010, 327, 121–129. [Google Scholar] [CrossRef]
  12. Vergutz, L.; Manzoni, S.; Porporato, A.; Novais, R.F.; Jackson, R.B. Global resorption efficiencies and concentrations of carbon and nutrients in leaves of terrestrial plants. Ecol. Monogr. 2012, 82, 205–220. [Google Scholar] [CrossRef] [Green Version]
  13. Yan, T.; Zhu, J.; Yang, K. Leaf nitrogen and phosphorus resorption of woody species in response to climatic conditions and soil nutrients: A meta-analysis. J. For. Res. 2018, 29, 1–9. [Google Scholar] [CrossRef]
  14. Lu, J.; Duan, B.; Yang, M.; Yang, H.; Yang, H. Research progress in nitrogen and phosphorus resorption from senesced leaves and the influence of ontogenetic and environmental factors. Acta Pratacult. Sin. 2018, 27, 178–188. [Google Scholar]
  15. Du, B.; Ji, H.; Peng, C.; Liu, X.; Liu, C. Altitudinal patterns of leaf stoichiometry and nutrient resorption in Quercus variabilis in the Baotianman Mountains, China. Plant Soil 2017, 413, 193–202. [Google Scholar] [CrossRef]
  16. Zhang, H.; Guo, W.; Yu, M.; Wang, G.G.; Wu, T. Latitudinal patterns of leaf N, P stoichiometry and nutrient resorption of Metasequoia glyptostroboides along the eastern coastline of China. Sci. Total Environ. 2018, 618, 1–6. [Google Scholar] [CrossRef] [PubMed]
  17. Wang, Z.; Lu, J.; Yang, H.; Zhang, X.; Luo, C.; Zhao, Y. Resorption of nitrogen, phosphorus and potassium from leaves of lucerne stands of different ages. Plant Soil 2014, 383, 301–312. [Google Scholar] [CrossRef]
  18. Sun, Z.; Liu, L.; Peng, S.; Peñuelas, J.; Zeng, H.; Piao, S. Age-Related Modulation of the Nitrogen Resorption Efficiency Response to Growth Requirements and Soil Nitrogen Availability in a Temperate Pine Plantation. Ecosystems 2016, 19, 698–709. [Google Scholar] [CrossRef] [Green Version]
  19. Zhang, H.; Wang, J.; Wang, J.; Guo, Z.; Wang, G.G.; Zeng, D.; Wu, T. Tree stoichiometry and nutrient resorption along a chronosequence of Metasequoia glyptostroboides forests in coastal China. For. Ecol. Manag. 2018, 430, 445–450. [Google Scholar] [CrossRef]
  20. Qiu, L.; Hu, H.; Lin, Y.; Ge, L.; Wang, K.; He, Z.; Dong, Q. Nutrient resorption effciency and C:N:P stoichiometry of Eucalyptus urophylla × E. grandis of different ages in a sandy coastal plain area. Chin. J. Appl. Environ. Biol. 2017, 23, 739–744. [Google Scholar]
  21. Zhou, L.; Addo-Danso, S.D.; Wu, P.; Li, S.; Zou, X.; Zhang, Y.; Ma, X. Leaf resorption efficiency in relation to foliar and soil nutrient concentrations and stoichiometry of Cunninghamia lanceolata with stand development in southern China. J. Soil Sediment 2016, 16, 1–12. [Google Scholar] [CrossRef]
  22. Güsewell, S. N:P ratios in terrestrial plants: Variation and functional significance. New Phytol. 2004, 164, 243–266. [Google Scholar] [CrossRef]
  23. Meng, F.; Luo, Q.; Wang, Q.; Zhang, X.; Qi, Z.; Xu, F.; Lei, X.; Cao, Y.; Chow, W.S.; Sun, G. Physiological and proteomic responses to salt stress in chloroplasts of diploid and tetraploid black locust (Robinia pseudoacacia L.). Sci. Rep. UK 2016, 6, 23098. [Google Scholar] [CrossRef]
  24. Sitzia, T.; Campagnaro, T.; Dainese, M.; Cierjacks, A. Plant species diversity in alien black locust stands: A paired comparison with native stands across a north-Mediterranean range expansion. For. Ecol. Manag. 2012, 285, 85–91. [Google Scholar] [CrossRef]
  25. Zhang, G.; Zhang, P.; Cao, Y. Ecosystem carbon and nitrogen storage following farmland afforestation with black locust (Robinia pseudoacacia) on the Loess Plateau, China. J. For. Res. 2018, 29, 761–771. [Google Scholar] [CrossRef]
  26. Hui, S.; Shao, M. Soil and water loss from the Loess Plateau in China. J. Arid Environ. 2000, 45, 9–20. [Google Scholar]
  27. Ma, C.; Luo, Y.; Shao, M.; Li, X.; Sun, L.; Jia, X. Environmental controls on sap flow in black locust forest in Loess Plateau, China. Sci. Rep. UK 2017, 7, 13160. [Google Scholar] [CrossRef] [Green Version]
  28. Liu, G.; Shang, G.; Yao, W.; Yang, Q.; Zhao, M.; Dang, X.; Guo, M.; Wang, G.; Wang, B. Ecological Effects of Soil Conservation in Loess Plateau. Bull. Chin. Acad. Sci. 2017, 32, 11–19. [Google Scholar]
  29. Deng, J.; Sun, P.; Zhao, F.; Han, X.; Yang, G.; Feng, Y.; Ren, G. Soil C, N, P and Its Stratification Ratio Affected by Artificial Vegetation in Subsoil, Loess Plateau China. PLoS ONE 2016, 11, e151446. [Google Scholar] [CrossRef] [PubMed]
  30. Wei, J.; Li, Z.; Feng, X.; Zhang, Y.; Chen, W.; Wu, X.; Jiao, L.; Wamg, X. Ecological and physiological mechanisms of growth decline of Robinia pseudoacacia plantations in the Loess Plateau of China: A review. Chin. J. Appl. Ecol. 2018, 29, 2433–2444. [Google Scholar]
  31. Cao, Y.; Chen, Y. Coupling of plant and soil C:N:P stoichiometry in black locust (Robinia pseudoacacia) plantations on the Loess Plateau, China. Trees 2017, 31, 1–12. [Google Scholar] [CrossRef]
  32. Jia, X.; Shao, M.; Zhu, Y.; Luo, Y. Soil moisture decline due to afforestation across the Loess Plateau, China. J. Hydrol. 2017, 546, 113–122. [Google Scholar] [CrossRef]
  33. Shangguan, Z.; Zheng, S. Ecological properties of soil water and effects on forest vegetation in the Loess Plateau. Int. J. Sustain. Dev. World 2006, 13, 307–314. [Google Scholar] [CrossRef]
  34. Yan, T.; Lü, X.; Yang, K.; Zhu, J. Leaf nutrient dynamics and nutrient resorption: A comparison between larch plantations and adjacent secondary forests in Northeast China. J. Plant Ecol. 2015, 9, 165–173. [Google Scholar] [CrossRef]
  35. Bao, S. Analysis of Soil Agrochemical; Chinese Agricultural Press: Beijing, China, 2000. [Google Scholar]
  36. He, J.; Lu, Y.; Fu, B. Frontier of Soil Biology; Science Press: Beijing, China, 2015. [Google Scholar]
  37. Liu, J.; Gu, Z.; Shao, H.; Zhou, F.; Peng, S. N–P stoichiometry in soil and leaves of Pinus massoniana forest at different stand ages in the subtropical soil erosion area of China. Environ. Earth Sci. 2016, 75, 1091. [Google Scholar] [CrossRef]
  38. Rice, S.K.; Westerman, B.; Federici, R. Impacts of the exotic, nitrogen-fixing black locust (Robinia pseudoacacia) on nitrogen-cycling in a pine-oak ecosystem. Plant Ecol. 2004, 174, 97–107. [Google Scholar] [CrossRef]
  39. Zhang, W.; Liu, W.; Xu, M.; Deng, J.; Han, X.; Yang, G.; Feng, Y.; Ren, G. Response of forest growth to C:N:P stoichiometry in plants and soils during Robinia pseudoacacia afforestation on the Loess Plateau, China. Geoderma 2019, 337, 280–289. [Google Scholar] [CrossRef]
  40. Ma, R.; An, S.; Huang, Y. C, N and P stoichiometry characteristics of different-aged Robinia pseudoacacia plantations on the Loess Plateau, China. Chin. J. Appl. Ecol. 2017, 28, 2787–2793. [Google Scholar]
  41. Schreeg, L.A.; Santiago, L.S.; Wright, S.J.; Turner, B.L. Stem, root, and older leaf N:P ratios are more responsive indicators of soil nutrient availability than new foliage. Ecology 2016, 95, 2062–2068. [Google Scholar] [CrossRef]
  42. Zheng, S.; Shangguan, Z. Spatial patterns of leaf nutrient traits of the plants in the Loess Plateau of China. Trees 2007, 21, 357–370. [Google Scholar] [CrossRef]
  43. Ma, L.; Chen, Y.; Zhang, X.; Yang, J.; An, S. Characteristics of Leaf Ecological Stoichiometry of Robinia pseudoacacia in Loess Plateau. Res. Soil Water Conserv. 2014, 21, 57–61. [Google Scholar]
  44. Han, W.; Fang, J.; Guo, D.; Zhang, Y. Leaf nitrogen and phosphorus stoichiometry across 753 terrestrial plant species in China. New Phytol. 2005, 168, 377–385. [Google Scholar] [CrossRef] [PubMed] [Green Version]
  45. Elser, J.J.; Sterner, R.W.; Gorokhova, E.; Fagan, W.F.; Markow, T.A.; Cotner, J.B.; Harrison, J.F.; Hobbie, S.E.; Odell, G.M.; Weider, L.W. Biological stoichiometry from genes to ecosystems. Ecol. Lett. 2008, 3, 540–550. [Google Scholar] [CrossRef]
  46. Hayes, P.; Turner, B.L.; Lambers, H.; Laliberté, E.; Bellingham, P. Foliar nutrient concentrations and resorption efficiency in plants of contrasting nutrient-acquisition strategies along a 2-million-year dune chronosequence. J. Ecol. 2014, 102, 396–410. [Google Scholar] [CrossRef]
  47. Chapin, F.S.; Moilanen, L. Nutritional Controls Over Nitrogen and Phosphorus Resorption from Alaskan Birch Leaves. Ecology 1991, 72, 709–715. [Google Scholar] [CrossRef]
  48. Xie, Y.; Liang, Y.; Xiao, H.; Zhu, R.; Luo, L.; Guo, W.; Cao, Y.; Zhang, Z.; Pan, Y.; Zheng, N.; et al. Pattern and controlling factors of terrestrial leaf litters decomposition in China. J. East China Univ. Technol. (Nat. Sci.) 2018, 41, 271–276. [Google Scholar]
  49. William, P.; Silver, W.L.; Burke, I.C.; Leo, G.; Harmon, M.E.; Currie, W.S.; King, J.Y.; Adair, E.C.; Brandt, L.A.; Hart, S.C. Global-scale similarities in nitrogen release patterns during long-term decomposition. Science 2007, 315, 361–364. [Google Scholar]
  50. Gergócs, V.; Hufnagel, L. The effect of microarthropods on litter decomposition depends on litter quality. Eur. J. Soil Biol. 2016, 75, 24–30. [Google Scholar] [CrossRef]
  51. Li, R.; Wang, S.L.; Wang, Q.K. Nutrient contents and resorption characteristics in needles of different age Pinus massoniana (Lamb.) before and after withering. Chin. J. Appl. Ecol. 2008, 19, 1443. [Google Scholar]
  52. Sardans, J.; Peñuelas, J. Trees increase their P:N ratio with size. Glob. Ecol. Biogeogr. 2015, 24, 147–156. [Google Scholar] [CrossRef]
  53. Sardans, J.; Peñuelas, J. Tree growth changes with climate and forest type are associated with relative allocation of nutrients, especially phosphorus, to leaves and wood. Glob. Ecol. Biogeogr. 2012, 22, 494–507. [Google Scholar] [CrossRef]
  54. Luyssaert, S.; Staelens, J.; De Schrijver, A. Does the commonly used estimator of nutrient resorption in tree foliage actually measure what it claims to? Oecologia 2005, 144, 177–186. [Google Scholar] [CrossRef]
  55. Aerts, R.; Chapin, F.S. The Mineral Nutrition of Wild Plants Revisited: A Re-evaluation of Processes and Patterns. Adv. Ecol. Res. 2000, 30, 1–67. [Google Scholar]
  56. Güsewell, S. Nutrient Resorption of Wetland Graminoids Is Related to the Type of Nutrient Limitation. Funct. Ecol. 2010, 19, 344–354. [Google Scholar] [CrossRef]
  57. Agüero, M.L.; Puntieri, J.; Mazzarino, M.J.; Grosfeld, J.; Barroetaveña, C. Seedling response of Nothofagus species to N and P: Linking plant architecture to N/P ratio and resorption proficiency. Trees 2014, 28, 1185–1195. [Google Scholar] [CrossRef]
  58. Killingbeck, K.T. Nutrients in Senesced Leaves: Keys to the Search for Potential Resorption and Resorption Proficiency. Ecology 1996, 77, 1716–1727. [Google Scholar] [CrossRef]
  59. De Marco, A.; Arena, C.; Giordano, M.; De Santo, A.V. Impact of the invasive tree black locust on soil properties of Mediterranean stone pine-holm oak forests. Plant Soil 2013, 372, 473–486. [Google Scholar] [CrossRef]
  60. Han, W.; Tang, L.; Chen, Y.; Fang, J. Relationship between the Relative Limitation and Resorption Efficiency of Nitrogen vs. Phosphorus in Woody Plants. PLoS ONE 2013, 8, e83366. [Google Scholar] [CrossRef] [PubMed]
  61. Lado-Monserrat, L.; Lidón, A.; Bautista, I. Litterfall, litter decomposition and associated nutrient fluxes in Pinus halepensis: Influence of tree removal intensity in a Mediterranean forest. Eur. J. For. Res. 2015, 134, 833–844. [Google Scholar] [CrossRef]
  62. Spohn, M.; Zavišić, A.; Nassal, P.; Bergkemper, F.; Schulz, S.; Marhan, S.; Schloter, M.; Kandeler, E.; Polle, A. Temporal variations of phosphorus uptake by soil microbial biomass and young beech trees in two forest soils with contrasting phosphorus stocks. Soil Biol. Biochem. 2018, 117, 191–202. [Google Scholar] [CrossRef]
  63. Zavišić, A.; Nassal, P.; Yang, N.; Heuck, C.; Spohn, M.; Marhan, S.; Pena, R.; Kandeler, E.; Polle, A. Phosphorus availabilities in beech (Fagus sylvatica L.) forests impose habitat filtering on ectomycorrhizal communities and impact tree nutrition. Soil Biol. Biochem. 2016, 98, 127–137. [Google Scholar]
  64. Netzer, F.; Schmid, C.; Herschbach, C.; Rennenberg, H. Phosphorus-nutrition of European beech (Fagus sylvatica L.) during annual growth depends on tree age and P-availability in the soil. Environ. Exp. Bot. 2017, 137, 194–207. [Google Scholar] [CrossRef]
  65. Pistocchi, C.; Mészáros, É.; Tamburini, F.; Frossard, E.; Bünemann, E.K. Biological processes dominate phosphorus dynamics under low phosphorus availability in organic horizons of temperate forest soils. Soil Biol. Biochem. 2018, 126, 64–75. [Google Scholar] [CrossRef]
Figure 1. Leaf and soil C:P ratio (A), N:P ratio (B) and C:N ratio (C) in black locust forests with different stand ages. Different lowercase letters represent significant differences among stand ages at p < 0.05, and the same letters indicate no significance.
Forests 10 00261 g001
Figure 2. (A) Changes of N and P resorption efficiency (NRE and PRE), (B) PRE:NRE along the chronosequence of black locust forests, and (C) the relationship between NRE and PRE. Data are shown as the mean ± standard deviation. Different lowercase letters represent significant differences among stand ages at p < 0.05, and the same letters indication no significant difference.
Forests 10 00261 g002
Figure 3. Correlations between PRE and soil and the C:P (A) and N:P (B) ratios of green leaves in black locust plantations from stands of different ages.
Forests 10 00261 g003
Table 1. Field site information for Robinia pseudoacacia L. plantations with different stand ages.
Stand Ages1020303645
Location36°52′00″ N
109°21′38″ E
36°52′08″ N
109°21′06″ E
36°51′36″ N
109°21′06″ E
36°51′37″ N
109°21′05″ E
36°52′16″ N
109°20′54″ E
Elevation (m)1332.311245.21283.612551121.34
Slope (°)3730353028
Aspect (°)ES38ES20EN16EN15ES10
Bulk density (g cm−3)1.091.291.051.010.98
pH8.568.628.588.518.60
Canopy density (%)4855646360
Stand density (trees hm−2)15401535135013051240
DBH (cm)6.3315.3217.2518.2719.10
Degree of herb cover (%)46.8359.1383.8776.8573.40
Number of herb species1324212223
ES and EN means East by South and Ease by North; DBH means diameter at breast height.
Table 2. Leaf and soil C, N, and P concentrations in different stand aged black locust forests.
Field SiteSoil (g kg−1)Green Leaves (g kg−1)Senesced Leaves (g kg−1)
CNPCNPCNP
RP104.65 ± 0.270.50 ± 0.030.55 ± 0.07380.81 ± 12.8922.38 ± 0.942.07 ± 0.06352.61 ± 16.5415.16 ± 0.461.18 ± 0.05
RP204.97 ± 0.090.61 ± 0.050.49 ± 0.04439.85 ± 13.3225.05 ± 0.542.15 ± 0.04348.77 ± 12.2213.62 ± 1.091.14 ± 0.02
RP308.26 ±0.710.87 ± 0.070.60 ± 0.04467.31 ± 8.5132.02 ± 0.752.07 ± 0.05409.41 ± 12.3717.90 ± 0.821.16 ± 0.06
RP368.79 ± 0.350.87 ± 0.040.53 ± 0.03475.38 ± 6.1132.49 ± 0.432.17 ± 0.11425.59 ± 11.4818.38 ± 0.511.25 ± 0.05
RP4514.41 ± 0.911.20 ± 0.130.57 ± 0.03421.53 ± 12.0628.71 ± 0.801.72 ± 0.06453.97 ± 24.1619.4 ± 0.521.37 ± 0.05
The data are shown as mean ± standard error.
Table 3. Pearson correlations between nutrient resorption efficiency, nutrient concentrations, and stoichiometry ratios in leaf and soil samples.
NREPRE
RpRp
SoilC−0.3030.273−0.879<0.001
N−0.1510.592−0.773<0.001
P−0.1160.681-0.2580.353
C:N−0.4890.064−0.881<0.001
C:P−0.2890.296−0.878<0.001
N:P−0.1090.700−0.756<0.001
Green leavesC0.711<0.0010.1270.651
N0.4320.108−0.1880.503
P0.5250.0440.947<0.001
C:N−0.0410.8840.4890.064
C:P0.0850.763−0.666<0.001
N:P0.0580.836−0.645<0.001
Senesced leavesC−0.1260.656−0.716<0.001
N−0.2920.292−0.675<0.001
P−0.5290.043−0.930<0.001
C:N0.5040.0480.2290.413
C:P0.3450.209−0.0450.873
N:P0.0290.919−0.1460.603
NRE and PRE represent the N and P resorption efficiency, respectively. R is the Pearson correlation coefficient.

