Abstract
Drought conditions may have differential impacts on growth, transpiration, and water use efficiency (WUE) in mixed species and monospecific planted forests. Understanding the resistance (i.e., the capacity to maintain processes unchanged) of different tree species to drought, and how resistance is affected by complementary interactions within species mixtures, is particularly important in the seasonally dry tropics where projected increases in the frequency and severity of drought threaten tree planting efforts and water resources. Complementary interactions between species may lead to more resistant stands if complementarity leads to greater buffering capacity during drought. We examined growth, transpiration, and WUE of mixtures and monocultures of Terminalia amazonia (J.F. Gmel.) Exell and Dalbergia retusa Hemsl. before and during a prolonged drought using intensive measurements of tree sap flow and growth. Tree sapwood area growth was highest for T. amazonia in mixtures during normal (6.78 ± 4.08 mm2 yr−1) and drought (7.12 ± 4.85 mm2 yr−1) conditions compared to the other treatments. However, stand sapwood area growth was greatest for T. amazonia monocultures, followed by mixtures, and finally, D. retusa monocultures. There was a significant decrease in stand transpiration during drought for both mixtures and T. amazonia monocultures, while Dalbergia retusa monocultures were most water use efficient at both the tree and stand level. Treatments showed different levels of resistance to drought, with D. retusa monocultures being the most resistant, with non-significant changes of growth and transpiration before and during drought. Combining species with complementary traits and avoiding combinations where one species dominates the other, may maximize complementary interactions and reduce competitive interactions, leading to greater resistance to drought conditions.
Keywords:
Agua Salud; complementarity; drought; El Niño; planted forests; productivity; transpiration 1. Introduction
High global rates of tropical deforestation are being countered by the establishment of new forested areas through tree planting [1], which provides an opportunity to restore many critical ecosystem services [2,3]. Tree planting is an increasingly popular approach for restoring degraded landscapes where natural regeneration processes may be slow or arrested [4]. Because different tree species—and their combinations—can have different impacts on hydrological and biogeochemical cycles, careful selection and combining of appropriate species is crucial in order to return land to productivity. An argument often used to promote mixed species systems is that they are more productive than monocultures [5,6]. However, fast growing tree species generally use more water than slower growing tree species [7,8], which affects water availability for downstream users if soil water recharge or stream water inputs are reduced [9,10]. Moreover, plantations with fast growing tree species that allocate to aboveground biomass over belowground biomass may be less resilient to severe drought [11].
Understanding how species interactions and planting design (i.e., mixtures vs. monocultures) impact tradeoffs of productivity, transpiration, and water use efficiency is critical to managing plantations to effectively achieve restoration goals. Throughfall manipulation experiments are becoming a common way of testing hypotheses related to tree responses during drought [12]. While these experiments are important, and can simulate soil moisture stress resulting from less rainfall, a common criticism of this approach is the inability to reproduce the forecasted changes in vapor pressure deficit (VPD) and radiation, both of which have been shown to differ from normal conditions during severe droughts [12]. Since VPD and radiation have direct effects on tree water use [13,14,15] and because dynamics of radiation and VPD change throughout a drought year, studies of tree drought responses need to take advantage of non-manipulative droughts where meteorological conditions are changing in addition to soil moisture and precipitation changes.
While model predictions are increasingly more confident of climate change-induced decreases in rainfall and soil moisture and increases in VPD and radiation throughout much of the tropics, how trees will respond to future climate conditions in terms of growth, transpiration, and water use efficiency (WUE) has become more uncertain [16]. Filling this knowledge gap is critical to improving model parameterization and forecasting of ecosystem wide responses to climate change and the resulting complex vegetation-soil-atmosphere feedbacks. In particular, a greater emphasis on whether trees will remain unchanged (i.e., resistant) during drought or whether productivity will be positively or negatively affected is crucial for predicting forest composition changes and species survival over time [17]. Resistance is often categorized into two groups, avoiders and endurers, whereby avoiders evade drought-induced hydraulic failure via stomatal closure and endurers tolerate drought by allowing midday water potential to decline as soil water potential declines, allowing them to continue using water and assimilating CO2 but risking their hydraulic system [17].
The functional diversity hypothesis, which posits that interactions among trees with complementary functional traits can increase uptake, resource use efficiency, and stand productivity [18], has been broadly supported and used to promote mixed species plantings. Following this theory, species diversity should be positively correlated with ecosystem resistance—the ability to remain unchanged when disturbed [19]. However, the resistance of mixtures to disturbance and extreme events, such as drought, is poorly understood [20]. Even though some studies show enhanced resistance in mixed planted forests [21,22], other studies have found contradictory results [23]. While Pretzsch et al. [20] and Lebourgeois et al. [24] demonstrated that mixtures had greater stem increment growth during drought (while monocultures remained unchanged (i.e., resistant)), it is unclear whether this trend is applicable for a variety of mixed plantings. However, greater productivity in mixtures from complementary interactions during normal years may be outweighed by competition (e.g., for water) during drought years for combinations where species are in direct competition for resources. In contrast, competition for water may be reduced in mixtures where complementary interactions lead to niche partitioning, either via spatial differences in rooting depth [25] or temporal differences in the timing of water uptake (e.g., a deciduous and evergreen species). Greater productivity in species mixtures with complementary resource use may lead to increased stand transpiration [26] and reduced water supply [9], unless the combination of species also allows for improved WUE.
Various factors may result in higher WUE in mixtures. For example, increases in WUE observed in mixtures of Eucalpytus globulus Labill. and Acacia mearnsii de Wildeman compared to their respective monocultures was attributed to physiological adjustments, as well as increases in biomass, leaf area, sapwood area, and root stratification [21]. Additionally, combining species with lateral roots and deeper roots could result in complementary water use and thus increased productivity for the same amount of precipitation in mixtures compared to monocultures, and possibly lead to increased WUE at both the tree and stand levels (also referred to as “overyielding”, sensu [27]).
Complementary relationships may become stronger during stressful conditions, like drought, based on the stress-gradient hypothesis, which predicts that as conditions become harsher, facilitation will increase and competition will decrease [28]. The stress-gradient hypothesis has since been extended to a temporal stress gradient in which species diversity is suggested to also confer greater resistance to stress caused by extreme climate events, such as drought [20]. While ample evidence supports this hypothesis in forest ecosystems [29,30], understanding of the role of diversity in enhancing the resistance of planted forests to drought is much less conclusive, often contradictory, and primarily based on observational studies using retrospective analysis of tree rings in naturally regenerated temperate forests [20,24]. Overall, previous work suggests that more productive mixtures may use more water during normal years and have a longer period of greater water use during drought years due to greater water availability via heterogeneous root systems [31], up until some threshold when water is no longer available. Beyond this threshold, trees may be more vulnerable to damage. Interactions between species (e.g., facilitation through N-fixation) could also lead to increased WUE during drought, whereby the amount of carbon gained per amount of water lost is greater in mixtures [21], if the stress-gradient hypothesis holds. It has been suggested, however, that in some cases, differences in productivity between mixtures and monocultures may be related to the selection of species rather than absolute species richness, whereby mixtures having a single dominant species would result in strong competitive interactions that outweigh complementary interactions [32], preventing overyielding in some mixtures [33]. This could hold true for other ecological processes associated with productivity, such as transpiration, underlying the importance of teasing out specific species interactions and the effect drought might have on these interactions.
We conducted a study in tree plantations established to restore degraded lands in Panama in order to explore the role of complementarity in mediating trade-offs between productivity and resource use in species mixtures. We selected two species—Terminalia amazonia and Dalbergia retusa—for their contrasting functional traits that we hypothesized would lead to complementary interactions that increase growth and transpiration in mixtures. In addition to having different rooting depths, D. retusa is dry season semi-deciduous which allows for greater water availability at the stand level during the driest part of the year. Further, D. retusa is a known nitrogen fixer that has been shown to be fixing in the study plantation [34], which may increase the availability of limiting nutrients to T. amazonia, thereby increasing WUE via increases of foliar N and, hence, photosynthetic capacity.
In addition to the plantation treatments, the occurrence of an El Niño Southern Oscillation (ENSO) event in 2015/2016 provided a unique opportunity to study the drought response of young mixed and monospecific planted forests in terms of growth, transpiration, and WUE. We hypothesized that (1) complementary interactions in mixed stands would lead to higher growth and transpiration under non-drought conditions and higher WUE if facilitative interactions of D. retusa enhances growth of T. amazonia, (2) drought would have a greater negative effect on monocultures than mixtures in terms of growth and transpiration due to reduced buffering capacity in monocultures compared to mixtures, and (3) drought would increase WUE in mixtures more than monocultures.
2. Materials and Methods
2.1. Site Descriptions
The study was conducted in the Agua Salud Project site within the Panama Canal Watershed (9°13′ N, 79°47′ W, 330 m amsl). Our work focused on the 75 hectare (ha) native species planted forest plots that were established in 2008 in two separate blocks 3 km distant from each other. Although the plantation has a total of 21 treatments [33], this study focused on 3 treatments—monocultures of Dalbergia retusa, monocultures of Terminalia amazonia, and two-species mixtures of D. retusa and T. amazonia. These treatments were selected primarily because D. retusa and T. amazonia have contrasting functional traits related to water, nutrient, and light acquisition that would enable us to test our hypotheses regarding complementary interactions (Table 1). Additionally, sap flow measurements are costly and labor intensive, which constrained our study design and required us to prioritize the three treatments that would best enable us to test our hypotheses and make broader generalizations related to growth, water use, and WUE of monocultures and mixed plantings. Prior to establishment, the land was cleared of forest in the 1970s with the predominant land use being cattle grazing [35]. The topography is characterized by short and steep slopes [36] and the soils are silt clay to clay with pH values of 4.67 ± 0.27 (in CaCl2) and 5.8 ± 0.23 (in H2O) [37]. Mean daily maximum and minimum temperatures are 32 and 23 °C, respectively (http://striweb.si.edu/esp/physical_monitoring/descrip_bci.htm).

Table 1.
Functional traits of Terminalia amazonia and Dalbergia retusa related to growth, transpiration, and water use efficiency.
Plots of monocultures of D. retusa (n = 12), monocultures of T. amazonia (n = 11), and mixtures of both species (n = 13) were randomly distributed across two blocks. Within each plot, trees were planted in 42 × 36.5 m plots of 15 × 15 individuals. Measurements were taken in the core plot comprised of 9 × 9 trees (27 × 23.4 m). Mixtures were established in a spatially explicit design that isolated interactions between individual trees of different species, whereby trees of D. retusa were completely surrounded by trees of T. amazonia in a hexagon configuration and vice versa (Figure 1). Trees planted within the same row have 3 m spacing, while trees between rows have 2.6 m spacing. This novel planting design enabled us to test interactions between two species (for more details, see [33]). Since tree establishment in 2008, four yearly understory cleanings occurred from May through August to prevent additional competition with the planted trees. At the beginning of the present study, the trees were 6 years old.
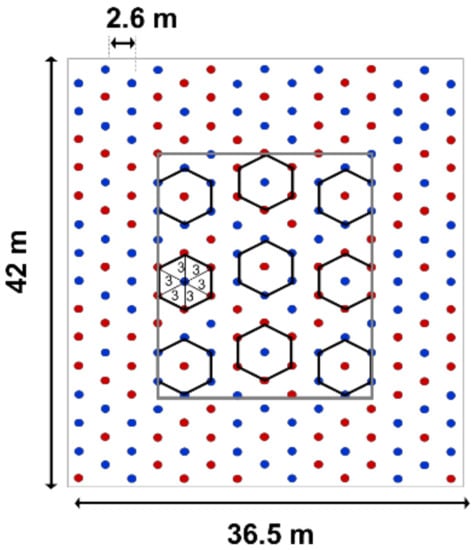
Figure 1.
Spatial planting pattern of the two target species combinations, including trees of both species with heterospecific neighbors, indicated by the points within solid lines. Monoculture plots with each species not shown. Each plot consists of 15 × 15 trees (42 × 36.5 m), and includes a buffer zone of three rows around a core plot of 9 × 9 trees (27 × 23.4 m; central rectangle).
2.2. Sampling Design
The sampling was designed to estimate water use and growth and physiological responses of monocultures and mixtures of D. retusa and T. amazonia. Between June and August of 2014, 2015, and 2016, the diameter at breast height (DBH, cm, measured 1.3 m above ground) of all trees (n = 2916) within the core of the study plots were measured (hereafter referred to as planted trees).
In February 2014, we established subplots within a subset of the monocultures and mixtures to measure sap flow in selected trees (hereafter referred to as sap flow trees) (Table 2). We selected seven subplots for the study, two within monocultures of D. retusa, two within monocultures of T. amazonia, and three within mixtures distributed across the two study blocks, that best represented the mean DBH across all plots. In June 2014, we added a fourth subplot in the mixtures. Within monoculture and mixture plots, we selected 8 trees per plot for sap flow measurements based on the following criterion: (1) The trees had to be of DBH similar to plot mean DBH; (2) The trees had to be interacting aboveground, without one tree overtopping a neighboring tree; (3) For each plot, all eight trees had to be within a 10-m radius of each other so the sap flow cables could connect to them. Within the mixtures, we added a fourth criteria: (4) Trees had to be either one of the center or surrounding trees. For example, each mixture had sap flow sensors installed in one center T. amazonia and 3 of the 6 surrounding D. retusa in that hexagon group, and vice versa. We visited each site at least twice a week to download data, check sensors, and replace broken sensors. We changed the battery of each station at least once a week. A total of 64 sap flow trees were measured; however, 40 trees were used for analyses due to sensor errors and biotic factors, including mortality due to canopy wind damage (1 tree) or sensor malfunction due to ant attacks (4 trees) or thermocouple erosion from humidity (9 trees). If these sensor errors resulted in 20% of the data missing during the two-year sampling period, we excluded the tree from the analyses.
Table 2.
Sapwood area growth (mm2 day−1), transpiration (ET; L day−1), and water use efficiency (WUE; mm2 L−1) for Terminalia amazonia and Dalbergia retusa planted in monocultures and mixtures during a “Normal” year and “Drought” year. Letters represent significant differences by treatment (T. amazonia monocultures, T. amazonia mixtures, D. retusa monocultures, and D. retusa mixtures) and asterisks represent significant differences between water years (p < 0.05). Numbers in parenthesis are the standard deviations of the means.
We analyzed data from 15 May 2014 through 15 May 2016. Tree-level biomass and water use estimates were based on data obtained from individual sap flow trees. Stand-level measurements were scaled using plot inventories [33]. The relationship between DBH and sapwood area for each treatment was analyzed following Hernandez-Santana et al. [40]. Briefly, we measured the DBH of 40 trees across the plantation (20 D. retusa and 20 T. amazonia) and took a core from each measured tree to calculate the amount of sapwood area and heartwood. Selected trees for coring represented the range of DBH across the plantation for both species and included trees larger and smaller than the range found in the plantation. Selected cores were taken from the sites in which we had sap flow sensors installed, but not from trees with sensors actively measuring sap flow. We did not find heartwood for the range of DBH sampled and thus could directly relate DBH to sapwood area. We assigned water use values to each tree in the full inventory based on DBH using treatment derived equations for each species and treatment:
where y is tree transpiration (E) and x is DBH. These equations predict the daily water use in liters for individual trees by species and treatment.
D. retusa monocultures: y = 0.06277x − 0.1571 (R2 = 0.58, p = 0.009)
D. retusa mixtures, y = 0.12571x − 0.44432 (R2= 0.54, p = 0.02)
T. amazonia monocultures: y = 0.15489x − 1.01002 (R2= 0.58, p = 0.001)
T. amazonia mixtures: y = 0.11819x − 0.51214 (R2= 0.50, p = 0.009)
2.3. Micrometeorogical and Soil Moisture Data
Two distinct meteorological (MET) stations located within the Agua Salud Project study area collected local climate data for the 2014–2016 study period. From May 2014 through January 2015, MET data were collected from a tower managed by the Autoridad del Canal de Panamá (Meteorology and Hydrology Branch, Panama Canal Authority, Republic of Panama), while data after February 2015 were collected from a tower managed by the Smithsonian Tropical Research Institute. Climate data from the towers included air temperature (°C) and relative humidity (RH, %) using an HMP60 (Vaisala, Vantaa, Finland), and precipitation (mm) using a 260-250-A tipping bucket (NovaLynx, CA, USA). Vapor pressure deficit (VPD, kPA) was calculated from the air temperature and RH data (see [41]). Small gaps in the dataset exist due to either sensor malfunction (<1 week) or during the renovation of the tower and update of the sensors (~1 month).
The start and end dates of the wet and dry seasons can be found in Table S1 based on Panama Canal Authority indicator variables (Meteorology and Hydrology Branch, Panama Canal Authority, Republic of Panama). Generally, about 80% of the average annual precipitation falls between May and mid-December. An El Niño-Southern Oscillation (ENSO) event, which resulted in the third longest dry season on record (100 years) in Panama started toward the end of this study’s sampling period in June 2015 [42] and resulted in about 55% of the precipitation of a normal year.
For the purpose of this study, we divided the sampling period into two years. A normal year (i.e., normal precipitation year) was determined to include dates between 15 May 2014 through 15 May 2015 while a drought year (i.e., during the ENSO event) was determined to include dates between May 16, 2015 and 15 May 2016. For the remainder of the paper, we will refer to years as “water years” that include a “Normal” and “Drought” years.
2.4. Basal Area Growth and Biomass Measurements
Individual tree sapwood area (equivalent to basal area in our study) growth was calculated by subtracting the individual tree sapwood area (SA) in 2014 from the SA in 2015 for the normal year and subtracting SA in 2015 from the SA in 2016 for the drought year. We scaled sapwood area growth to stand growth for all treatment plots. Individual tree aboveground biomass (AGB, kg) was estimated using species-specific allometric equations based on excavation data from a nearby site ([43]; also see [44]) for the entire plantation (including sap flow trees). We estimated AGB for D. retusa using the equation:
We estimated AGB of T. amazonia using the equation:
Stand-level estimates of AGB were calculated for each plot and then converted to kg m−2. Aboveground stand and tree biomass growth was calculated as the difference in AGB between the 2015 and 2014 inventories (for the normal year) and the difference between 2016 and 2015 (for the drought year). These metrics were compared to sapwood area growth at the tree level (Figure S1). For the remainder of the paper, we emphasize sapwood area growth for tree and stand levels since it integrates the water use of the entire tree. Since the AGB equations are based on monocultures, the accuracy of applying these equations to trees beginning to interact aboveground (after year 7) may have introduced error.
2.5. Tree and Stand Transpiration and Water Use Efficiency
To calculate tree and stand transpiration, sap flow was measured using the heat ratio method (HRM) in 64 trees [45]. On each sap flow tree, one sensor was installed 1.30 m above the base of the tree facing north. Each sensor contained three probes—a heater probe and two temperature probes, installed equidistantly upstream and downstream from the heater probe (0.6 cm). Each temperature probe contained three thermocouples located at 0.5, 1.7, and 3.0 cm from the bark of the tree. A heat pulse was automatically sent to the heater probe every 15 min. The speed of the heat (Vh) was calculated every 15 min according to [45]:
where k is the thermal diffusivity of green (fresh) wood, x is the distance in centimeters between the heater and either temperature probe, and v1 and v2 are increases in temperature from initial temperature at equidistant points downstream (v1) and upstream (v2). Heat pulse velocities were corrected (Vc) for errors (probe misalignment and wounding) following Burgess et al. [45]:
where b, c, and d are coefficients found in Table 1 of Burgess et al. [45]. Estimates of each tree’s daily sap flux density (Js) were obtained from Vc [46] based on the period from 15 June 2014 through 15 June 2016:
where d is the density of sapwood, s is the density of water, MC is the volumetric water content of the sapwood, Cdw is the thermal conductivity of dry wood, and Cs is the thermal conductivity of water (based on Burgess et al. [45]. Density for D. retusa was determined to be 890 kg m3 and 660 kg m3 for T. amazonia [33].
To calculate sap flow we first calculated the cross-sectional sapwood area (determined using cores, described above) and divided that area into three concentric annuli delimited by the midpoint between the three measurement depths of the sensors. The sap flow corresponding to each annulus was estimated by multiplying the area of the annulus by Js at each thermocouple depth. The transpiration of a tree (E) was estimated by adding the values from the three concentric annuli.
We modeled a linear relationship between DBH and transpiration (E) (Equations (1)–(4)) for each treatment and used these equations to estimate tree E of planted trees for which we did not have sensors installed. For all trees across all study plots, we summed the E for each tree in a plot and multiplied this value by the stand sapwood area divided by stand ground area of the plot to calculate stand transpiration (E; mm day−1).
Tree water use efficiency (WUE; mm2 L−1) was calculated as mean daily SA growth (mm2 day−1) of the tree over one year of growth divided by the mean daily water use of the tree (L day−1). Stand WUE (WUE; m2 mm−1) was estimated by dividing the annual stand SA growth for each plot by the stand transpiration for each plot.
2.6. Statistical Analyses
Tree- and stand measurements that did not meet normality tests were log transformed for analyses and back-transformed for all figures. An ANOVA and post-hoc Tukey test was used to assess differences for tree SA growth, stand SA growth, E (tree and stand), and WUE (tree and stand) among treatments and between water years. In the data that follow, small differences at the tree-level led to greater differences at the stand-level. Part of the reason may be because our sample sizes at the tree-level were small and so differences were often non-significant, while stand-level results considered the entire plot and plantation area (which has microsite variability and slope differences that affect growth (see [37])).
Models were developed in R to compare DBH to SA growth or E. Linear and polynomial models with and without treatment and species as factors were compared and an ANOVA was used to compare models and select the best fit [47]. The same model selection process was used to compare stand SA growth to either stand E or WUE. Size effects and confidence intervals were calculated for tree WUE (see [48]).
3. Results
3.1. Normal Year and Drought Year Meteorological Changes
The most significant changes from the normal year to the drought year was a 55% decrease in precipitation during the drought year (early 2015 through May 2016) (Figure S2e). Additionally, significant increases in radiation (40%) and vapor pressure deficit (VPD; 20%) occurred during the drought year (Figure S2a,b). The 2015-2016 El Niño drought marked one of the top three driest periods on record (100 years) in the Panama Canal Watershed [42].
3.2. Growth/Productivity
Mean sapwood area (SA) growth varied by treatment, with T. amazonia in mixtures having significantly greater SA growth than the other three treatments during both normal and drought years (Table 2, Figure 2). While T. amazonia trees planted in mixtures and D. retusa trees planted in monocultures trended toward greater SA growth during drought compared to a normal year, this trend was not significant. In comparison, T. amazonia in monocultures and D. retusa in mixtures tended to decrease SA growth during drought, but the only significant difference was the decline in SA growth for D. retusa in mixtures during drought (0.19 mm2 day−1) compared to a normal year (1.09 mm2 day−1) (Table 2).
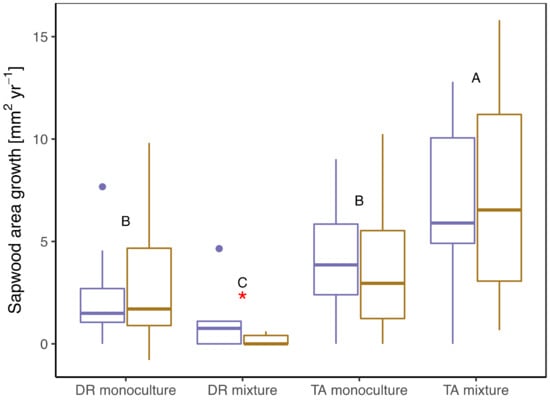
Figure 2.
Tree sapwood area growth during normal (purple boxes) and drought (gold boxes) years by treatment. DR monocultures: Dalbergia retusa in monocultures; DR mixture: Dalbergia retusa in mixtures; TA monocultures: Terminalia amazonia in monocultures; TA mixture: Terminalia amazonia in mixtures. Upper case letters denote differences by treatment, considering both water years, and red asterisks represent differences between water years.
Sapwood area growth increased with tree diameter during both a normal year (R2 = 0.40, p < 0.001) and drought year (R2 = 0.27, p < 0.0001) (Figure S3a). Comparing AIC values for linear and polynomial models relating diameter at breast height (DBH) to basal area growth showed that the best fit model was a polynomial model that included treatment as a factor during the normal year (R2 = 0.40, p < 0.0001) (Figure 2). In comparison, the best fit model between DBH and basal area growth during the drought year was a polynomial model that did not include any additional factors (i.e., treatment or species) (R2= 0.27, p < 0.0001) (Figure S3a).
At the stand level, ANOVA results show treatment significantly influenced yearly SA growth (p < 0.001), with T. amazonia monocultures having greater SA growth than either mixtures or D. retusa monocultures (Figure 3a). During the drought year, both mixtures and T. amazonia monocultures had a significant decline in SA growth (both p < 0.001), while D. retusa monocultures showed a non-significant trend toward an increase in SA growth during drought (Figure 3a).
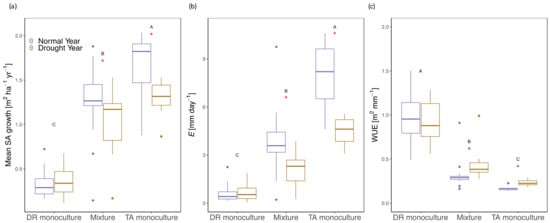
Figure 3.
(a) Stand mean sapwood area growth (m2 ha−1 yr−1), (b) transpiration (E; mm day−1), and (c) water use efficiency (WUE; m2 mm−1) by treatment during a normal (purple) and drought (gold) year. DR monocultures: Dalbergia retusa in monocultures; Mixture: mixtures of Dalbergia retusa and Terminalia amazonia; TA monocultures: Terminalia amazonia in monocultures; TA mixture: Terminalia amazonia in mixtures. Upper case letters denote differences by treatment and red asterisks represent differences between years.
3.3. Tree- and Stand- Transpiration
The relationship between diameter at breast height and tree transpiration was significant in both normal and drought years (Figure S3b). An ANOVA to compare multiple models relating DBH to tree transpiration showed that a polynomial model including treatment was the best model for both normal (R2 = 0.68, p < 0.0001) and drought (R2 = 0.75, p < 0.0001) years. For any given DBH, tree transpiration was greater during the normal year than the drought year (p < 0.0001).
Best fit models between stand SA growth and transpiration were linear with treatment as a factor based on ANOVA results for both normal and drought years (Figure S3b). Monocultures of D. retusa was the only treatment that had no significant difference in stand transpiration between years. In comparison, both mixtures and monocultures of T. amazonia had a significant decrease in stand transpiration during the drought year (both p < 0.0001). Transpiration was significantly greater in T. amazonia monocultures than either of the two treatments, regardless of year (Figure 3 and Figure 4).
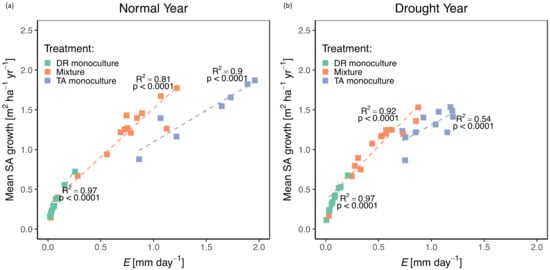
Figure 4.
Stand transpiration (E; mm day−1) and mean sapwood area (SA) growth (m2 ha−1 yr−1) by treatment during a normal year (a) and drought year (b). DR monocultures: Dalbergia retusa in monocultures; Mixture: mixtures of Dalbergia retusa and Terminalia amazonia; TA monocultures: Terminalia amazonia in monocultures; TA mixture: Terminalia amazonia in mixtures.
3.4. Monthly Differences in Whole Tree Transpiration
When analyzing the data by month, hourly whole tree transpiration (L hr−1) was significantly different by treatment for all but the T. amazonia trees growing in mixtures and monocultures for six out of the total of 24 months over the study period (ns = not significant, p > 0.05) (Figure 5). Dalbergia retusa in the mixture had consistently lower transpiration than the other three treatments. Terminalia amazonia in the monocultures had higher transpiration than when planted in the mixtures for all but three months during the drought (Figure 5). The largest difference in transpiration was observed for T. amazonia trees growing in monocultures during the dry season of 2015 and at the start of the drought event in 2015.
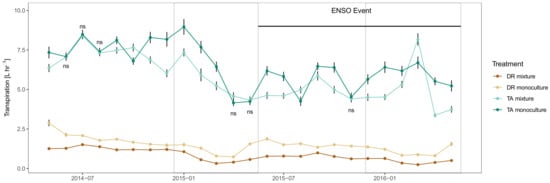
Figure 5.
Mean tree transpiration (L hr−1) by treatment over the length of the study period. DR monocultures: Dalbergia retusa in monocultures; DR mixture: Dalbergia retusa in mixtures; TA monocultures: Terminalia amazonia in monocultures; TA mixture: Terminalia amazonia in mixtures. Points represent the mean hourly daytime tree transpiration for each month starting in May 2014 and ending in May 2016. Error bars represent the standard error of the mean. Gray shaded areas represent the dry seasons determined by the Panama Canal Authority. The black horizontal line represent the ENSO event. Treatments where transpiration was not significant by month are represented with an ns (this only occurred for TA monoculture and TA mixture six times).
3.5. Water-Use Efficiency
Response of tree water-use efficiency (WUE) before and during the drought varied by treatment. Terminalia amazonia in the mixtures was the only treatment to significantly increase WUE during the drought. Both D. retusa in mixtures and T. amazonia in monocultures showed a non-significant increase in WUE, while D. retusa in monocultures showed a non-significant decrease in WUE (Table 2). We used guidelines developed for analyzing effect size proposed by Hutchison et al., (2018), whereby effect size strength is defined in terms of small (0.10), intermediate (0.30), and large (0.50). Based on effect size analysis, changes in WUE were large in the positive direction for monocultures of D. retusa and mixtures of T. amazonia, intermediate in the positive direction for T. amazonia in monocultures, and large in the negative direction for D. retusa in mixtures (Figure 6). A positive direction suggests that the effect of the drought increased WUE, while negative direction suggest the effect of the drought decreased WUE.
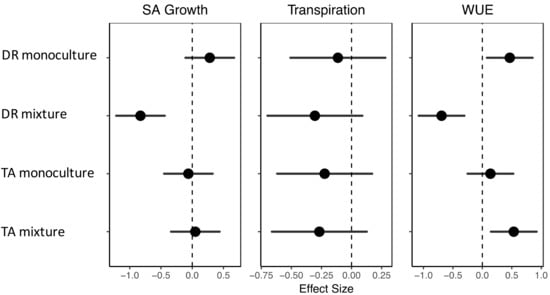
Figure 6.
Effect size of drought compared to a normal year with confidence intervals of sapwood area growth (SA Growth), transpiration, and water use efficiency (WUE) by treatment. DR monocultures: Dalbergia retusa in monocultures; DR mixture: Dalbergia retusa in mixtures; TA monocultures: Terminalia amazonia in monocultures; TA mixture: Terminalia amazonia in mixtures. Confidence intervals (CIs) that do not overlap with zero value (vertical dashed line) denote strong and large effects. Points and CIs to the right of the dashed line represent treatments where sapwood area growth, transpiration, or WUE increased during drought and points to the left of the dashed line represent treatments where the three metrics decreased during drought.
Stand WUE was related to stand sapwood area (SA) growth, with more productive stands generally being less WUE for both D. retusa monocultures and mixtures during both a normal year and drought year (Figure 3c and Figure 7). Monocultures of T. amazonia had significantly lower WUE than either the two treatments during both years (p < 0.0001) (Figure 3 and Figure 7). Declines in WUE for D. retusa monocultures and mixtures were steeper for less productive stands (Figure 7). While both mixtures and T. amazonia monocultures showed a significant increase in WUE during the drought (both p < 0.001), there was no change in WUE for D. retusa monocultures between years (p = 0.47).
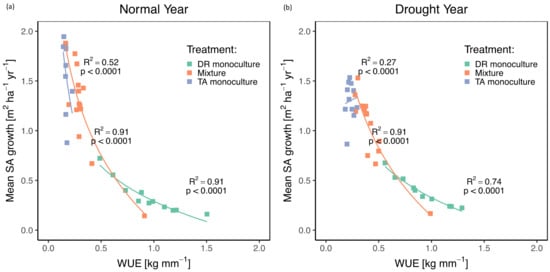
Figure 7.
Stand water use efficiency (WUE; kg mm −1) and mean SA growth (m2 ha−1 yr−1) by treatment during a normal year (a) and drought year (b). DR monocultures: Dalbergia retusa in monocultures; Mixture: mixtures of Dalbergia retusa and Terminalia amazonia; TA monocultures: Terminalia amazonia in monocultures; TA mixture: Terminalia amazonia in mixtures.
4. Discussion
4.1. Role of Complementary Interactions in Mixtures During a “Normal” Year
Theory suggests that mixed planted forests may lead to enhanced stand-level resource use efficiency [49,50]. Our work suggests that this theory may not hold for combinations in which one species successfully outcompetes another species for light, nutrients, or water. The significantly greater DBH and sapwood area growth of T. amazonia observed in our study, regardless of treatment, underpins this point. Similar observations from other studies have been commonly referred to as the “selection effect” [26,51], and attributed to the dominance of a single species within a mixtures that negatively impacts the performance of one or more other species. This effect was particularly obvious in our mixed species plantings, where the growth of D. retusa was inhibited by T. amazonia (Figure 2 and Table 2), while T. amazonia benefitted from additional growth in mixtures, apparently at the expense of D. retusa.
Interestingly, in this study, the basal diameter and height of D. retusa were significantly greater than T. amazonia after two years of growth (which may be due to greater initial allocation of carbon to belowground growth by T. amazonia), but any complementary interactions that may have existed at age 2 quickly diminished when T. amazonia rapidly won the race for light and space by age 8 [33]. This highlights the importance of multiple year studies into growth dynamics of tree plantings. In some cases, a fast-growing species and slow-growing species grown together show complementarity as long as the difference in growth rate is not too extreme [52,53]. Both of our study species are light-demanding [54], and while D. retusa can tolerate low light, our research suggests it does better in higher light conditions. In fact, D. retusa grew better when planted in mixtures with other species, such as Pachira quinata (Jacq.) W.S. Alverson, which is deciduous for most of the dry season and, thus, both P. quinata and D. retusa growth occurs during the same part of the year, preventing a competitive advantage that an evergreen may have over a deciduous tree [33,54]. This suggest that when selecting species to maximize the growth benefits from the interaction of two species, it is important to select species with either similar growth rates throughout the rotation, or whereby one species grows favorably in a sub canopy position [25]. For example, a study in Australia of Acacia mearnsii and Eucalyptus globlus species showed complementary interactions related to aboveground biomass growth and both species had similar heights and diameters after 9.5 years of growth [53] and resulted in greater stand productivity in the two-species mixtures. Similar growth rates of these species enhanced opportunities for complementary and reduced opportunities for competition.
The greater growth of T. amazonia in the mixtures did not fully compensate for the slower growth of D. retusa in the mixtures, such that T. amazonia-D. retusa mixtures did not result in greater annual SA growth (i.e., overyielding) than T. amazonia monocultures. While mixtures had higher growth rates than D. retusa monocultures, this is likely a result of mixtures containing a highly competitive dominant species, which increases annual stand-level growth. However, the greater growth of T. amazonia in the mixtures resulted in the mixtures having SA growth that was between T. amazonia monocultures and D. retusa monocultures, suggesting that the greater growth of T. amazonia in mixtures only partially offset the slower growth of D. retusa in mixtures.
Given that tree diameter is closely related to tree transpiration [55], especially where DBH correlates closely with sapwood area, the positive association between higher growth, tree size, and transpiration of T. amazonia compared to D. retusa (regardless of treatment) observed in our study was expected. Even though T. amazonia in monocultures had significantly lower SA growth than T. amazonia in mixtures, they transpired the same amount as T. amazonia in mixtures, indicating that the mixed species interactions changed water use patterns for T. amazonia. Although not directly tested here, one possible explanation could be related to a facilitation effect from N-fixation by D. retusa, which has been shown to fix at a rate of 33.5 μmol N2 m−2 ha−1 in our study area [34], and which could have potentially increased the ability of T. amazonia in mixtures to assimilate more CO2 without losing as much water through its leaves. Specifically, increased foliar N and rubisco concentration, and hence, photosynthetic capacity could have allowed for greater efficiency of carbon and water transfer through its leaves. An alternative explanation could be that T. amazonia is investing its carbon differently in monocultures and mixtures. Although not directly tested here, T. amazonia in monocultures may have been investing fewer resources to basal area growth and more resources in greater leaf area or roots, both of which would not necessarily results in greater SA growth, but may impact transpiration. Site conditions, neighboring species, and environmental factors can all affect carbon allocation in trees over time [56].
Despite the greater growth of T. amazonia in both monocultures and mixtures than D. retusa, T. amazonia trees were also less water use efficient, which in part could be due to the extremely low transpiration rates of D. retusa during the dry season while T. amazonia maintains high transpiration until mid-way through the dry season and never approaches zero (Figure 5). The effect of treatment was even more pronounced at the stand-level, where D. retusa monocultures were more water use efficient than either of the two treatments. Using stable isotope techniques, Craven et al., [39] demonstrated that both D. retusa and T. amazonia have high intrinsic WUE, but cautioned that T. amazonia performed better in environments with less seasonality (i.e., dry versus wet), indicating that T. amazonia might be limited to certain geographical ranges. Dalbergia retusa, in contrast, seemed to be highly adaptable to seasonality in that study. Our study site is characterized by strong seasonality, with a 4-month dry season, but T. amazonia is still the most productive species in the Agua Salud planted forest. This can be partly explained by the age of the trees, which in this study were between 6 and 8 years old, while the Craven et al., [39] study was focused on 2-year old planted trees, which were not yet interacting aboveground.
It is notable that during a ‘normal’ precipitation year, there was a clear species distinction between whole tree transpiration and WUE, with T. amazonia trees having greater transpiration and D. retusa trees having greater WUE. Additionally, stands with comparable annual SA growth showed significant differences in transpiration based on treatment. Even for sites with the same SA growth, T. amazonia monocultures transpired nearly double that of both the mixtures and D. retusa monocultures. These findings are particularly important, since they highlight how planting design can influence trade-offs between productivity and water use, with mixed species stands achieving comparable productivity to single species stands while using only half of the amount of water.
4.2. Effects of Drought on Growth, Transpiration, and WUE
Understanding patterns of tree and stand level productivity and water use under “average” or “normal” years is essential, but it is also important to understand these behaviors during extreme events like prolonged droughts, as these events are predicted to become more frequent in the future [57,58]. Our findings suggest that growth, transpiration, and WUE of individual trees and stands respond differently to drought depending on whether they are planted as monocultures or mixtures.
Although not significant, both T. amazonia in mixtures and D. retusa in monocultures had slight increases in SA growth during the drought, suggesting that they may have benefited from the drought conditions. Although seemingly counterintuitive, higher than average radiation and vapor pressure deficit, which occurred at our study site during the drought (Figure S1), can enhance growth as long as soil moisture does not become limiting [59]. Of the treatments in the present study that showed declines in SA growth during the drought, D. retusa in the mixtures had a significant decline, which suggests that T. amazonia negatively affected D. retusa in mixtures. In the tropics, small trees have shown increased growth rates in response to drought, largely driven by increased solar radiation reaching the subcanopy layers due to drought-induced leaf drop and reduced canopy cover of taller trees during drought [11]. We did not see similar increased growth rates for D. retusa in mixtures, suggesting that other mechanisms were more important. For example, as water supply decreases, it has been show that trees preferentially allocate carbon to below-ground structures at the expense of above-ground biomass [56].
Small differences in growth observed at the tree level were again magnified at the stand level. In terms of SA growth, both mixtures and T. amazonia monocultures were negatively affected by the drought, with declines in SA growth of <0.5 m2 ha−1 year−1 (mixtures) and over 1 m2 ha−1 year−1 (T. amazonia monocultures). These results, taken with the tree-level results, provide evidence that T. amazonia-D. retusa mixtures are more resistant to drought than T. amazonia monocultures, where declines in SA were significantly greater in that monoculture than the mixtures. While we are unable to identify the underlying mechanisms contributing to complementarity between the species in our study, T. amazonia clearly benefited by being planted with D. retusa during normal and drought years. which can be partially explained by three scenarios. The first is that the increased growth by T. amazonia in the mixtures during drought could be facilitative (i.e., complementarity) if N-fixation from D. retusa is directly benefitting T. amazonia, which might suggest evidence of the stress-gradient hypothesis. The second is that the interaction in the mixtures is, in fact, competitive, where T. amazonia had better uptake of some or all resources, negatively impacting D. retusa. Finally, there might be a combination of facilitative and competitive interactions.
Terminalia amazonia in mixtures decreased transpiration, 6.29 (±3.66) to 4.61 (±3.56) L day−1 during drought compared to pre-drought transpiration despite increases in SA growth, which contributed to nearly a 50% increase in WUE. Stand transpiration during the drought was greater in T. amazonia monocultures than even the mixtures during a ‘normal’ year (Figure 4), which could have implications for water supply, especially if planted on large scales in areas where water availability is an important concern to downstream populations. In terms of stand transpiration, D. retusa monocultures showed little change in transpiration between the years, while T. amazonia monocultures showed the most change, with a nearly 60% decrease in transpiration during the drought. This may have been a case where T. amazonia monocultures exploited water resources faster than the T. amazonia in mixtures, and thus, reduced transpiration early during the drought to compensate for lower water availability.
For D. retusa, the transpiration throughout the year had very moderate changes, but generally decreased during the dry season, when D. retusa is partly deciduous. While we would have expected to see a decline in D. retusa’s transpiration during the drought, which included a drier than normal wet, this did not occur, suggesting that D. retusa in monocultures was decoupled from the great soil moisture declines during drought, as reflected by similar transpiration patterns over time. The little change we saw with D. retusa suggest that it is a particularly drought resistant tree (more so when planted in monocultures).
Despite differences in growth and transpiration, tree WUE for T. amazonia in monocultures and mixtures was greater during the drought, meaning that they use less water per biomass during drought conditions, lending support for the stress-gradient hypothesis. We found that the effect size of WUE for D. retusa in monocultures and T. amazonia in mixtures was greater than the other treatments, and that D. retusa in mixtures behaved differently, with the effect size being negative (Figure 7). This further emphasizes that D. retusa in mixtures are negatively impacted by T. amazonia in the mixtures. However, given that T. amazonia appears to use opportunistic growth and water strategies, if more severe droughts are presented in the future, it would greatly benefit from being planted with D. retusa, which not only decreases water use during the dry season, but is a weaker competitor for light and water.
It is important to note that the large variability of our tree transpiration data, including a wide range of soil and moisture conditions and subsequent differences in tree growth rates, translated into observed differences in stand growth, transpiration, and WUE, due to spatial variability within mixtures that affect how light, water, and nutrients are available [26]. While our site is notable as being remarkably homogeneous in terms of fertility, but at the low end of the phosphorus gradient in Panama [60], microsite fertility affected the growth of both species studied herein [37]. The same authors found T. amazonia growth to be extremely sensitive to microsite slope at three years with some level of sensitivity persisting through the seven years of their study. In contrast, D. retusa growth was found to be remarkable insensitive to slope [37]. Thus, microsite variability within plots may have contributed to the variability we found in our results, at least for T. amazonia, with tree differences then reflected in stand-level responses (the mean response across a site).
5. Conclusions
Our work shows that mixed species plantings do not necessarily overyield (i.e., have higher growth), or have higher transpiration and WUE when compared to their respective monocultures, suggesting that selecting species based on information about their complementary functional traits alone is not sufficient to ensure overyielding. Findings from other studies suggests that combining species with similar growth rates may enhance the probability of complementary interactions leading to overyielding early in stand development, but that these interactions can be diminished if one species growth begins to limit the height of the second species [61]. We also demonstrated the effect that a dominant species can have on a less strongly competitive species 6-8 years following plantation establishment, with negative effects on growth, both during normal and drought years. From a stand perspective, our results provide valuable information for designing reforestation efforts that seek to achieve multiple goals besides only productivity, such as the sustainable provisioning of water resources. Not only did both mixtures and D. retusa monocultures transpire less water during a normal year than mixtures, but this trend continued during the severe El Niño drought, when water typically becomes most crucial for users. Even though T. amazonia monocultures were the most productive during a normal year, the decrease during the drought year was greater than the decrease in growth in the mixtures, suggesting that mixtures might be less affected by drought than the monocultures of T. amazonia. We did not find that mixing led to greater resistance, but rather than D. retusa behaved as a resistant species. Dalbergia retusa should also be mentioned as a valuable reforestation species, both economically, but also in terms of water availability. In this study, it transpired the least amount of water, about a third of mixtures and a fifth of what T. amazonia monocultures transpired, and it is the most resistant species in this study. However, more long-term monitoring is needed to fully assess the effects of the drought on individual tree and stand level response and on the recovery from the drought stress. For example, legacy effects may have resulted in further post-drought growth declines or, alternatively, trees may have had sufficient non-structural carbohydrates to maintain high resilience and allow for rapid post-drought recovery. Our study highlights the importance of testing species combinations in normal conditions and drought conditions over extended timeframes before planting mixed systems if the goal is to increase growth through complementarity.
Supplementary Materials
The following are available online at http://www.mdpi.com/1999-4907/10/2/153/s1, Table S1: Start and end dates for the dry season and the length (in days) of the dry and wet seasons for 2014, 2015, 2016), Figure S1: Relationship between aboveground biomass growth and sapwood area growth for all study trees, Figure S2: Weekly averages of vapor pressure deficit, radiation, temperature, volumetric water content, and weekly sum of precipitation during, Figure S3: Tree-level diameter at breast height versus sapwood area growth and diameter at breast height by transpiration by treatment for drought and normal years.
Author Contributions
Data curation, K.S. and J.S.H.; Formal analysis, K.S. and V.H.-S.; Funding acquisition, J.S.H.; Supervision, J.S.H. and H.A.; Writing—original draft, K.S., J.S.H., V.H.-S. and H.A.; Writing—review & editing, K.S., J.S.H., VV.H.-S. and H.A.
Funding
The first author was supported by grants and fellowships from the Smart Reforestation program of the Smithsonian Tropical Research Institute, Stanley Motta, the Silicon Valley Foundation, the Heising-Simons Foundation, and the University of New Hampshire.
Acknowledgments
This work is a contribution of the Agua Salud Project and the Smart Reforestation® program of the Smithsonian Tropical Research Institute (STRI). Agua Salud is part of ForestGEO and is a collaboration with the Panama Canal Authority (ACP), the Ministry of the Environment (MiAmbiente) of Panama, and other partners. The plantation is also part of the TreeDIVNet network. Plantation establishment was supported by the HSBC Climate Partnership and management is supported by the ACP. Funding for this work came from Stanley Motta, the Silicon Valley Foundation, the Hoch Family, the University of New Hampshire, the Smithsonian Institution’s Competitive Grants for Science, the Smithsonian Institution’s Grand Challenge to BiodiversiTREE, the Heising-Simons Foundation, and the National Science Foundation grant (NSF grant EAR-1360391). We thank Daniela Weber, Estrella Yanguas, and Federico Davis for their work managing the plantation and providing logistical field support. We are grateful to Guillermo Fernandez, Miguel Nunez, Andrea Miller, Adrián Brox, Connor Breton, Mario Bretfeld, Victor García, Andrés Rodriquez, Laura Toro, and many other interns who helped with the field work.
Conflicts of Interest
The authors declare no conflict of interest. The funders had no role in the design of the study; in the collection, analyses, or interpretation of data; in the writing of the manuscript, or in the decision to publish the results.
References
- Food and Agriculture Organization Global Forest Products: Facts and Figures. 2016, p. 16. Available online: http://120.52.51.13/www.fao.org/3/I7034EN/i7034en.pdf (accessed on 3 May 2018).
- Chazdon, R.L. Tropical forest recovery: Legacies of human impact and natural disturbances. Perspect. Plant. Ecol. Evol. Syst. 2003, 6, 51–71. [Google Scholar] [CrossRef]
- Paquette, A.; Hector, A.; Castagneyrol, B.; Vanhellemont, M.; Koricheva, J.; Scherer-Lorenzen, M.; Verheyen, K. A million and more trees for science. Nat. Ecol. Evol. 2018, 2, 763–766. [Google Scholar] [CrossRef] [PubMed]
- Paul, C.; Griess, V.C.; Havardi-Burger, N.; Weber, M. Timber-based agrisilviculture improves financial viability of hardwood plantations: A case study from Panama. Agrofor. Syst. 2015, 89, 217–235. [Google Scholar] [CrossRef]
- Piotto, D. A meta-analysis comparing tree growth in monocultures and mixed plantations. For. Ecol. Manag. 2008, 255, 781–786. [Google Scholar] [CrossRef]
- Montagnini, F. Accumulation in above-ground biomass and soil storage of mineral nutrients in pure and mixed plantations in a humid tropical lowland. For. Ecol. Manag. 2000, 134, 257–270. [Google Scholar] [CrossRef]
- Law, B.E.; Falge, E.; Gu, L.; Baldocchi, D.D.; Bakwin, P.; Berbigier, P.; Davis, K.; Dolman, A.J.; Falk, M.; Fuentes, J.D.; et al. Environmental controls over carbon dioxide and water vap exchange of terrestrial vegetation. Agric. For. Meteorol. 2002, 113, 97–120. [Google Scholar] [CrossRef]
- Zhang, L.; Hicken, K.; Dawes, W.R.; Chiew, F.H.; Western, A.W.; Briggs, P. A rational function approach for estimating mean annual evapotranspiration. Water Resour. Res. 2004, 40, 1–14. [Google Scholar] [CrossRef]
- Bruijnzeel, L.A. Hydrological functions of tropical forests: Not seeing the soil for the trees? Argic. Ecosyst. Environ. 2004, 4, 185–228. [Google Scholar] [CrossRef]
- Jackson, R.B.; Avissar, R.; Jackson, R.B.; Jobba, E.G.; Roy, S.B.; Barrett, D.J.; Cook, C.W.; Farley, K.A.; Maitre, D.C.; Mccarl, B.A.; et al. Trading Water for Carbon with Biological Carbon Sequestration. Science 2009, 310, 1944–1947. [Google Scholar] [CrossRef]
- Bennett, A.C.; Mcdowell, N.G.; Allen, C.D.; Anderson-Teixeira, K.J. Larger trees suffer most during drought in forests worldwide. Nat. Plants 2015, 1, 1–5. [Google Scholar] [CrossRef]
- Asbjornsen, H.; Campbell, J.L.; Jennings, K.A.; Vadeboncoeur, M.A.; McIntire, C.; Templer, P.H.; Phillips, R.P.; Bauerle, T.L.; Dietze, M.C.; Frey, S.D. Guidelines and considerations for designing field experiments simulating precipitation extremes in forest ecosystems. Methods Ecol. Evol. 2018, 9, 2310–2325. [Google Scholar] [CrossRef]
- Alvarado-Barrientos, M.S.; Holwerda, F.; Asbjornsen, H.; Dawson, T.E.; Bruijnzeel, L.A. Suppression of transpiration due to cloud immersion in a seasonally dry Mexican weeping pine plantation. Agric. For. Meteorol. 2014, 186, 12–25. [Google Scholar] [CrossRef]
- Bretfeld, M.; Ewers, B.E.; Hall, J.S. Plant water use responses along secondary forest succession during the 2015-2016 El Niño drought in Panama. New Phytol. 2018, 219, 885–899. [Google Scholar] [CrossRef] [PubMed]
- Zeppel, M.J.B.; Murray, B.R.; Barton, C.; Eamus, D. Seasonal responses of xylem sap velocity to VPD and solar radiation during drought in a stand of native trees in temperate Australia. Funct. Plant. Biol. 2004, 31, 461–470. [Google Scholar] [CrossRef]
- Allen, K.; Dupuy, J.M.; Gei, M.G.; Hulshof, C.; Medvigy, D.; Pizano, C.; Salgado-Negret, B.; Smith, C.M.; Trierweiler, A.; Van Bloem, S.J.; et al. Will seasonally dry tropical forests be sensitive or resistant to future changes in rainfall regimes? Environ. Res. Lett. 2017, 12, 023001. [Google Scholar] [CrossRef]
- McDowell, N.; Pockman, W.T.; Allen, C.D.; Breshears, D.D.; Cobb, N.; Kolb, T.; Plaut, J.; Sperry, J.; West, A.; Williams, D.G.; et al. Mechanisms of plant survival and mortality during drought: Why do some plants survive while others succumb to drought? New Phytol. 2008, 178, 719–739. [Google Scholar] [CrossRef] [PubMed]
- Binkley, D.; Stape, J.; Ryan, M. Thinking about efficiency of resource use in forests. For. Ecol. Manag. 2004, 233, 195–204. [Google Scholar] [CrossRef]
- Bellard, C.; Bertelsmeier, C.; Leadley, P.; Thuiller, W.; Courchamp, F. Impacts of climate change on the future of biodiversity. Ecol. Lett. 2012, 15, 365–377. [Google Scholar] [CrossRef]
- Pretzsch, H.; Schütze, G.; Uhl, E. Resistance of European tree species to drought stress in mixed versus pure forests: Evidence of stress release by inter-specific facilitation. Plant. Biol. (Stuttg). 2013, 15, 483–495. [Google Scholar] [CrossRef]
- Forrester, D.I.; Theiveyanathan, S.; Collopy, J.J.; Marcar, N.E. Enhanced water use efficiency in a mixed Eucalyptus globulus and Acacia mearnsii plantation. For. Ecol. Manag. 2010, 259, 1761–1770. [Google Scholar] [CrossRef]
- Kunert, N.; Schwendenmann, L.; Potvin, C.; Hölscher, D. Tree diversity enhances tree transpiration in a Panamanian forest plantation. J. Appl. Ecol. 2012, 49, 135–144. [Google Scholar] [CrossRef]
- Jucker, T.; Bouriaud, O.; Avacaritei, D.; Dǎnilǎ, I.; Duduman, G.; Valladares, F.; Coomes, D.A. Competition for light and water play contrasting roles in driving diversity-productivity relationships in Iberian forests. J. Ecol. 2014, 102, 1202–1213. [Google Scholar] [CrossRef]
- Lebourgeois, F.; Gomez, N.; Pinto, P.; Mérian, P. Mixed stands reduce Abies alba tree-ring sensitivity to summer drought in the Vosges mountains, western Europe. For. Ecol. Manag. 2013, 303, 61–71. [Google Scholar] [CrossRef]
- Ewel, J.J.; Celis, G.; Schreeg, L. Steeply increasing growth differential between mixture and monocultures of tropical trees. Biotropica 2015, 47, 162–171. [Google Scholar] [CrossRef]
- Forrester, D.I. Transpiration and water-use efficiency in mixed-species forests versus monocultures: Effects of tree size, stand density and season. Tree Physiol. 2015, 35, 289–304. [Google Scholar] [CrossRef] [PubMed]
- Hooper, D.U.; Dukes, J.S. Overyielding among plant functional groups in a long-term experiment. Ecol. Lett. 2004, 7, 95–105. [Google Scholar] [CrossRef]
- He, Q.; Bertness, M.D.; Altieri, A.H. Global shifts towards positive species interactions with increasing environmental stress. Ecol. Lett. 2013, 16, 695–706. [Google Scholar] [CrossRef] [PubMed]
- Forrester, D.I. The spatial and temporal dynamics of species interactions in mixed-species forests: From pattern to process. For. Ecol. Manag. 2014, 312, 282–292. [Google Scholar] [CrossRef]
- Potter, K.M.; Woodall, C.W. Does biodiversity make a difference? Relationships between species richness, evolutionary diversity, and aboveground live tree biomass across U.S. forests. For. Ecol. Manag. 2014, 321, 117–129. [Google Scholar] [CrossRef]
- Asbjornsen, H.; Mora, G.; Helmers, M. Variation in depth of water uptake in contrasting perennial and annual ecosystems in central Iowa: Application of a multi-source mass-balance isotopic approach. Agric. Ecosyst. Environ. 2007, 121, 343–356. [Google Scholar] [CrossRef]
- Hutchison, C.; Gravel, D.; Guichard, F.; Potvin, C. Effect of diversity on growth, mortality, and loss of resilience to extreme climate events in a tropical planted forest experiment. Sci. Rep. 2018, 8, 15443. [Google Scholar] [CrossRef] [PubMed]
- Mayoral, C.; van Breugel, M.; Cerezo, A.; Hall, J.S. Survival and growth of five Neotropical timber species in monocultures and mixtures. For. Ecol. Manag. 2017, 403, 1–11. [Google Scholar] [CrossRef]
- Batterman, S.A.; Hall, J.S.; Turner, B.L.; Hedin, L.O.; LaHaela Walter, J.K.; Sheldon, P.; van Breugel, M. Phosphatase activity and nitrogen fixation reflect species differences, not nutrient trading or nutrient balance, across tropical rainforest trees. Ecol. Lett. 2018, 21, 1486–1495. [Google Scholar] [CrossRef] [PubMed]
- Weber, D.; Hall, J.S. Resumen del Proyecto Agua Salud, 2009. Typescript Report. Available online: http://www.ctfs.si.edu/aguasalud/page/documents/ (accessed on 4 January 2014).
- Hassler, S.K.; Zimmermann, B.; van Breugel, M.; Hall, J.S.; Elsenbeer, H. Recovery of saturated hydraulic conductivity under secondary succession on former pasture in the humid tropics. For. Ecol. Manag. 2011, 261, 1634–1642. [Google Scholar] [CrossRef]
- Mayoral, C.; van Breugel, M.; Turner, B.; Asner, G.; Vaughn, N.R.; Hall, J.S. Predicting the effect of microsite quality and species composition on tree growth: A new modeling approach. For. Ecol. Manag. 2018, 432, 534–545. [Google Scholar] [CrossRef]
- Cernusak, L.; Aranda, J. Large variation in whole-plant water-use efficiency among tropical tree species. New Phytol. 2007, 173, 294–305. [Google Scholar] [CrossRef] [PubMed]
- Craven, D.; Hall, J.S.; Ashton, M.S.; Berlyn, G.P. Water-use efficiency and whole-plant performance of nine tropical tree species at two sites with contrasting water availability in Panama. Trees 2013, 27, 639–653. [Google Scholar] [CrossRef]
- Hernandez-Santana, V.; Hernandez-Hernandez, A.; Vadeboncoeur, M.A.; Asbjornsen, H. Scaling from single-point sap velocity measurements to stand transpiration in a multispecies deciduous forest: Uncertainty sources, stand structure effect, and future scenarios. Can. J. For. Res. 2015, 45, 1489–1497. [Google Scholar] [CrossRef]
- Allen, R.G.; Pereira, L.S.; Raes, D.; Smith, M. Crop Evapotranspiration: Guidelines for Computing Crop Water Requirements-FAO Irrigation and Drainage Paper 56; Food and Agriculture Organization of the United Nations: Rome, Italy, 1998. [Google Scholar]
- Paton, S. Meteorological and Hydrological Summary for Barro Colorado Island. 2016. Available online: https://biogeodb.stri.si.edu/physical_monitoring/pdf/BCI%20Met&Hyd%20Report%202016.pdf (accessed on 4 June 2018).
- Sinacore, K.; Hall, J.S.; Potvin, C.; Royo, A.A.; Ducey, M.J.; Ashton, M.S. Unearthing the hidden world of roots: Root biomass and architecture differ among species within the same guild. PLoS ONE 2017, 12, e0185934. [Google Scholar] [CrossRef]
- Miller, E.; Dandois, J.P.; Detto, M.; Hall, J.S. Drones as a tool for monoculture plantation assessment in the steepland tropics. Forests 2017, 8, 168. [Google Scholar] [CrossRef]
- Burgess, S.S.O.; Adams, M.A.; Turner, N.C.; Beverly, C.R.; Ong, C.K.; Khan, A.A.H.; Bleby, T.M. An improved heat pulse method to measure low and reverse rates of sap flow in woody plants. Tree Physiol. 2001, 21, 589–598. [Google Scholar] [CrossRef] [PubMed]
- Green, S.; Clothier, B.; Jardine, B. Theory and practical application of heat pulse to measure sap flow. Agron. J. 2003, 95, 1371–1379. [Google Scholar] [CrossRef]
- R Core Team. A language and environment for statistical computing 2017. Available online: https://www.R-project.org/ (accessed on 6 January 2014).
- Botta-Dukát, Z. Cautionary note on calculating standardized effect size (SES) in randomization test. Community Ecol. 2018, 19, 77–83. [Google Scholar] [CrossRef]
- Forrester, D.I.; Bauhus, J. A Review of Processes Behind Diversity—Productivity Relationships in Forests. Curr. For. Reports 2016, 45–61. [Google Scholar] [CrossRef]
- Forrester, D.I.; Smith, R.G.B. Faster growth of Eucalyptus grandis and Eucalyptus pilularis in mixed-species stands than monocultures. For. Ecol. Manag. 2012, 286, 81–86. [Google Scholar] [CrossRef]
- Loreau, M.; Hector, A. Partitioning selection and complementarity in biodiversity experiments. Nature 2001, 412, 72–76. [Google Scholar] [CrossRef] [PubMed]
- Forrester, D.I.; Bauhus, J.; Cowie, A.L.; Vanclay, J.K. Mixed-species plantations of Eucalyptus with nitrogen-fixing trees: A review. For. Ecol. Manag. 2006, 233, 211–230. [Google Scholar] [CrossRef]
- Bauhus, J.; van Winden, A.P.; Nicotra, A.B. Aboveground interactions and productivity in mixed-species plantations of Acacia mearnsii and Eucalyptus globulus. Can. J. For. Res. 2004, 694, 686–694. [Google Scholar] [CrossRef]
- Hall, J.S.; Ashton, P.M.S. Guide To Early Growth and Survival in Plantations of 64 Tree Species Native to Panama and the Neotropics; Iyer, G., Ed.; Smithsonian Tropical Research Institute: Balboa, Panama, Republic of Panama, 2016. [Google Scholar]
- Meinzer, F.C.; Goldstein, G.; Andrade, J.L. Regulation of water flux through tropical forest canopy trees: Do universal rules apply? Tree Physiol. 2001, 21, 19–26. [Google Scholar] [CrossRef]
- Stape, J.L.; Binkley, D.; Ryan, M.G. Eucalyptus production and the supply, use and efficiency of use of water, light and nitrogen across a geographic gradient in Brazil. For. Ecol. Manag. 2004, 193, 17–31. [Google Scholar] [CrossRef]
- Allen, C.D.; Macalady, A.K.; Chenchouni, H.; Bachelet, D.; McDowell, N.; Vennetier, M.; Kitzberger, T.; Rigling, A.; Breshears, D.D.; Hogg, E.H.; et al. A global overview of drought and heat-induced tree mortality reveals emerging climate change risks for forests. For. Ecol. Manag. 2010, 259, 660–684. [Google Scholar] [CrossRef]
- Hall, J.S.; Kirn, V.; Yanguas-Fernandez, E. (Eds.) Managing watersheds for ecosystem services in the steepland neotropics. In Inter-American Development Bank Monograph; Inter-American Development Bank: Washington, DC, USA, 2015; p. 186. [Google Scholar]
- Detto, M.; Wright, S.J.; Calderón, O.; Muller-Landau, H.C. Resource acquisition and reproductive strategies of tropical forest in response to the El Niño-Southern Oscillation. Nat. Commun. 2018, 9, 1–8. [Google Scholar] [CrossRef] [PubMed]
- Turner, B.L.; Brenes-Arguedas, T.; Condit, R. Pervasive phosphorus limitation of tree species but not communities in tropical forests. Nature 2018, 555, 367–370. [Google Scholar] [CrossRef] [PubMed]
- Santos, F.M.; de Balieiro, F.C.; dos Santos Ataíde, D.H.; Diniz, A.R.; Chaer, G.M. Dynamics of aboveground biomass accumulation in monospecific and mixed-species plantations of Eucalyptus and Acacia on a Brazilian sandy soil. For. Ecol. Manag. 2016, 363, 86–97. [Google Scholar] [CrossRef]
© 2019 by the authors. Licensee MDPI, Basel, Switzerland. This article is an open access article distributed under the terms and conditions of the Creative Commons Attribution (CC BY) license (http://creativecommons.org/licenses/by/4.0/).