Abstract
Long-term ecological research (LTER) and monitoring programs accrue invaluable ecological data that inform policy and improve decisions that enable adaptation to and mitigation of environmental changes. There is great interest in identifying ecological indicators that can be monitored easily and effectively to yield reliable data about environmental changes in forested ecosystems. However, the selection, use, and validity of ecological indicators to monitor in LTER programs remain challenging tasks for ecologists and conservation biologists. Across the eastern United States of America, the foundation tree species eastern hemlock (Tsuga canadensis (L.) Carrière) is declining and dying from irruptions of a non-native insect, the hemlock woolly adelgid (Adelges tsugae Annand). We use data from the Harvard Forest LTER site’s Hemlock Removal Experiment together with information from other eastern US LTER sites to show that plethodontid salamanders can be reliable indicators of ongoing ecological changes in forested ecosystems in the eastern USA. These salamanders are abundant, they have a history of demographic stability, are both predators and prey, and can be sampled and monitored simply and cost-effectively. At the Harvard Forest LTER, red-backed salamanders (Plethodon cinereus Green) were strong indicators of intact forests dominated by eastern hemlock (Tsuga canadensis); their high site fidelity and habitat specificity yielded an indicator value (robust Dufrêne and Legendre’s “IndVal”) for this species of 0.99. Eastern red-spotted newts (Notopthalmus viridescens viridescens Rafinesque) were better indicators of nearby stands made up of young, mixed hardwood species, such as those which replace hemlock stands following adelgid infestation. At the Hubbard Brook and Coweeta LTER sites, plethodontid salamanders were associated with intact riparian habitats, which may also be dominated by eastern hemlock. We conclude that plethodontid salamanders satisfy most criteria for reliable ecological indicators of environmental changes in eastern US forests.
1. Introduction
Long-term ecological research (LTER) refers to a systematic process of repeated, field-based empirical measurements of ecological state variables collected continuously over at least 10 years. LTER can provide temporally rich data that can identify trends and changes in environmental conditions and provide metrics of success or failure with respect to interventions intended to ameliorate negative changes or accelerate positive ones [1,2,3,4]. Not everything can be monitored, however, and the selection and use of state variables to monitor (henceforth “ecological indicators”) remains a challenging task for ecologists and conservation biologists [5,6,7]. Indicator species are considered to be cost-effective and intuitively appealing objects to monitor ecosystem changes because their responses to local environmental changes (e.g., changes in individual behavior or population size) are thought to integrate over a range of varying environmental conditions in their habitat [6,8,9]. Indicator species have been drawn from many taxa, including plants [10], amphibians [11,12,13], birds [14,15], fish [16], small mammals [17], invertebrates [18,19,20], and microorganisms [21,22].
The selection of indicator species and identification of variables associated with changes in the health or abundance of the indicator species need to be related directly to the context and objectives of ongoing monitoring efforts [23]. Commonly, there is a trade-off between the accuracy or precision of the data and the cost of monitoring an indicator species [6]. Numerous reviews of indicator species have suggested that the best indicators should: (1) be easy to detect and measure as well as relatively common; (2) have population sizes with small temporal variability under undisturbed conditions; (3) have known responses to natural and anthropogenic disturbances and a range of variability of these responses; (4) strongly and immediately reflect the relationships of cause and effect in ecosystem changes; (5) be predictive of management interventions; (6) integrate as many important and relatively discernible environmental features as possible (e.g., vegetation type and climate conditions) as well as be associated with unmeasured variables; and (7) be valued by human societies (e.g., [6,7,23,24,25,26,27]).
Several studies have suggested that amphibians, particularly plethodontid salamanders, may be used as indicator species [11,28,29,30]. Amphibians react quickly to changes in the environment due to their microhabitat requirements, sensitive physiologies, and dual life histories [28]. Additionally, amphibians are easily sampled and live longer than fish or invertebrates [28]. Salamanders are especially easy to measure, numerous, and sensitive to stressors [11]. Plethodontid salamanders such as the red-backed salamander (Plethodon cinerus) are restricted by moisture, temperature, and litter requirements that make them sensitive to environmental changes such as logging, acidification, and canopy cuts [11,29]. Furthermore, plethodontids are abundant and have a stable population size, with little interannual variability [29]. Red-backed salamanders in particular are highly abundant in the northeast; in New Hampshire, their biomass exceeded that of all other vertebrate species [11]. Therefore, plethodontids such as the red-backed salamander show the characteristics of good indicator species as they represent the status of the overall community [11], react early and predictably to ecosystem change, and are simple to examine [31].
Despite the popularity and potential of indicator species, there are several reasons to think they may not be especially effective for monitoring environmental changes. First, the responses of one or only a few populations rarely reflect the complexity of environmental change at large spatial scales, and unsampled biological interactions may have more effects on population dynamics of indicator species than the environmental variables of interest [23,32,33,34]. Second, the selection criteria for indicator species are often subjective, and may be influenced by unrelated goals [7,23,32,33]. Rare species may be good indicators but are often difficult to find and monitor; probability of occupancy and detection must be accounted for but may be hard to measure [33,34,35]. Determination of the effectiveness of an indicator species also remains an active area of research [23,36]. Finally, associations between indicator species and environmental changes of interest (i.e., monitoring goals) are often vague, qualitative, or unknown [7,23,32,35]. These associations may also change with the environment, depending on (rarely measured) genetic variations within individual populations [23,32,37].
Here, we assess the potential of two amphibian species as potential indicator species for monitoring environmental changes in eastern USA forests. Throughout its range, eastern hemlock (Tsuga canadensis) is being weakened and killed by a non-native insect, the hemlock woolly adelgid (Adelges tsugae). The loss of this late successional foundation tree species is causing a cascade of environmental and biological changes in forest stands (formerly) dominated by eastern hemlock [38,39]. We focus on two species of amphibians common in such New England hemlock forests: red-backed salamanders (Plethodon cinerus; hereafter “red backs”) and eastern red-spotted newts (Notopthalmus viridescens viridescens; hereafter “red efts”). Both species are highly abundant in the region, and their abundances have been found to decline with the loss of hemlock forest, demonstrating their potential sensitivity to changes in such systems [11,40,41]. Data are drawn from an ongoing experiment at the Harvard Forest Long-Term Ecological Research Site (HFR); some additional comparisons are made with studies of salamanders in two other forested LTER sites, the Hubbard Brook Experimental Forest (HBR) and the Coweeta Experimental Forest (CWT).
2. Materials and Methods
2.1. Study Sites
The HFR is one of 28 currently active LTER sites supported by the US National Science Foundation. The 2000-ha site is located in north-central Massachusetts (42.5319 N, −72.1915 W; Figure 1). The primary research focus of the HFR is on long-term studies of forest dynamics [42]: more information can be found at http://harvardforest.fas.harvard.edu.
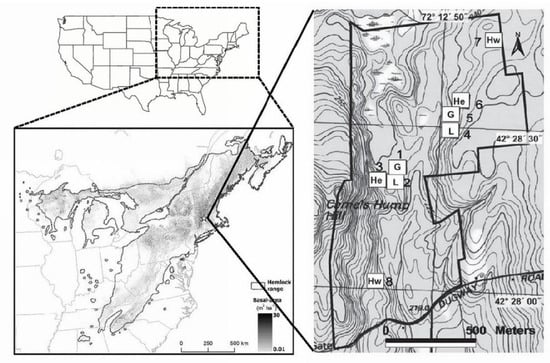
Figure 1.
Distribution (grey shading indicating basal area in m2/ha) of eastern hemlock (Tsuga canadensis) in eastern North America; location of the Harvard Forest (star in regional map at lower left); and layout of the Harvard Forest Hemlock Removal Experiment. In the right-hand panel, the treatments applied to each 0.81-ha experimental plot are abbreviated: He—unmanipulated hemlock control; Hw—unmanipulated hardwood control; G—bark and cambium of all hemlock seedlings, saplings, and trees girdled with chainsaws and knives; L—all merchantable hemlock (≥20 cm diameter at breast height (DBH)) and some merchantable hardwoods and white pines (Pinus strobus) cut and removed from the site [61].
The Hubbard Brook LTER is a 3076-ha site located in West Thornton, New Hampshire. Likens et al. provided a thorough discussion of its history and ecology [43]. The Coweeta LTER is a 2185-ha site located in Macon County, North Carolina. Additional information regarding its ecology and geology can be found in Elliott and Miniat [44] and Knoepp et al. [45].
2.2. Region-Wide Hemlock Decline and the Harvard Forest Hemlock Removal Experiment (HF-HeRE)
Eastern hemlock is a late successional foundation tree species [38] that grows in eastern North America from the state of Georgia, north into southern Canada, and west into the states of Michigan and Wisconsin (Figure 1). In many parts of its range, hemlock can account for >50% of the basal area in a given stand [46]. Hemlock stands and associated riparian habitats support unique assemblages of associated flora and fauna [30,47,48,49,50,51,52,53,54,55,56].
In the early 1950s, the hemlock woolly adelgid, native to Japan, was first detected in the eastern USA [57]. The adelgid has spread rapidly northeast and southwest from its point of introduction in Virginia, and kills >90% of hemlock seedlings, saplings, and trees in any given stand within 5–15 years of infestation [58,59,60]. As hemlock declines, mixed deciduous species (e.g., red maple (Acer rubrum) and various birch (Betula) species) replace it [39]. In addition to expected changes in the structure of hemlock-associated floral and faunal assemblages, the loss of hemlock is also leading to changes in ecosystem processes, including decomposition rates, nutrient availability, as well as carbon and nutrient cycling [39,61,62]. Finally, parallel changes in forest structure are occurring as people harvest hemlock before the adelgid infests a stand, so as to realize some economic return before the trees are rendered economically worthless by the adelgid [63].
The Harvard Forest Hemlock Removal Experiment (HF-HeRE) was established in 2003 to experimentally assess some of the long-term and large-scale ecological impacts of hemlock decline caused either by the adelgid or by human actions [64]. Data from HF-HeRE complement longer-term observations, the continual monitoring of hundreds of hemlock stands throughout the northeastern USA [58,65,66], and another experimental study of hemlock decline at the Coweeta LTER site [67].
HF-HeRE follows a replicated block design, with two blocks representing the ridge and valley sections of the forest. Four 0.8-ha plots were established in each block, each with a different canopy treatment to model stages of hemlock woolly adelgid infestation: hemlock control, girdling, logging, and hardwood control. Hemlock and hardwood controls represented relatively healthy hemlock-dominated forest and the end result of adelgid invasion in hardwood-dominated forest, respectively. Girdled plots had a narrow strip of bark cut from the circumference of all hemlock trees to simulate the slow death of trees infested by adelgid. Logged plots had commercially valuable trees removed to model preemptive salvage operations. Standard statistical analysis of HF-HeRE that accounts for its before-after-control-impact (BACI) design and low replication are discussed in [64].
Here, we describe the responses of two plethodontid salamanders to hemlock loss and associated ecological effects and discuss their potential to be used as indicator species for the wide range of changes in soil dynamics, arthropod community composition, and other variables observed and expected to occur in declining hemlock stands [64].
2.3. Sampling Plethodontid Salamanders within HF-HeRE
We monitored two species of salamanders—red backs, and red efts—within the study area of HF-HeRE between 2004 and 2014 [30,41,53]. To complement data collected in 2004 and 2005, prior to the start of HF-HeRE [30], we counted the number of red backs under artificial cover boards on weekly sampling dates during the summers (July) of 2013 and 2014. In each of the eight ≈90 m × 90 m (0.81-ha) HF-HeRE plots (Figure 1), five 1 m × 0.25 m × 0.02 m cover boards made from rough-sawn hemlock were deployed at 15-m intervals along each of two 75-m transects. The first and last cover board in each transect were placed 15 m from the plot edge to avoid edge effects. During the same period, we also counted individual red efts using visual encounter surveys along two 60 m × 1 m strip transects that covered the area between the first and fifth cover boards mentioned above. Sampling methods were approved by Harvard University’s Institutional Animal Care and Use Committee (File 13-02-144; 2 June 2014).
2.4. Data Analysis and Data Availability
Salamander counts under cover boards were converted to density (individuals/m2) by simple multiplication. Counts of salamanders under cover boards at these sites provide reasonable estimates of “true” density estimated by removal sampling [68].
We computed Dufrêne and Legendre’s indicator species value (“IndVal”), which equals the product of the species specificity (mean abundance of species in hemlock or hardwood sites compared to all sites) and fidelity (relative frequency of occurrence of the species in hemlock or hardwood sites) for red backs and red efts in the two forest types (hemlock, young mixed deciduous hardwoods) represented within HF-HeRE. Recent researchers have pointed out that the Dufrêne and Legendre’s “naïve” IndVal does not account for differences in detectability (e.g., [34,35]), so we also computed a robust IndVal that includes population size and occupancy estimates [34]. Estimates of population size for each species in each experimental treatment plot were determined using N-mixture models; occupancy estimates were determined using single-species, single-season occupancy models [41,69,70]. All analyses discussed were performed using the unmarked R software package [71]. Details about occupancy and detectability modeling procedure, covariates used, and model evaluation are available in Appendix 1 of Siddig et al. [41].
Following the data management policies of the US LTER network of sites, all raw data from this experiment are publicly available from the Harvard Forest data archive (http://harvardforest.fas.harvard.edu), datasets HF075 (2004, 2005 salamander data) and HF246 (2013, 2014 salamander data). Alternatively, these data may be accessed via permanent digital object identifiers (doi: 10.6073/pasta/47c731d5707857885b0aa13e0ded2991 and doi: 10.6073/pasta/9a1f20f06e6674aade200fcadf42f66e, respectively).
3. Results
3.1. Salamanders Are Responsive to Ecological Changes
In 2004, prior to the implementation of experimental manipulations in HF-HeRE, both red backs and red efts were more abundant in hemlock stands than in the young mixed deciduous stands that are replacing hemlock stands as the latter decline [30]. Both species showed immediate and substantial decreases in abundance and detectability, as well as moderate reduction in occupancy, following the experimental removal of hemlock (Table 1). The estimated abundance of red backs was four times higher in intact hemlock stands than in stands in which all hemlocks were killed in place by cambial girdling (two 0.81-ha plots) or logged and removed from the site (two plots). Further, the estimated abundance of red backs were twice as high in intact hemlock stands (two plots) than in young mixed deciduous stands (two plots). Similarly, the abundance and detectability of red efts was estimated to be twice as high in intact hemlock stands relative to the two types of manipulated hemlock stands, and 10% higher than in young mixed deciduous stands (Table 1).

Table 1.
Relative abundance and associated standard errors of the means of red backs and red efts (individuals/m2) within the two experimental treatments and two controls (two plots each) of the Harvard Forest Hemlock Removal Experiment before (2004, 2005) and after canopy manipulations simulating adelgid outbreak (girdling) or human responses to the adelgid (logging) (2013, 2014). Pre-treatment data from Mathewson [30].
3.2. Abundant with Seasonal and Annual Stability
Generally, salamanders are abundant in the forested ecosystems of the eastern USA and have stable populations compared to other taxa [11,40,72]. Our amphibian monitoring project at HF-HeRE found that red back populations have very stable seasonal and annual abundance consistent with previous studies (e.g., [11]) (Figure 2). This stability is a highly desirable measure for defining good indicator species, as any deviations from the norm may be considered a signal for changes in the population due to environmental disturbances rather than natural fluctuations.
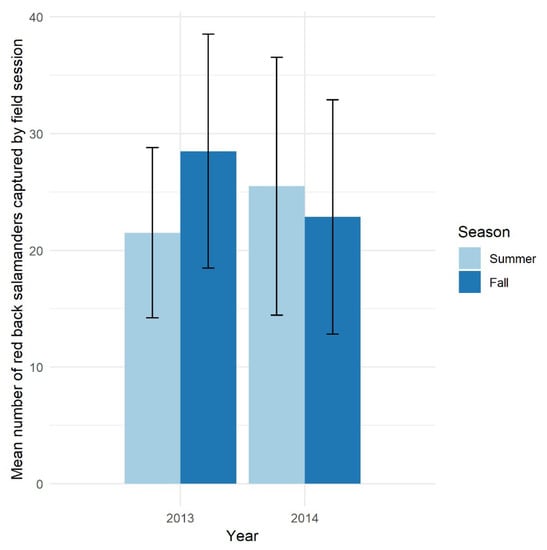
Figure 2.
Mean seasonal and annual number of red back salamanders captured by field sessions in the Simes tract, Harvard Forest in 2013 and 2014. Lines indicate one standard error of the mean.
3.3. Ease of Sampling and Potential for Cost-Effective Monitoring
Both species studied are abundant on the forest floor and under natural objects. Our knowledge of their daily and seasonal activities as well as their availability for study make them readily accessible targets for sampling with cost-effective and less destructive methods such as natural or artificial object surveys [68,73]. Siddig et al. [41] found that red back detection probabilities in hemlock and mixed deciduous stands in New England forests were 0.62 and 0.25, respectively. Likewise, the detection probability for red eft populations was 0.35 in hemlock stands and 0.22 in mixed deciduous stands. Given that estimated detection probabilities can be used to predict the ability of detecting species during sampling events, we argue that both salamander species have reasonable estimates of detectability and thus reasonable ease of sampling, which supports their selection as indicators in future monitoring schemes.
3.4. Limited Mobility and Very Local Activity
Red backs spend a large portion of their lives underground and under natural cover within a relatively small home range (i.e., 13 m2). This makes red back populations very local and thus more likely to indicate changes in their local habitats. Likewise, red efts are normally dispersed and forage in upland habitat up to 1.5 km away from vernal pools for 3–5 years before maturing and returning to ponds to lay eggs [53]. This long residency in upland habitat with local foraging activities also makes them great predictors of changes in such habitats.
3.5. Indicator Values of Red Backs and Red Efts within HF-HeRE
Robust estimates revealed that both species had very high indicator values reflecting conditions in hemlock stands but relatively low indicator values for mixed deciduous forests (Table 2). Red backs had a higher IndVal for hemlock stands whereas red efts had a higher (but still low) IndVal for mixed deciduous stands.
Table 2.
Population size, specificity, occupancy, and indicator value (IndVal) estimates for red backs (Plethodon cinereus) and red efts (Notopthalmus viridescens) in hemlock and young mixed deciduous forests in the Hemlock Removal Experiment (HF-HeRE) at the Harvard Forest long-term ecological research (LTER) site (HFR). Estimates are based on data collected in July 2014 from two 0.81-ha plots representing each forest type (HC and HD in Figure 1).
4. Discussion
4.1. The Utility of Salamanders as Indicator Species
Both salamander species that we monitored met most of the criteria for indicator species previously discussed and may be appropriate as indicator species for monitoring changes in forested ecosystems [11,41]. The rapidity of responses that we observed is supported the by findings of other research indicating that both red backs and red efts respond quickly to local environmental changes [11,74]. The substantial drop in the abundance and detectability of both species following experimental treatments within HeRE is a further indicator of their sensitivity to local habitat changes. Additionally, the large IndVal suggests that these species may be good indicators in hemlock forests, and could be used to monitor changes in ecosystem processes due to the slow decline of hemlock forests as trees are weakened by the adelgid, die, and are replaced by hardwood species.
These terrestrial salamanders are also ecologically important species in many forested ecosystems where they are abundant and centrally positioned within forest food webs (e.g., [11,40]). For example, at the Hubbard Brook Experimental Forest (HBR LTER), terrestrial salamanders were observed to account for as much biomass as small mammals, and twice the biomass of breeding birds [40]. As top-level predators of soil invertebrates that co-occur with them in the leaf litter, salamanders can affect rates of soil decomposition [72,75]; see also [76,77]. Salamanders also are prey for higher-level predators, including birds [78,79]. As plethodontid salamanders such as red backs are lungless and respire through their skin and the tissues lining their mouths, they are very sensitive to changes in air and water quality. They have small home ranges [53], long lifespans, and low temporal variability in population size [11,40,72]. Finally, they are relatively easy to sample with simple, non-destructive, and cost-effective methods such as artificial cover boards or visual encounter surveys [68,73].
4.2. Examples of Salamanders as Potential Indicators of Ecosystem Change at Other Forested US LTER Sites
Amphibians have been studied extensively at other LTER sites in the USA. In addition to the aforementioned work on the biomass of terrestrial plethodontid salamanders at the Hubbard Brook LTER [40], stream salamanders have been studied there for over 15 years (e.g., [80,81,82]). At Hubbard Brook, Lowe [82] concluded that the abundance of Gyrinophilus porphyriticus was declining as the regional climate has warmed. Grant et al. [81] showed that the occupancy of four stream salamanders in northeastern forests were negatively affected by urbanization and stream configuration. Stoddard and Hayes [83] also found that several stream salamanders and other amphibian species were strongly affected by even small changes in habitat suitability, including changes to sedimentation, stream temperature, or loss of nearby vegetation due to forest management.
At the Coweeta LTER, which is near the southern range limit of eastern hemlock, Cecala et al. [84] found that riparian disturbance restricted in-stream movements of stream salamanders. These studies attest to the value of long-term monitoring at LTER sites for increasing knowledge about salamanders as well as for providing key baseline data for use in detecting long-term trends in salamander populations in response to ongoing forest disturbances, habitat loss, urbanization, and climatic change. These data could also be used to identify species that are sensitive to habitats of interest, and so could be used as indicator species.
5. Conclusions
Terrestrial salamanders, and especially species within the Plethodontidae, have many biological features sought after in reliable indicator species [11,23,32,41,74]. At the Harvard Forest LTER, both red backs and red efts are reasonably easy to monitor and respond quickly and sensitively to environmental changes. IndVal calculations suggested that red backs would be particularly useful as indicators of changes in declining eastern hemlock stands. As hemlocks are killed by the adelgid or removed by pre-emptive salvage logging, they are being replaced with stands of mixed hardwood species. The rate and magnitude of changes in the relative abundance of red backs and red efts as hardwoods replace hemlocks should be reliable indicators of changes in the structure and composition of ground-level and soil-inhabiting food webs associated with these two forest types. Finally, all salamanders are charismatic species that are viewed positively by non-specialists (e.g., [85]). There are additional opportunities to engage citizen scientists in monitoring salamander populations [86] that could yield data of high value for documenting environmental changes in forested ecosystems.
Author Contributions
Conceptualization, A.S. and A.E.; Data curation, A.S. and A.O.; Formal analysis, A.S. and A.E.; Funding acquisition, A.S. and A.E.; Methodology, A.S. and A.E.; Validation, A.S. and A.E.; Writing—original draft, A.S. and A.E.; Writing—review and editing, A.S. and A.O.
Funding
This research was funded by the NSF, grant numbers 0620443, 1003938, and 1237491, which support the Harvard Forest LTER and REU sites. This work was also supported by a scholarship from the Islamic Development Bank to A.A.H.S.
Acknowledgments
HF-HeRE is a core experiment of the Harvard Forest LTER site, and this paper is a publication of the Harvard Forest Long-Term Ecological Research Site. We thank the Harvard Forest for their support of this project and thank the staff and students who assisted with data collection and fieldwork.
Conflicts of Interest
The authors declare no conflict of interest.
References
- Likens, G.E. Long-Term Studies in Ecology: Approaches and Alternatives; Springer: New York, NY, USA, 1989; ISBN 9781461573586. [Google Scholar]
- Morrison, M.L. Restoring Wildlife: Ecological Concepts and Practical Applications; Island Press: Washington, DC, USA, 2009. [Google Scholar]
- Gitzen, R.A.; Millspaugh, J.J.; Cooper, A.B.; Licht, D.S. Design and Analysis of Long-Term Ecological Monitoring Studies; Cambridge University Press: Cambridge, UK, 2012. [Google Scholar]
- Peters, D.P.C.; Laney, C.M.; Lugo, A.E.; Collins, S.L.; Driscoll, C.T.; Groffman, P.M.; Grove, J.M.; Knapp, A.K.; Kratz, T.K.; Ohman, M.D.; et al. Long-Term Trends in Ecological Systems: A Basis for Understanding Responses to Global Change; Technical Bulletin 1931; U.S. Department of Agriculture: Washington, DC, USA, 2013.
- Yoccoz, N.G. Ecological Monitoring. In eLS; John Wiley & Sons, Ltd.: Chichester, UK, 2012. [Google Scholar]
- Cairns, J., Jr.; Pratt, J.R. A history of biological monitoring using benthic macroinvertebrates. In Freshwater Biomonitoring and Benthic Macroinvertebrates; Rosenberg, D.M., Resh, V.H., Eds.; Chapman & Hall: London, UK, 1993; pp. 10–27. [Google Scholar]
- Siddig, A.A.H.; Ellison, A.M.; Ochs, A.; Villar-Leeman, C.; Lau, M.K. How do ecologists select and use indicator species to monitor ecological change? Insights from 14 years of publication in Ecological Indicators. Ecol. Indic. 2016, 60, 223–230. [Google Scholar] [CrossRef]
- Bartell, S.M. Biomarkers, Bioindicators, and Ecological Risk Assessment—A Brief Review and Evaluation. Environ. Bioindic. 2006, 1, 60–73. [Google Scholar] [CrossRef]
- Burger, J. Bioindicators: Types, Development, and Use in Ecological Assessment and Research. Environ. Bioindic. 2006, 1, 22–39. [Google Scholar] [CrossRef]
- Klinka, K. Indicator Plants of Coastal British Columbia; University of British Columbia Press: Vancouver, BC, Canada, 1989; ISBN 0774803215. [Google Scholar]
- Welsh, H.H.; Droege, S. A case for using plethodontid salamanders for monitoring biodiversity and ecosystem integrity of North American forests. Conserv. Biol. 2001, 15, 558–569. [Google Scholar] [CrossRef]
- Price, S.J.; Howe, R.W.; Hanowski, J.M.; Regal, R.R.; Niemi, G.J.; Smith, C.R. Are Anurans of Great Lakes Coastal Wetlands Reliable Indicators of Ecological Condition? J. Great Lakes Res. 2007, 33, 211–223. [Google Scholar] [CrossRef]
- Welsh, H.H.; Hodgson, G.R. Woodland salamanders as metrics of forest ecosystem recovery: A case study from California’s redwoods. Ecosphere 2013, 4, art59. [Google Scholar] [CrossRef]
- Furness, R.W.; Greenwood, J.J.D. Birds as Monitors of Environmental Change; Springer: Dordrecht, The Netherlands, 1993; ISBN 9789401513227. [Google Scholar]
- Greenwood, J. Birds as biomonitors: Principles and practice. Bird Census News 2004, 13, 1–10. [Google Scholar]
- Jenkins, J.A. Fish Bioindicators of Ecosystem Condition at the Calcasieu Estuary, Louisiana; USGS Open-File Report 2004–1323; Louisiana National Wetlands Research Center: Lafayette, LA, USA, 2004.
- Pearce, J.; Venier, L. Small mammals as bioindicators of sustainable boreal forest management. For. Ecol. Manag. 2005, 208, 153–175. [Google Scholar] [CrossRef]
- McGEOGH, M.A. The selection, testing and application of terrestrial insects as bioindicators. Biol. Rev. 2007, 73, 181–201. [Google Scholar] [CrossRef]
- Heino, J. Taxonomic surrogacy, numerical resolution and responses of stream macroinvertebrate communities to ecological gradients: Are the inferences transferable among regions? Ecol. Indic. 2014, 36, 186–194. [Google Scholar] [CrossRef]
- Chen, K.; Hughes, R.M.; Xu, S.; Zhang, J.; Cai, D.; Wang, B. Evaluating performance of macroinvertebrate-based adjusted and unadjusted multi-metric indices (MMI) using multi-season and multi-year samples. Ecol. Indic. 2014, 36, 142–151. [Google Scholar] [CrossRef]
- Logar, R.M.; Vodovnik, M. The Applications of Microbes in Environmental Monitoring. In Communicating Current Research Educational Topics Trends in Applied Microbiology; Mèndez-Vilas, A., Ed.; Formatex: Badajoz, Spain, 2007. [Google Scholar]
- Caruso, G. Microbes and their use as Indicators of Pollution. J. Pollut. Eff. Control 2013, 1, 1–3. [Google Scholar] [CrossRef]
- Carignan, V.; Villard, M.-A. Selecting Indicator Species to Monitor Ecological Integrity: A Review. Environ. Monit. Assess. 2002, 78, 45–61. [Google Scholar] [CrossRef]
- NOSS, R.F. Indicators for Monitoring Biodiversity: A Hierarchical Approach. Conserv. Biol. 1990, 4, 355–364. [Google Scholar] [CrossRef]
- Dale, V.H.; Beyeler, S.C. Challenges in the development and use of ecological indicators. Ecol. Indic. 2001, 1, 3–10. [Google Scholar] [CrossRef]
- U.S. EPA. Biological Assessments and Criteria: Crucial Components of Water Quality Programs; United States Environmental Protection Agency, Office of Water: Washington, DC, USA, 2004.
- Trexler, J.C.; Gottlieb, A.D.; Harwell, M.C. Ecological indicators for system-wide assessment of the greater everglades ecosystem restoration program. Ecol. Indic. 2009, 9, S2–S16. [Google Scholar]
- Author, R.; Welsh, H.H.; Ollivier, L.M.; And, J.R. Stream Amphibians as Indicators of Ecosystem Stress: A Case Study from California’s Redwoods. Ecol. Appl. 1998, 8, 1118–1132. [Google Scholar]
- Mathewson, B. Salamanders in a changing environment on hemlock hill. Arnoldia 2007, 65, 19–25. [Google Scholar]
- Mathewson, B. The Relative Abundance of Eastern Red-Backed Salamanders in Eastern Hemlock-dominated and Mixed Deciduous Forests at Harvard Forest. Northeast. Nat. 2009, 16, 1–12. [Google Scholar] [CrossRef]
- Wade, A.S.I.; Barov, B.; Burfield, I.J.; Gregory, R.D.; Norris, K.; Vorisek, P.; Wu, T.; Butler, S.J. A Niche-Based Framework to Assess Current Monitoring of European Forest Birds and Guide Indicator Species’ Selection. PLoS ONE 2014, 9, e97217. [Google Scholar] [CrossRef]
- Lindenmayer, D.B.; Likens, G.E. Direct Measurement Versus Surrogate Indicator Species for Evaluating Environmental Change and Biodiversity Loss. Ecosystems 2011, 14, 47–59. [Google Scholar] [CrossRef]
- Lindenmayer, D.B.; Margules, C.R.; Botkin, D.B. Indicators of Biodiversity for Ecologically Sustainable Forest Management. Conserv. Biol. 2000, 14, 941–950. [Google Scholar] [CrossRef]
- Quinn, J.E.; Brandle, J.R.; Johnson, R.J.; Tyre, A.J. Application of detectability in the use of indicator species: A case study with birds. Ecol. Indic. 2011, 11, 1413–1418. [Google Scholar] [CrossRef]
- Urban, N.A.; Swihart, R.K.; Malloy, M.C.; Dunning, J.B. Improving selection of indicator species when detection is imperfect. Ecol. Indic. 2012, 15, 188–197. [Google Scholar] [CrossRef]
- Dufrêne, M.; Legendre, P. Species assemblages and indicator species:the need for a flexible asymmetrical approach. Ecol. Monogr. 1997, 67, 345–366. [Google Scholar] [CrossRef]
- U.S. EPA. Climate Change Effects on Stream and River Biological Indicators: A Preliminary Analysis (Final Report); EPA/600/R-07/085F; U.S. Environmental Protection Agency: Washington, DC, USA, 2008.
- Ellison, A.M.; Bank, M.S.; Clinton, B.D.; Colburn, E.A.; Elliott, K.; Ford, C.R.; Foster, D.R.; Kloeppel, B.D.; Knoepp, J.D.; Lovett, G.M.; et al. Loss of foundation species: Consequences for the structure and dynamics of forested ecosystems. Front Ecol. Environ. 2005, 3, 479–486. [Google Scholar] [CrossRef]
- Orwig, D.A.; Barker Plotkin, A.A.; Davidson, E.A.; Lux, H.; Savage, K.E.; Ellison, A.M. Foundation species loss affects vegetation structure more than ecosystem function in a northeastern USA forest. PeerJ 2013, 1, e41. [Google Scholar] [CrossRef]
- Burton, T.M.; Likens, G.E. Salamander Populations and Biomass in the Hubbard Brook Experimental Forest, New Hampshire. Copeia 1975, 1975, 541. [Google Scholar] [CrossRef]
- Siddig, A.A.H.; Ellison, A.M.; Mathewson, B.G. Assessing the impacts of the decline of Tsuga canadensis stands on two amphibian species in a New England forest. Ecosphere 2016, 7, e01574. [Google Scholar] [CrossRef]
- Foster, D.R.; Aber, J.D. Forests in Time: The Environmental Consequences of 1,000 Years of Change in New England; Yale University Press: London, UK, 2004; ISBN 0300115377. [Google Scholar]
- Likens, G.E.; Bormann, F.H.; Johnson, N.M.; Pierce, R.S. The Calcium, Magnesium, Potassium, and Sodium Budgets for a Small Forested Ecosystem. Ecology 1967, 48, 772–785. [Google Scholar] [CrossRef]
- Elliott, K.J.; Miniat, C.F. Herbaceous-layer diversity and tree seedling recruitment are enhanced following Rhododendron maximum shrub removal. For. Ecol. Manag. 2018, 430, 403–412. [Google Scholar] [CrossRef]
- Knoepp, J.D.; See, C.R.; Vose, J.M.; Miniat, C.F.; Clark, J.S. Total C and N Pools and Fluxes Vary with Time, Soil Temperature, and Moisture Along an Elevation, Precipitation, and Vegetation Gradient in Southern Appalachian Forests. Ecosystems 2018, 21, 1623–1638. [Google Scholar] [CrossRef]
- Smith, W.B.; Miles, P.D.; Perry, C.H.; Pugh, S.A. Forest Resources of the United States, 2007; U.S. Department of Agriculture, Forest Service: Washington, DC, USA, 2017; Volume 78.
- Yamasaki, M.; DeGraaf, W.B.; Lanier, J. Wildlife habitat associations in Eastern Hemlock—Birds, smaller mammals, and forest carnivores. In United States Department of Agriculture General Technical Report 267, Proceedings of the Symposium on Sustainable Management of Hemlock Ecosystems in Eastern North America, Newton Square, PA, USA; McManus, K.A., Shields, K.S., Souto, D.R., Eds.; U.S. Department of Agriculture, Forest Service, Northeastern Forest Experiment Station: Newton Square, PA, USA, 2000; pp. 135–143. [Google Scholar]
- Sackett, T.E.; Record, S.; Bewick, S.; Baiser, B.; Sanders, N.J.; Ellison, A.M. Response of macroarthropod assemblages to the loss of hemlock (Tsuga canadensis), a foundation species. Ecosphere 2011, 2, art74. [Google Scholar] [CrossRef]
- Snyder, C.D.; Young, J.A.; Lemarié, D.P.; Smith, D.R. Influence of eastern hemlock (Tsuga canadensis) forests on aquatic invertebrate assemblages in headwater streams. Can. J. Fish. Aquat. Sci. 2002, 59, 262–275. [Google Scholar] [CrossRef]
- Tingley, M.W.; Orwig, D.A.; Field, R.; Motzkin, G. Avian response to removal of a forest dominant: Consequences of hemlock woolly adelgid infestations. J. Biogeogr. 2002, 29, 1505–1516. [Google Scholar] [CrossRef]
- Ellison, A.M.; Chen, J.; Díaz, D.; Kammerer-Burnham, C.; Lau, M.C.F. Changes in Ant Community Structure and Composition Associated with Hemlock Decline in New England. In Proceedings of the 3rd Symposium on Hemlock Woolly Adelgid in the Eastern United States, Asheville, NC, USA, 1–3 February 2005; Onken, B., Reardon, R., Eds.; U.S. Department of Agriculture, U.S. Forest Service Forest Health Technology Enterprise Team: Morgantown, WV, USA, 2005; pp. 280–289. [Google Scholar]
- Dilling, C.; Lambdin, P.; Grant, J.; Buck, L. Insect guild structure associated with eastern hemlock in the southern Appalachians. Environ. Entomol. 2007, 36, 1408–1414. [Google Scholar] [CrossRef]
- Mathewson, B.G. The Relative Abundance of the Juvenile Phase of the Eastern Red-Spotted Newt at Harvard Forest Prior to the Arrival of the Hemlock Woolly Adelgid. Southeast. Nat. 2014. [Google Scholar] [CrossRef]
- Rohr, J.R.; Mahan, C.G.; Kim, K.C. Response of arthropod biodiversity to foundation species declines: The case of the eastern hemlock. For. Ecol. Manag. 2009, 258, 1503–1510. [Google Scholar] [CrossRef]
- Siderhurst, L.A.; Griscom, H.P.; Hudy, M.; Bortolot, Z.J. Changes in light levels and stream temperatures with loss of eastern hemlock (Tsuga canadensis) at a southern Appalachian stream: Implications for brook trout. For. Ecol. Manag. 2010, 260, 1677–1688. [Google Scholar] [CrossRef]
- Mallis, R.E.; Rieske, L.K. Arboreal Spiders in Eastern Hemlock. Environ. Entomol. 2011, 40, 1378–1387. [Google Scholar] [CrossRef]
- Havill, N.P.; Montgomery, M.E.; Yu, G.; Shiyake, S.; Caccone, A.; Caccone, A. Mitochondrial DNA from Hemlock Woolly Adelgid (Hemiptera: Adelgidae) Suggests Cryptic Speciation and Pinpoints the Source of the Introduction to Eastern North America. Ann. Entomol. Soc. Am. 2006, 99, 195–203. [Google Scholar] [CrossRef]
- Orwig, D.A.; Foster, D.R.; Mausel, D.L. Landscape patterns of hemlock decline in New England due to the introduced hemlock woolly adelgid. J. Biogeogr. 2002, 29, 1475–1487. [Google Scholar] [CrossRef]
- Eschtruth, A.K.; Cleavitt, N.L.; Battles, J.J.; Evans, R.A.; Fahey, T.J. Vegetation dynamics in declining eastern hemlock stands: 9 years of forest response to hemlock woolly adelgid infestation. Can. J. For. Res. 2006, 36, 1435–1450. [Google Scholar] [CrossRef]
- Knoepp, J.D.; Vose, J.M.; Clinton, B.D.; Hunter, M.D. Hemlock Infestation and Mortality: Impacts on Nutrient Pools and Cycling in Appalachian Forests. Soil Sci. Soc. Am. J. 2011, 75, 1935–1945. [Google Scholar] [CrossRef]
- Orwig, D.A.; Foster, D.R. Forest Response to the Introduced Hemlock Woolly Adelgid in Southern New England, USA. J. Torrey Bot. Soc. 1998, 125, 60–73. [Google Scholar] [CrossRef]
- Kendrick, J.A.; Ribbons, R.R.; Classen, A.T.; Ellison, A.M. Changes in canopy structure and ant assemblages affect soil ecosystem variables as a foundation species declines. Ecosphere 2015, 6, art77. [Google Scholar] [CrossRef]
- Foster, D.R.; Orwig, D.A. Preemptive and salvage harvesting of New England forests: When doing nothing is a viable alternative. Conserv. Biol. 2006, 20, 959–970. [Google Scholar] [CrossRef]
- Ellison, A.M.; Barker-Plotkin, A.A.; Foster, D.R.; Orwig, D.A. Experimentally testing the role of foundation species in forests: The Harvard Forest Hemlock Removal Experiment. Methods Ecol. Evolut. 2010, 1, 168–179. [Google Scholar] [CrossRef]
- Orwig, D.A.; Cobb, R.C.; D’amato, A.W.; Kizlinski, M.L.; Foster, D.R. Multi-year ecosystem response to hemlock woolly adelgid infestation in southern New England forests. Can. J. For. Res. 2008, 38, 834–843. [Google Scholar] [CrossRef]
- Orwig, D.A.; Thompson, J.R.; Povak, N.A.; Manner, M.; Niebyl, D.; Foster, D.R. A foundation tree at the precipice: Tsuga canadensis health after the arrival of Adelges tsugae in central New England. Ecosphere 2012, 3, art10. [Google Scholar] [CrossRef]
- Ford, C.R.; Elliott, K.J.; Clinton, B.D.; Kloeppel, B.D.; Vose, J.M. Forest dynamics following eastern hemlock mortality in the southern Appalachians. Oikos 2012, 121, 523–536. [Google Scholar] [CrossRef]
- Siddig, A.A.; Ellison, A.M.; Jackson, S. Calibrating abundance indices with population size estimators of red back salamanders (Plethodon cinereus) in a New England forest. PeerJ 2015, 3, e952. [Google Scholar] [CrossRef] [PubMed]
- Royle, J.A. N-Mixture Models for Estimating Population Size from Spatially Replicated Counts. Biometrics 2004, 60, 108–115. [Google Scholar] [CrossRef] [PubMed]
- MacKenzie, D.I.; Nichols, J.D.; Lachman, G.B.; Droege, S.; Royle, J.A.; Langtimm, C.A. estimating site occupancy rates when detection probabilities are less than one. Ecology 2002, 83, 2248–2255. [Google Scholar] [CrossRef]
- R Core Team. R: A language and environment for statistical computing; R Foundation for Statistical Computing: Vienna, Austria, 2014; Available online: http://www.R-project.org/ (accessed on 1 October 2018).
- Hairston, N.G. Community Ecology and Salamander Guilds/Monograph; Cambridge University Press: Cambridge, UK, 2009; ISBN 9780521310819. [Google Scholar]
- Hesed, K.M. Uncovering Salamander Ecology: A Review of Coverboard Design. J. Herpetol. 2012, 46, 442–450. [Google Scholar] [CrossRef]
- Welsh, H.H.; Pope, K.L.; Wheeler, C.A. Using multiple metrics to assess the effects of forest succession on population status: A comparative study of two terrestrial salamanders in the US Pacific Northwest. Biol. Conserv. 2008, 141, 1149–1160. [Google Scholar] [CrossRef]
- Wyman, R.L. Experimental assessment of salamanders as predators of detrital food webs: Effects on invertebrates, decomposition and the carbon cycle. Biodivers. Conserv. 1998, 7, 641–650. [Google Scholar] [CrossRef]
- Best, M.L.; Welsh, H.H., Jr. The trophic role of a forest salamander: Impacts on invertebrates, leaf litter retention, and the humification process. Ecosphere 2014, 5, art16. [Google Scholar] [CrossRef]
- Hocking, D.J.; Babbitt, K.J. Effects of Red-Backed Salamanders on Ecosystem Functions. PLoS ONE 2014, 9, e86854. [Google Scholar] [CrossRef] [PubMed]
- Eaton, S.W. Wild Turkey (Meleagris gallopavo). In The Birds of North America; Poole, A., Stettenheim, P., Gill, F., Eds.; American Ornithologists’ Union: Chicago, IL, USA, 1992; pp. 1–27. [Google Scholar]
- Arnold, S.J. A Quantitative Approach to Antipredator Performance: Salamander Defense against Snake Attack. Copeia 1982, 1982, 247. [Google Scholar] [CrossRef]
- Lowe, W.H.; Bolger, D.T. Local and Landscape-Scale Predictors of Salamander Abundance in New Hampshire Headwater Streams. Conserv. Biol. 2002, 16, 183–193. [Google Scholar] [CrossRef]
- Grant, E.H.C.; Green, L.E.; Lowe, W.H. Salamander occupancy in headwater stream networks. Freshw. Biol. 2009, 54, 1370–1378. [Google Scholar] [CrossRef]
- Lowe, W.H. Climate change is linked to long-term decline in a stream salamander. Biol. Conserv. 2012, 145, 48–53. [Google Scholar] [CrossRef]
- Stoddard, M.A.; Hayes, J.P.; Stoddard, A. The Influence of Forest Management on Headwater Stream Amphibians At Multiple Spatial Scales. America 2012, 15, 811–823. [Google Scholar]
- Cecala, K.K.; Lowe, W.H.; Maerz, J.C. Riparian disturbance restricts in-stream movement of salamanders. Freshw. Biol. 2014, 59, 2354–2364. [Google Scholar] [CrossRef]
- Vernick, S. Night of the spotted salamanders. Highlights 2012 2012, 4, 10–11. [Google Scholar]
- Price, S.J.; Dorcas, M.E. The Carolina Herp Atlas: An Online, Citizen-Science Approach to Document Amphibian and Reptile Occurrences. Herpetol. Conserv. Biol. 2011, 6, 287–296. [Google Scholar]


© 2019 by the authors. Licensee MDPI, Basel, Switzerland. This article is an open access article distributed under the terms and conditions of the Creative Commons Attribution (CC BY) license (http://creativecommons.org/licenses/by/4.0/).