Figure 1.
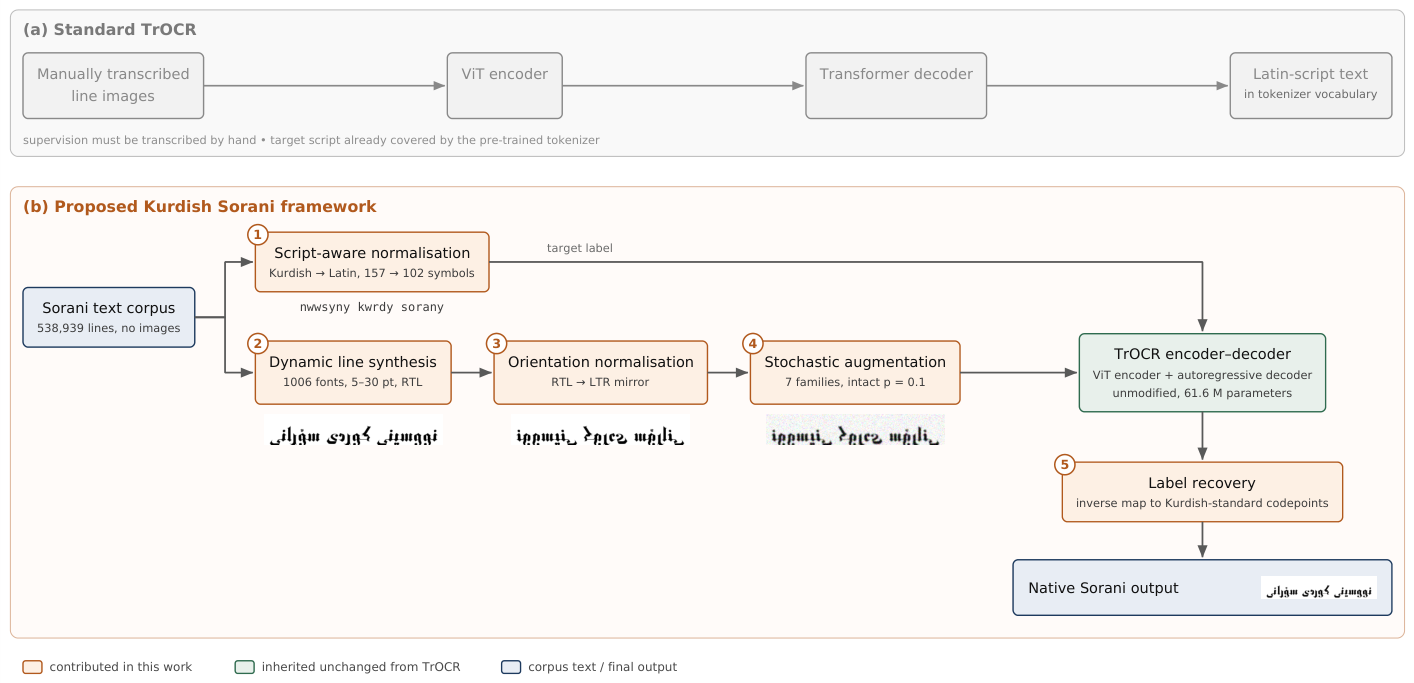
The proposed framework against a standard TrOCR pipeline. (a) Standard TrOCR needs manually transcribed line images, and its target script is already covered by the pre-trained tokenizer. (b) The proposed system replaces annotated images with corpus-driven synthesis and inserts a reversible Latin label space, so that the encoder–decoder itself is unmodified. Numbered blocks are the five contributed components; the line images shown beneath blocks 2–4 are genuine intermediate outputs of the pipeline for the phrase Kurdish Sorani writing, rendered here at a larger point size than training uses so that the glyphs stay legible. The augmented sample shows one operator (blur with sensor noise); training draws a family and an operation at random for every line. The Kurdish phrase in the sample images means Kurdish Sorani writing, and nwwsyny kwrdy sorany is its transliteration into the Latin label space that the decoder predicts in.
Figure 1.
The proposed framework against a standard TrOCR pipeline. (a) Standard TrOCR needs manually transcribed line images, and its target script is already covered by the pre-trained tokenizer. (b) The proposed system replaces annotated images with corpus-driven synthesis and inserts a reversible Latin label space, so that the encoder–decoder itself is unmodified. Numbered blocks are the five contributed components; the line images shown beneath blocks 2–4 are genuine intermediate outputs of the pipeline for the phrase Kurdish Sorani writing, rendered here at a larger point size than training uses so that the glyphs stay legible. The augmented sample shows one operator (blur with sensor noise); training draws a family and an operation at random for every line. The Kurdish phrase in the sample images means Kurdish Sorani writing, and nwwsyny kwrdy sorany is its transliteration into the Latin label space that the decoder predicts in.
Figure 2.
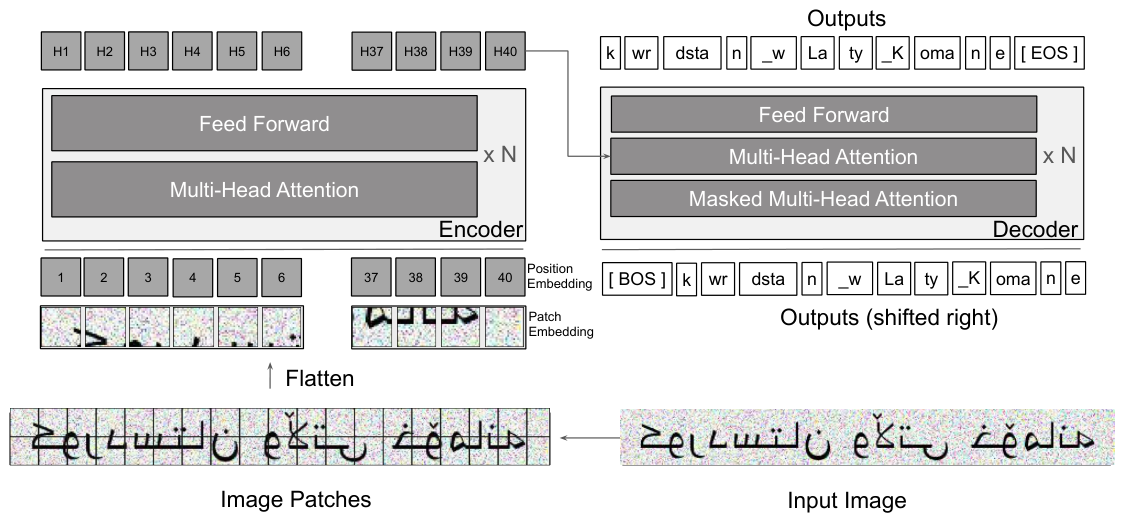
Architecture of the proposed transformer-based Kurdish Sorani OCR system. A TrOCR-style recognition pipeline in which an input line image is split into patches and encoded by a vision transformer, then decoded autoregressively by a transformer decoder. The decoder emits the transliterated Latin-coded label sequence, which is converted back to Kurdish script at inference time. The input line image contains a Sorani sentence meaning Kurdistan is our homeland, and the output tokens are its transliteration into the Latin label space, which together spell kwrdstan wLaty Komane.
Figure 2.
Architecture of the proposed transformer-based Kurdish Sorani OCR system. A TrOCR-style recognition pipeline in which an input line image is split into patches and encoded by a vision transformer, then decoded autoregressively by a transformer decoder. The decoder emits the transliterated Latin-coded label sequence, which is converted back to Kurdish script at inference time. The input line image contains a Sorani sentence meaning Kurdistan is our homeland, and the output tokens are its transliteration into the Latin label space, which together spell kwrdstan wLaty Komane.
Figure 3.
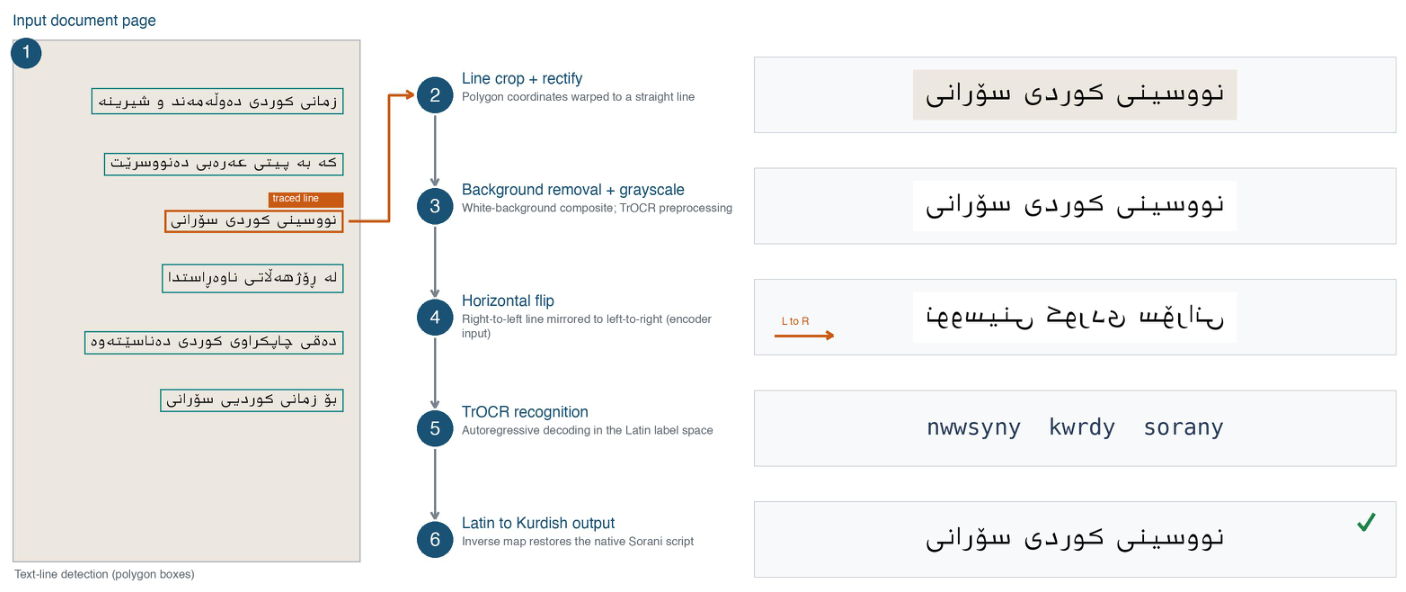
End-to-end inference pipeline of the proposed system, illustrated on one detected line (meaning “Kurdish Sorani writing”). (1) A complete document page is processed by a text-line detection model, which localizes each line as a polygon; one line is highlighted and traced through the remaining stages. (2) The detected line is cropped and perspective-rectified from its polygon coordinates. (3) Its background is removed by compositing onto white and the crop is converted to grayscale. (4) The line is mirrored left-to-right into the orientation the TrOCR encoder expects. (5) TrOCR decodes the image autoregressively into the deterministic Latin label space. (6) The inverse transliteration restores the native Sorani script to produce the final output. The label nwwsyny kwrdy sorany in stage 5 is the Latin transliteration of the traced line, and the other lines on the page in stage 1 are sample Sorani sentences included only to illustrate line detection.
Figure 3.
End-to-end inference pipeline of the proposed system, illustrated on one detected line (meaning “Kurdish Sorani writing”). (1) A complete document page is processed by a text-line detection model, which localizes each line as a polygon; one line is highlighted and traced through the remaining stages. (2) The detected line is cropped and perspective-rectified from its polygon coordinates. (3) Its background is removed by compositing onto white and the crop is converted to grayscale. (4) The line is mirrored left-to-right into the orientation the TrOCR encoder expects. (5) TrOCR decodes the image autoregressively into the deterministic Latin label space. (6) The inverse transliteration restores the native Sorani script to produce the final output. The label nwwsyny kwrdy sorany in stage 5 is the Latin transliteration of the traced line, and the other lines on the page in stage 1 are sample Sorani sentences included only to illustrate line detection.
Figure 4.
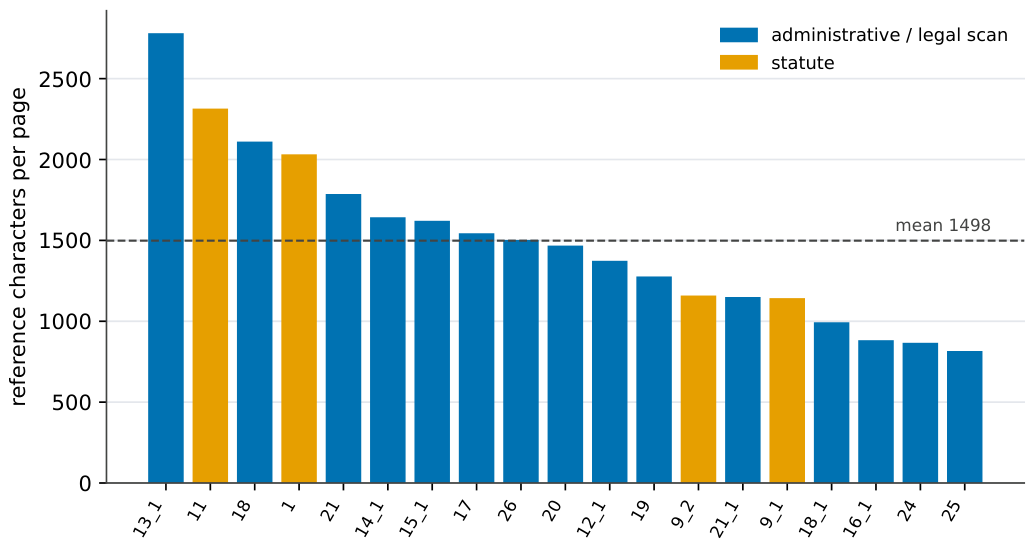
Reference characters per page across the 19-page real-scan benchmark, colored by document type. Page length varies by more than a factor of three (816–2781 characters), so corpus-level (character-weighted) and per-page averages are both reported in
Section 5.4.
Figure 4.
Reference characters per page across the 19-page real-scan benchmark, colored by document type. Page length varies by more than a factor of three (816–2781 characters), so corpus-level (character-weighted) and per-page averages are both reported in
Section 5.4.
Figure 5.
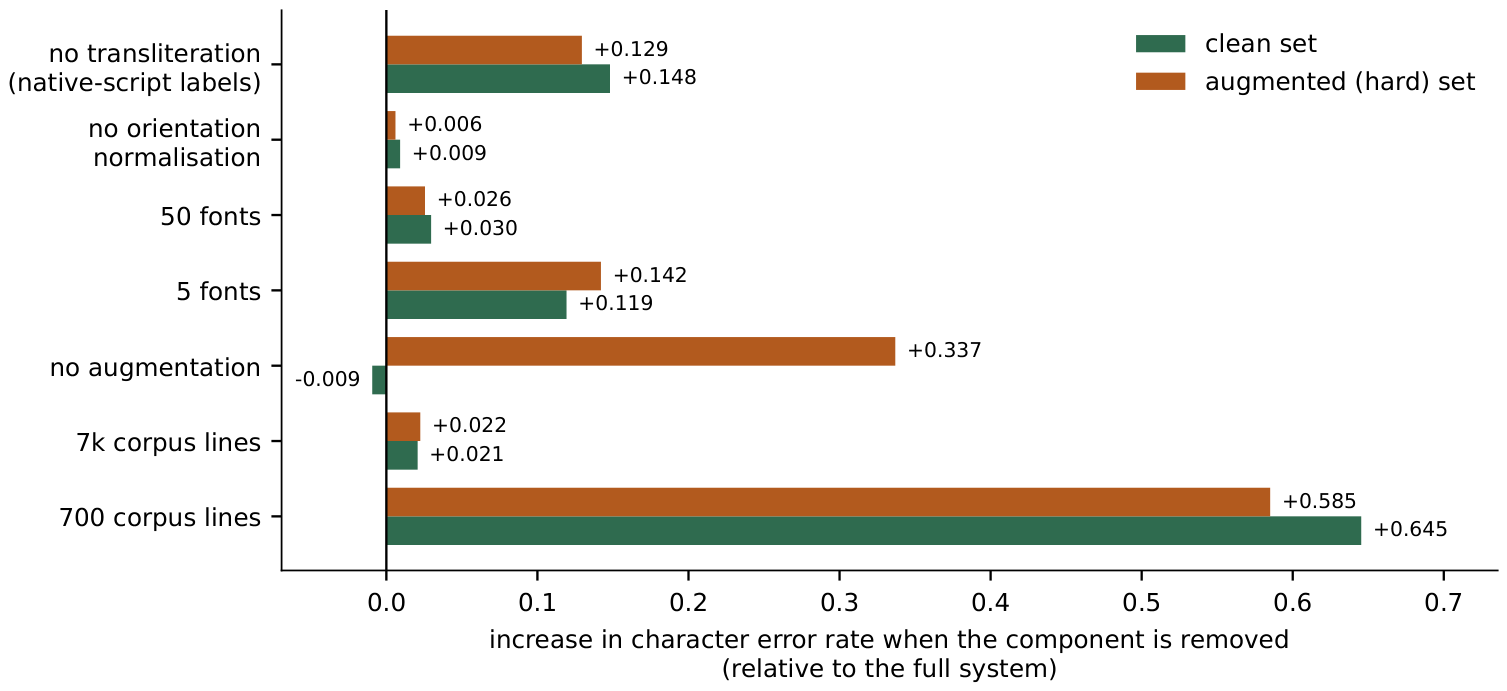
Effect of removing or reducing each component, as the increase in character error rate relative to the full system. Bars to the right of zero mean the ablated system is worse. Augmentation is the only component whose removal helps on the clean set, and it is also the one whose removal hurts most on the augmented set.
Figure 5.
Effect of removing or reducing each component, as the increase in character error rate relative to the full system. Bars to the right of zero mean the ablated system is worse. Augmentation is the only component whose removal helps on the clean set, and it is also the one whose removal hurts most on the augmented set.
Figure 6.
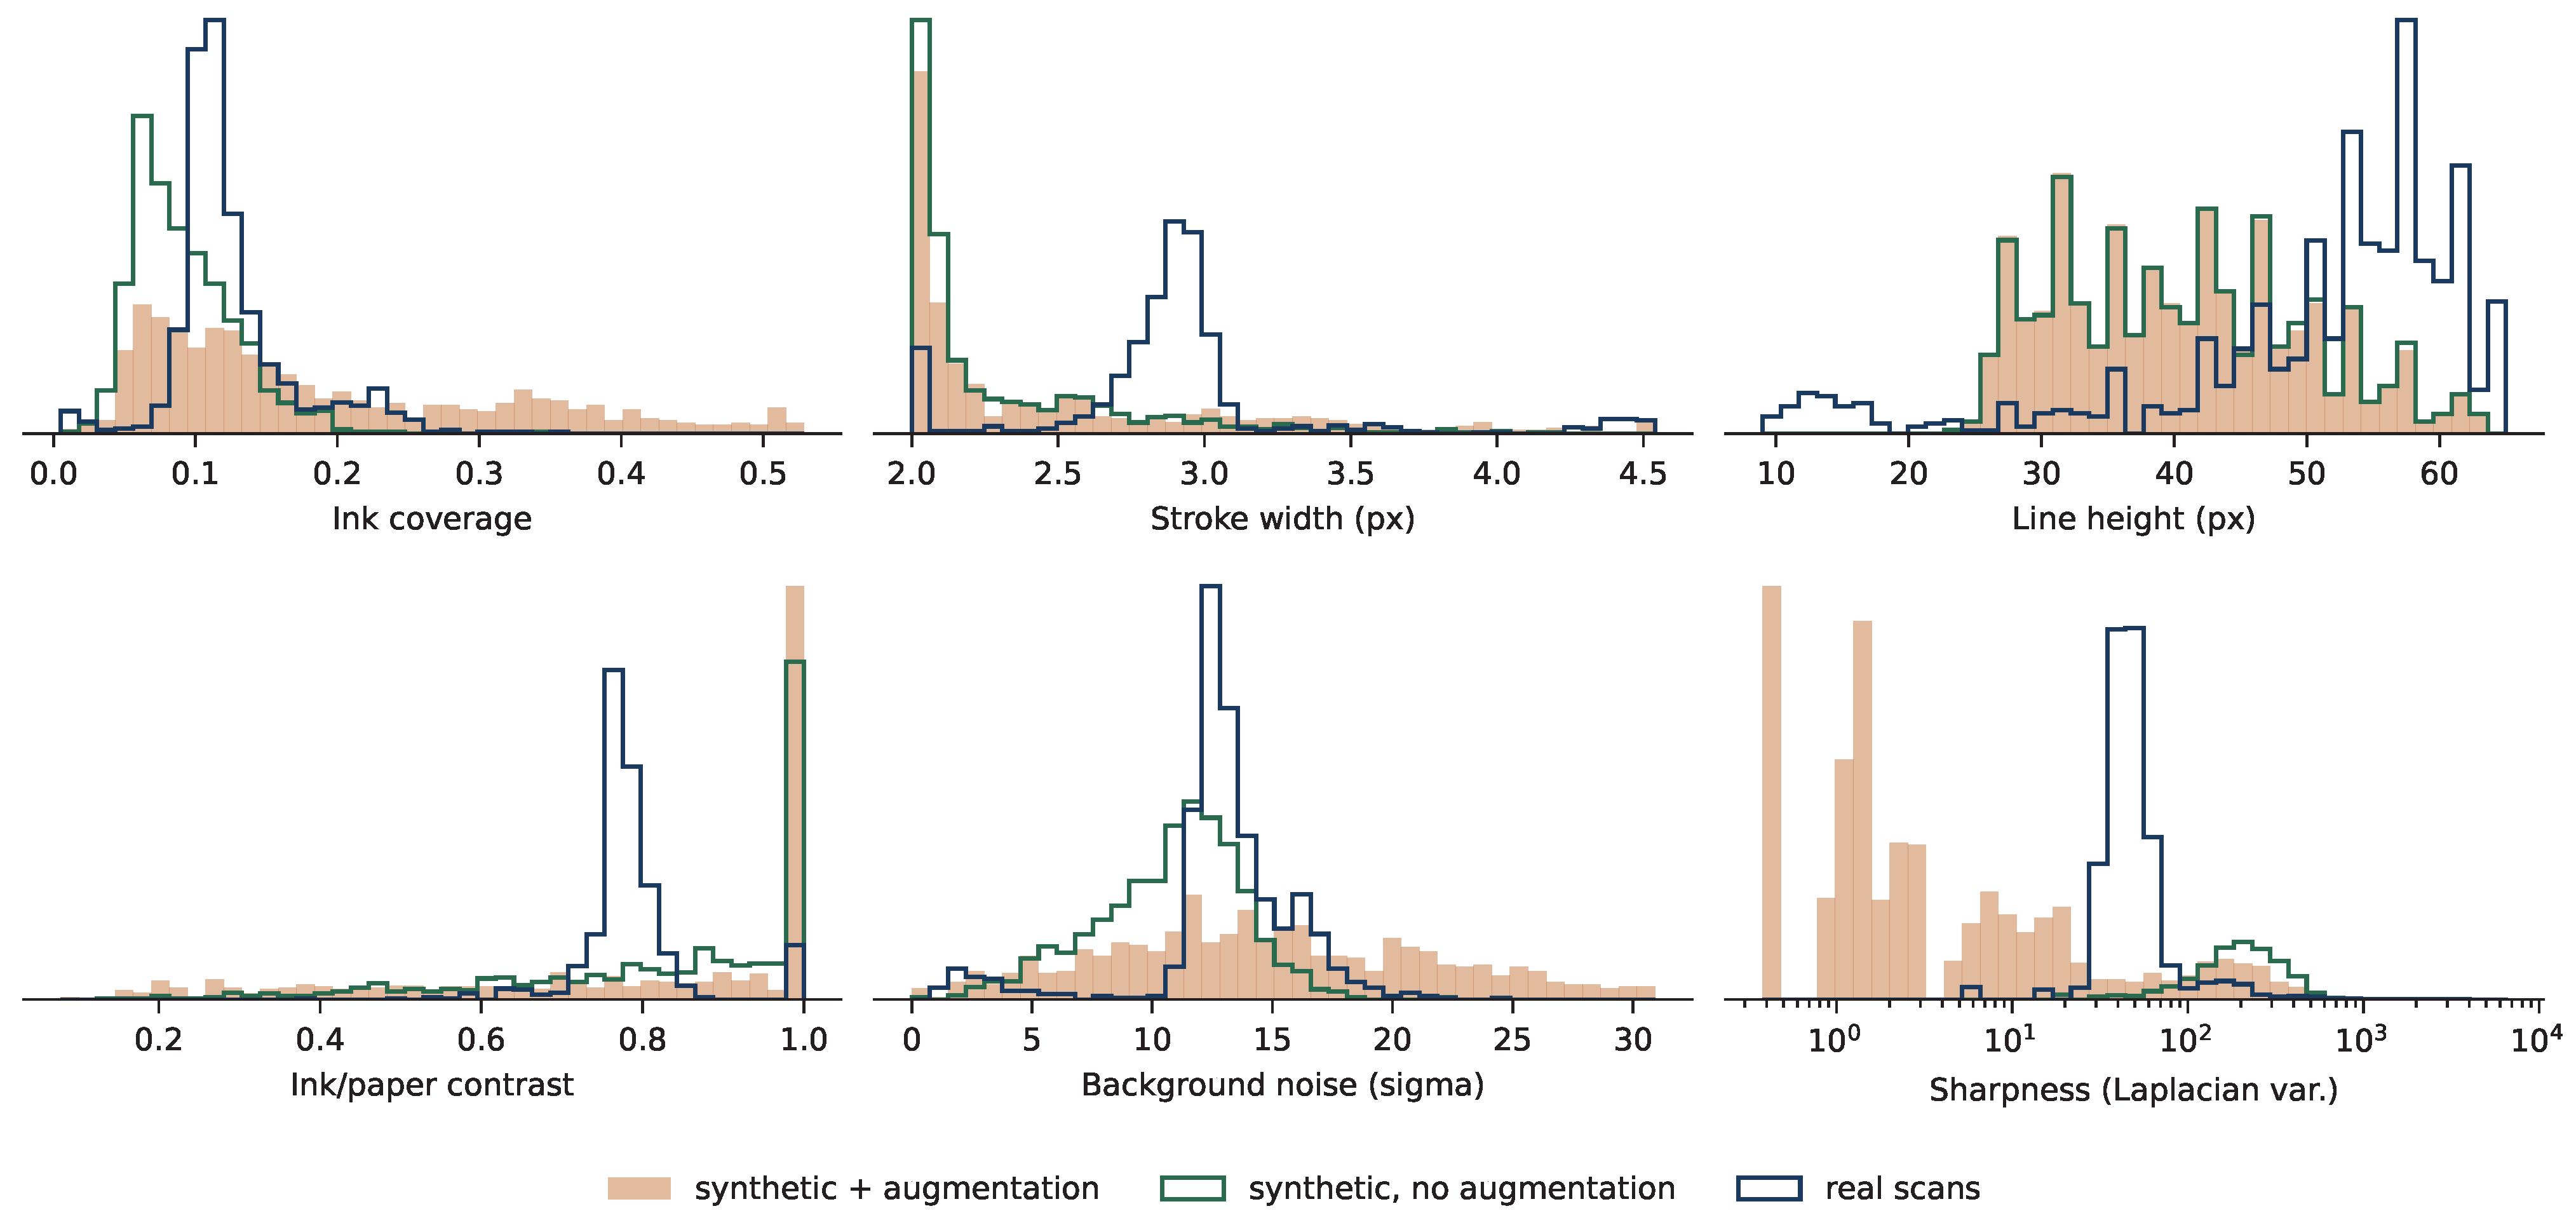
Distribution of six low-level image statistics over 948 real line crops and 800 synthetic lines per condition. Un-augmented renders (green outline) are systematically cleaner than real scans; augmentation (shaded) widens the synthetic distribution until it brackets the real one. Sharpness is drawn on a logarithmic axis because of its heavy right tail.
Figure 6.
Distribution of six low-level image statistics over 948 real line crops and 800 synthetic lines per condition. Un-augmented renders (green outline) are systematically cleaner than real scans; augmentation (shaded) widens the synthetic distribution until it brackets the real one. Sharpness is drawn on a logarithmic axis because of its heavy right tail.
Figure 7.
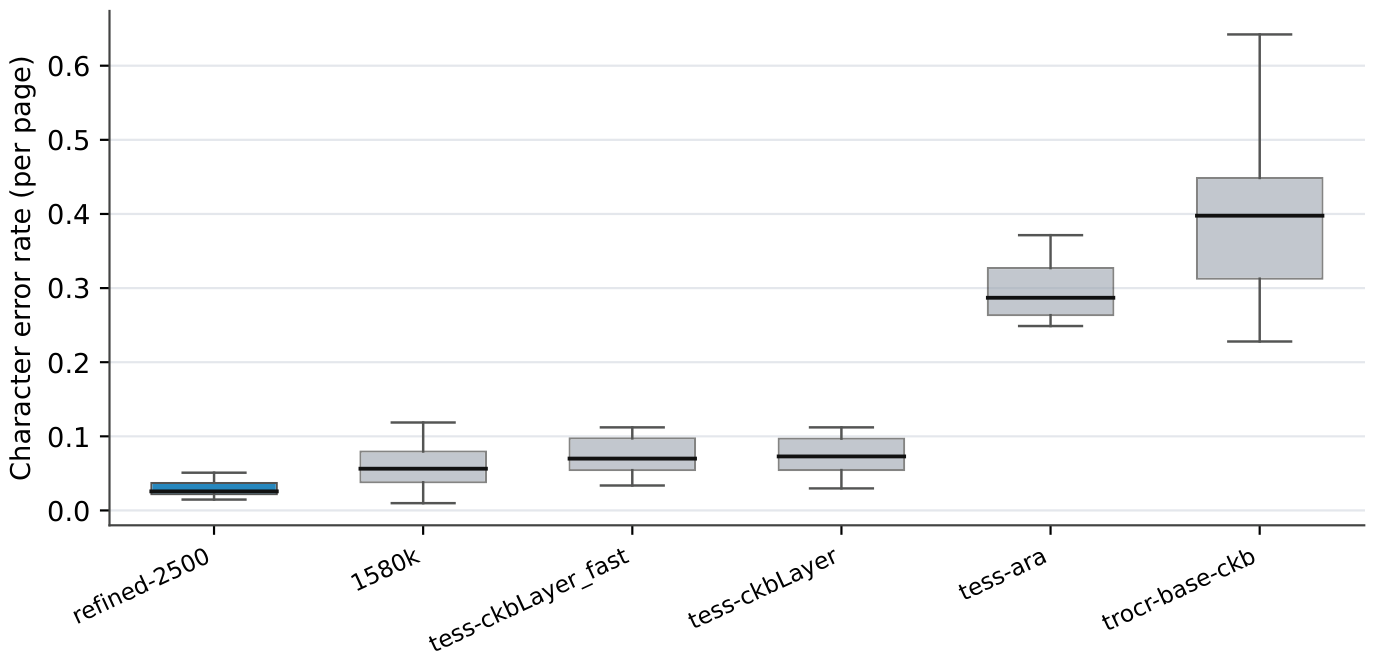
Per-page CER distribution for each system on the 19-page real-scan benchmark. The proposed model (highlighted) combines the lowest median with the smallest dispersion.
Figure 7.
Per-page CER distribution for each system on the 19-page real-scan benchmark. The proposed model (highlighted) combines the lowest median with the smallest dispersion.
Figure 8.
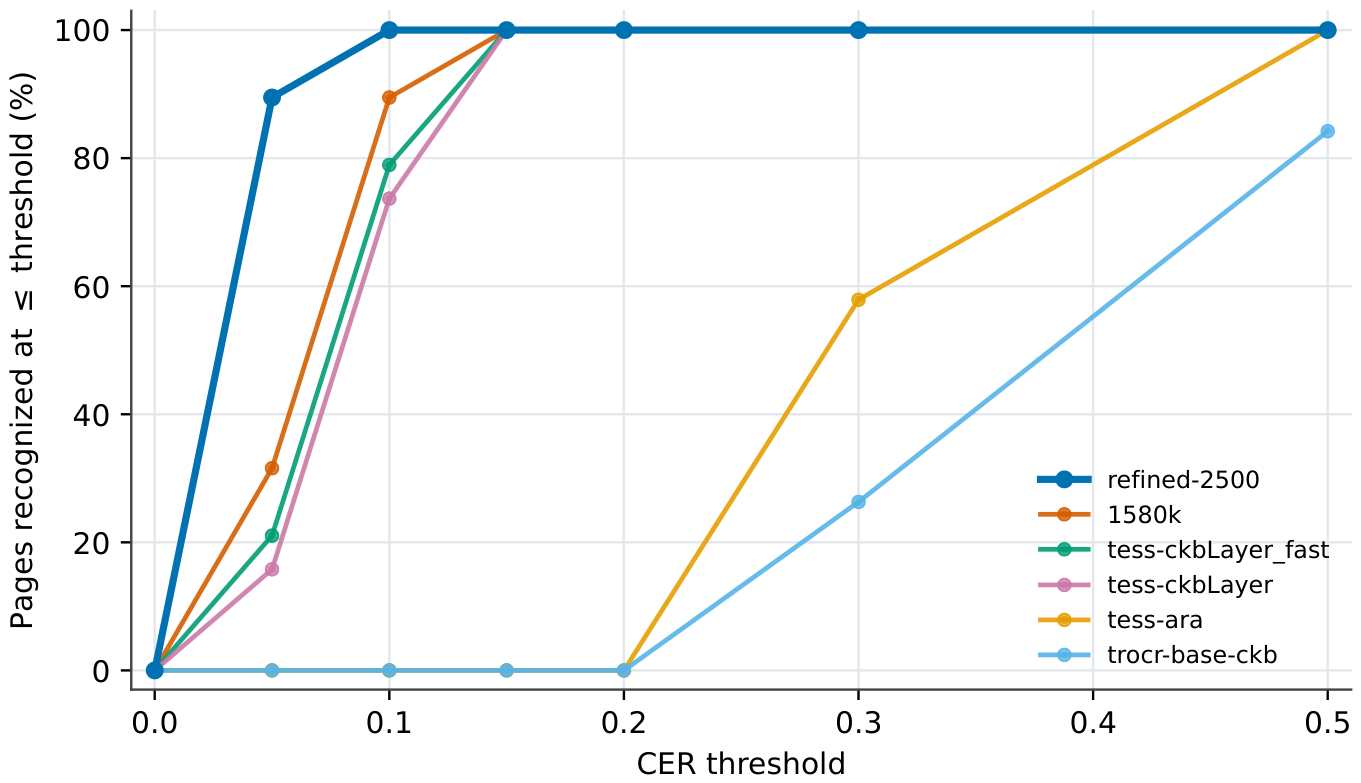
Cumulative accuracy: fraction of the 19 pages with CER at or below the threshold on the horizontal axis. The proposed model dominates all baselines across the full range, clearing every page by a CER of 0.10.
Figure 8.
Cumulative accuracy: fraction of the 19 pages with CER at or below the threshold on the horizontal axis. The proposed model dominates all baselines across the full range, clearing every page by a CER of 0.10.
Figure 9.
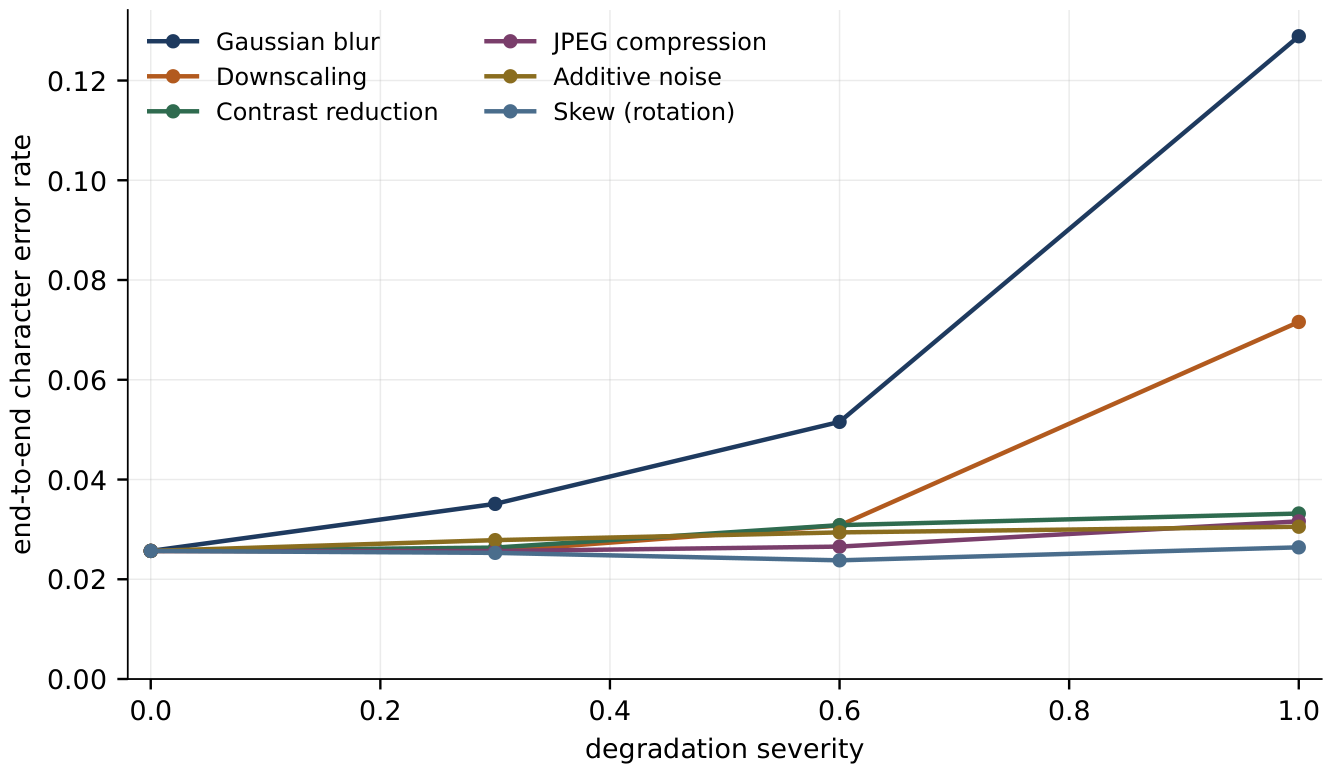
End-to-end character error rate on the 19 real pages as each degradation is applied more strongly. Blur and resolution loss are what threaten the system; compression, noise, contrast loss and skew are absorbed almost entirely.
Figure 9.
End-to-end character error rate on the 19 real pages as each degradation is applied more strongly. Blur and resolution loss are what threaten the system; compression, noise, contrast loss and skew are absorbed almost entirely.
Table 1.
Summary of representative prior OCR approaches relevant to Kurdish Sorani.
Table 1.
Summary of representative prior OCR approaches relevant to Kurdish Sorani.
| Study | Script/Language | Approach and Key Point |
|---|
| Smith [4] | General | Tesseract engine; standard open-source OCR baseline |
| Li et al. [1] | General | TrOCR encoder–decoder; transformer OCR with pre-training |
| Yaseen & Hassani [8] | Kurdish Sorani | Segmentation analysis; mixed fonts degrade recognition |
| Idrees & Hassani [9] | Kurdish Sorani | Tesseract LSTM with Arabic-to-Sorani script-similarity transfer |
| Yaseen & Hassani [10] | Historical Kurdish | Tesseract-based; stresses lack of public Kurdish OCR data |
| Mortadi et al. [18] | Arabic | Transformer OCR (ALNASIKH) |
| Asadi-Zeydabadi et al. [19] | Farsi | Transformer-based recognition |
| Rahman et al. [20] | Urdu | UTRNet high-resolution printed-text recognition |
| You et al. [21] | Uyghur | End-to-end printed-text recognition |
Table 2.
Recent Kurdish OCR datasets and recognition systems (2024–2026). These target handwritten or scene text; printed Sorani document-line OCR still lacks a public benchmark.
Table 2.
Recent Kurdish OCR datasets and recognition systems (2024–2026). These target handwritten or scene text; printed Sorani document-line OCR still lacks a public benchmark.
| Resource/System | Year | Type | Scope and Key Detail |
|---|
| EMNIST-like set [22] | 2024 | Characters | Standard Kurdish isolated-character dataset |
| KSTRV1 [23] | 2025 | Scene text | 1420 images, 19,872 word crops; Sorani, Badini, Arabic, English |
| KHLD [24] | 2026 | Handwritten lines | 47,944 line images across 4802 sentence sets |
| DASNUS / ResNet–ViT [26] | 2026 | Handwritten lines | 11,475 lines, 867 writers; CER 3.47%, WER 17.37% |
| DenseNet121–Transformer [27] | 2026 | Handwritten lines | Synthetic line generation; CER 0.0593 (0.0534 with 8-g LM) |
| IJDAR analysis [25] | 2025 | Survey | Comprehensive analysis of Kurdish handwriting digitization |
Table 3.
Source corpus and synthetic line-rendering statistics.
Table 3.
Source corpus and synthetic line-rendering statistics.
| Property | Value |
|---|
| Total non-empty corpus lines | 538,939 |
| Mean line length (characters) | 52.1 |
| Median line length (characters) | 51 |
| Maximum line length (characters) | 754 |
| Lines loaded per training run | 70,000 |
| Train/test split (disjoint text lines) | 80%/20% |
| Validation set | Held out from training set |
| In-distribution check set | 200 rendered lines (from test split) |
| Primary evaluation set | 19 real scanned pages (Section 4) |
| Font files in archive (TTF/OTF) | 1006 |
| Font size sampling range (points) | 5–30 |
| Render mode | Right-to-left, RGB |
| Background/text color | White/black |
| Unaugmented (intact) probability | 0.1 |
Table 4.
Effect of the Arabic-script → Latin transliteration on the decoder label space, measured over the full 538,939-line corpus. The core inventory is the smallest symbol set covering 99.9% of character tokens.
Table 4.
Effect of the Arabic-script → Latin transliteration on the decoder label space, measured over the full 538,939-line corpus. The core inventory is the smallest symbol set covering 99.9% of character tokens.
| Quantity | Arabic Script | After Translit. |
|---|
| Core inventory (99.9% coverage) | 157 | 102 |
| Rewritten graphemes (many→one) | 65 | 52 |
| Full distinct codepoints | 1257 | 1193 |
| Core reduction: 35.0% Rewritten-set collapse: 20.0% |
Table 5.
Sorani graphemes with no piece in the pre-trained XLM-RoBERTa SentencePiece vocabulary used by the TrOCR decoder. Each tokenizes to <unk>, so a decoder trained on native-script labels cannot emit it. Frequencies are over all 28,095,287 characters of the source corpus.
Table 5.
Sorani graphemes with no piece in the pre-trained XLM-RoBERTa SentencePiece vocabulary used by the TrOCR decoder. Each tokenizes to <unk>, so a decoder trained on native-script labels cannot emit it. Frequencies are over all 28,095,287 characters of the source corpus.
| Grapheme | Name | Occurrences | Share of Corpus |
|---|
| ە | ae, schwa (U + 06D5) | 2,456,793 | 8.75% |
| ێ | yeh-with-v (U + 06CE) | 662,908 | 2.36% |
| ۆ | oe (U + 06C6) | 445,489 | 1.59% |
| ڵ | lam-with-v (U + 06B5) | 246,198 | 0.88% |
| ڕ | reh-with-v (U + 0695) | 184,146 | 0.66% |
| ژ | jeh (U + 0698) | 122,160 | 0.44% |
| ڤ | veh (U + 06A4) | 24,482 | 0.09% |
| Total (7 of 34 Sorani graphemes) | 4,142,176 | 14.74% |
Table 6.
Deterministic Kurdish-script → Latin transliteration used as the decoder label space. Each Latin symbol is listed with its source grapheme(s), named by Unicode codepoint. Rows with multiple sources are the lossy many-to-one merges quantified in
Table 4.
Table 6.
Deterministic Kurdish-script → Latin transliteration used as the decoder label space. Each Latin symbol is listed with its source grapheme(s), named by Unicode codepoint. Rows with multiple sources are the lossy many-to-one merges quantified in
Table 4.
| Latin | Source Grapheme(s) | Latin | Source Grapheme(s) |
|---|
| Consonants |
| a | ا alef (U + 0627) * | g | گ gaf (U + 06AF) |
| U | ء hamza (U + 0621) | l | ل lam (U + 0644) |
| u | ؤ waw-hamza (U + 0624) | L | ڵ lam-with-v (U + 06B5) |
| b | ب beh (U + 0628) | m | م meem (U + 0645) |
| p | پ peh (U + 067E) | n | ن noon (U + 0646) |
| t | ت teh (U + 062A) | h | ه heh (U + 0647), ھ heh-doachashmee (U + 06BE) |
| T | ط tah (U + 0637) | w | و waw (U + 0648) |
| M | ة teh-marbuta (U + 0629) | A | ئ yeh-hamza (U + 0626) |
| j | ج jeem (U + 062C) | q | ق qaf (U + 0642) |
| C | چ tcheh (U + 0686) | k | ك kaf (U + 0643), ک keheh (U + 06A9) |
| H | ح hah (U + 062D) | Q | ع ain (U + 0639) |
| K | خ khah (U + 062E) | G | غ ghain (U + 063A) |
| d | د dal (U + 062F) | f | ف feh (U + 0641) |
| D | ذ thal (U + 0630) | v | ڤ veh (U + 06A4) |
| r | ر reh (U + 0631) | s | س seen (U + 0633) |
| R | ڕ reh-with-v (U + 0695) | S | ش sheen (U + 0634) |
| z | ز zain (U + 0632) | X | ص sad (U + 0635) |
| Z | ژ jeh (U + 0698) | | |
| Vowels/semivowels |
| e | ە ae, schwa (U + 06D5) | E | ێ yeh-with-v (U + 06CE) |
| o | ۆ oe (U + 06C6) | y | ی farsi-yeh (U + 06CC), ي yeh (U + 064A), |
| | | | ى alef-maksura (U + 0649) |
| Digits and punctuation |
| 0–9 | ٠١٢٣٤٥٦٧٨٩ (U + 0660–U + 0669), | , | ، Arabic comma (U + 060C) |
| | ۰۱۲۳۴۵۶۷۸۹ (U + 06F0–U + 06F9) | ; | ؛ Arabic semicolon (U + 061B) |
| | | % | ٪ Arabic percent (U + 066A) |
Table 7.
Training and implementation configuration for the final reported model.
Table 7.
Training and implementation configuration for the final reported model.
| Setting | Value |
|---|
| Architecture | TrOCR-style VisionEncoderDecoder |
| Final model parameters | 61.6 M |
| Maximum target length | 128 tokens |
| Precision | Mixed precision |
| Train/evaluation batch size | 8 |
| Training epochs | 100 |
| Checkpoint interval | 1000 steps |
| Evaluation samples | 200 |
| GPU | NVIDIA RTX A5000 (24 GB) |
Table 8.
Method summary.
| Component | Implementation Choice | Purpose |
|---|
| Corpus source | Large Kurdish Sorani text corpus | Provide large-scale text supervision for synthetic rendering |
| Rendering | Dynamic right-to-left line-image generation | Replace manually collected OCR image-text pairs |
| Typography | Random font selection from 1006 TTF and OTF files | Increase shape and style diversity |
| Label space | Deterministic Arabic-script to Latin transliteration | Simplify decoder prediction space |
| Augmentation | One-stage stochastic augmentation with intact probability 0.1 | Improve robustness to distortions |
| Recognizer | TrOCR-style encoder–decoder transformer | End-to-end sequence recognition without explicit segmentation |
| Output recovery | Latin-coded prediction mapped back to Kurdish script | Preserve native-script OCR output |
Table 9.
Profile of the real-scan evaluation benchmark (19 pages of ground-truth-transcribed Kurdish Sorani documents).
Table 9.
Profile of the real-scan evaluation benchmark (19 pages of ground-truth-transcribed Kurdish Sorani documents).
| Quantity | Total | Mean | Median | Range |
|---|
| Pages | 19 | – | – | – |
| administrative/legal scans | 15 | – | – | – |
| statutes | 4 | – | – | – |
| Text lines | 467 | 24.6 | 23 | 14–37 |
| Words | 4131 | 217.4 | 208 | 116–423 |
| Characters | 28,468 | 1498.3 | 1468 | 816–2781 |
| Characters per line | – | 61.0 | – | – |
| Words per line | – | 8.8 | – | – |
| Image width (px) | – | – | 980 | 709–1275 |
| Image height (px) | – | – | 1241 | 899–1755 |
| Image size (megapixels) | – | 1.38 | – | 0.64–2.18 |
Table 10.
Controlled ablation of the synthetic-data pipeline. Every variant differs from the full system in exactly one factor and is trained from the same public checkpoint under an identical budget (12,000 steps, batch 48), then scored on the same frozen evaluation sets. is the change in error relative to the full system; positive means the ablated system is worse. All systems are scored in native Kurdish script after inverse transliteration, under the same script-aware normalization.
Table 10.
Controlled ablation of the synthetic-data pipeline. Every variant differs from the full system in exactly one factor and is trained from the same public checkpoint under an identical budget (12,000 steps, batch 48), then scored on the same frozen evaluation sets. is the change in error relative to the full system; positive means the ablated system is worse. All systems are scored in native Kurdish script after inverse transliteration, under the same script-aware normalization.
| | | Clean Evaluation Set | Augmented (Hard) Set |
|---|
| Factor | Configuration | CER | ΔCER | WER | CER | ΔCER | WER |
|---|
| Reference | Full system (all components) | 0.1131 | – | 0.4620 | 0.1981 | – | 0.5792 |
| Label space | – transliteration (native-script labels) | 0.2611 | +0.1481 | 0.8683 | 0.3276 | +0.1294 | 0.8943 |
| Orientation | – orientation normalization (no RTL→LTR flip) | 0.1222 | +0.0091 | 0.4917 | 0.2042 | +0.0060 | 0.5773 |
| Font diversity | font archive reduced to 50 | 0.1427 | +0.0296 | 0.5422 | 0.2237 | +0.0256 | 0.6309 |
| | font archive reduced to 5 | 0.2323 | +0.1193 | 0.7217 | 0.3402 | +0.1420 | 0.8528 |
| Augmentation | – stochastic augmentation | 0.1037 | −0.0094 | 0.4340 | 0.5350 | +0.3369 | 0.9498 |
| Corpus size | corpus reduced to 7000 lines | 0.1338 | +0.0207 | 0.5335 | 0.2206 | +0.0224 | 0.6284 |
| | corpus reduced to 700 lines | 0.7584 | +0.6453 | 1.0868 | 0.7832 | +0.5851 | 1.1172 |
Table 11.
Synthetic in-distribution evaluation on 200 rendered lines drawn from the held-out test split. Exact match is meaningful at this granularity because each sample is a single line.
Table 11.
Synthetic in-distribution evaluation on 200 rendered lines drawn from the held-out test split. Exact match is meaningful at this granularity because each sample is a single line.
| Model | Model Size | CER | WER | Exact Match |
|---|
| small7-refined-2500 | 61.6 M | 0.0434 | 0.1246 | 64.0% |
| small7-1580k | 61.6 M | 0.0607 | 0.2174 | 56.5% |
| trocr-base-ckb | 241.1 M | 0.5260 | 0.7437 | 2.0% |
| tesseract-ara | 1.4 MB tessdata | 0.7396 | 1.0799 | 0.0% |
| tesseract-ckbLayer | 5.5 MB tessdata | 0.6062 | 0.8460 | 6.5% |
| tesseract-ckbLayer_fast | 3.6 MB tessdata | 0.6131 | 0.8481 | 6.0% |
Table 12.
Synthetic–real domain comparison over 948 real line crops (40 scanned pages, detected and cropped by the deployed pipeline) and 800 rendered lines per synthetic condition. Coverage is the share of real crops falling inside the 5th–95th percentile band of the synthetic population; this measures whether the training distribution actually contains the deployment domain.
Table 12.
Synthetic–real domain comparison over 948 real line crops (40 scanned pages, detected and cropped by the deployed pipeline) and 800 rendered lines per synthetic condition. Coverage is the share of real crops falling inside the 5th–95th percentile band of the synthetic population; this measures whether the training distribution actually contains the deployment domain.
| | Real Scans | Synthetic Median | Coverage |
|---|
| Statistic | Median | [P5, P95] | No Aug. | With Aug. | No Aug. → Aug. |
|---|
| Ink coverage | 0.114 | [0.082, 0.225] | 0.084 | 0.151 | 82% → 97% |
| Stroke width (px) | 2.901 | [2.017, 4.467] | 2.101 | 2.571 | 86% → 98% |
| Line height (px) | 55 | [16, 64] | 40 | 40 | 66% → 66% |
| Ink/paper contrast | 0.773 | [0.714, 1.000] | 0.898 | 0.912 | 100% → 100% |
| Background noise () | 12.9 | [3.5, 17.3] | 11.2 | 14.9 | 74% → 95% |
| Sharpness (Laplacian var.) | 53.9 | [33.7, 933.6] | 254.4 | 230.0 | 18% → 99% |
| Mean coverage of the real domain | 71% → 93% |
Table 13.
Benchmark comparison on the real-scan evaluation set (19 pages). CER and WER are corpus-level (micro-averaged over characters and words). Latency and throughput are per line-image recognition cost on the RTX A5000 and are independent of the evaluation corpus.
Table 13.
Benchmark comparison on the real-scan evaluation set (19 pages). CER and WER are corpus-level (micro-averaged over characters and words). Latency and throughput are per line-image recognition cost on the RTX A5000 and are independent of the evaluation corpus.
| Model | Model Size | CER | WER | Latency | Throughput |
|---|
| | | | | (ms/Image) | (Images/s) |
|---|
| small7-refined-2500 | 61.6 M | 0.0305 | 0.1770 | 1644.6 | 0.61 |
| small7-1580k | 61.6 M | 0.0618 | 0.3355 | 1782.3 | 0.56 |
| trocr-base-ckb | 241.1 M | 0.4252 | 0.8535 | 1415.6 | 0.71 |
| tesseract-ara | 1.4 MB tessdata | 0.2962 | 0.8719 | 41.0 | 24.42 |
| tesseract-ckbLayer | 5.5 MB tessdata | 0.0739 | 0.3423 | 51.0 | 19.60 |
| tesseract-ckbLayer_fast | 3.6 MB tessdata | 0.0738 | 0.3411 | 45.3 | 22.07 |
Table 14.
Per-page mean CER and WER with bootstrap 95% confidence intervals (, pages).
Table 14.
Per-page mean CER and WER with bootstrap 95% confidence intervals (, pages).
| System | CER [95% CI] | WER [95% CI] |
|---|
| small7-refined-2500 | 0.0293 [0.0248, 0.0343] | 0.1699 [0.1479, 0.1911] |
| small7-1580k | 0.0581 [0.0445, 0.0722] | 0.3209 [0.2474, 0.3943] |
| trocr-base-ckb | 0.3946 [0.3440, 0.4459] | 0.8293 [0.7877, 0.8685] |
| tesseract-ara | 0.2959 [0.2792, 0.3134] | 0.8752 [0.8506, 0.9007] |
| tesseract-ckbLayer | 0.0743 [0.0633, 0.0853] | 0.3491 [0.3053, 0.3915] |
| tesseract-ckbLayer_fast | 0.0741 [0.0634, 0.0848] | 0.3486 [0.3059, 0.3910] |
Table 15.
Paired comparison of the proposed model against each baseline on the same 19 pages. is the mean error reduction (baseline—ours); 95% CI from paired bootstrap (); p from the two-sided Wilcoxon signed-rank test (; its floor at this sample size is ).
Table 15.
Paired comparison of the proposed model against each baseline on the same 19 pages. is the mean error reduction (baseline—ours); 95% CI from paired bootstrap (); p from the two-sided Wilcoxon signed-rank test (; its floor at this sample size is ).
| Metric | Baseline | Δ (Base − Ours) [95% CI] | Wilcoxon p |
|---|
| CER | small7-1580k | +0.0288 [+0.0163, +0.0415] | |
| | trocr-base-ckb | +0.3653 [+0.3172, +0.4157] | |
| | tesseract-ara | +0.2666 [+0.2487, +0.2854] | |
| | tesseract-ckbLayer | +0.0450 [+0.0353, +0.0544] | |
| | tesseract-ckbLayer_fast | +0.0448 [+0.0354, +0.0542] | |
| WER | small7-1580k | +0.1510 [+0.0847, +0.2158] | |
| | trocr-base-ckb | +0.6594 [+0.6123, +0.6989] | |
| | tesseract-ara | +0.7053 [+0.6695, +0.7402] | |
| | tesseract-ckbLayer | +0.1792 [+0.1396, +0.2206] | |
| | tesseract-ckbLayer_fast | +0.1787 [+0.1401, +0.2188] | |
Table 16.
Per-page CER distribution across the 19 evaluation pages.
Table 16.
Per-page CER distribution across the 19 evaluation pages.
| System | Median | IQR (Q1–Q3) | Min | Max | Std |
|---|
| small7-refined-2500 | 0.0257 | 0.0218–0.0371 | 0.0147 | 0.0510 | 0.0108 |
| small7-1580k | 0.0563 | 0.0380–0.0795 | 0.0098 | 0.1187 | 0.0317 |
| trocr-base-ckb | 0.3977 | 0.3127–0.4485 | 0.2279 | 0.6422 | 0.1155 |
| tesseract-ara | 0.2869 | 0.2634–0.3269 | 0.2488 | 0.3714 | 0.0389 |
| tesseract-ckbLayer | 0.0729 | 0.0545–0.0969 | 0.0298 | 0.1121 | 0.0248 |
| tesseract-ckbLayer_fast | 0.0699 | 0.0544–0.0973 | 0.0337 | 0.1121 | 0.0246 |
Table 17.
Cumulative accuracy: percentage of the 19 evaluation pages whose CER is at or below each threshold.
Table 17.
Cumulative accuracy: percentage of the 19 evaluation pages whose CER is at or below each threshold.
| System | ≤0.05 | ≤0.1 | ≤0.15 | ≤0.2 | ≤0.3 | ≤0.5 |
|---|
| small7-refined-2500 | 89.5 | 100.0 | 100.0 | 100.0 | 100.0 | 100.0 |
| small7-1580k | 31.6 | 89.5 | 100.0 | 100.0 | 100.0 | 100.0 |
| trocr-base-ckb | 0.0 | 0.0 | 0.0 | 0.0 | 26.3 | 84.2 |
| tesseract-ara | 0.0 | 0.0 | 0.0 | 0.0 | 57.9 | 100.0 |
| tesseract-ckbLayer | 15.8 | 73.7 | 100.0 | 100.0 | 100.0 | 100.0 |
| tesseract-ckbLayer_fast | 21.1 | 78.9 | 100.0 | 100.0 | 100.0 | 100.0 |
Table 18.
Edit-operation decomposition of the proposed model’s errors on the real-scan benchmark.
Table 18.
Edit-operation decomposition of the proposed model’s errors on the real-scan benchmark.
| Level | Substitutions | Deletions | Insertions | Total |
|---|
| Char | 357 (41.1%) | 234 (26.9%) | 278 (32.0%) | 869 |
| Word | 574 (78.5%) | 66 (9.0%) | 91 (12.4%) | 731 |
Table 19.
Most frequent character substitutions by the proposed model on the real-scan benchmark (reference → hypothesis), under script-aware normalization (kaf, yeh and digit forms unified). Dagger (†) marks dot/diacritic-differentiated Sorani minimal pairs.
Table 19.
Most frequent character substitutions by the proposed model on the real-scan benchmark (reference → hypothesis), under script-aware normalization (kaf, yeh and digit forms unified). Dagger (†) marks dot/diacritic-differentiated Sorani minimal pairs.
| # | Ref → Hyp | Count |
|---|
| 1 | ه heh (U + 0647) → ە ae (U + 06D5) | 103 |
| 2 | ڵ lam-with-v (U + 06B5) → ل lam (U + 0644) † | 57 |
| 3 | ڕ reh-with-v (U + 0695) → ر reh (U + 0631) † | 16 |
| 4 | ە ae (U + 06D5) → ␣ | 9 |
| 5 | و waw (U + 0648) → ر reh (U + 0631) | 8 |
| 6 | . → ، comma (U + 060C) | 4 |
| 7 | ر reh (U + 0631) → ڕ reh-with-v (U + 0695) † | 4 |
| 8 | ن noon (U + 0646) → ت teh (U + 062A) † | 4 |
| 9 | ل lam (U + 0644) → ڵ lam-with-v (U + 06B5) † | 4 |
| 10 | ک keheh (U + 06A9) → گ gaf (U + 06AF) † | 4 |
| 11 | ی farsi-yeh (U + 06CC) → پ peh (U + 067E) | 4 |
| 12 | ن noon (U + 0646) → ئ yeh-hamza (U + 0626) † | 3 |
Table 20.
Inference latency per image (ms) and throughput.
Table 20.
Inference latency per image (ms) and throughput.
| System | Mean | p50 | p95 | p99 | Std | Throughput |
|---|
| small7-refined-2500 | 1644.6 | 1636.6 | 2171.3 | 2415.6 | 338.6 | 0.61 |
| small7-1580k | 1782.3 | 1760.8 | 2420.9 | 2775.1 | 379.8 | 0.56 |
| trocr-base-ckb | 1415.6 | 1255.2 | 2296.1 | 4956.8 | 703.0 | 0.71 |
| tesseract-ara | 41.0 | 41.1 | 74.6 | 93.9 | 19.5 | 24.42 |
| tesseract-ckbLayer | 51.0 | 50.2 | 82.3 | 104.7 | 19.5 | 19.60 |
| tesseract-ckbLayer_fast | 45.3 | 44.4 | 83.9 | 91.5 | 18.8 | 22.07 |
Table 21.
Speed and accuracy of the proposed recognizer under deployment settings, measured on the same 200 line images from the frozen evaluation set on one NVIDIA RTX A5000. Each row adds a single change to the row above, and speed-up is relative to the first row, which uses the decoding configuration from
Section 5.4 (four beams, one image at a time, full precision). Absolute latencies are lower than those in
Table 20 because that table times the full-page pipeline on real scans, whereas this one isolates recognition on pre-cropped lines; the comparison across rows is what matters here.
Table 21.
Speed and accuracy of the proposed recognizer under deployment settings, measured on the same 200 line images from the frozen evaluation set on one NVIDIA RTX A5000. Each row adds a single change to the row above, and speed-up is relative to the first row, which uses the decoding configuration from
Section 5.4 (four beams, one image at a time, full precision). Absolute latencies are lower than those in
Table 20 because that table times the full-page pipeline on real scans, whereas this one isolates recognition on pre-cropped lines; the comparison across rows is what matters here.
| Configuration | Beams | Batch | Latency | p95 | Throughput | Speed-Up | CER |
|---|
| | | | (ms/img) | (ms) | (img/s) | | |
|---|
| reported setting | 4 | 1 | 350.8 | 604.6 | 2.85 | 1.0× | 0.0651 |
| + SDPA encoder | 4 | 1 | 343.7 | 592.4 | 2.91 | 1.0× | 0.0651 |
| + fp16 | 4 | 1 | 187.5 | 299.0 | 5.33 | 1.9× | 0.0648 |
| + greedy decoding | 1 | 1 | 151.0 | 246.7 | 6.62 | 2.3× | 0.0644 |
| + batch 4 | 1 | 4 | 58.1 | 84.7 | 17.22 | 6.0× | 0.0644 |
| + batch 8 | 1 | 8 | 44.8 | 62.4 | 22.32 | 7.8× | 0.0644 |
| + batch 16 | 1 | 16 | 70.1 | 105.0 | 14.27 | 5.0× | 0.0644 |
| + batch 32 | 1 | 32 | 81.7 | 95.8 | 12.24 | 4.3× | 0.0644 |
| beam 4, batch 16 | 4 | 16 | 204.4 | 279.0 | 4.89 | 1.7× | 0.0651 |
Table 22.
End-to-end character error rate on the 19 real pages under controlled degradation of the page image, applied before detection. Severity 1 is the strongest setting of each operator; the undegraded benchmark scores 0.0257. Ground truth is unchanged throughout, so the rows isolate image quality.
Table 22.
End-to-end character error rate on the 19 real pages under controlled degradation of the page image, applied before detection. Severity 1 is the strongest setting of each operator; the undegraded benchmark scores 0.0257. Ground truth is unchanged throughout, so the rows isolate image quality.
| Degradation | Range at Severity 1 | 0.3 | 0.6 | 1 |
|---|
| Gaussian blur | radius px | 0.0351 | 0.0516 | 0.1289 |
| Downscaling | scale | 0.0256 | 0.0308 | 0.0716 |
| Contrast reduction | | 0.0264 | 0.0309 | 0.0332 |
| JPEG compression | quality | 0.0257 | 0.0266 | 0.0316 |
| Additive noise | levels | 0.0279 | 0.0294 | 0.0305 |
| Skew (rotation) | | 0.0253 | 0.0238 | 0.0264 |
Table 23.
Cross-domain probe. The proposed recognizer is applied to Kurdish handwriting with no adaptation of any kind, on 2000 line images drawn from 1000 sentence sets of KHLD [
24]. The last two rows are figures reported by their own authors on their own handwriting corpora and are given only to indicate the scale a model trained for the task reaches; they are not measured here and are not directly comparable, since no shared Kurdish handwriting benchmark exists.
Table 23.
Cross-domain probe. The proposed recognizer is applied to Kurdish handwriting with no adaptation of any kind, on 2000 line images drawn from 1000 sentence sets of KHLD [
24]. The last two rows are figures reported by their own authors on their own handwriting corpora and are given only to indicate the scale a model trained for the task reaches; they are not measured here and are not directly comparable, since no shared Kurdish handwriting benchmark exists.
| System | Trained on | Evaluated on | CER | WER |
|---|
| Proposed | printed (synthetic) | printed real scans, 19 pages | 0.0257 | 0.1513 |
| Proposed | printed (synthetic) | KHLD handwriting, zero-shot | 0.3117
| 0.8844 |
| In-domain handwriting systems, as reported by their authors |
| ResNet–ViT [26] | Kurdish handwriting | DASNUS | 0.0347 | 0.1737 |
| DenseNet121–Transf. [27] | Kurdish handwriting | own corpus | 0.0593 | n/a |
Table 24.
Detection error separated from recognition error on the 19-page real-scan benchmark. Detected lines are aligned to the ground-truth lines and only matched pairs are scored for the recognition-only row, so the difference between the rows is what the line-detection and cropping stage costs. Values are page means.
Table 24.
Detection error separated from recognition error on the 19-page real-scan benchmark. Detected lines are aligned to the ground-truth lines and only matched pairs are scored for the recognition-only row, so the difference between the rows is what the line-detection and cropping stage costs. Values are page means.
| Measurement | CER | WER |
|---|
| End-to-end (detection + recognition) | 0.0257 | 0.1513 |
| Recognition only (matched lines) | 0.0255 | 0.1474 |
| Detection share of the character error: 0.7% |
| Ground-truth lines 467; matched 467; missed 0; spurious 13 |