Several limitations bound the scope of these conclusions and should guide their interpretation. The most consequential is the severe class imbalance documented in
Table 2: with only 39 critical and 154 loaded intervals across six hours, the statistics governing the rarest and most operationally important states rest on a small number of observations, and the held-out test partition contains correspondingly few positive events. Aggregate regression metrics such as
are dominated by the abundant stable intervals and can therefore present an optimistic picture of behavior during the rare events that matter most; the per-state error analysis and the recall-oriented framing of
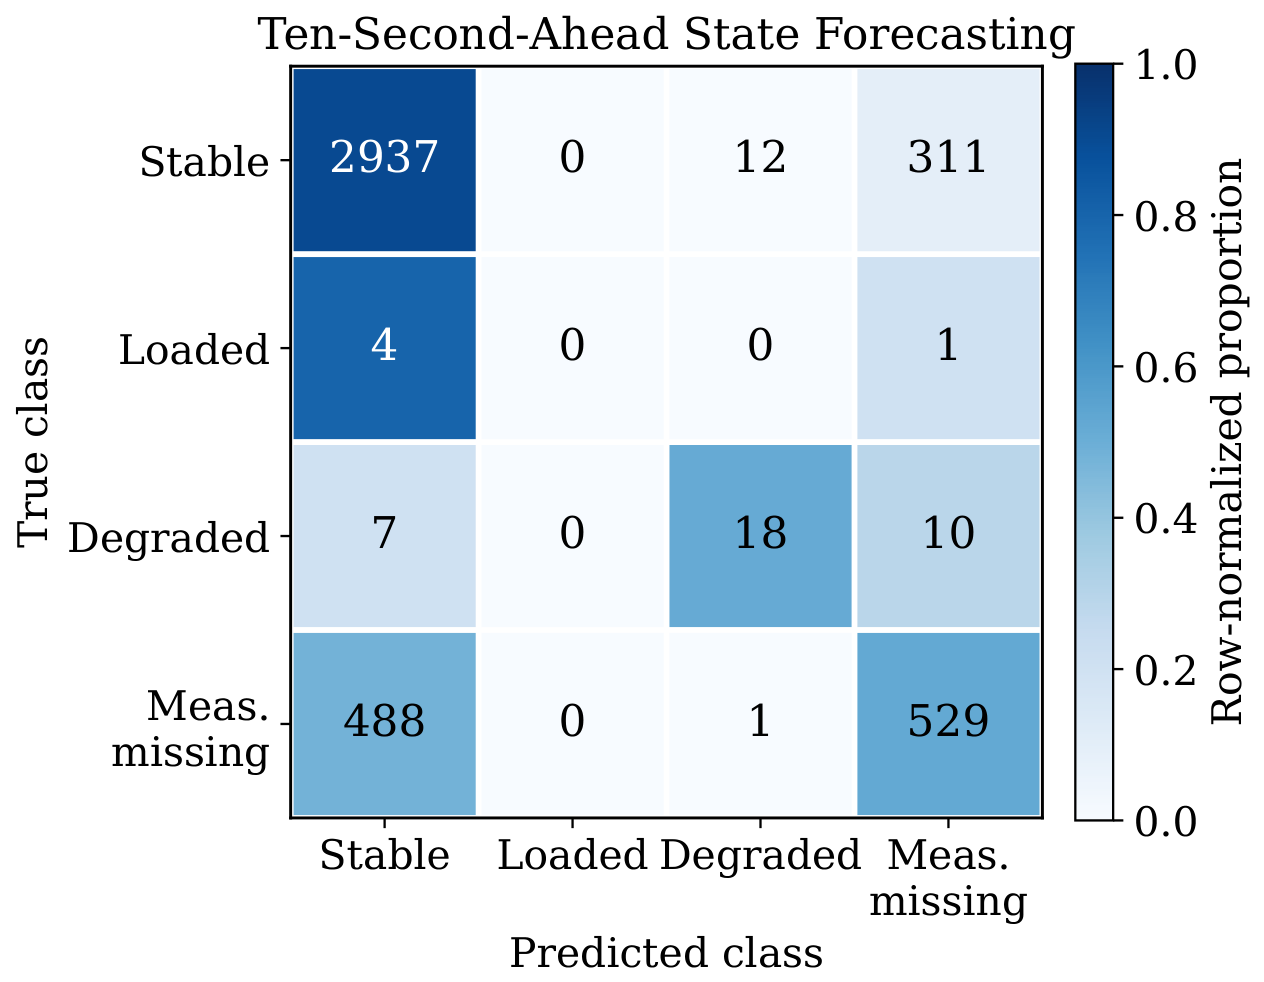
Section 4 partially mitigate, but do not eliminate, this concern. A related limitation concerns the measurement_missing state discussed in
Section 3: although a transition into this state can precede breakdown,
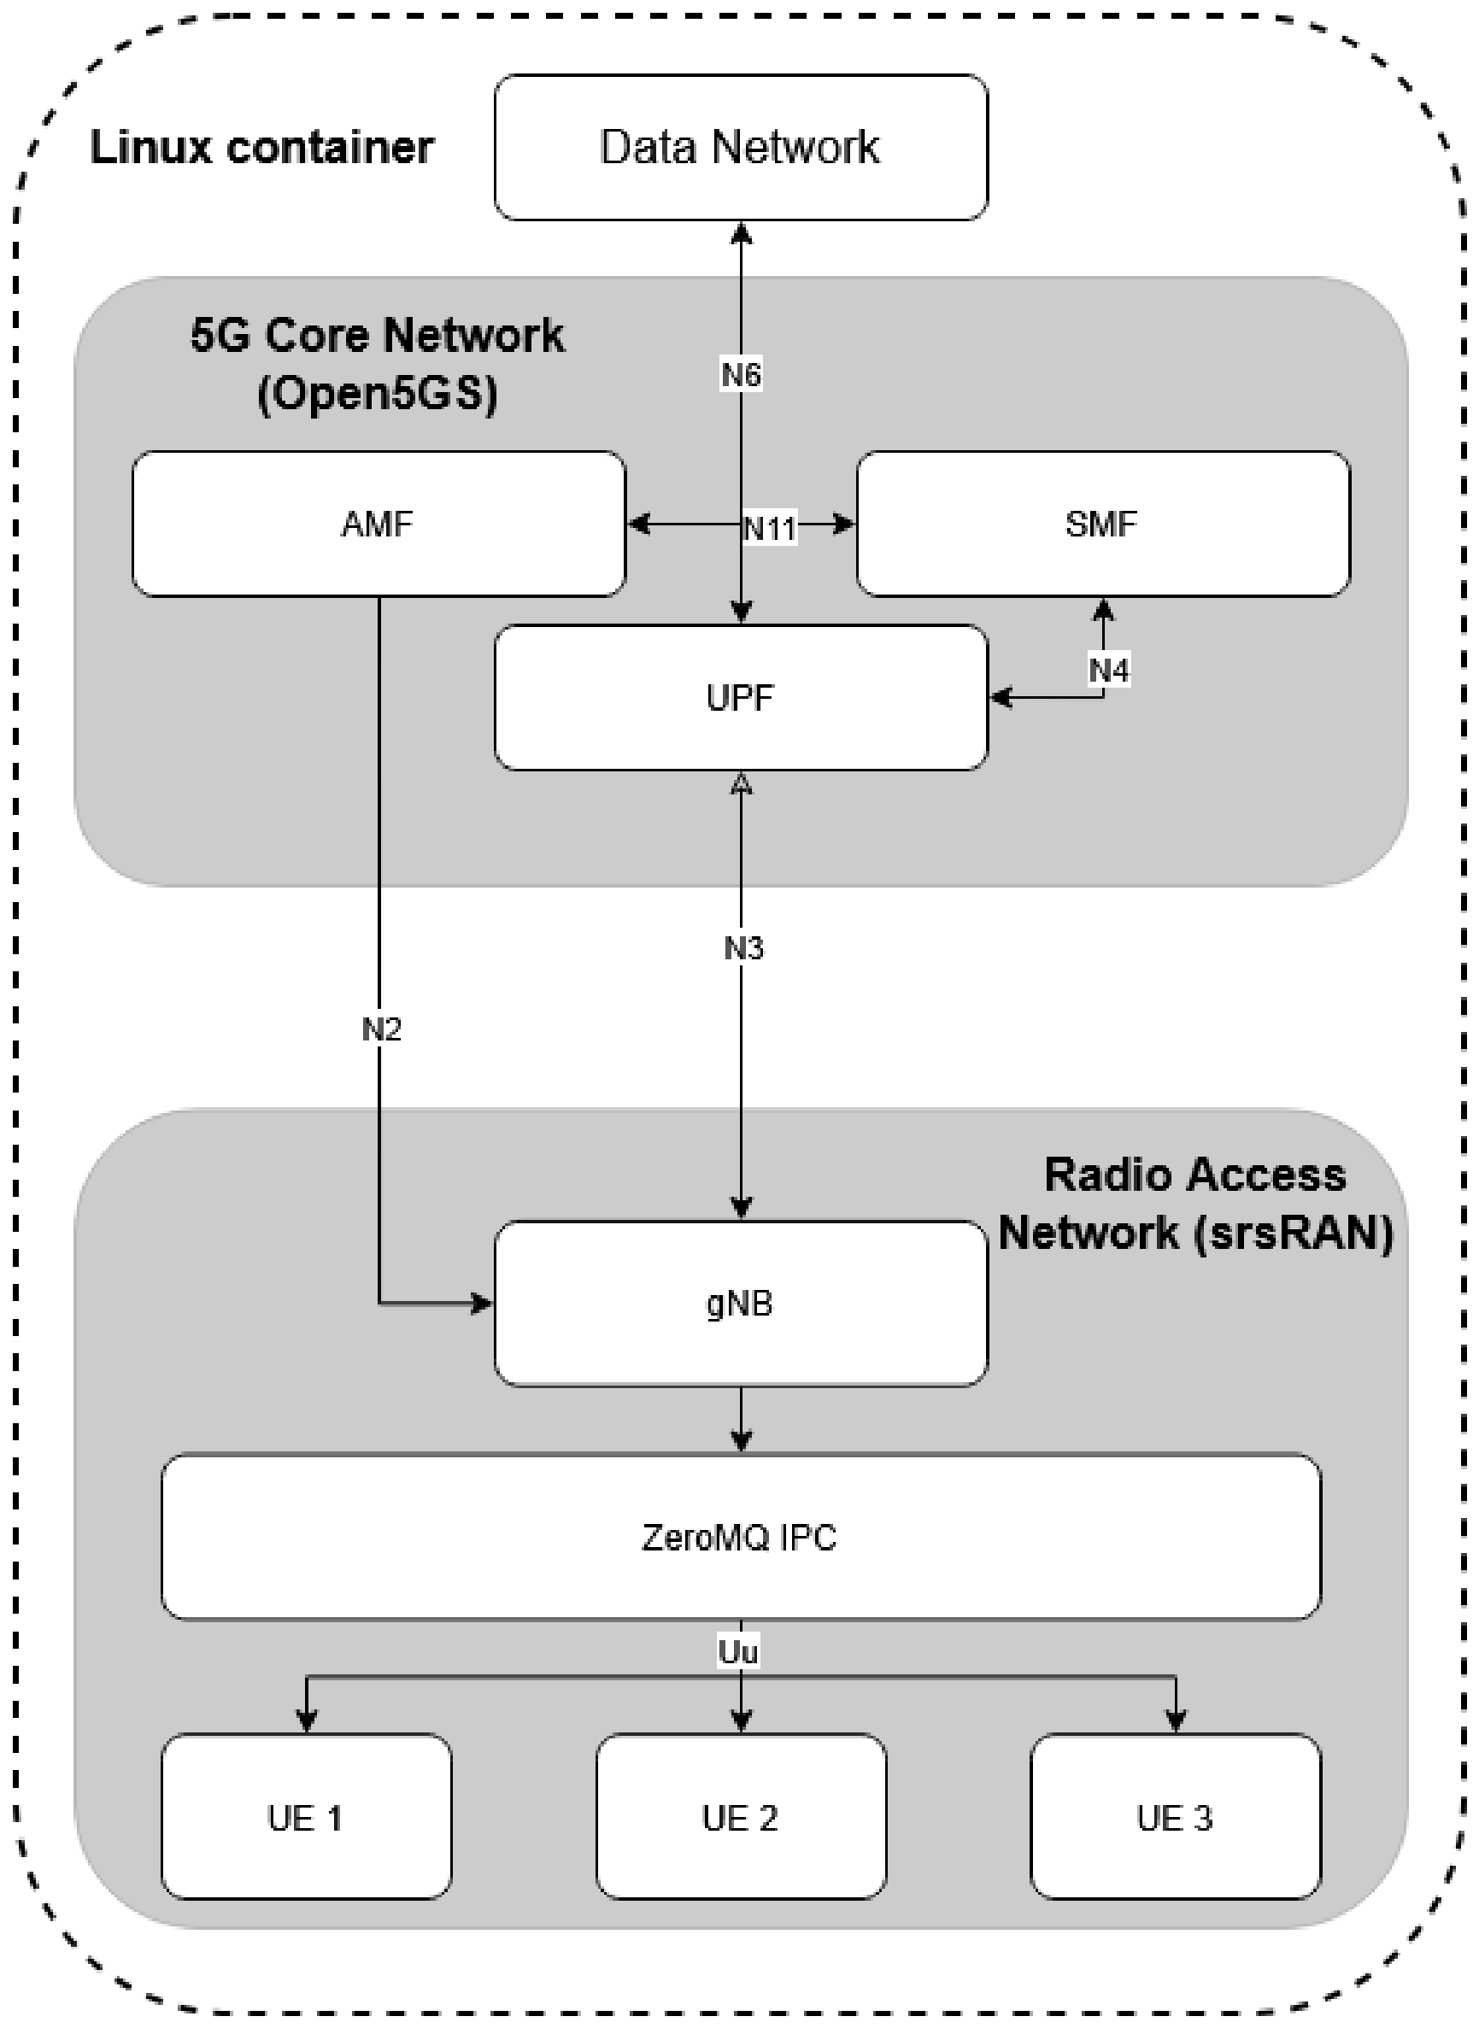
Table 9 shows that 488 of 1018 measurement_missing intervals (approximately 48%) were misclassified as Stable at the ten-second horizon. This indicates that the predictive signal carried by this state is considerably noisier than a simple narrative of ‘imminent breakdown’ would suggest, and any operational trigger built on this signal alone would need to account for a near-even chance of missing the transition entirely. A second limitation is the emulation of the physical layer through ZeroMQ. This abstraction is a deliberate methodological strength for isolating transport dynamics, but it necessarily omits the fading, interference, and mobility-driven handover effects of an over-the-air deployment, so the absolute latency magnitudes and the predictability boundary reported here are specific to the software stack rather than to a fielded network. Third, the experiments were conducted on a single-cell topology with at most three User Equipment instances; the queuing interactions of densely loaded, many-user, multi-cell deployments may exhibit qualitatively different dynamics. Fourth, the deep-sequence results were obtained from a specific training run, and—given the stochastic initialization of neural networks and the limited number of adverse events—their point estimates carry non-trivial variance. To quantify this variance across the full model set, we repeated training across five random seeds (0–4) for every evaluated model family. RandomForest and ExtraTrees are highly stable (
standard deviation
at every horizon), and the deep-sequence models show comparable stability at the one-second horizon (
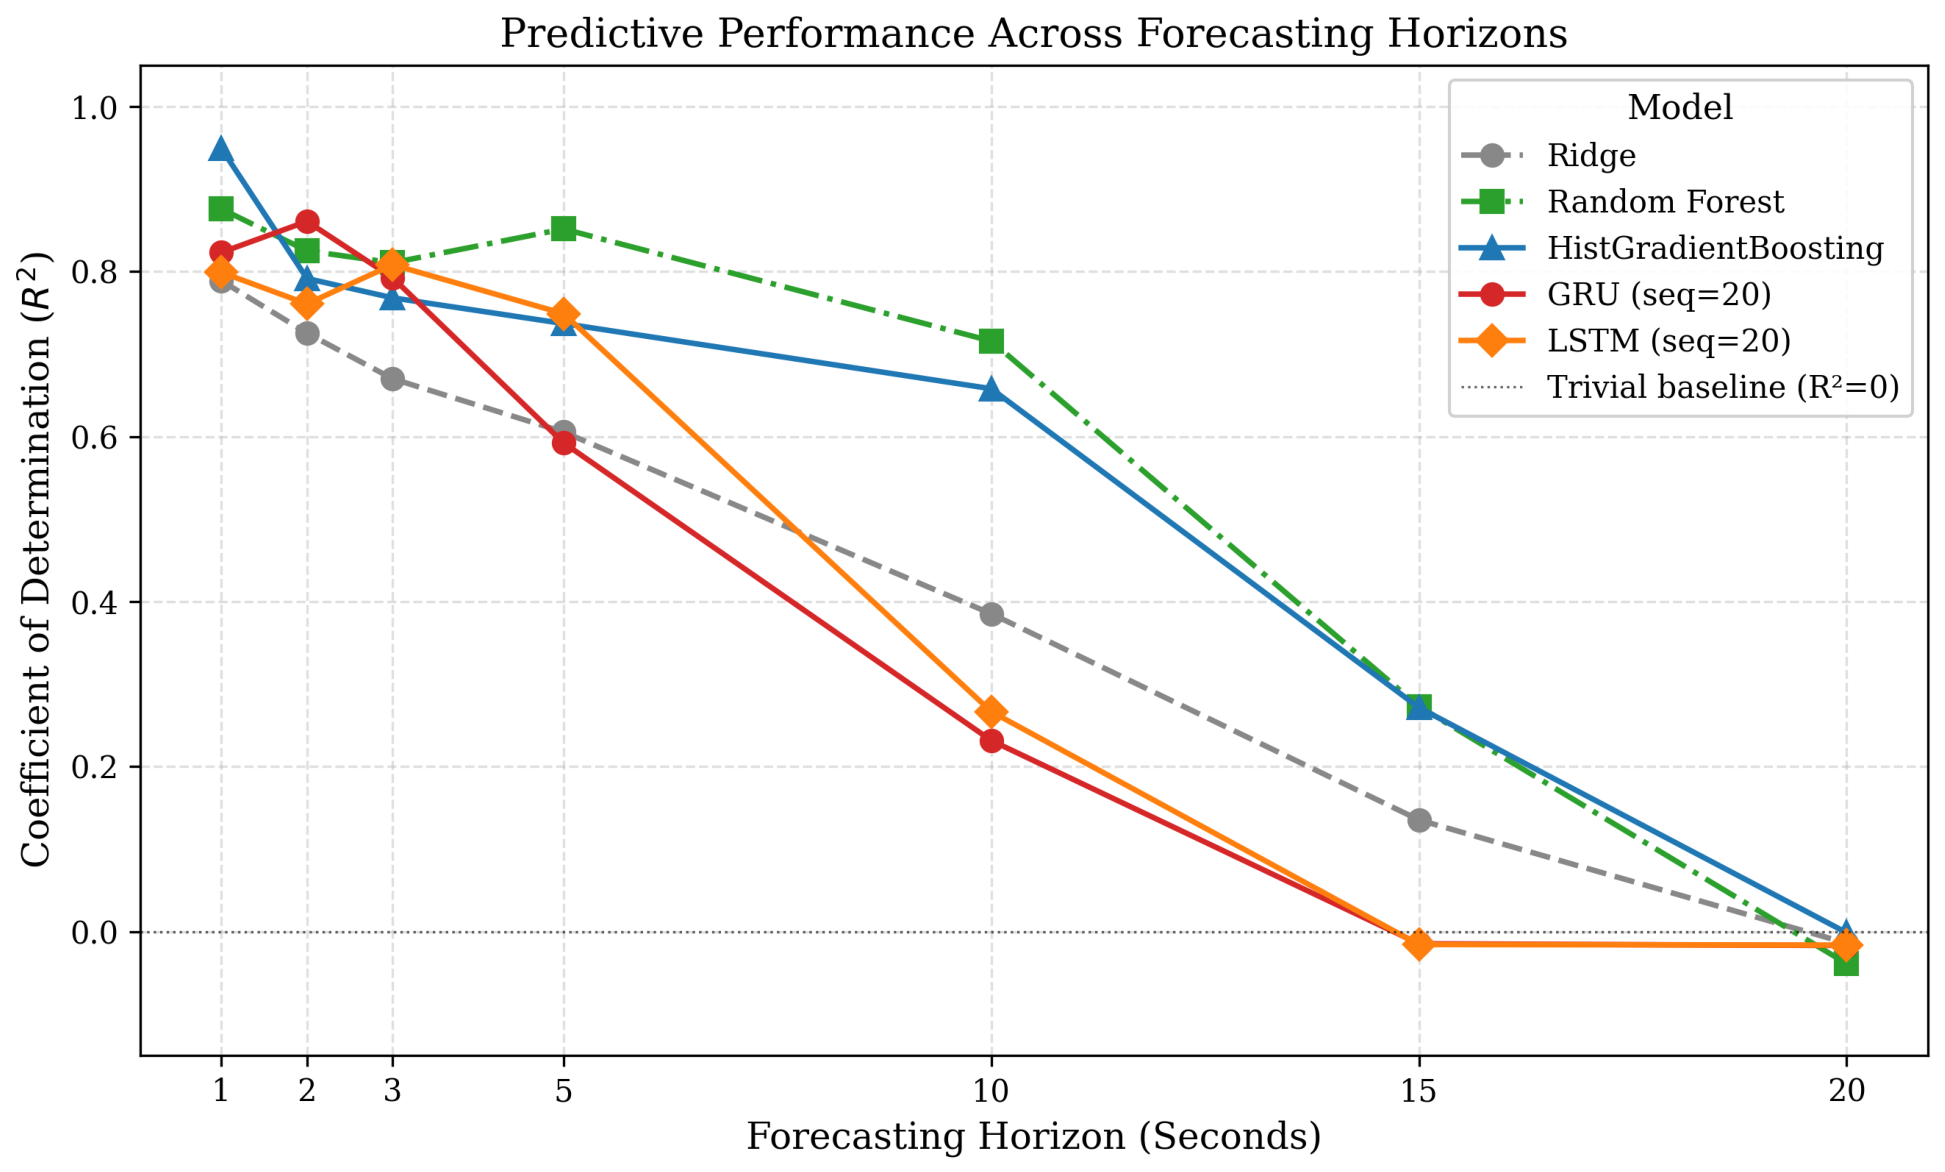
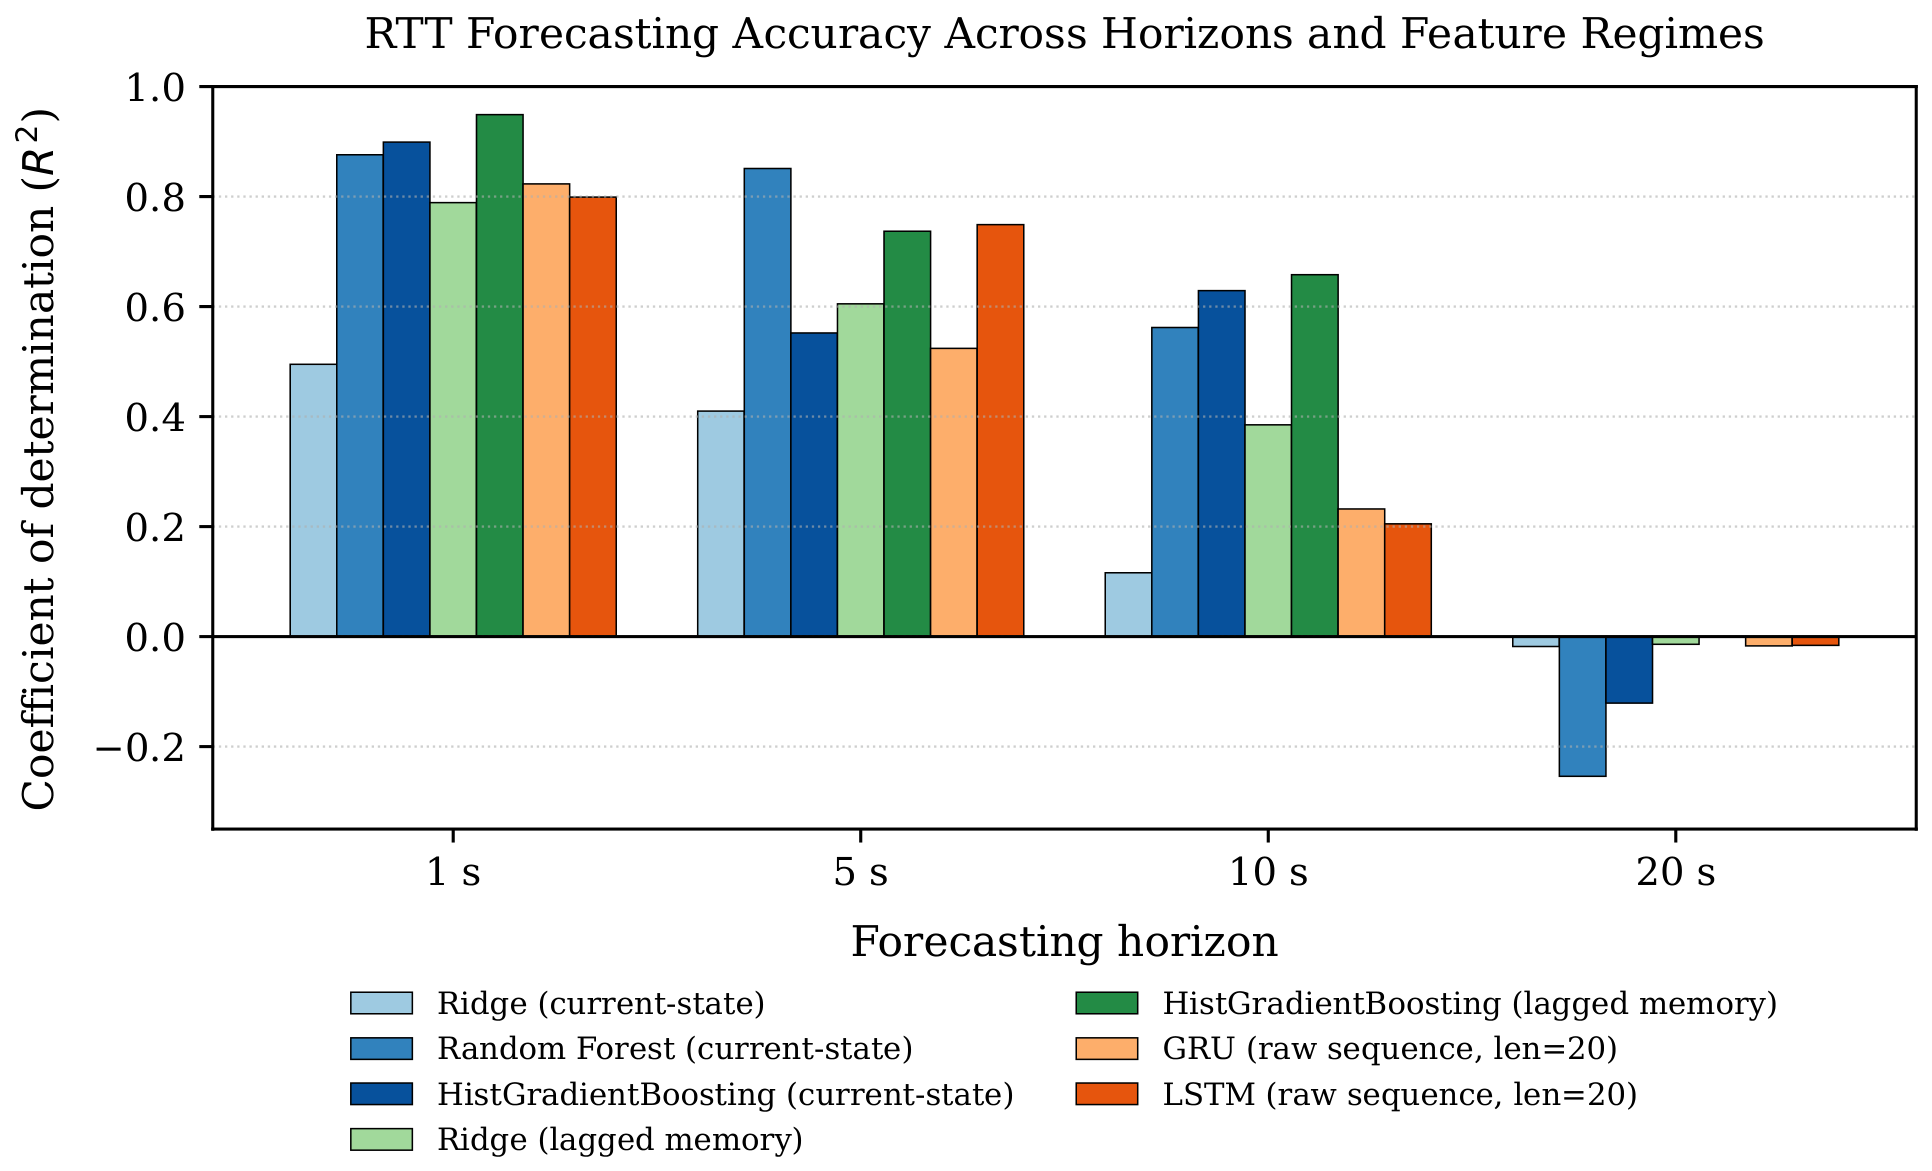
= 0.037–0.046). Reliability degrades markedly at the mid-range horizons: GRU’s
at 5 s ranges from 0.433 to 0.673 across seeds (
= 0.097), CNN-GRU’s
at 10 s ranges from
to 0.347 (
= 0.179), and HistGradientBoosting shows a comparable spread at 5 s (
= 0.113, range 0.512–0.828). At these horizons, a single unfavorable seed would report a model that fails to beat the naive persistence baseline, while a favorable seed would report a moderately useful predictor. At the twenty-second horizon, by contrast, every model—tabular and deep alike—converges tightly to the trivial baseline regardless of seed (
), corroborating the intrinsic predictability boundary reported in
Section 4.3 with high confidence. Single-seed point estimates at the five- and ten-second horizons should therefore be read as indicative rather than precise, and the model ranking at these horizons carries meaningfully more uncertainty than at 1 s or 20 s. A further limitation is that this study validates predictive accuracy in isolation: we do not close the loop by triggering an actual mitigation action (e.g., traffic shaping or resource reallocation) upon a positive alert and measuring its effect on realized latency, packet loss, throughput, or service continuity. The reported precision/recall figures therefore quantify detection quality, not the downstream operational benefit of acting on these predictions, which would require a live or hardware-in-the-loop control experiment and is left to future work. Fifth, this study evaluates predictive accuracy in isolation and does not close the loop: no experiment demonstrates that acting on the model’s predictions—triggering pre-emptive traffic shaping, resource reallocation, or admission control—measurably improves the downstream latency, packet loss, throughput, or service continuity actually experienced by users. The regression and classification results establish that a usable signal exists at short horizons, but translating a correct early-warning trigger into a measured quality-of-service improvement depends on the responsiveness of the orchestration layer that consumes it, which lies outside the scope of the present testbed. Demonstrating this closed-loop benefit is a necessary next step before the system’s operational value can be considered established, rather than merely its predictive value. Sixth, the precision and recall reported in
Table 7 are point estimates computed on a single held-out partition containing only 40 positive events; no bootstrap or repeated-resampling confidence intervals are reported for these classification metrics, so their sampling variability—likely substantial given the small positive class—remains unquantified, unlike the seed-repeated confidence intervals reported above for the regression results. Seventh, the model comparison in
Table 6 is not fully balanced across feature regimes: Random Forest and Extra-Trees were evaluated only in the current-state regime, while the lagged-memory regime was evaluated only for Ridge and HistGradientBoosting. This asymmetry means the present results cannot establish whether Random Forest or Extra-Trees would gain further accuracy from explicit lag features, and the apparent strength of HistGradientBoosting under lagged memory should be read as provisional until the omitted model–regime combinations are evaluated.




 ,
,