Systematic Review

The Evolution of Data Envelopment Analysis Models for Circular Economy Performance Assessment

by
Andrey V. Lychev
1,* and
Svetlana V. Ratner
2
1
College of Computer Sciences, National University of Science and Technology “MISIS”, 4 Leninsky Ave., Bldg. 1, 119049 Moscow, Russia
2
Laboratory for Scientometric Analysis and International Rankings, Armenian State University of Economics, 128 Nalbandyan St., Yerevan 0025, Armenia
*
Author to whom correspondence should be addressed.
Algorithms 2026, 19(7), 585; https://doi.org/10.3390/a19070585
Submission received: 3 June 2026 / Revised: 4 July 2026 / Accepted: 13 July 2026 / Published: 16 July 2026
(This article belongs to the Special Issue Data Envelopment Analysis for Decision Support)

Abstract

Data Envelopment Analysis (DEA) has emerged as a major non-parametric technique for measuring efficiency in sustainability and environmental economics because it can handle multiple inputs and outputs without making explicit functional assumptions. DEA allows the simultaneous consideration of economic performance, resource utilization, environmental impacts, and recycling results in the evaluation of the circular economy (CE). This review investigates the evolution of DEA models in the last years and the variables used to measure the CE performance. We analyze 209 peer-reviewed articles to systematically explore the evolution of DEA applications from conventional single-stage efficiency models to advanced network-based structures that better reflect the intricacy of circular systems. The review discusses the most advanced DEA approaches to date in the literature on CE assessment and uncovers specific factors that affect the choice of models in empirical studies. Finally, it points to promising directions of future research by showing interest in the development of comprehensive DEA models adapted to the specificity of the CE systems.
MSC:
91B74; 90B30; 90C05
JEL Classification:
Q53; Q58; C61; C67

1. Introduction

The transition from a linear economic model based on the logic of “take–make–dispose” toward a circular economy (CE) has become one of the central priorities of sustainable development policy worldwide [1,2]. The  objective of a CE is to reduce the use of resources, the production of waste, and the length of product lifecycles and to stimulate the regeneration of materials and flows of energy in the systems of production and consumption [3]. CE is different from traditional environmental management methods that are primarily aimed at pollution control. This approach focuses on redesigning economic systems for long-term sustainability through the circulation of resources in closed loops [1].
A major methodological challenge remains the measurement of the performance and efficiency of CE systems [4,5]. CE processes are inherently multidimensional, with economic outputs, environmental externalities, waste management and recycling processes, and feedback mechanisms between stages of production and regeneration. Such complex interdependencies are often not represented in conventional performance indicators, particularly where undesirable outputs (emissions, waste) co-exist with desirable outputs (production value, recycled materials).
Data Envelopment Analysis (DEA) has emerged as a major non-parametric technique for measuring efficiency in sustainability and environmental economics because it can handle multiple inputs and outputs without making explicit functional assumptions. The DEA allows for the simultaneous consideration of economic performance, resource use, environmental burden, and recovery in the assessment of the circular economy [6]. Early DEA studies mainly used traditional single-stage models such as CCR and BCC. Later the research is extended to include Slack-Based Measure (SBM), Directional Distance Function (DDF), super-efficiency, cross-efficiency assessment, undesirable output incorporation, and fuzzy DEA models.
However, CE systems are fundamentally networked processes rather than simple “black-box” production units. Waste generated during production becomes an input for recycling, treatment, and resource recovery processes, while recycled outputs may return to production systems as feedback inputs. This internal structure cannot be fully represented by conventional DEA models. As a result, network DEA models—particularly two-stage, dynamic, and advanced multi-stage structures—have gained increasing attention in recent years as more appropriate tools for CE efficiency evaluation.
This paper continues the authors’ previous research on DEA applications in CE assessment presented in [7]. While our initial study demonstrated that conventional single-stage DEA models suffer from severe empirical blindness—heavily over-representing low-value, end-of-life processes (R8—Recycle; R9—Recover) failing to reflect the higher, preventative rungs of the circular hierarchy (such as R0—Refuse; R1—Rethink; R3—Reuse), the current study specifically pivots to advanced DEA structures. The emphasis of the current study is to systematically examine whether network, multi-stage, and dynamic DEA models can break through these “black-box” limitations. By focusing on model evolution and variable selection, we evaluate if these complicated architectures can more accurately capture the internal feedback loops, material recirculation, and value retention inherent to true circular systems.
The study addresses two main research questions.
RQ1: Which DEA models currently represent the state-of-the-art approaches for CE assessment?
RQ2: Which factors influence the selection of DEA models in empirical CE studies?
The aim of this paper is to identify the current methodological trends, reveal existing limitations, and outline promising directions for future research by reviewing the evolution of DEA models applied to CE systems. Special attention is paid to the potential of network DEA models for enhancing the realism and policy relevance of CE performance assessment.
The paper is organized as follows. Section 1 introduces the problem and formulates research questions. Section 2 describes the research methodology based on a systematic literature analysis using the PRISMA protocol. Section 3 analyzes the data sources and variables that are used in DEA models for CE performance assessment. Section 4 is devoted to an overview of existing DEA models, with a focus on network models that have recently gained popularity. Section 5 provides the discussion and explores future research directions. The Section 6 concludes.

2. Materials and Methods

To investigate the evolution of DEA models for CE assessment we conduct a systematic review based on the PRISMA protocol. It was registered at Open Science Framework and publicly available at https://osf.io/ga9hv (accessed on 6 June 2026). Information sources include two databases, Scopus and Google Scholar, which offers a broad scope of sources. First, a literature search was conducted using certain search query, that correspond to the titles, keywords, or abstracts of the literature. The following search string was used to extract documents from Scopus database:
TITLE-ABS-KEY(“data envelopment analysis” AND “circular economy”)
We did not consider using the short form “DEA” in the search string since it would not affect the number of selected articles for analysis. The requirements for articles in peer-reviewed journals mandate the decoding of all abbreviations, any article that uses the DEA model must include the full form. In cases where “DEA” appears in an article without its expanded form, inspection confirmed that such references occurred in the list of references rather than the main text, and such an article is ineligibile.
The search in Scopus was not constrained by specific document type, language, or  subject area because the retrieved documents were further combined with the Google Scholar database, which lacks such advanced functionality. In  total, a sample of 182 documents was obtained from Scopus on 1 April 2026 with various types of metadata.
Due to the constraints of Google Scholar’s web search engine, the number of results returned for a single search query is limited to a maximum of 1000 records. Therefore, the search was carried out independently for each year. The initial year for the search was chosen as 1990, corresponding to the publication year of the paper [8], where the concept of circularity was first introduced. However, the number of search results for each year from 2022 to 2025 for the query {“data envelopment analysis” “circular economy”} exceeded Google Scholar’s limit. To overcome this situation, the results were obtained in parts by adding a special keyword to the query string, e.g., “economies”, and subsequently excluding it. Thus, the group of search queries of the following type was used:
“data envelopment analysis” “circular economy” “economies”
 and
“data envelopment analysis” “circular economy” -“economies”
Then, the results for the two queries were gathered and joined for further analysis. To extract the metadata of the papers from Google Scholar, we use the “Publish Or Perish” application, version 8.19.5300.9483. Consequently, a total of 9579 records were collected, that cover the period from 1990 to 2026. Papers accepted for publication as of 1 April 2026, but not yet published, were considered for the subsequent analysis as published in 2026.
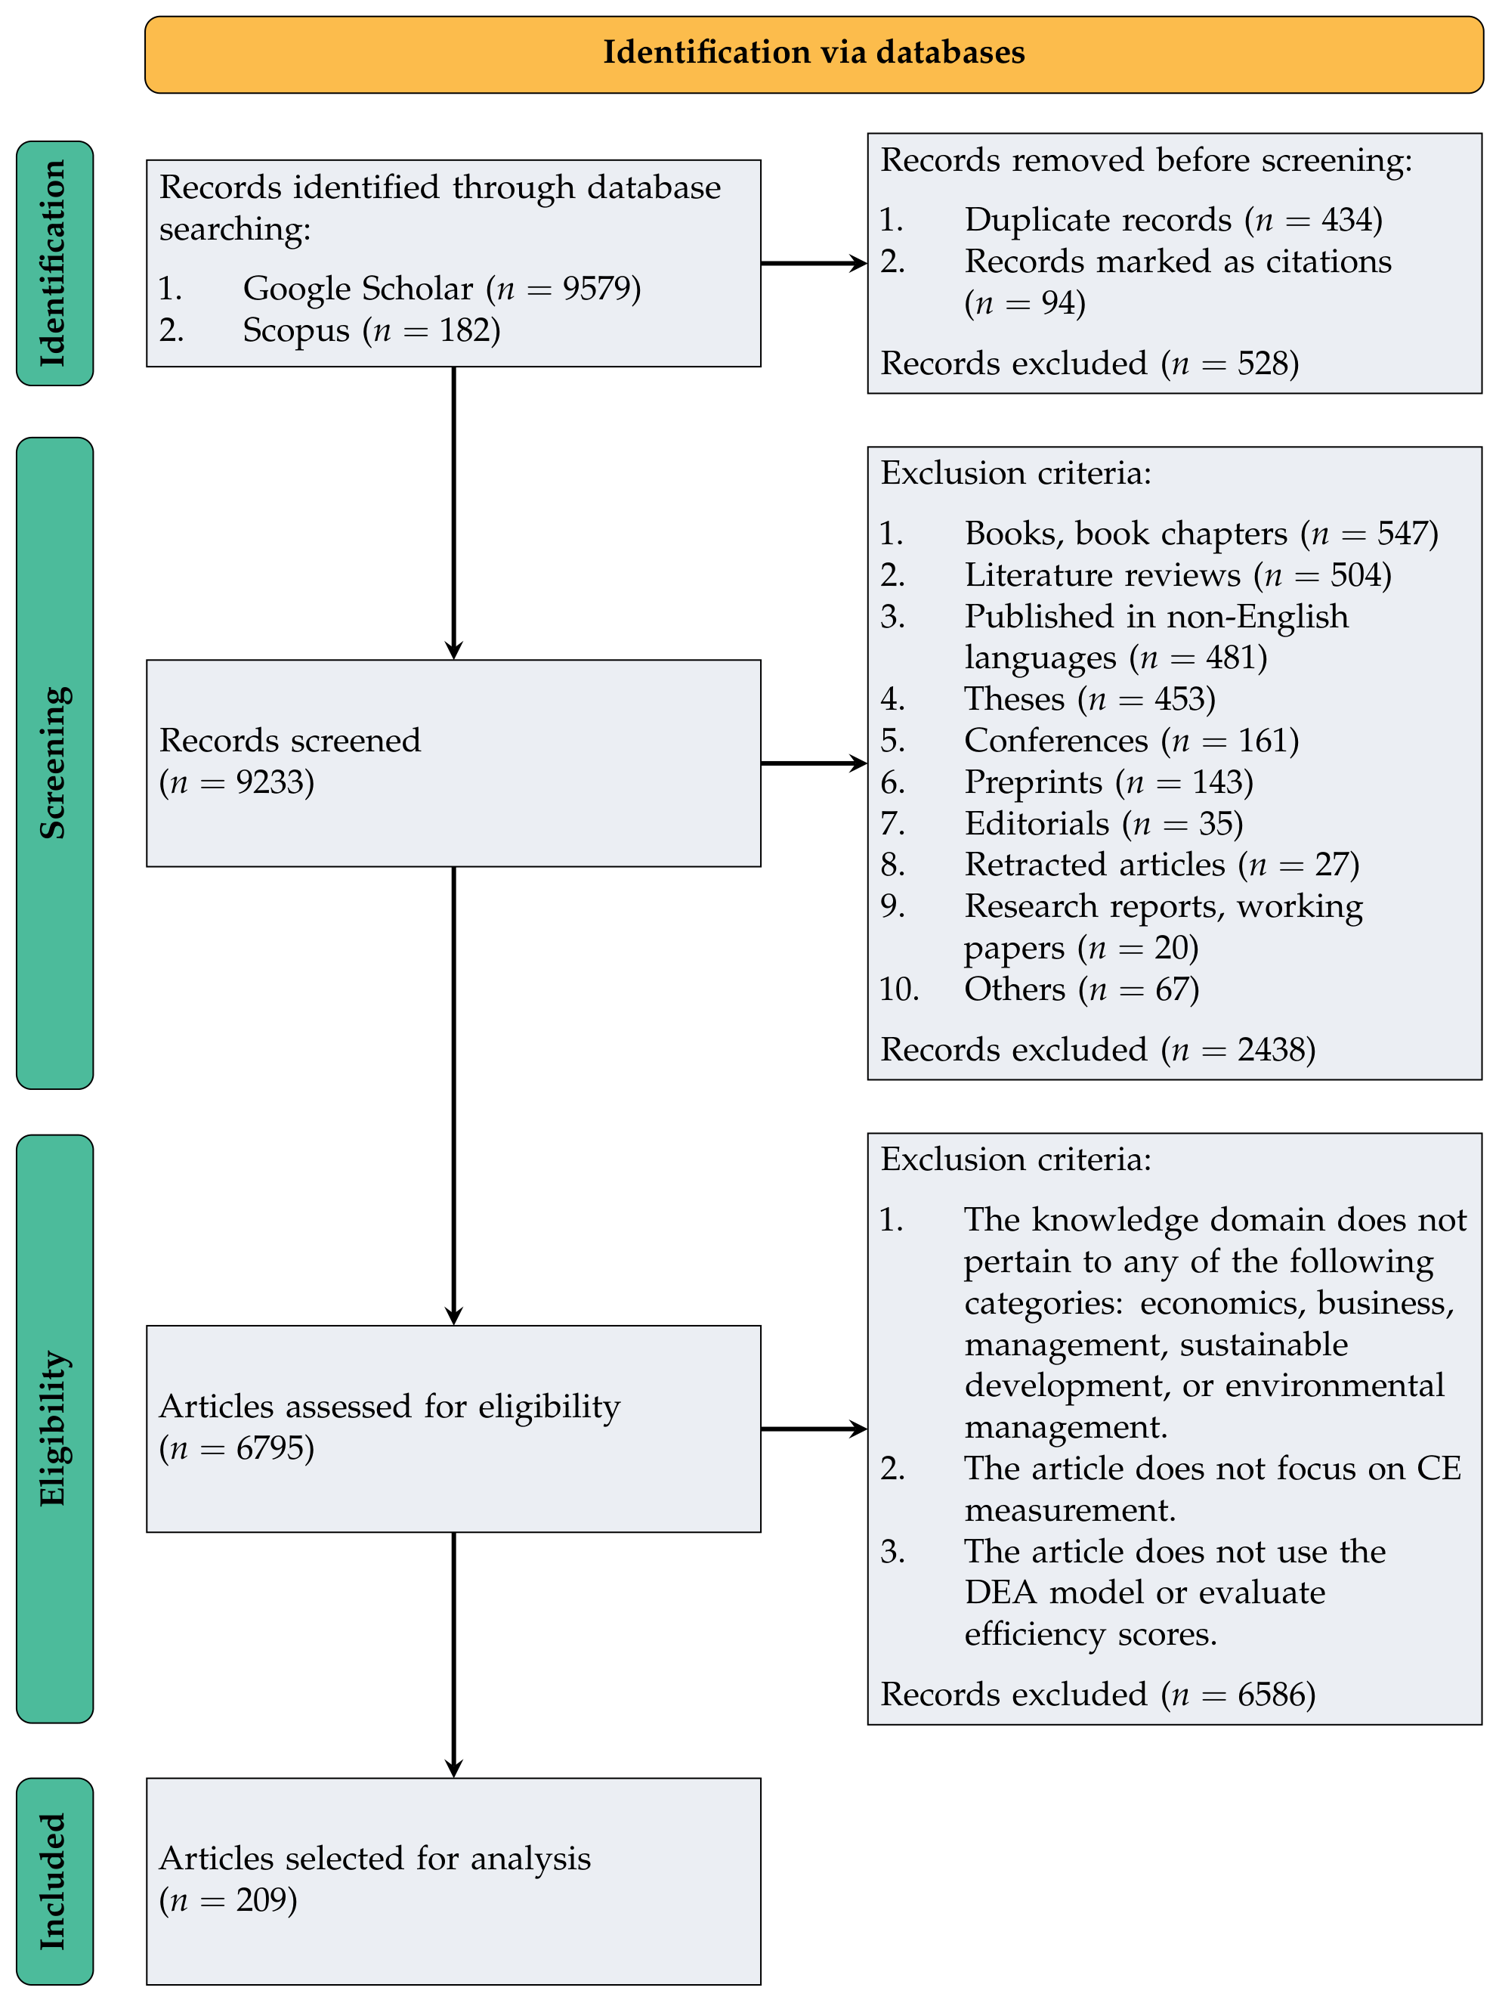
Next, obtained documents were analyzed according to the PRISMA protocol. The corresponding flow diagram of the articles’ selection process is represented in Figure 1.
During the identification stage, documents retrieved from Scopus and Google Scholar were combined and analyzed for duplicates and unreliable sources. Thus, 94 entries marked as citations and 434 duplicate records were removed resulting in 528 records excluded at this stage.
At the screening stage, we include only peer-reviewed journal articles that represent original theoretical and empirical research and are written in English. In accordance with these criteria, 2438 papers were excluded.
At the eligibility assessment stage, the final set of 6795 publications was assessed independently by two researchers, both authors of this study, based on mutual consensus regarding the following criteria:
  • The paper relates to the knowledge domain of economics, business, management, sustainable development, or environmental management.
  • The study focuses on CE measurement.
  • The article uses DEA for CE efficiency evaluation.
To reduce the risk of bias, two researchers applied these criteria independently. This method is considered a best practice for systematic literature reviews [9,10].
In this review, the quality assessment was omitted, as the aim was not to synthesize efficiency scores produced in the studies. Instead, the review systematically extracted variables and DEA model specifications used for efficiency measurement. These features are inherently objective, regardless of the quality of the data or the precision of the efficiency scores. The accuracy of DEA model applications was not assessed since only peer-reviewed journal articles were included, which represent high-quality research.
This process resulted in a total of 209 articles that met the inclusion requirements. From identified papers we systematically extracted variables and DEA model specifications employed for efficiency measurement, which were saved in text files for subsequent analysis. A detailed overview of the selected articles is provided in the Supplementary Materials (Table S1).
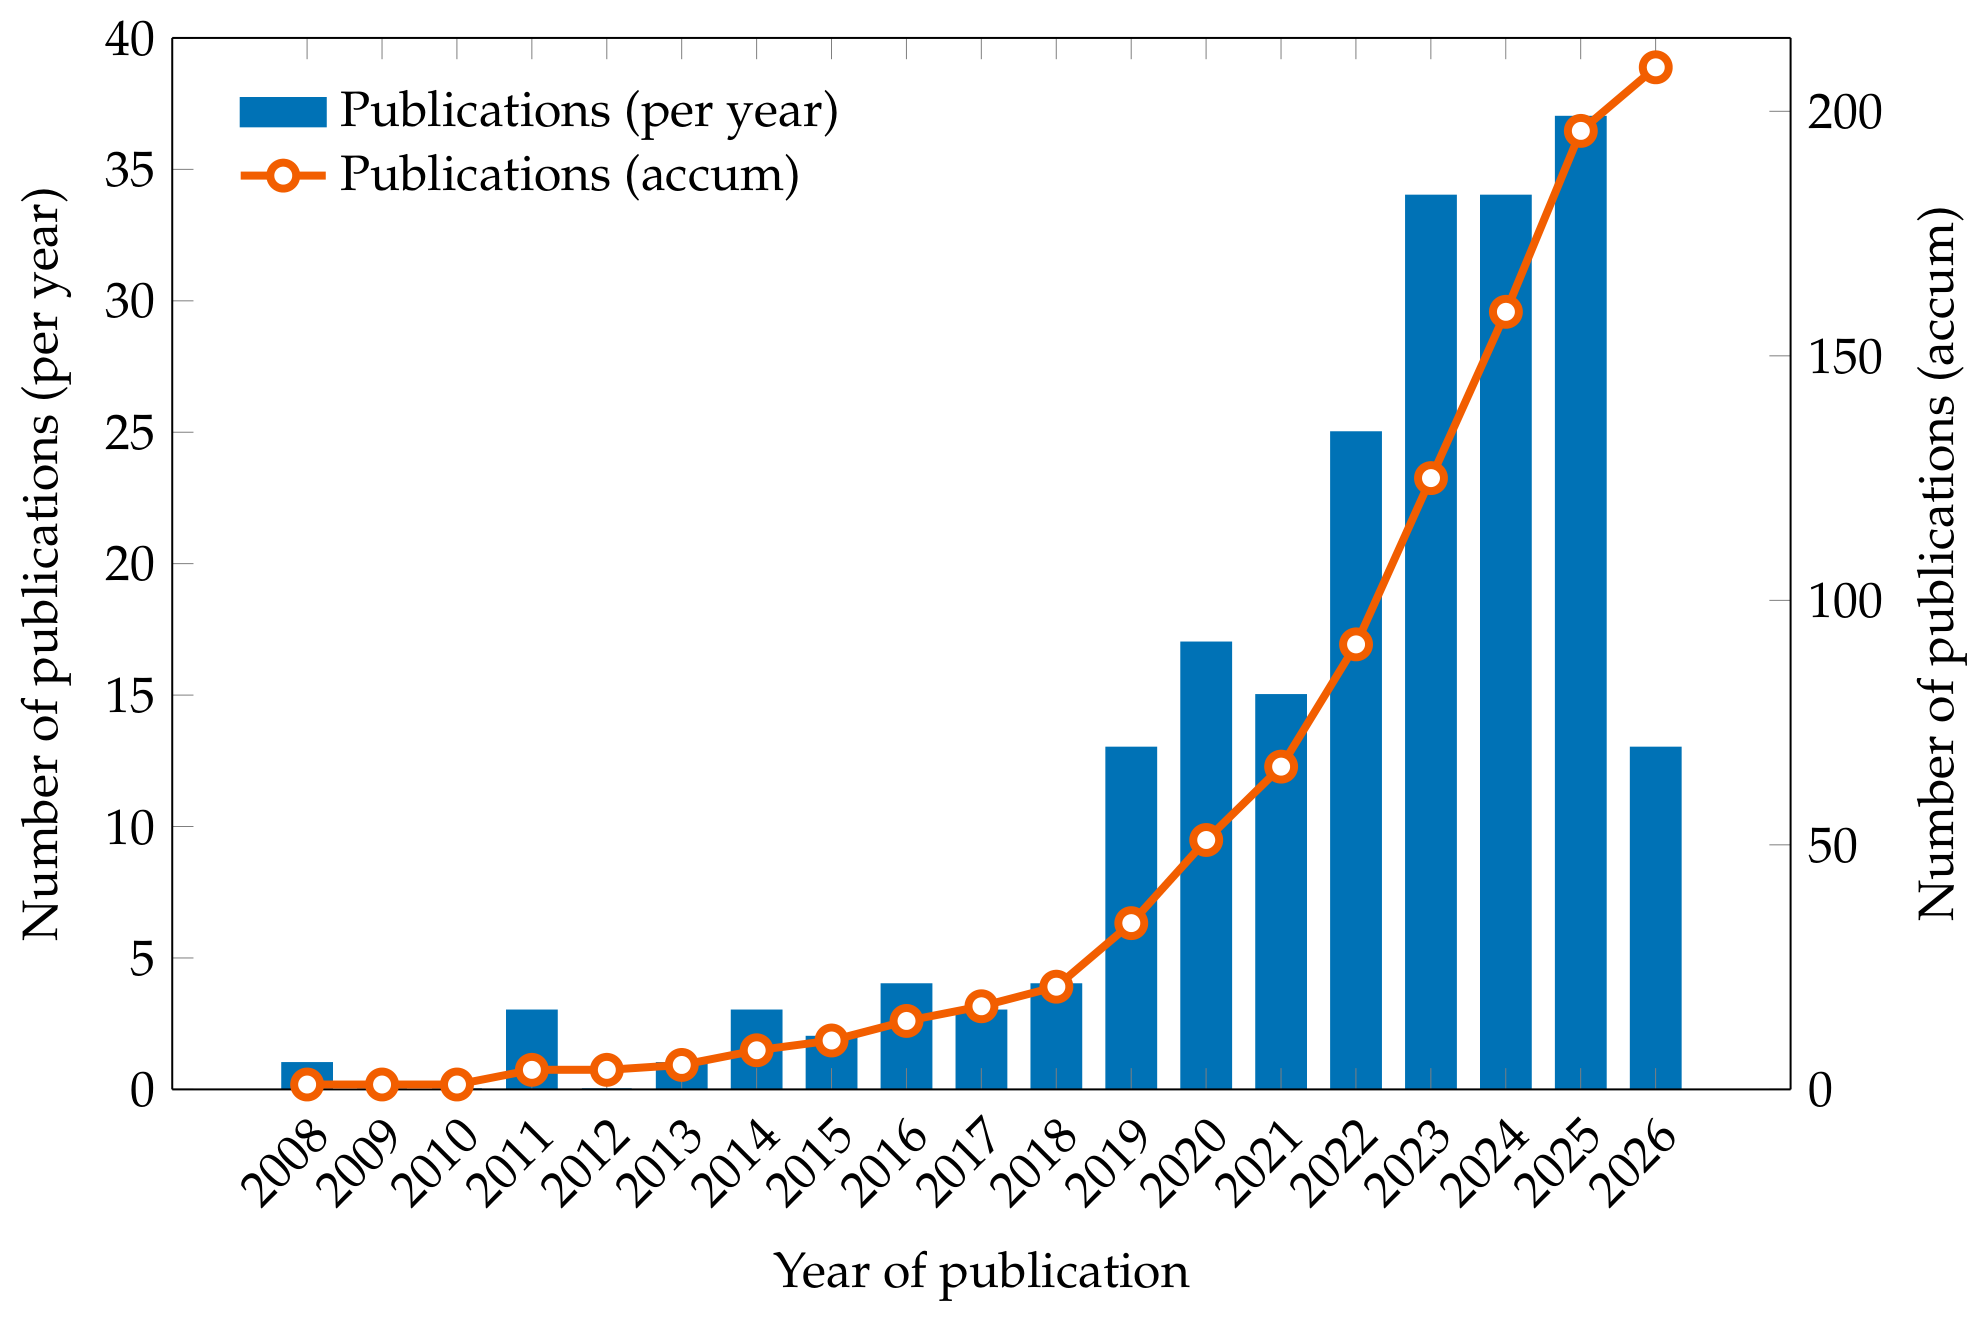
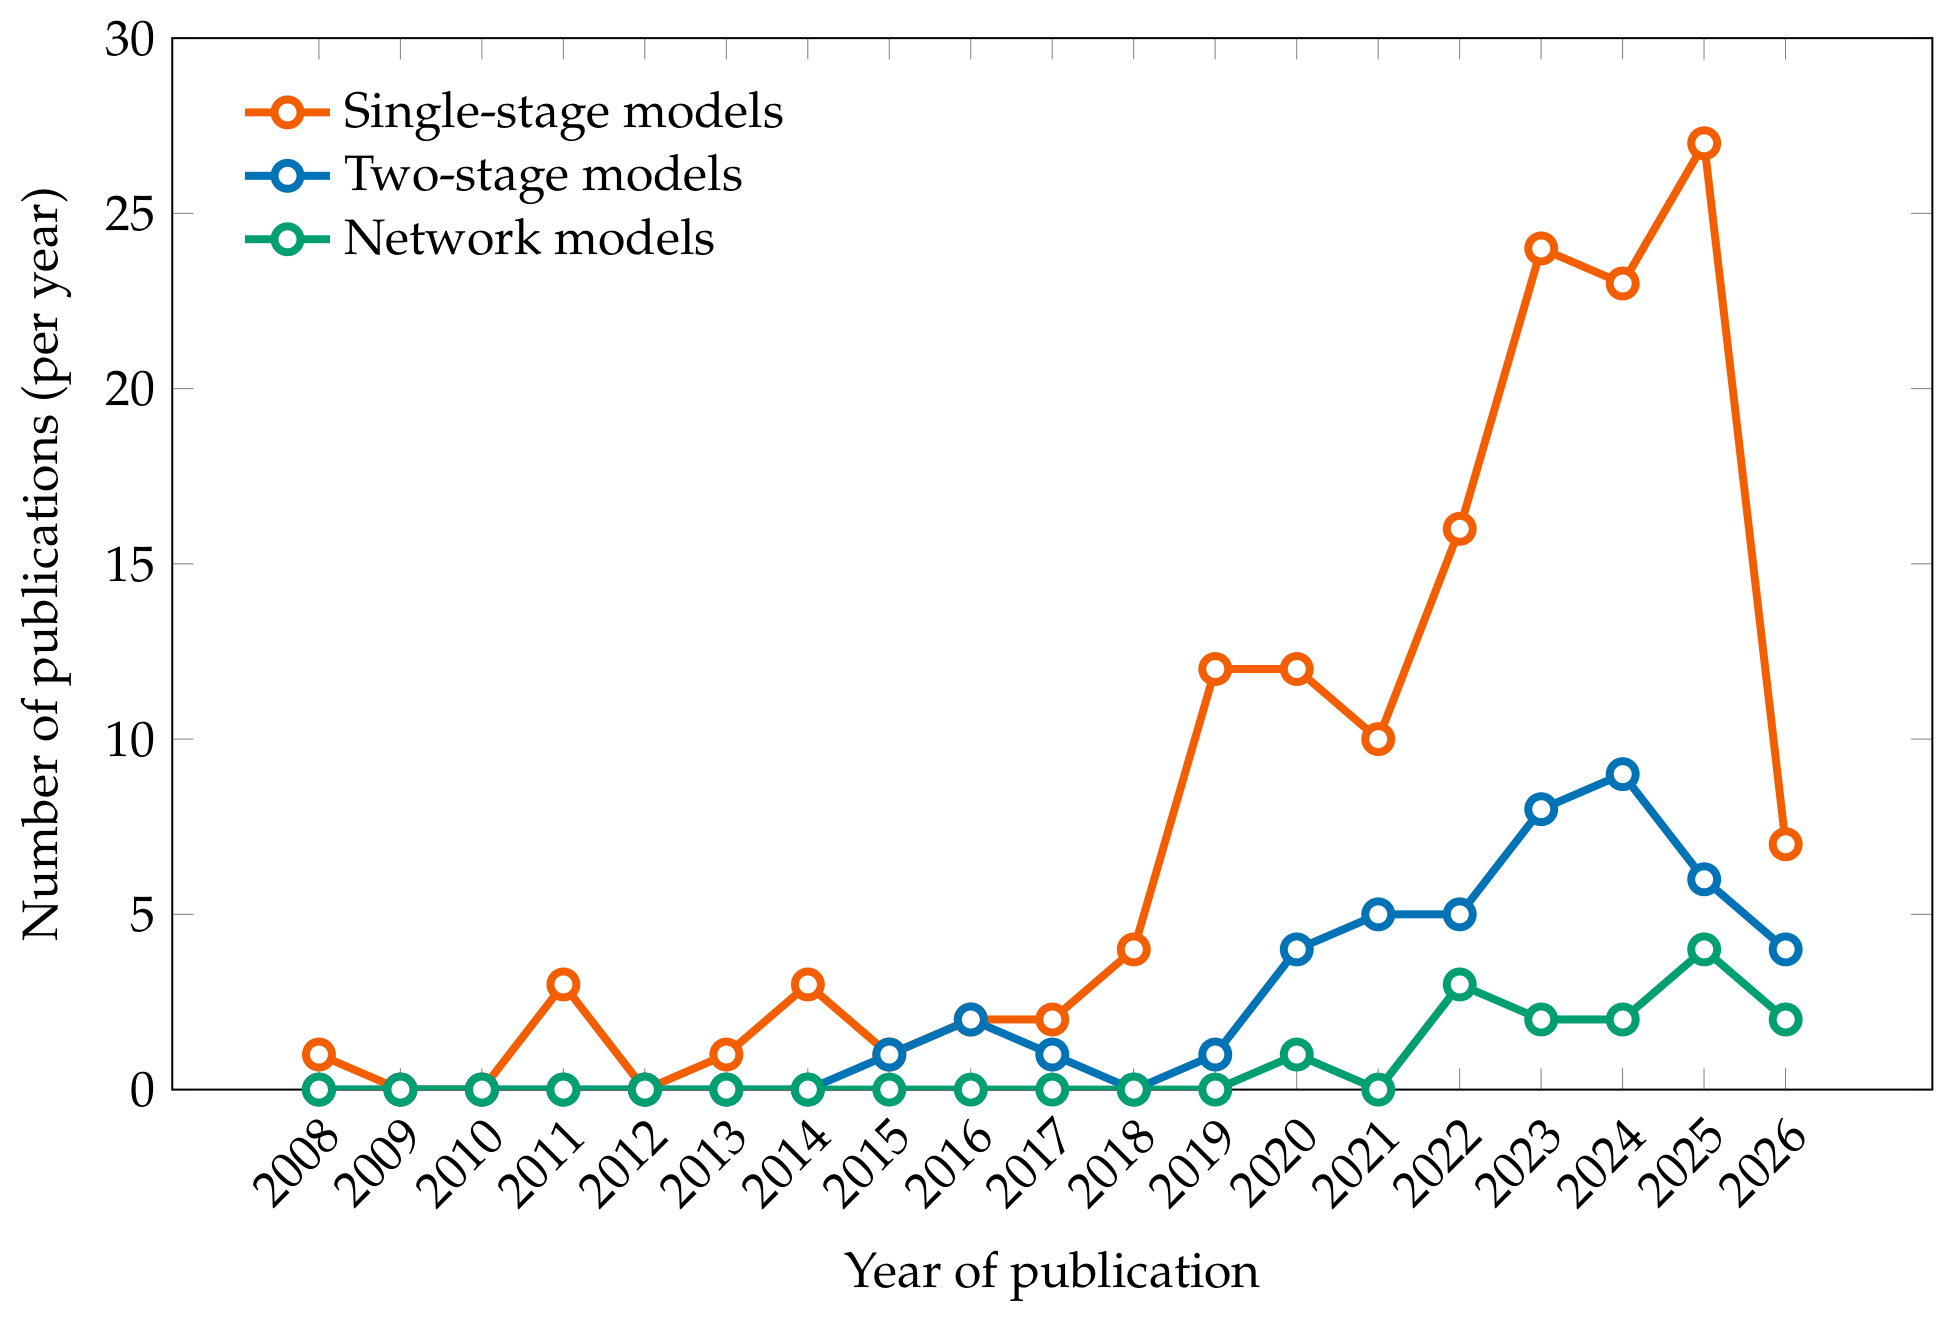
Figure 2 depicts the distribution of publications within the examined period from 2008 to April 2026. The data reveal that the volume of articles remained below five per year until 2018. From 2019 onward, there was a significant upward trend in publication activity, with annual output steadily increasing from 13 articles in 2019 to 37 articles in 2025, the year with the highest number of publications reached. The figures for the first three months of 2026 include articles that were not published but accepted for publication. Based on this number, it is reasonable to expect that the total number of articles on CE assessment using DEA in 2026 will likely surpass those published in 2025.

3. Variable Analysis

3.1. Variables

The analysis of input and output indicators used in the DEA-based evaluation of the CE demonstrates a clear structure determined by data availability and methodological constraints. Inputs and outputs are selected across the reviewed studies in order to represent resource use, economic activity and environmental impacts, but they tend to focus on measurable and standardized variables rather than the full complexity of circular systems.
Input indicators primarily reflect the consumption of resources required to generate economic outputs. The most frequently used inputs include energy consumption, water use, raw material input, and labor or capital investments. In many cases financial indicators such as total investment or operational costs are also included. These inputs are very much aligned with the R2—Reduce strategy, as they measure the efficiency of the use of natural and economic resources. Moreover, some studies consider undesirable outputs (e.g., waste or emissions) as inputs in extended DEA formulations, which further supports the idea that the reduction of the environmental pressure is a core dimension of the circular performance.
Table 1 contains the systematic classification of input variables used in the analyzed corpus of articles with the corresponding frequency analysis. The distribution shows that the most popular input variable is labor and workforce, followed by energy and then the linked categories of capital and infrastructure and investment. Together, these four categories account for approximately 50% of all variables. This result is consistent with the traditional productivity analysis, where labor, capital and energy are used as classical factors of production. The presence of resource and environmental categories characterizes the CE orientation of DEA models. The CE applications often include material and environmental flow variables as inputs to capture resource circularity rather than purely economic production. The lower contribution of the population, demographics, and land area categories indicates that they are often used as scale or context variables in CE efficiency studies at the regional or national level. The others category captures less frequent and study- specific inputs that are not considered to obviously fall into the other groups.
Output indicators can be divided into three main categories: desired economic outputs, circularity-related outputs and undesired outputs. The first desirable outputs are typically GDP, industrial value added or production volume, a measure of the system’s economic performance. Second, circularity-related outputs include indicators such as recycling rates, volume of recycled materials, circular material use rate, and, in some cases, the share of renewable energy. These outputs are mainly associated with the R8—Recycle and R9—Recover strategies, which dominate empirical applications due to their quantifiability. Third, undesirable outputs, such as CO2 emissions, solid waste, wastewater, and pollutants, are explicitly incorporated in many DEA models. These are either minimized directly or transformed within specialized approaches such as SBM or DDF models.
The classification of output variables used in the DEA models within reviewed articles is presented in Table 2. Two top categories (recycling, circular material use, and economic and financial performance) account for approximately 40% of all variables. This concentration displays that existing output indicators of DEA models reveal a considerable concentration of metrics on recovery and efficiency, as well as economic proxies such as GDP, value added, and revenue that persist as dominant. Moreover, in network DEA models, the economic performance measures are used as outputs of the production stage, while circularity measures are employed as outputs of the treatment stage. Resource efficiency, industrial waste utilization, and wastewater treatment form a second group of outputs. Emissions and pollution reduction and waste generation and collection constitute a third band, capturing conventional environmental indicators alongside upstream waste measures. Solid waste treatment and disposal, social and demographic indicators, and energy, renewable energy, each represent under 5% of the total. The smaller shares of other categories indicate that these represent narrow study-specific models in the analyzed corpus.
In DEA, undesirable outputs (also called “bad outputs”) are byproducts of production that are jointly generated with desirable outputs but for which minimization, rather than maximization, is the efficiency objective. The exclusion of undesirable outputs biases efficiency scores and thus their explicit inclusion in DEA formulations has become standard practice in environmental and eco-efficiency research. Table 3 includes the overview of undesirable output categories and their frequencies among analyzed articles. Air emissions is the largest category, mixing greenhouse gases (CO2, CH4, N2O) with traditional air pollutants (SO2, NOx, dust, ammonia). The second largest group (solid waste) includes unsorted/residual municipal solid waste (MSW), industrial solid waste discharge, landfill and incineration residues and mining/production scrap. The water pollution group covers wastewater discharge volumes, sludge production, COD, and eutrophication potential. Such aggregation is consistent with the common practice in the literature where the discharge of wastewater, exhaust gas and solid waste are taken as three general classes of undesirable outputs. The fourth group of diverse indicators includes monetized environmental costs (e.g., per capita treatment cost, health/environmental cost estimates), resource-intensity indicators (electricity or water consumption per unit GDP, material footprint, natural resource rents), and composite pollution indices. Such indicators are less uniform in the literature than physical flow measures. The remaining category contains variables that combine multiple pollutant media into one indicator (e.g., a composite “wastewater, waste gas, waste emissions” indicator) or are not specific enough to be unambiguously categorized (e.g., “manure”).
In the network DEA models, undesirable byproducts of production are treated as intermediate products, which are used as inputs of the subsequent stages. Table 4 presents the categorization and frequency distribution of intermediate link variables for network DEA models. The three largest categories are solid waste (29.9%), wastewater (25.4%) and air emissions (20.1%). They represent the three physical states of industrial waste: liquid, solid and gaseous. Together, these three classes represent 75.4% of the total number of variables. This results are strongly correlated with Table 3.
The selection of indicators strongly determines which aspects of the CE are actually measured. Because most datasets provide reliable information on waste generation, recycling, and energy use, DEA models tend to focus on end-of-life processes rather than upstream strategies. Indicators for higher-order R-strategies—such as repair, reuse, or product redesign—are largely absent due to the lack of standardized and accessible data. As a result, these strategies are only indirectly captured, for example, through reduced waste generation or improved resource efficiency.
Another important issue is that some indicators are overlapping and ambiguous. For example, a circular material use rate can be caused by both an increase in recycling rates and a longer product lifetime, making it difficult to separate low-value and high-value circular strategies. This restricts the interpretability of DEA outputs and complicates comparisons across studies.
The indicator framework used in the literature provides a practical but incomplete picture of the CE. It measures well resource efficiency and waste management performance but fails to address lifecycle extension strategies and systemic innovation. This imbalance indicates the need for more comprehensive and nuanced indicators more consistent with the full hierarchy of CE principles.

3.2. Datasets

Input and output indicators for DEA models of the CE can be constructed through survey-based data collection, a promising and methodologically supported approach [11]. Most of the current studies rely on secondary statistical data, such as energy consumption, waste generation and recycling rates, which mainly reflect end-of-life processes and lower-order R-strategies (i.e., recycling and recovery). As discussed in the previous section, higher-order strategies such as refuse, rethink, repair and reuse are still essentially unobservable due to the absence of standard statistical indicators. Surveys have been a feasible solution in this context, as they allow to collect firm- or organization-level data on circular practices that are not otherwise captured in the official datasets.
Survey data must be systematically converted into quantitative indicators for introduction into DEA modeling. The latter can be measured with Likert scales, binary variables or percentage-based measures. For instance, inputs can be resource consumption, energy use and operational costs, and desirable outputs can capture economic performance together with circular activities such as the share of reused or remanufactured products. Environmental pressures can also be incorporated by including undesired outputs such as waste generation and emissions. Importantly, survey instruments enable the direct measurement of lifecycle extension strategies and thus allow a more comprehensive representation of CE performance.
Nevertheless, the use of survey data presents methodological problems such as subjectivity, comparability between respondents, and limitations in the sample size. Despite these limitations, survey-based DEA models significantly enhance the evaluation of CE systems by incorporating aspects not otherwise included. Therefore, they provide a key avenue for more comprehensive and policy-relevant assessments of circularity.

4. DEA Models for CE Assessment

4.1. Traditional DEA Models and Their Extensions

The basic formulations of DEA are the CCR model [12] and the BCC model [13], which are still two of the most utilized non-parametric models for efficiency evaluation in CE research. Both models determine Farrell’s efficiency measure permitting the treatment of samples of decision-making units (DMUs) with multiple inputs and outputs. In these models, the DMU’s efficiency score is measured based on the proportional or radial distance to the efficiency frontier. The efficiency score of a DMU is obtained by solving an LP problem. A score of 1 with slacks equals to zero indicates relative efficiency; scores below unity indicate the proportional reduction in inputs (input-oriented model) or expansion in outputs (output-oriented model) required to reach the frontier. The critical structural distinction between the two models lies in their treatment of returns to scale: the CCR model establishes efficiency scores by assuming constant returns to scale (CRS), while the BCC model allows for variable returns to scale (VRS), providing additional flexibility in the returns to scale. The most representative examples of research with these basic models are the articles [14,15,16,17,18,19,20,21,22,23,24,25,26,27,28,29,30,31]. Moreover, the CCR and BCC models frequently serve as the basis for other extended models, which will be discussed below.
The SBM model, first introduced by Tone [32], has now become one of the most widely used efficiency measurement approaches in the CE performance evaluation literature [33,34,35,36,37,38,39,40,41]. Unlike conventional radial models, such as CCR and BCC, that require proportional scaling of inputs or outputs and do not consider slacks, the SBM model simultaneously minimizes inputs and maximizes outputs through a non-radial and non-oriented approach. This characteristic is especially consistent with the operational logic of circular systems. In DEA models, undesirable outputs are often treated as inputs to be minimized. The SBM framework takes into account this feature by directly incorporating undesirable output slacks in the objective function. The model penalizes the excessive generation of emissions while simultaneously increasing the desirable outputs. This yields efficiency scores that reflect both the productive and environmental dimensions of CE performance.
Like the SBM, the Range-Adjusted Measure (RAM) is non-radial and non-oriented. The RAM was proposed by Cooper, Park and Pastor [42] as an extension of the additive DEA model. The RAM currently appears to be one of the DEA measures with a number of desirable properties. It satisfies the translation invariance property that allows a model to handle zero or negative variables without reformulation, unlike the SBM. This is especially relevant in CE datasets, where indicators such as net waste reduction, avoided emissions compared to a baseline, or negative-valued environmental improvements may be present. Standard SBM and radial models cannot deal with such data without resorting to ad hoc transformations that may distort efficiency scores. Our analysis indicates that the RAM is less frequently employed than the SBM in CE-specific studies. The measure is only used in a few studies [43,44,45,46]. This is more likely a result of unfamiliarity with the model than of methodological weakness of RAM.
The Epsilon-Based Measure (EBM) model was formally introduced by Tone and Tsutsui [47]. Unlike purely radial models (CCR, BCC), which proportionally scale all inputs/outputs, or purely non-radial models (SBM, RAM), which treat each dimension independently, the EBM compiles both approaches into a composite model [48,49].
Standard DEA models evaluate efficiency by comparing each DMU with respect to the empirical production frontier. A basic disadvantage of all standard formulations is that all efficient DMUs receive a uniform score of 1, rendering them indistinguishable from one another. To discriminate between efficient DMUs and rank them, Andersen and Petersen [50] proposed the so-called super-efficiency model, the basic idea of which is to remove the DMU under consideration from the set of DMUs. This allows efficient DMUs to receive scores that exceed 1, reflecting the degree to which their performance surpasses the frontier reconstructed in their absence. The efficiency score of an efficient units in the super-efficient DEA model can be greater than 1, but the efficiency score of the inefficient DMUs remains unchanged. Super-efficiency models thus produce a complete and continuous ranking of all DMUs, which is an analytically useful property. The super-efficiency concept is widely used in the DEA literature. In applications involving CE performance assessment, the super-efficiency concept is found in combination with conventional CCR and BCC models [51,52,53,54,55,56], as well as with the SBM [57,58,59,60,61,62,63,64,65,66,67], and DDF [68].
The DDF was formally introduced by Chambers, Chung, and Färe [69,70], building on the work of Luenberger [71] and generalizes the classical radial efficiency measures. Among non-parametric frontier methods, the DDF has emerged as a particularly well-suited instrument for CE performance assessment, owing to its mathematical flexibility and policy interpretability. The DDF simultaneously scales outputs upward and inputs downward in a chosen direction vector. Due to this property, the model is capable of handling the joint production of desirable and undesirable outputs natively. DDF models treat waste, emissions, and pollutants without requiring ad hoc data transformations (e.g., inverting waste quantities) that introduce bias in classical DEA. The direction vector can be calibrated to reflect specific CE policy targets. This makes DDF results directly interpretable in regulatory and policy contexts [72]. DDF-based scores allow additive decomposition, unlike multiplicative Malmquist indices, enabling clearer identification of how changes in efficiency are driven by specific inputs or outputs, a crucial aspect for targeted CE interventions. Separately, it is worth noting the good compatibility with multi-stage CE systems. Typical examples of DDF models for CE performance assessment are offered in the articles [73,74,75,76,77,78,79]. The Russell DDF extends the standard DDF by assigning component-specific efficiency parameters to each input, desirable output, and undesirable output individually [80,81]. Papers [82,83] present the meta-frontier DDF extension that enable cross-group technology comparison.
A central methodological problem in evaluating circular economy performance in production systems is the measurement and monitoring of changes in efficiency over time. The most obvious way is to compute static efficiency scores for each time period separately [36,84,85,86,87,88,89,90,91,92,93,94,95,96,97,98,99,100]. Another approach is to compute efficiency for all periods together by using all temporal observations to construct one technology frontier [101,102,103]. The window method is usually preferred for analyses over longer time horizons because it creates overlapping subsets of consecutive periods, which allows for longitudinal comparisons as well as the detection of efficiency trends while controlling for frontier shifts [104,105,106,107,108,109,110,111,112]. Another approach for extending the classical DEA models across multiple time periods is intertemporal DEA-bootstrap, which helps to reduce the bias and improve the reliability of efficiency assessment [113].
The Malmquist productivity index (MPI) is a widely adopted framework for capturing productivity dynamics in greater detail. The MPI decomposes total productivity change into two important components, efficiency change and technological change, thereby allowing a comparison of performance changes across DMUs over time. Such decomposition is especially useful in CE research, where productivity gains may arise from managerial improvements or technological innovation [111,112,114,115,116,117,118,119,120]. While the productivity growth measure in MPI takes into account only desirable products, Malmquist–Luenberger Productivity Index (MLPI) based on the DDF approach includes undesirable outputs, which makes it more convenient to use within the CE context [39,75,121,122].
The third class, also more structurally sophisticated, contains dynamic DEA models that explicitly acknowledge the intertemporal nature of the production processes by linking efficiency estimates across successive time periods through a common optimization framework. Dynamic models, unlike static or window-based models, understand that decisions on resource allocation in one period may constrain or enhance outcomes in later periods. This concept is operationalized by carryover variables, modeling the transfer of inputs, outputs, or intermediate products between two consecutive time periods [75,121,123,124,125,126].
Next, we dwell on some quite popular models in the DEA literature, but ones that are quite rarely used to evaluate CE performance.
Standard DEA assumes all input and output data are perfectly known. But this assumption may be violated in CE contexts since some metrics like waste recovery rates or material circularity are sometimes based on estimations, surveys or heterogeneous statistical sources with a high measurement error. The fuzzy DEA approach takes into consideration the uncertainties of the CE indicators and considers the fuzzy numbers into the model and provides a modified algorithm for calculating efficiency scores under data uncertainty [127,128,129].
The Benefit of the Doubt (BoD) model is a particular case of DEA. It was initially proposed by Melyn and Moesen [130] and subsequently formalized for composite indicator construction in by Cherchye, Moesen, Rogge, and Van Puyenbroeck [131]. The BoD-DEA model treats each indicator as an output and assigns each DMU weights that are most favorable to it relative to all peers, subject to non-negativity constraints. This yields a performance score in [0, 1], where 1 indicates full efficiency on the observed best-practice frontier. Standard CE composite indices [132,133,134,135] rely on subjective, fixed weights, which can cause disagreement among experts and stakeholders. The BoD-DEA approach is well-suited to building macro-level CE indices because it allows for the aggregation of indicators relating to multiple CE dimensions using a data-driven, endogenous weighting scheme [11,136,137].
In contrast to BoD-DEA model, common-weight efficiency measurement technique applies a single, shared set of weights to all DMUs [138,139]. Bellver-Domingo et al. [140] used a multi-criteria decision analysis approach in combination with DEA to construct the common weight MCDA-DEA model.
Cross-efficiency DEA is an extension of the traditional DEA that reduces the total weight flexibility by using peer evaluation. It computes an average efficiency score for each DMU using its own optimal weights and the optimal weights of its peers. This model alleviates the overestimation of the classical CCR/BCC models and offers a complete DMU ranking [141,142,143].
The game cross-efficiency DEA model extends the cross-efficiency evaluation as a non-cooperative game. In the game extension, each DMU is considered as a player who attempts to selfishly maximize his own efficiency but is constrained by the cross-efficiency scores of other players. The ensuing Nash equilibrium generates a unique and stable cross-efficiency solution [141].
The cooperative game network DEA models are built under a centralized control perspective, in which subsystems cooperate to maximize the efficiency of the entire system rather than independently compete. This paradigm is particularly well-suited for CE systems, whose closed-loop architecture necessitates the coordination of production and resource recovery [144,145]. Sun et al. [146] introduced a non-cooperative game DEA for evaluating the efficiency of the CE system based on a leader–follower relation. The incorporation of data uncertainty into DEA game models is a subject that has been explored in papers [143,147].
DEA models of bargaining games are based on the Nash bargaining theory, which aims at fair and efficient solutions among rational agents with potentially conflicting objectives. In two-stage or multi-stage network DEA, the subsystems (stages) are treated as players whose efficiencies are jointly determined [148].
In the case of the CE assessment, DEA models with convex production possibility sets are typically used. Only one study applied the free disposal hull (FDH) model with non-convex technology to evaluate the performance of Czech municipalities in municipal solid waste management [149].

4.2. Two-Stage DEA Models

Network models represent an important class of DEA models. Unlike traditional DEA models, they decompose the production process into several interconnected substages, which are further used to enrich a DEA model for efficiency evaluation. This makes it possible to measure CE efficiency more accurately, since the model allows separate assessment for each of the subprocesses. According to Pearce and Turner [8], the concept of the CE involves a paradigm shift from the traditional “resources–products–pollution” model to a “resources–products–regenerated resources” model. This transformation emphasizes the recovery and reuse of waste streams as inputs at different stages of the value chain to reduce environmental impact. For example, some two-stage CE models consider waste recycling as one of the stages of the product lifecycle along with its production. Although network models have a clear advantage over conventional models, they are still significantly less common in scientific literature. Currently, only about 30% of published papers on CE efficiency measurement use network DEA models for efficiency evaluation.
One reason for their limited use is the requirement for more detailed data on intermediate products to construct these models. Since DEA is a data-driven approach, this poses a significant challenge. In previous research [7], we highlighted the considerable variation among countries in terms of data availability for CE processes. Outside of a few exceptions, most countries lack sufficient publicly accessible data to evaluate their circular economies thoroughly. Often, the data is either not collected consistently, kept private, or suffers from poor quality being inaccurate, incomplete, or covering only partial aspects of the CE.

4.2.1. Conventional Two-Stage DEA Models

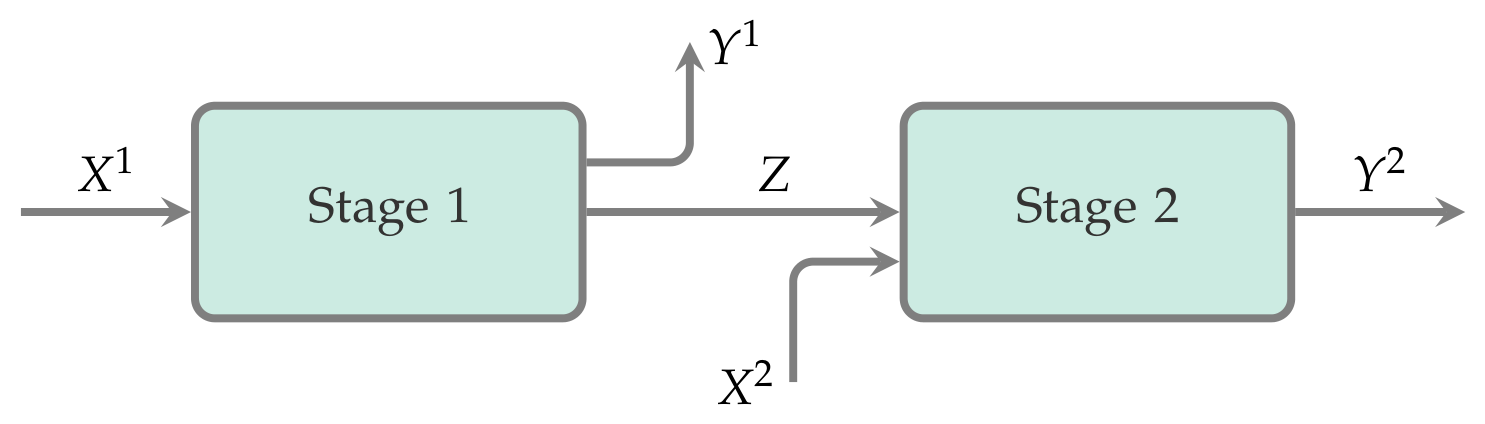
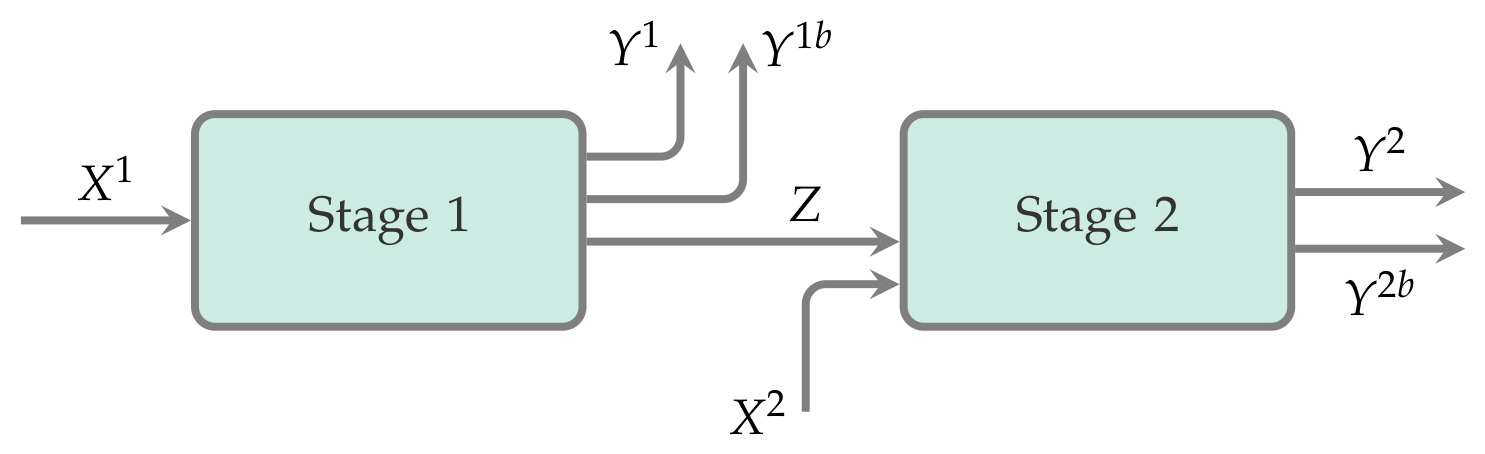
Two-stage DEA models assess CE by splitting the product lifecycle into two stages. The first stage covers production. The second stage covers recycling or disposal. Because the second stage should follow the first, these models belong to the class of serial network DEA models. Figure 3 illustrates the general scheme of such a two-stage process.
The inputs X 1 of the first stage represent resources required for production process. This stage produces both desired products Y 1 and unwanted byproducts (waste or emissions) Z that need to be minimized. Wastewater, waste gas, and solid waste are common examples of such indicators. These byproducts appear in almost every industrial system and therefore are often found in models among the corpus of selected articles. In classic DEA models, waste indicators are considered as undesirable outputs. However, in two-stage models, they serve as inputs for the second stage, which focuses on their treatment and disposal. Together with the investments in the treatment process, which are considered as external input X 2 , these emissions form an inputs of the second stage. The outputs of this stage Y 2 represent recycled products.
Next, we will review several studies that apply two-stage models for CE efficiency evaluation. These can generally be grouped based on how the CE processes are divided into two stages.
In the first group, a two-stage model includes a production system followed by a treatment system. These studies predominantly use three main input factors in the production process: labor, capital, and energy [150,151]. In some papers, the input variables include industrial water consumption and the total investment in fixed assets [152]. The main output variable of the production stage is the total gross industrial output, while industrial byproducts such as wastewater, waste gases, and solid waste are viewed as intermediates that flow into the treatment stage. Investment in the treatment process is considered an external input for the second stage. The outputs from this stage are the recycled products derived from wastewater, waste gases, and solid waste. Alternatively, Wu et al. [152] approach the problem differently, considering not the volume of processed waste but the capacity of industrial facilities dedicated to waste processing.
Liu et al. [153] consider a two-stage model for the construction of ecological civilization pilot zones. These zones are created for the coordination of economic development and ecological protection. The first stage of a model is an economic construction subsystem, which uses labor, energy, and investment in fixed assets as inputs and produce undesirable industrial pollution emissions (industrial sulfur dioxide generation and industrial soot (dust) generation), and gross regional product, which is considered a desirable output of the economic subsystem. The second stage (environmental optimization subsystem) takes expenditure for energy conservation and environmental protection X 1 2 to recycle industrial pollution to environmental benefits, which are measures through industrial sulfur dioxide removal Y 1 2 , industrial soot (dust) removal Y 2 2 , area of green land Y 3 2 , and air quality days Y 4 2 .
Zou et al. [154] considered the marine CE and proposed a two-stage DEA model, which consists of marine production and environmental governance stages. Besides capital, labor, and energy, the mariculture area is also considered as an input of the production stage. Marine pollution factors include Z 1 , which represents wastewater discharged directly into the ocean, and Z 2 , which refers to marine industrial solid waste. The second stage in this model does not focus on processing industrial waste but rather on measuring the efficiency of marine environmental protection efforts. Therefore, the input for the second stage is total investment in controlling marine industrial pollution X 1 2 . The outputs are the proportion of class I and class II offshore water quality Y 1 2 and comprehensive utilization of marine industrial solid waste Y 2 2 .
The second group of papers [64,155] consider only wastewater as an intermediate product that is recycled in the wastewater treatment stage of the model. Qin and Wang [155] consider the following inputs of the water use stage: industrial employee X 1 1 , industrial fixed investments X 2 1 , and industrial water consumption X 3 1 . The outputs of the first stage are industrial added value Y 1 1 and industrial wastewater discharge Z 1 , which is an intermediate variable connecting two stages. The inputs of water treatment stage include investment completed in treatment of industrial wastewater X 1 2 , industrial wastewater treatment facilities X 2 2 , and annual expenditure of industrial wastewater treatment facilities X 3 2 . The outputs represent capacity of industrial wastewater treatment facilities Y 1 2 , COD emission Y 2 2 , and AN emission Y 3 2 . This paper considers the fixed-sum constraints on water consumption and pollution emissions. For these variables, the total sum remains constant across all DMUs. Unlike other inputs and outputs, an improvement of a fixed-sum variable in one DMU requires a reduction in others.
The paper of Han et al. [64] uses similar inputs and output for the first stage, but the intermediate product is represented by the variable grey water footprint Z 1 . The inputs of the second stage use labor force and investment in the water environment sector. The outputs are the following: utilization coefficient of agricultural irrigation water Y 1 2 , sewage treatment rate Y 2 2 , and reuse rate of urban water conservation Y 3 2 .
The third area of application is represented by the paper of Hu et al. [156], which proposes a model for evaluating the efficiency of solid waste recycling. The proposed model splits the recycling process into two stages: waste collection and waste treatment. The costs associated with collection serve as an input of the first stage. The outputs from this stage—business solid waste, household solid waste, and waste collected by groups—then serve as link variables to the next stage. The outputs of the second stage correspond to the six categories of waste recycling products: recycled paper, recycled metals, recycled containers, recycled glass, other recycled materials, and waste for final disposal.
Li et al. [157] suggested a two-stage model beginning with an industrial waste recycling stage, followed by a resource reuse stage where new products are created from the recycled materials. The inputs of the recycling stage are standard and include investments in processing and measures of the volumes of different generated wastes. Intermediate variables are desirable and represent the volumes of recycled waste. The output of the second stage is the value of products manufactured from the processed industrial waste.

4.2.2. Two-Stage DEA Models with Undesirable Outputs

In models described in previous section, all waste emissions generated during the first stage are handled by the second stage of processing and the model supposes that these outputs would be fully recycled. However, this assumption does not always hold true in real-world situations. In practice, it is uncommon for waste or emissions to be completely eliminated. More often, only a portion of unwanted byproducts can be recycled, or the recycling process itself may produce different kinds of emissions. Therefore, it became clear that two-stage models need to explicitly account for undesirable outputs in the production and treatment stages. The use of undesirable outputs in DEA models is a well-established practice, and this approach has naturally been extended to network models [158,159].
Figure 4 illustrates the general scheme of this two-stage process. This scheme is constructed based on the model presented in Figure 3, with the difference being that undesirable outputs ( Y 1 b and Y 2 b ) can occur at each stage. Examples of such models are investigated in the studies [45,141,143,160,161]. Next, we will examine these articles in more detail.
For instance, Xia et al. [160] consider industrial SO2 emissions meeting discharge standards Y 1 2 b as an undesirable output for the second stage of the pollution treatment subsystem. The desirable outputs include industrial solid wastes utilized Y 1 2 , and industrial wastewater emission meeting discharge standards Y 2 2 .
Chen et al. [161] introduced a two-stage model in which not all emissions generated by the production subsystem are processed in the pollution treatment subsystem. In this model, the intermediate variable is industrial solid waste Z 1 , while industrial wastewater Y 1 1 b and industrial sulfur dioxide emissions Y 2 1 b are considered as undesirable outputs of the first stage.
In [141], it is assumed that only some share of the emissions can be recycled at the treatment stage. So in the industrial wastewater treatment model, the second stage (wastewater treatment stage) produces two outputs: a desirable industrial wastewater disposal Y 1 2 , and an undesirable industrial wastewater discharge Y 1 2 b .
Huang [45] introduces a model in which undesirable outputs are presented in both the first and second stages. In the production stage, wastewater, SO2 emission and dust emission are generated. Wastewater is the undesirable output of the first stage and the other two variables are intermediate products. The second stage of the model aims to reduce emissions, where both of its outputs—SO2 emission after treatment Y 1 2 b , and net dust emission after treatment Y 2 2 b —are characterized as undesirable.
Huang et al. [143] propose a two-stage model that evaluates the efficiency scores at both stages independently. At the water utilization stage, two undesirable indicators are proposed: economic wastewater discharge Y 1 1 b , and social wastewater discharge Y 2 1 b . The subsequent wastewater treatment stage uses the undesirable variable of final wastewater discharge Y 1 2 b .

4.2.3. Two-Stage DEA Models with Shared Resources

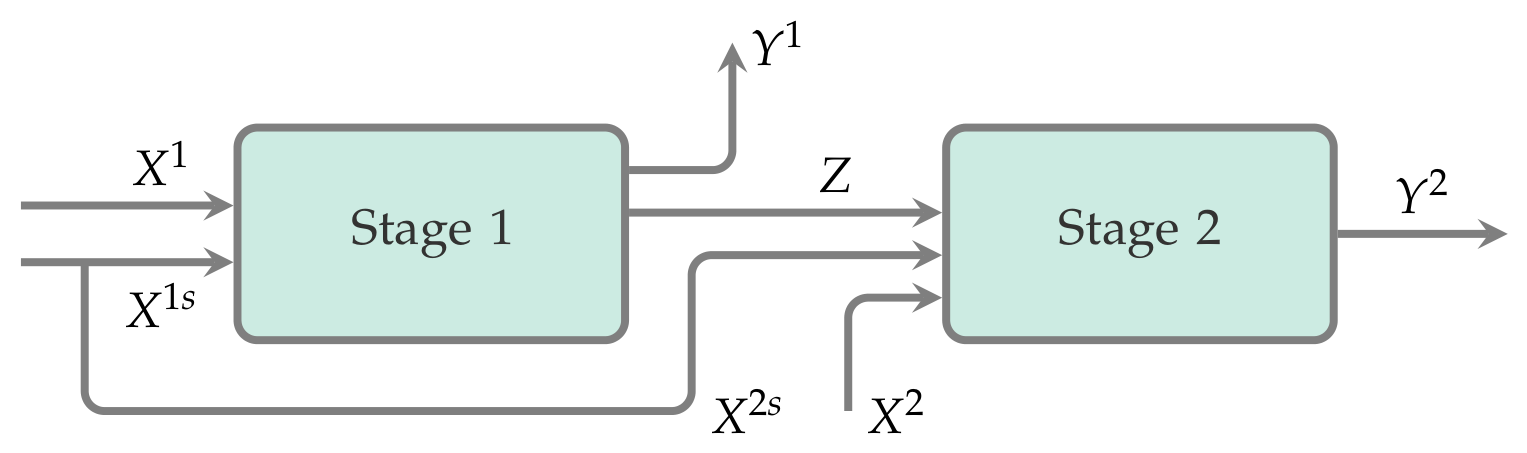
In many real-world two-stage production processes, the same resources are often required for both stages. In these cases, inputs are shared between the two stages, making efficiency measurement models that assume fixed resource proportions for each stage impractical. A more realistic approach allows the total available resources to be allocated in an optimal way between the stages to maximize the overall efficiency of the system. Figure 5 illustrates the structure of a generic two-stage network process where some inputs are shared by both subprocesses.
The model proposed by Wu et al. [162] uses the same input and output variables as those in [150]. The difference is that the paper considers the joint use of labor and energy in the production and waste disposal subsystems. Network models with shared inputs usually assume that all DMUs share inputs in the same proportions when measuring efficiency. However, this study introduces a two-stage model where each DMU can have its own unique proportion for each shared resource. This capability improves the accuracy of efficiency measurement by providing a more realistic representation of the real-world processes.

4.2.4. Two-Stage DEA Models with Feedback

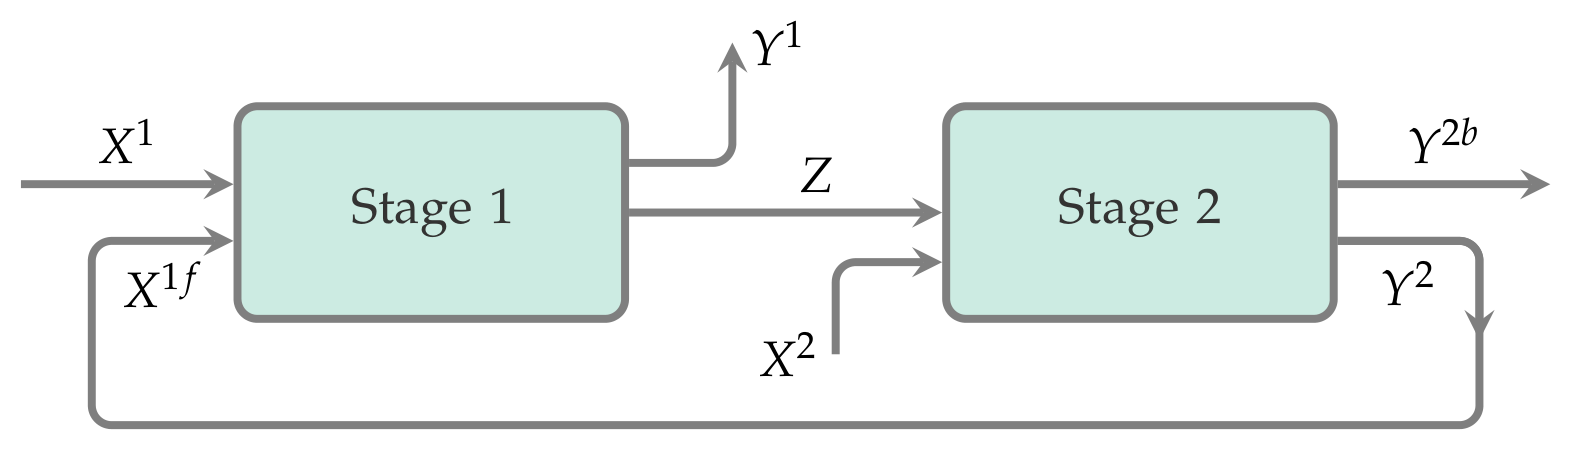
Two-stage models with feedback represent the scenario where the desirable products produced in the second stage are immediately fed back into the first stage as inputs. These models implement a closed loop of resources in economic systems, which is the basis of CE. The general two-stage DEA model with feedback is presented in Figure 6, where the desirable output of the second stage is considered as a feedback input of the first stage. At the second stage of the process, the output variables contain both desirable and undesirable measures. Moreover, only a portion of the desirable recycled products can be reused in the production process.
In the model proposed by Li et al. [163], the second stage, which represents a decontamination subsystem, yields two distinct water outputs: treated wastewater Y 1 2 , and discharged wastewater Y 1 2 b representing undesirable output. The treated wastewater is used in the production process, and therefore Y 1 2 is considered as feedback X 1 1 f in the model. It is important to note that output indicators from recycling processes do not always correspond directly to reusable products. They may reflect various desirable effects achieved during waste treatment. Accordingly, the model categorizes the outputs of the second stage in terms of harmful emissions. By analogy to wastewater outputs these emissions are subdivided into treated nitrogen oxides Y 2 2 , sulfur dioxide Y 3 2 , and soot (dust) Y 4 2 , and discharged nitrogen oxides Y 2 2 b , sulfur dioxide Y 3 2 b , and soot (dust) Y 4 2 b . These variables represent the desirable and undesirable outputs, respectively.
Sun et al. [146] used the following outputs of pa ollution treatment and waste disposal subsystem: wastewater treatment rate Y 1 2 , solid waste utilization Y 2 2 / X 1 1 f , recycled water Y 3 2 / X 2 1 f . In their model, the latter two variables are considered as feedback.
Ding et al. [144,145] used treated industrial wastewater Y 1 2 as the output of a treatment subsystem, and integrated utilization of industrial solid waste Y 2 2 / X 1 1 f is considered as a feedback variable.
The studies [128,129,147,164] consider a typical model in which the recycling process of waste generating at the production stage includes the Waste-to-Energy conversion. The energy recovered is used in the production process and is therefore considered as a feedback variable. In addition to energy recovery Y 1 2 / X 1 1 f , the model also includes the volume of recycled solid waste Y 2 2 / X 2 1 f and volume of backfill Y 3 2 / X 3 1 f that are also considered feedback. Remaining outputs, including landfill and other Y 1 2 b and waste incinerated without energy recovery Y 2 2 b are considered undesirable in the model.
Ji et al. [104] consider industrial GDP Y 1 1 as the output of the industrial pollution treatment process, and recycled wastewater Y 1 2 / X 1 1 f and solid waste Y 2 2 / X 2 1 f as feedback variables.
The paper [165] examines a CE model in agriculture, where DMUs correspond to dairy farms. The network model consists of two stages: feed crop cultivation and milk production. In this system, cattle manure is reused as an organic fertilizer for feed crop cultivation, thus creating a closed-loop cycle.
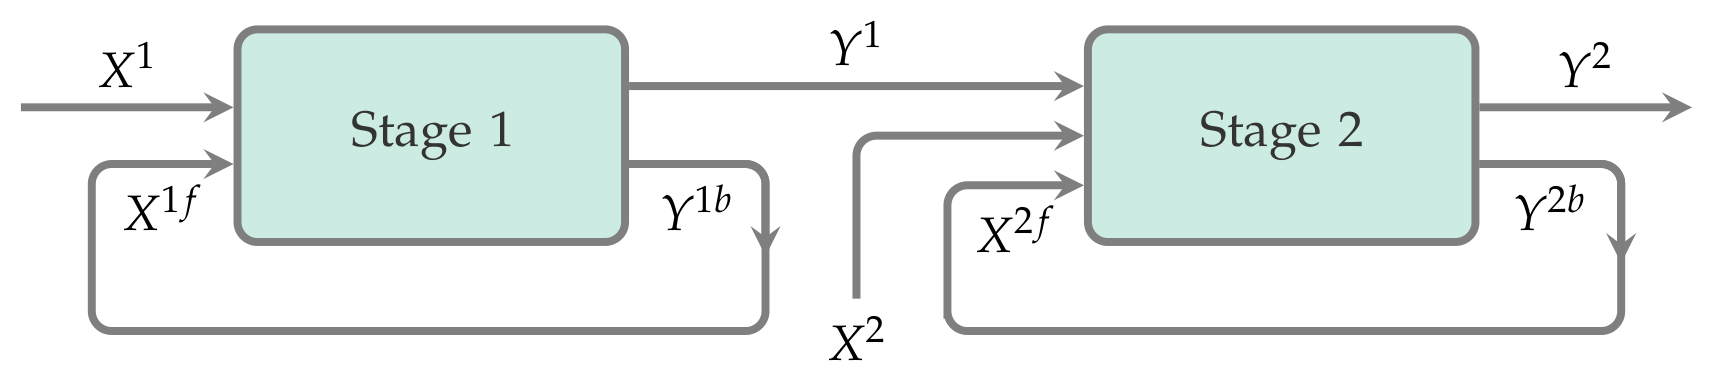
A special and rather rare case in the literature is the use of a feedback model for each stage of a two-stage model separately. Paper [166] is an example of such a study, which explores supply chains of a holding company engaged in iron ore mining, processing, and steel production. The corresponding two-stage process is shown in the Figure 7.
The first stage (mining) reflects the process of iron ore extraction. The inputs of this stage include expenses of enhancing workplace and miner safety X 1 1 , employee wages X 2 1 , and environmental costs X 3 1 . The output of this stage is the intermediate product Y 1 1 , denoting the total iron ore mined. This quantity serves as the input for the subsequent stage. Additionally, the mining process generates an undesirable byproduct Y 1 1 b / X 1 1 f consisting of recyclable iron ore waste. This waste is returned as an input into the mining stage, which represents a closed loop within the mining subsystem.
The second stage (steel production) uses the same set of input variables and produces the outputs: the desired variable Y 1 2 —crude steel; undesirable emissions Y 2 2 —greenhouse gases; and the product Y 1 2 b / X 1 2 f —recyclable steel scrap, which is returned to the steel production process as an input. This model illustrates that the recycling process is not presented as a separate stage in the network model, but it is integrated into each subprocess.

4.3. Dynamic Network DEA Models

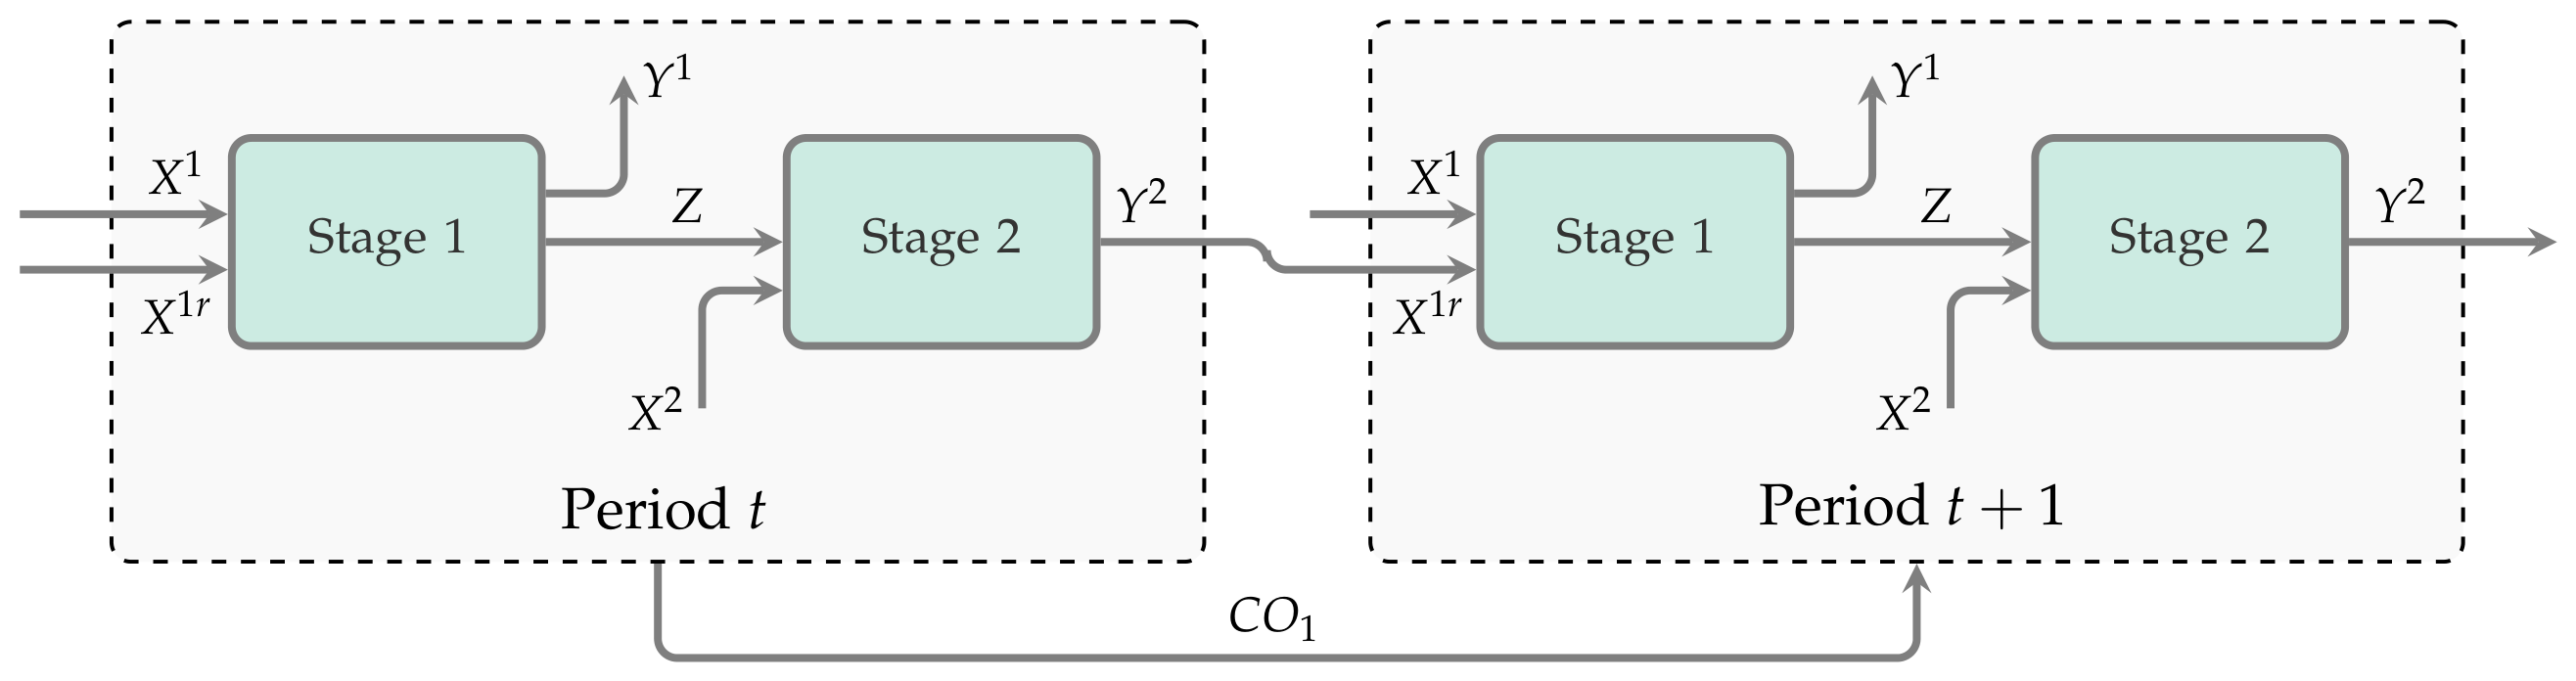
Dynamic models are distinct from DEA models with feedback mainly because they incorporate intertemporal relationships that connect production possibilities between different time periods. For example, in two-stage dynamic models, the outputs produced during the second stage in period t are used as inputs for the first stage in period t + 1 . The key difference between this model and static models with feedback is that the recycled products generated in the current period are consumed only in the next period. The dynamic nature of the model can be more efficient for measuring efficiency in each operating period of the production system.
Dynamic models often contain a special type of variable, called a carryover, which is a resource carried over from one period to the next. These carryovers can be regarded as available assets to be used or invested, depending on anticipated future economic conditions. The most frequent carryover in CE models is the investment in fixed assets variable. However, there are also other types—bad carryover, good carryover, and carryover that can play dual roles. The structure of the two-stage dynamic DEA model is shown in Figure 8.
The studies [167,168] introduced a dynamic network model with two stages: water usage and water treatment. The recycled water indicator Y 1 2 , which is the output for the second stage, proceeds in this model to the following period as an input for the first stage. The model also incorporates a carryover variable—investment in fixed assets C O 1 .
The paper [169] presents a dynamic model for enterprise production efficiency assessment in the context of a CE. In this model, business waste Z 1 1 generated during production is handled in a subsequent waste treatment stage. The fixed assets of the enterprises C O 1 are considered as a carryover variable, which is taken into account in the model.
A similar structure of two-stage model is used in the paper of Guan et al. [170], where solid waste is used as a linkage variable, and recycled solid waste Y 4 2 / X 1 1 r is the output of the treatment stage and is returned into the production process as the input of the first stage in the next period of time. The original value of fixed assets is selected as the carryover variable.
In [48], the efficiency assessment of coal mine production is evaluated using a dynamic model consisting of two-stages: coal mine use and land restoration. The input variables at the coal mining stage are employment in the mining industry and fixed assets. The development of non-oil and -gas resources and land damage are considered as outputs of the first stage. The link between stages is land damage. Together with land recovery funds they used this as the input of the land restoration stage. The output of the second stage is the recovery area, and the carryover variable is the fixed assets in the mining industry.
In the two-stage dynamic model for assessing the efficiency of industrial production and waste recycling [171], both wastewater Z 1 and industrial solid waste Z 2 indicators are used as intermediate products. The outputs of the second stage of recycling—industrial water reuse rate Y 1 2 / X 1 1 r , and comprehensive utilization of general industrial solid waste Y 2 2 / X 2 1 r —represent the inter-period connections of the dynamic model. The carryover variable is the fixed asset investment.
In the model of Shi et al. [172], three types of intermediate products are processed in the second stage: industrial sewage emissions Z 1 , industrial solid waste emissions Z 2 , and industrial waste gas emissions Z 3 . The industrial sewage recycling Y 1 2 / X 1 1 r and utilization of industrial solid waste Y 2 2 / X 2 1 r are used as links between periods, and industrial fixed assets C O 1 is a carryover variable in this dynamic model.
Unlike the approach described in [172], the article of Li et al. [173] considers a broader set of harmful gas emissions. This model treats industrial carbon dioxide emissions Y 2 1 as an undesirable output in the first stage and does not include it in the processing at the second stage. Specifically, it considers undesirable outputs like ammonia nitrogen emissions Z 1 , sulfur dioxide emissions from exhaust gases Z 2 , nitrogen oxide emissions Z 3 , smoke and dust emitted Z 4 , industrial solid waste Z 5 , and COD emissions Z 6 .
The outputs of the treatment stage are calculated as per capita wastewater improvement Y 1 2 / X 1 1 r , COD improvement Y 2 2 / X 2 1 r , and improvement in ammonia nitrogen Y 3 2 / X 3 1 r , which are used as links between periods. The carryover variable used in this model is the same as in the model of Shi et al. [172].
The paper [174] investigates circularity efficiency performance in OECD countries. The authors in their dynamic model propose three types of carryovers: (a) good carryover represents desirable connections that are transferred to the next period; (b) bad carryover corresponds to the situation when transitions between periods are undesirable; and (c) dual-role carryover indicates the connection without specifying its influence, which is determined by the model’s weights. C O 1 —renewable energy—and C O 2 —environmental tax per capita—represent good carryovers, a C O 3 —Population—is considered a dual-role carryover. The same categorization of carryovers is used in the papers [175,176].

4.4. Multi-Stage Network DEA Models

In previous sections, we only considered two-stage network structures. In this section, we will discuss full-network DEA models that have three or more stages and can be connected sequentially or in a more general network structure. These models are more complex and can be static or dynamic.
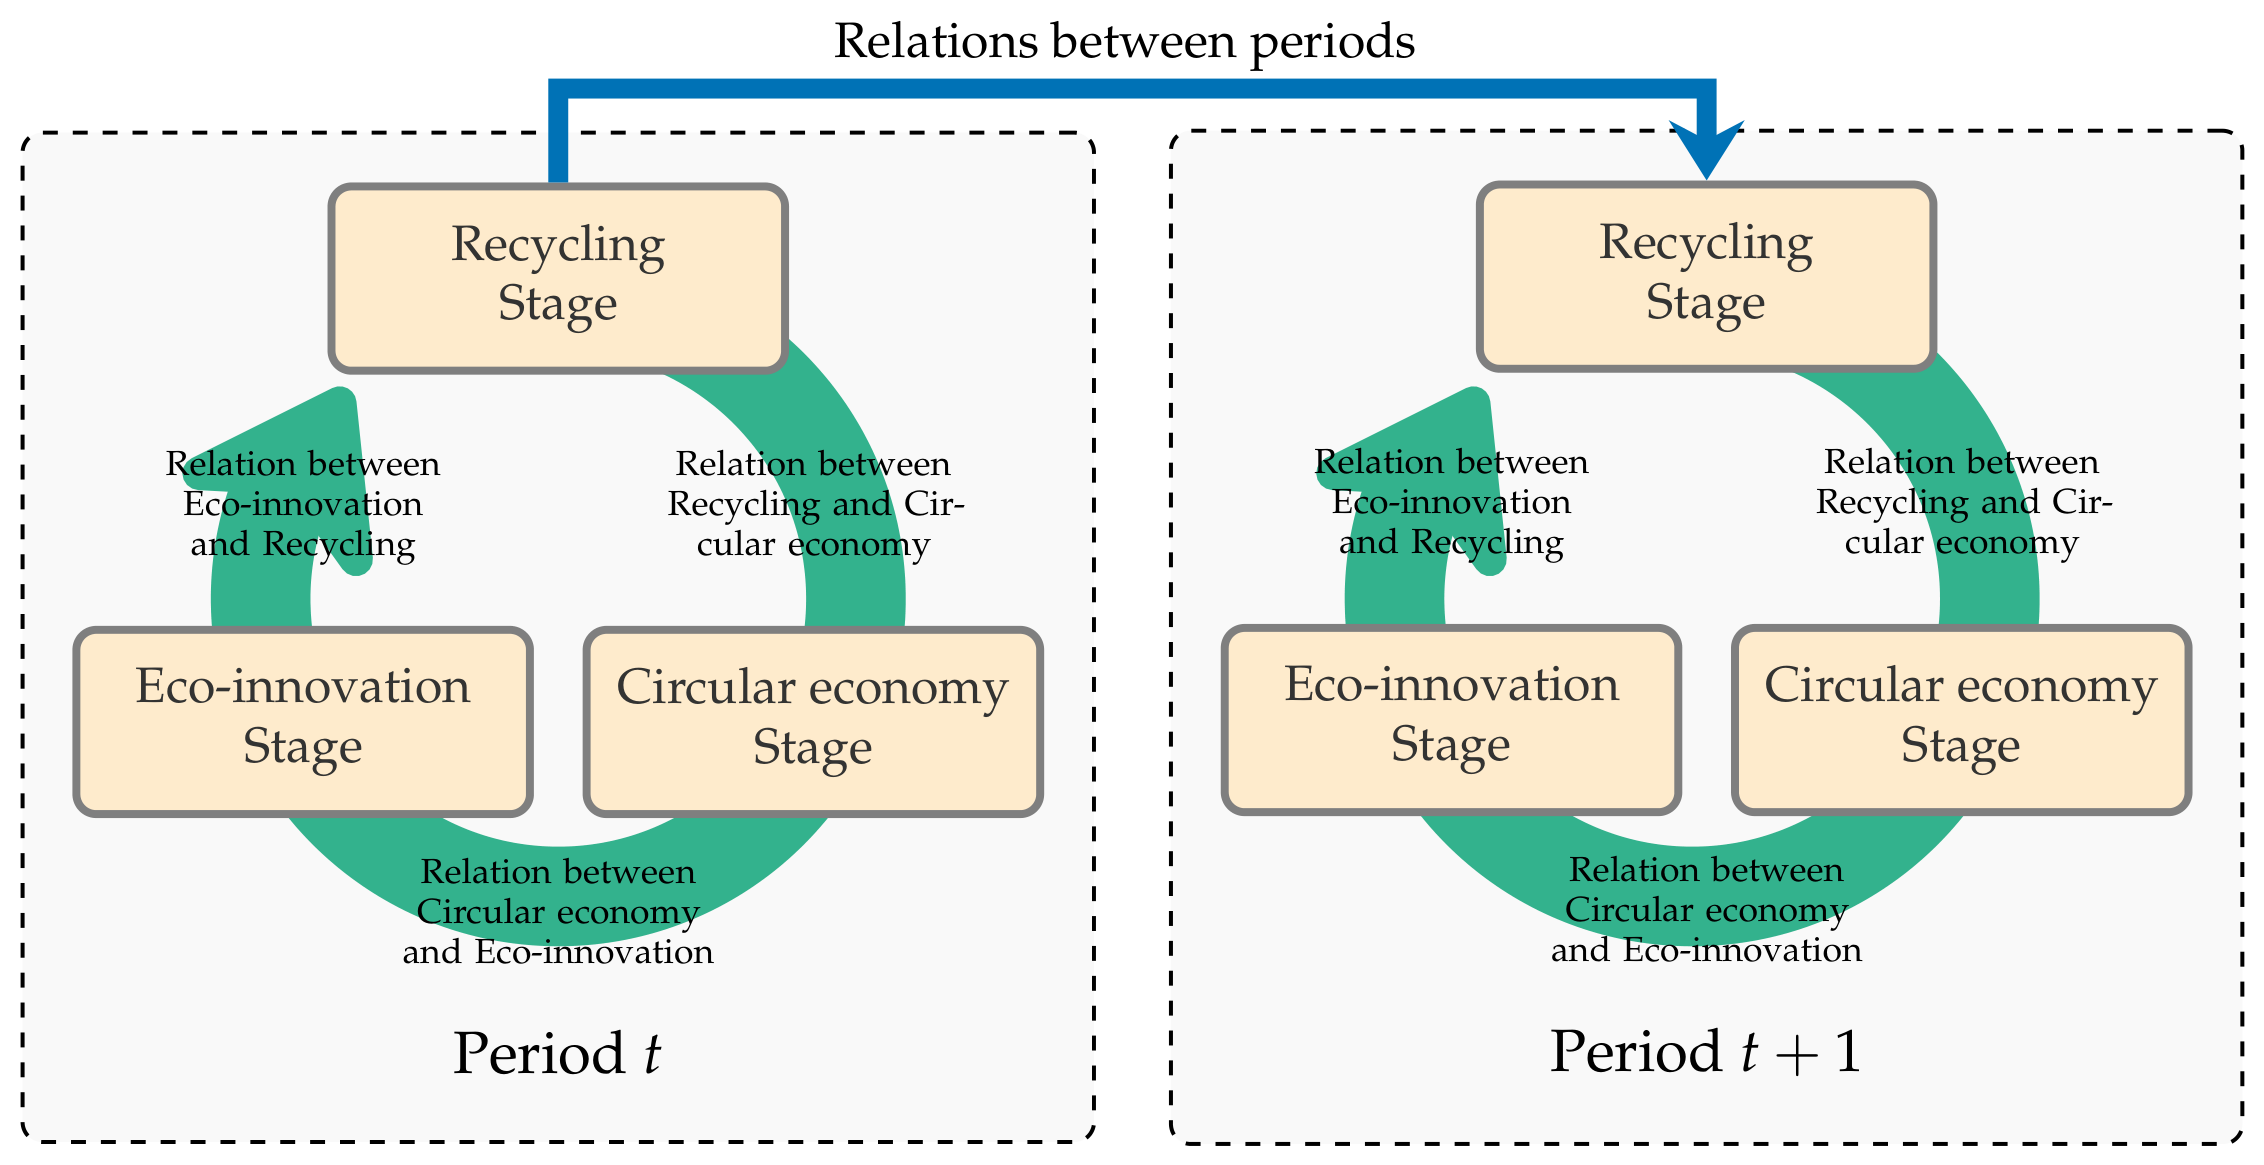
García-Valderrama et al. [177] presented a three-stage model of CE, which extends the two-stage production-recycling paradigm by incorporating a third, intermediate phase of eco-innovation. The model is dynamic and its structure is shown in Figure 9.
This model assesses the efficiency of a CE in municipal waste recycling. The input variable of the recycling stage is the volume of generated municipal waste per capita X 1 1 , and the intermediate product is the recycling rate of municipal waste Z 1 1 , which is then used as an input in CE stage. The output product of the second stage is the circular material use rate Y 1 2 .
Despite the interesting idea presented in this article, it is worth noting the weak connection between the eco-innovation stage and the other two stages. The input variables here are the contribution of recycled materials to raw-material demand X 1 3 , and end-of-life recycling input rates X 2 3 . The output indicators of this stage, value added at factor cost percentage of GDP Y 1 3 , and the eco-innovation index Y 2 3 , have limited direct links to the other two stages. Due to this disconnection, the independent network model was used to evaluate the efficiency at each stage separately. In general, the authors use a rather limited set of indicators for their calculations, which might be due to the lack of necessary data.
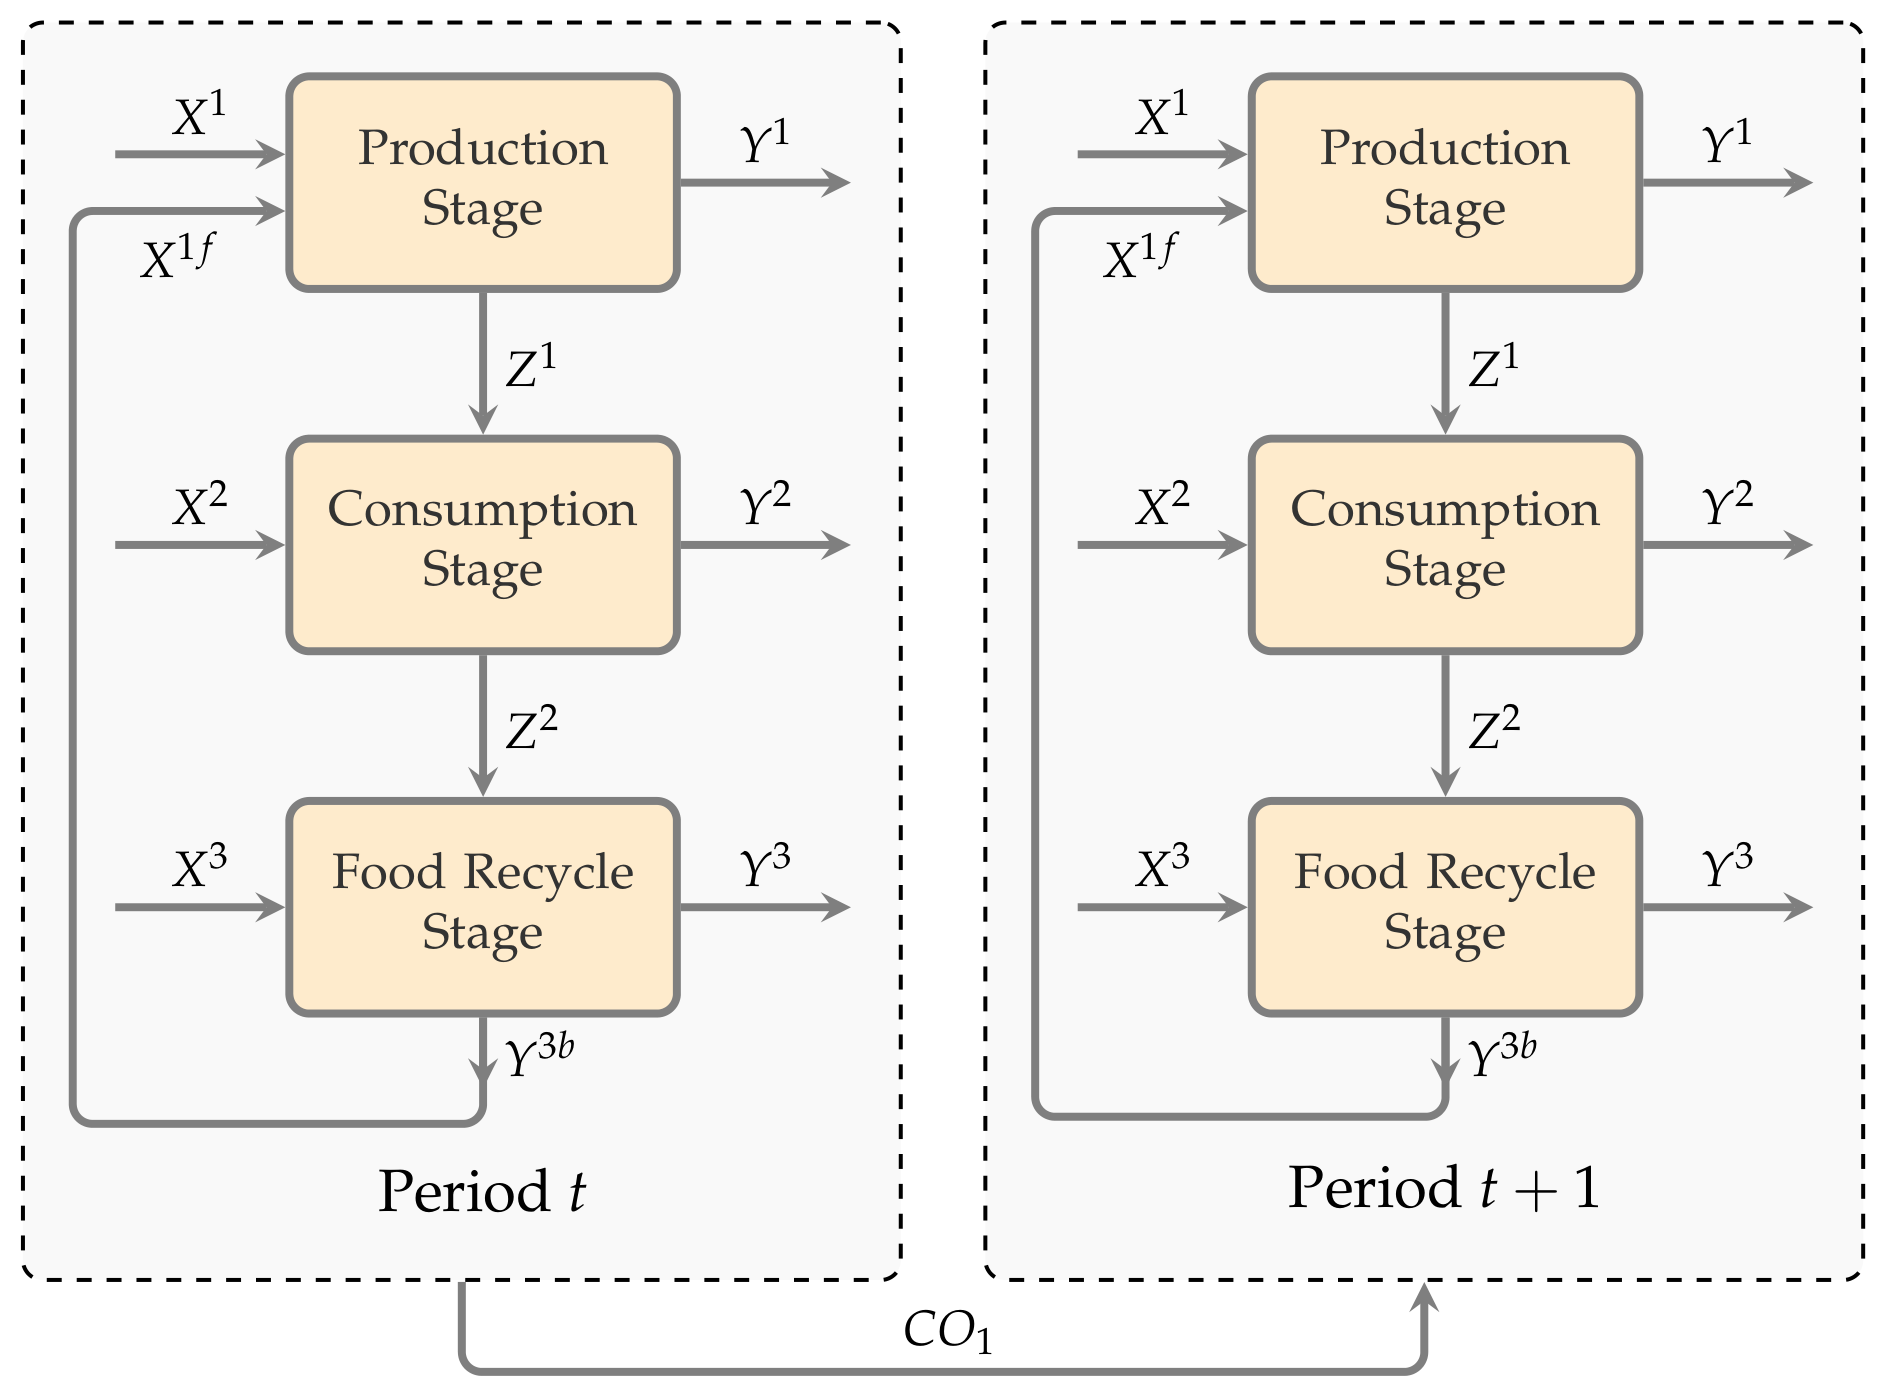
Lu et al. [178] developed a dynamic three-stage DEA model to evaluate the circular efficiency of agricultural systems with food production, food consumption and food waste recycling subsystems. The model structure is presented in Figure 10.
The food production stage consumes inputs such as labor force X 1 1 , fertilizer X 2 1 , and agricultural land X 3 1 to generate agricultural output Z 1 1 , which then serves as the primary input for the subsequent consumption stage. The nitrogen fertilizers cause ammonia emissions Y 1 1 which are considered an undesirable output.
Food import X 1 2 is used as an external input in the food consumption stage and the output products are final consumption Y 1 2 and population Y 2 2 . In this stage the population consumes the food and inevitably some parts become food waste Z 1 2 . This waste is then fed into the third stage, food waste recycling, where it is transformed into valuable resources like organic fertilizer, which in turn feeds back into the production stage, thus creating a closed-loop system emblematic of CE principles. Variable X 2 3 is the energy consumption of the third stage and X 1 3 is the food waste expenditure of the third stage. The recycling process has an impact on the living environment, and the emissions of CO2 and methane are unwanted outputs. The variable agricultural fixed assets C O 1 is used as a carryover variable between stages over periods. The food waste recycling Y 1 3 b is a feedback variable from the food recycling stage to the food production stage.
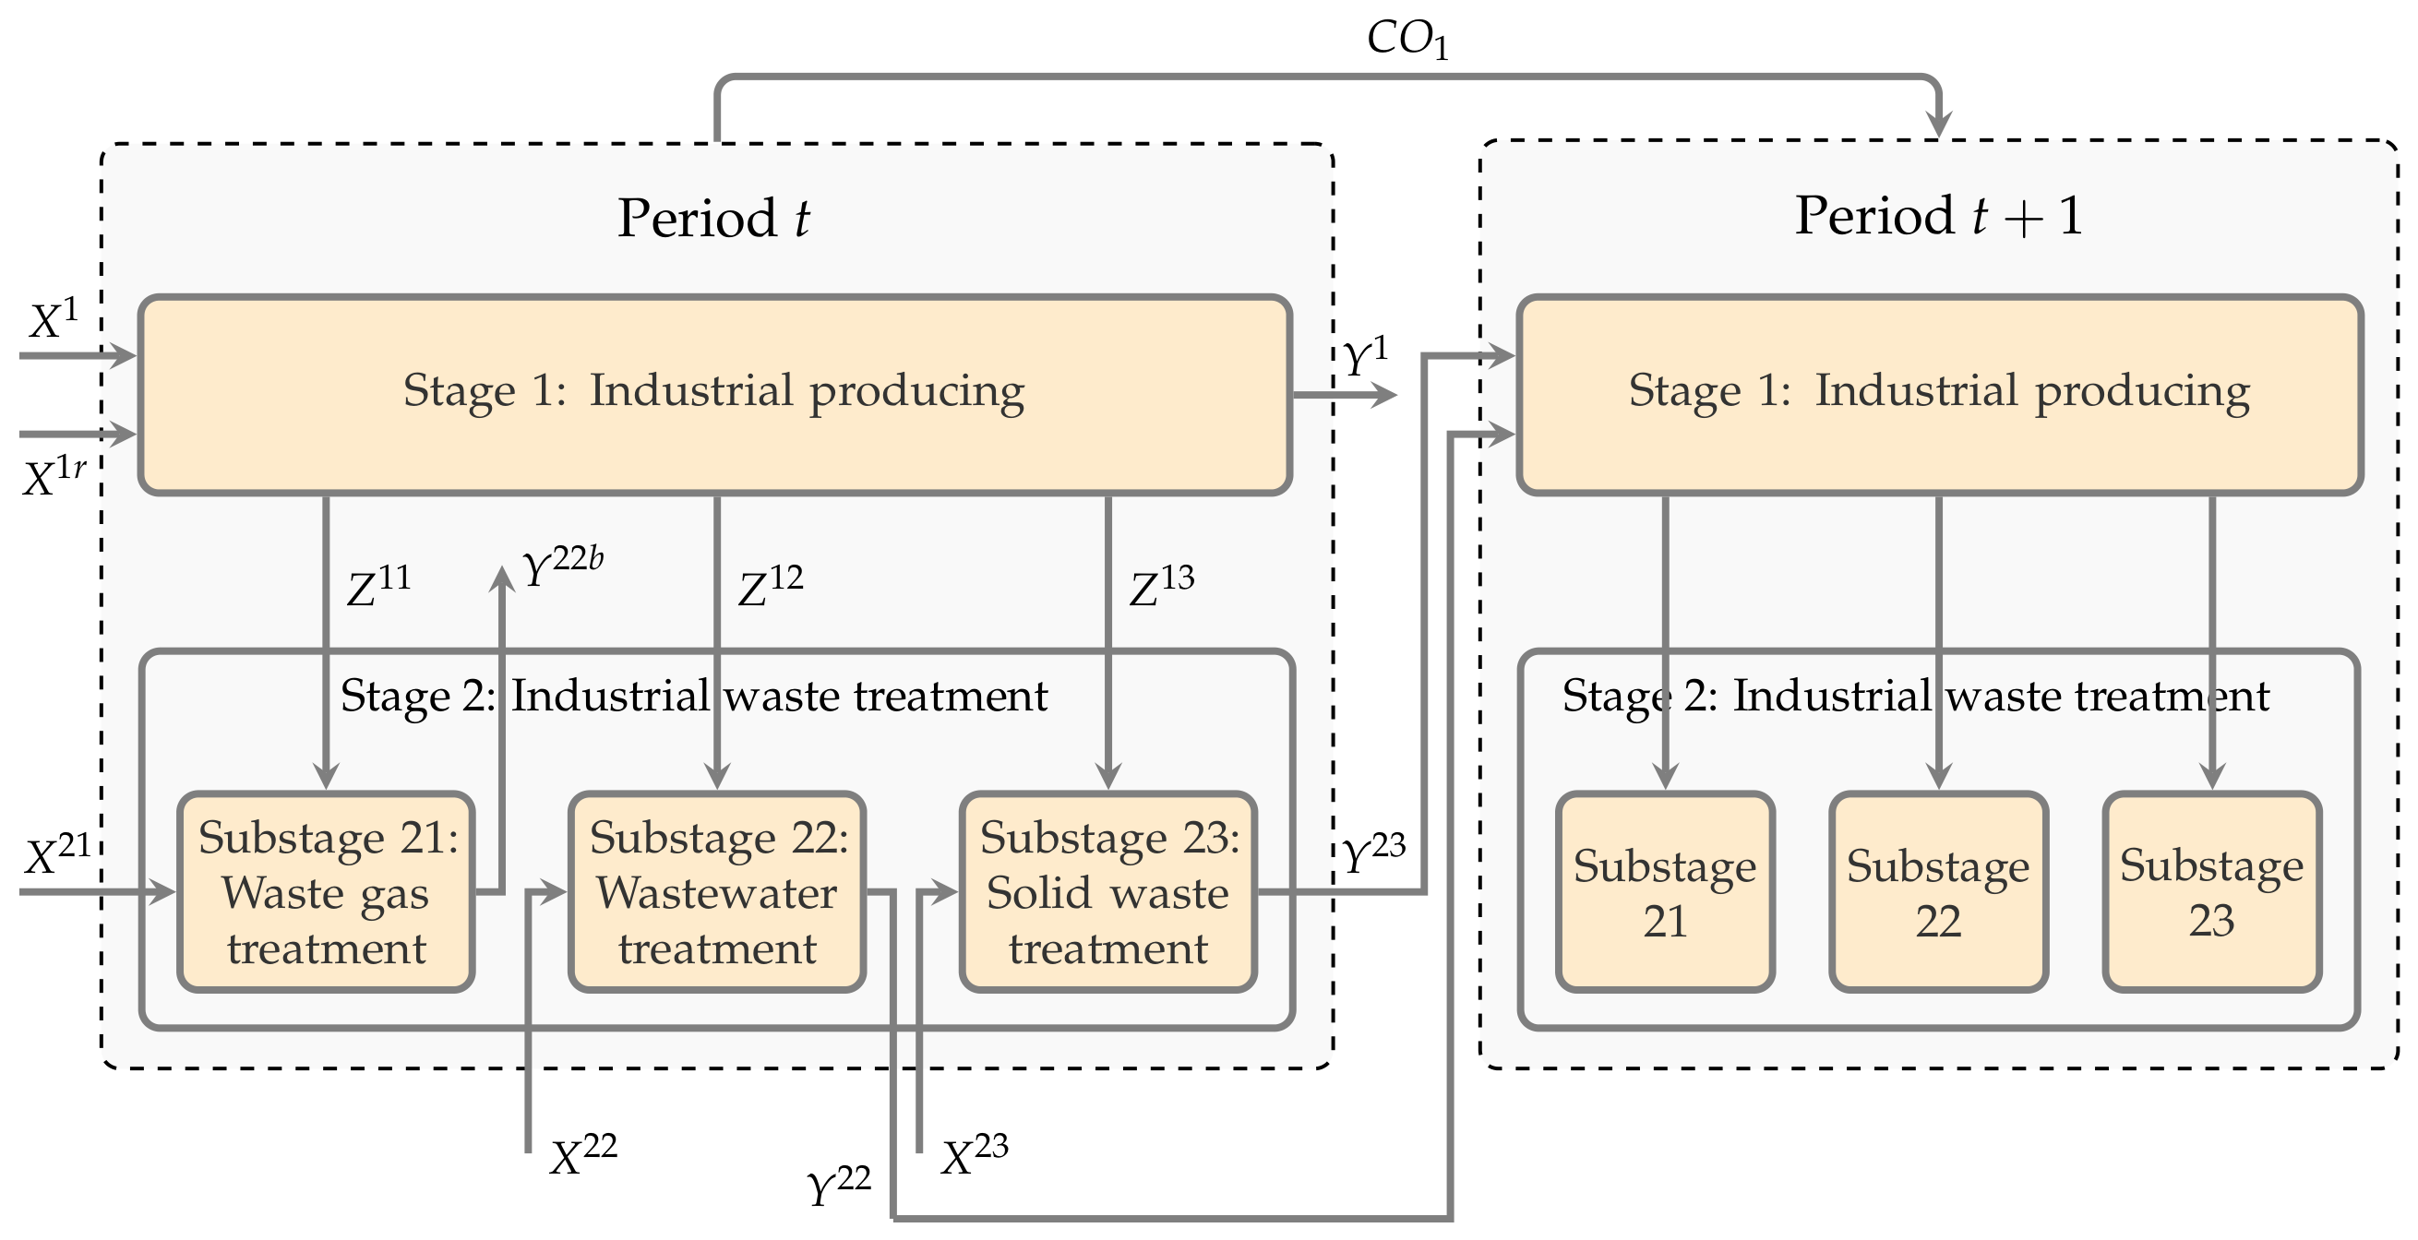
The model of Zhang et al. [179] is actually an extension of the model [168] and proposes a dynamic series–parallel DEA model for measuring industrial CE efficiency. It consists of industrial production and industrial waste treatment stages connected in sequence.
It also incorporates three types of intermediates: waste gas emissions Z 1 11 , wastewater discharge Z 1 12 , and solid waste production Z 1 13 . Instead of viewing the waste treatment stage as a single process, it is divided into three parallel subprocesses, each with its own resources and different products. The structure of the proposed model is shown in Figure 11.
For example, for wastewater treatment, the subprocess receives the intermediate product Z 1 12 as an input, and also uses two inputs: wastewater treatment facilities X 1 22 , and capital invested in wastewater treatment X 2 22 . The output product is reused water Y 1 22 / X 1 1 r , which is a link to the next period in this dynamic model. For the waste gas treatment subprocess, the input indicators are waste gas treatment facilities X 1 21 and capital invested in waste gas treatment X 2 21 , as well as waste gas emissions received for processing. The output of SO2 emission Y 1 22 b is considered in the model as an undesirable output.
The solid waste treatment subprocess receives solid waste as an input that is produced at the first stage. Using the capital investment X 1 23 , this subprocess transforms the waste into utilized solid waste Y 1 23 / X 2 1 r . The treated material is subsequently transferred to the next period, where it is used as an input in the industrial production stage. The selection of a carryover variable in this model is typical for dynamic models of CE and reflects investment in fixed assets. The same network structure is also used in [180].
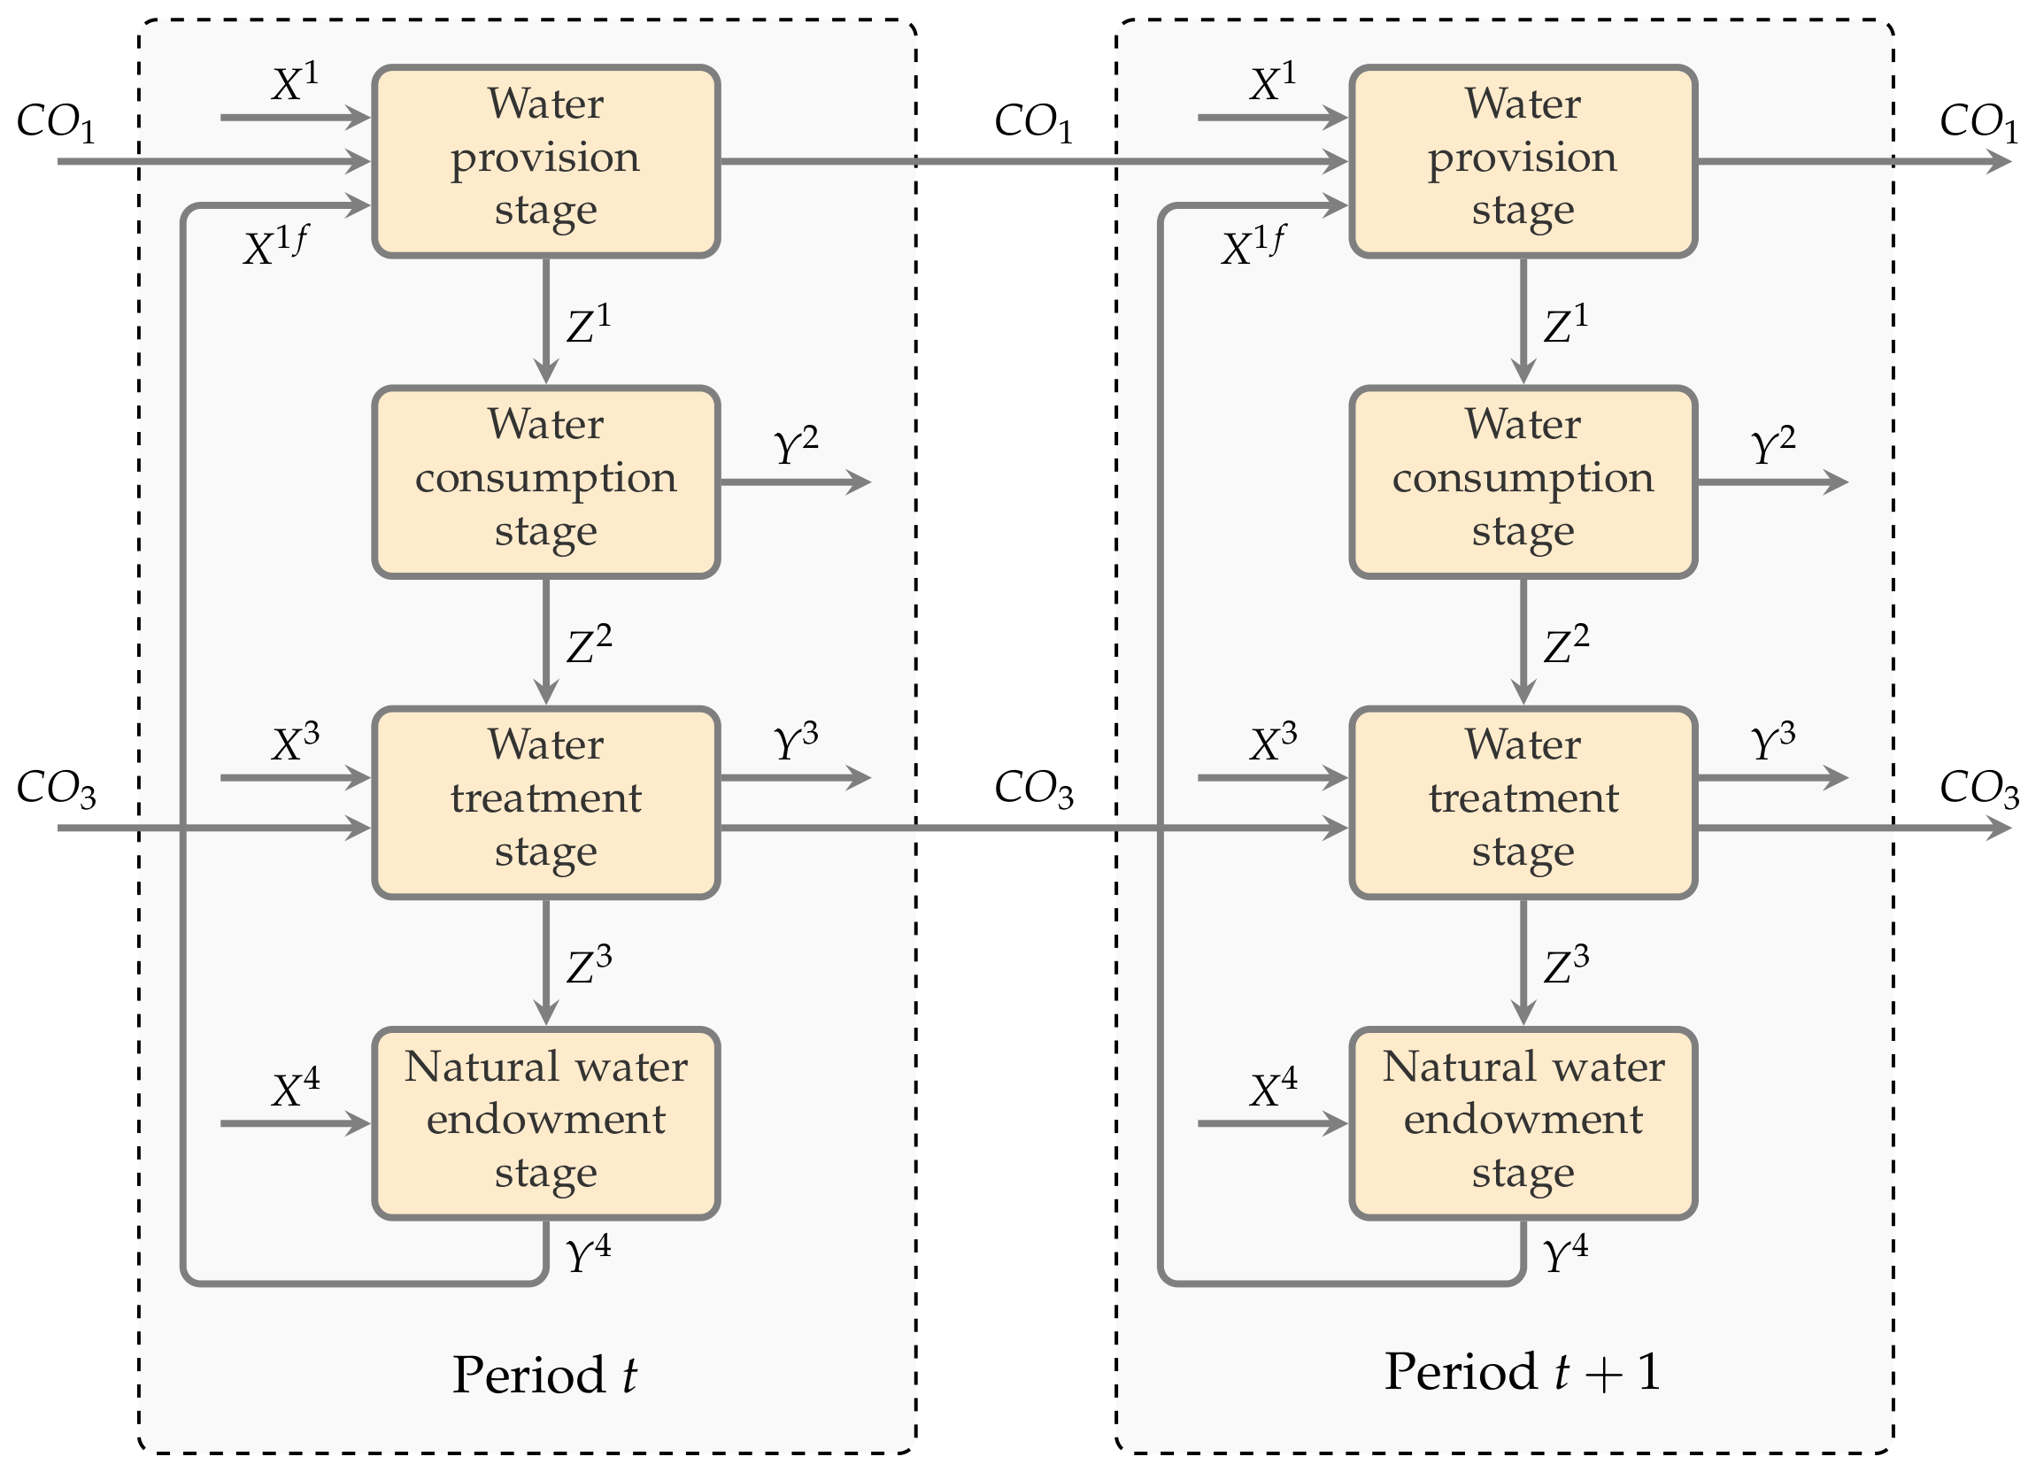
Bronner et al. [181] examine the circular water economy process in more detail, dividing it into four serial subprocesses: water provision, water consumption, wastewater treatment, and natural water endowment; see Figure 12.
The water provision subsystem is responsible for producing and distributing potable water Z 2 1 using labor X 1 1 as an input. The water consumption subsystem is treated as an interface process that not only generates wastewater Z 1 2 as a byproduct but also produces income Y 1 2 for related production processes. The wastewater treatment subsystem is considered as a separate division tasked with recycling Y 1 3 and the handling Y 2 3 of sewage sludge, again using labor X 1 3 as the primary input. Treated wastewater Z 1 3 is then absorbed into a natural water stock managed by a natural water endowment subsystem, which includes environmental inflows X 1 4 such as precipitation that are considered as non-discretionary input and land area made up of vegetation and water X 2 4 as proxies for conservation efforts undertaken by the public sector. Water flows then cycle back through flowback link Y 1 4 / X 1 1 f to the source, completing the system of water provision.
The performance is evaluated by the dynamic network DEA model, which can well reflect the efficiency change of different periods. It includes carryover variables to capture changes in efficiency between periods. The model has two carryover variables, water supply connections C O 1 and length of sewer network system C O 3 . These variables are used to link consecutive periods in order to provide a more accurate view of performance over time.
The paper [182] proposes a relatively complex model structure that includes three subsystems: economic production, environmental governance and social subsystem. The model reflects the overall view of sustainable development through the three subsystems of environmental capacity, economic activity and social governance. The first subsystem is associated with production, where inputs are labor, capital stock, energy consumption, and water use and outputs are GDP and waste generation, including wastewater, solid waste, and other pollutants, which are both desired and undesired outputs. The second subsystem is environmental governance. Environmental governance is a circulation subsystem with a positive impact on pollutant emissions and resource depletion through investing in environmental pollution treatment and municipal sewage treatment rate. The third subsystem refers to social inputs which are used to measure social investments like the expenditure on research and development and public social spending. This social subsystem promotes the development of rules and systems that maximize welfare, which is summarized in the Human Development Index considered as an output.
However, the proposed model is relatively straightforward. In its implementation, there are no indicators that explicitly reflect the relationships between subsystems; these connections are only represented at a conceptual level. Hence, the resulting model functions as an independent network model, representing the simplest form of a network model for evaluating efficiency. In this approach, the overall process is decomposed into separate SBM models, each assessing efficiency independently of the others.
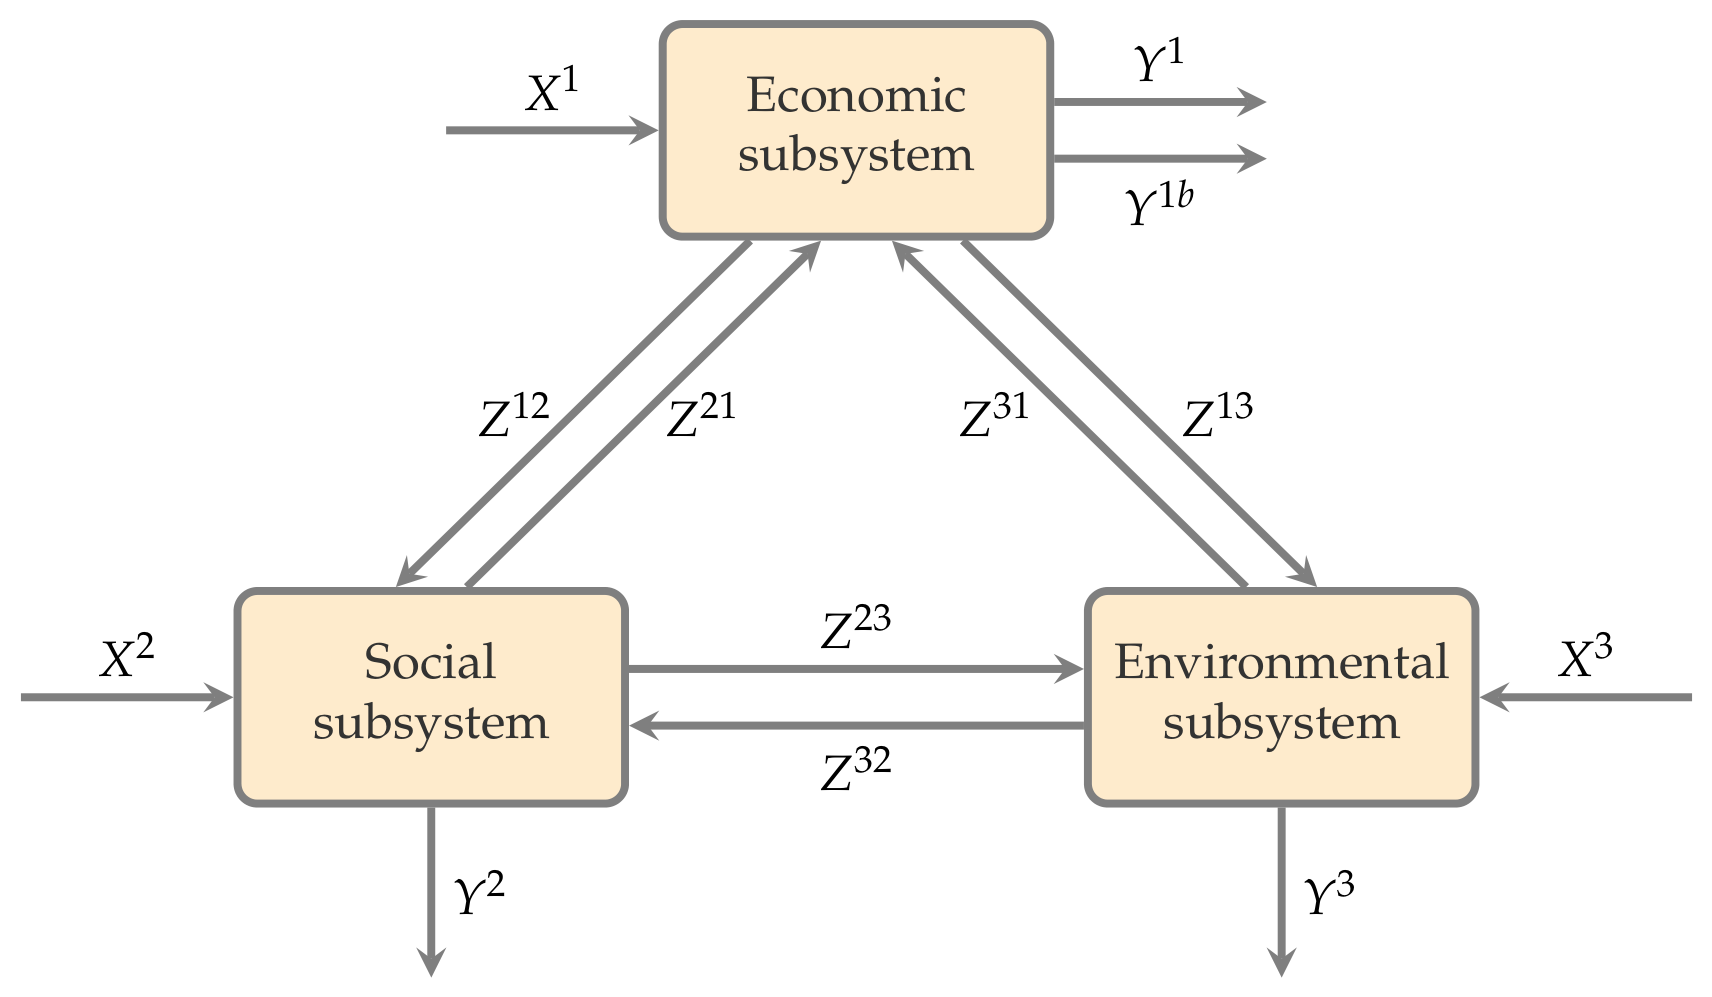
The article [183] develops a model that reflects the eco-efficiency development of a region. The research proposes the global network data envelope analysis model, which is based on three subsystems: economy, society, and environment. Unlike the model in [182], this one has a hybrid network structure and integrates interactions between all three subsystems; see Figure 13. The figure illustrates the complex interactions between the economic system, social system, and environmental system, focusing on how policies, investments, and resource flows influence sustainable development.
The economic subsystem is characterized by variables related to the industrial activity of a region. Accordingly, total energy consumption X 1 1 , and total fixed asset investment X 2 1 are selected as external inputs of economic subsystem. The external outputs include disposable income of urban residents Y 1 1 and pollutants, carbon dioxide emissions Y 1 1 b , COD emissions Y 2 1 b , ammonia nitrogen emissions Y 3 1 b , sulfur dioxide emissions Y 4 1 b , nitrogen oxide emissions Y 5 1 b , and particulate matter emissions Y 6 1 b , which are considered as undesirable outputs. Two intermediate products, proportion of added value of tertiary industry in GDP Z 2 1 and the generation amount of industrial solid waste Z 3 1 , represent links to the social and environmental subsystems, respectively.
The social subsystem includes indicators that closely affect people’s lives, such as education and medical care. The external inputs of this subsystem are education investment X 1 2 , and medical and health investment X 2 2 , and the external output includes the number of higher-education students Y 1 2 , and the number of health technicians Y 2 2 . The internal links to the economic and environmental subsystems are represented by the following indicators: proportion of employees in tertiary industry Z 1 2 , and residential waste removal amount Z 3 2 .
The environmental subsystem focuses on regional resource conservation and pollution control. Its external input variable, pollutant treatment investment X 1 3 , designates the level of regional investment allocated to environmental protection. The solid waste generated by economic and social activities coming from the economic subsystem is recycled back into useful resources, which is reflected in the output indicators of industrial solid waste treatment Y 1 3 and residential treated waste Y 2 3 .
The utilization amount of industrial solid waste Z 1 3 reflects how effectively waste materials are recycled back into the economic subsystem in accordance with CE policies. Good environmental governance, which can improve overall environmental health, is operated through an internal link to the social subsystem and measured by the green coverage rate of urban built-up area Z 2 3 .
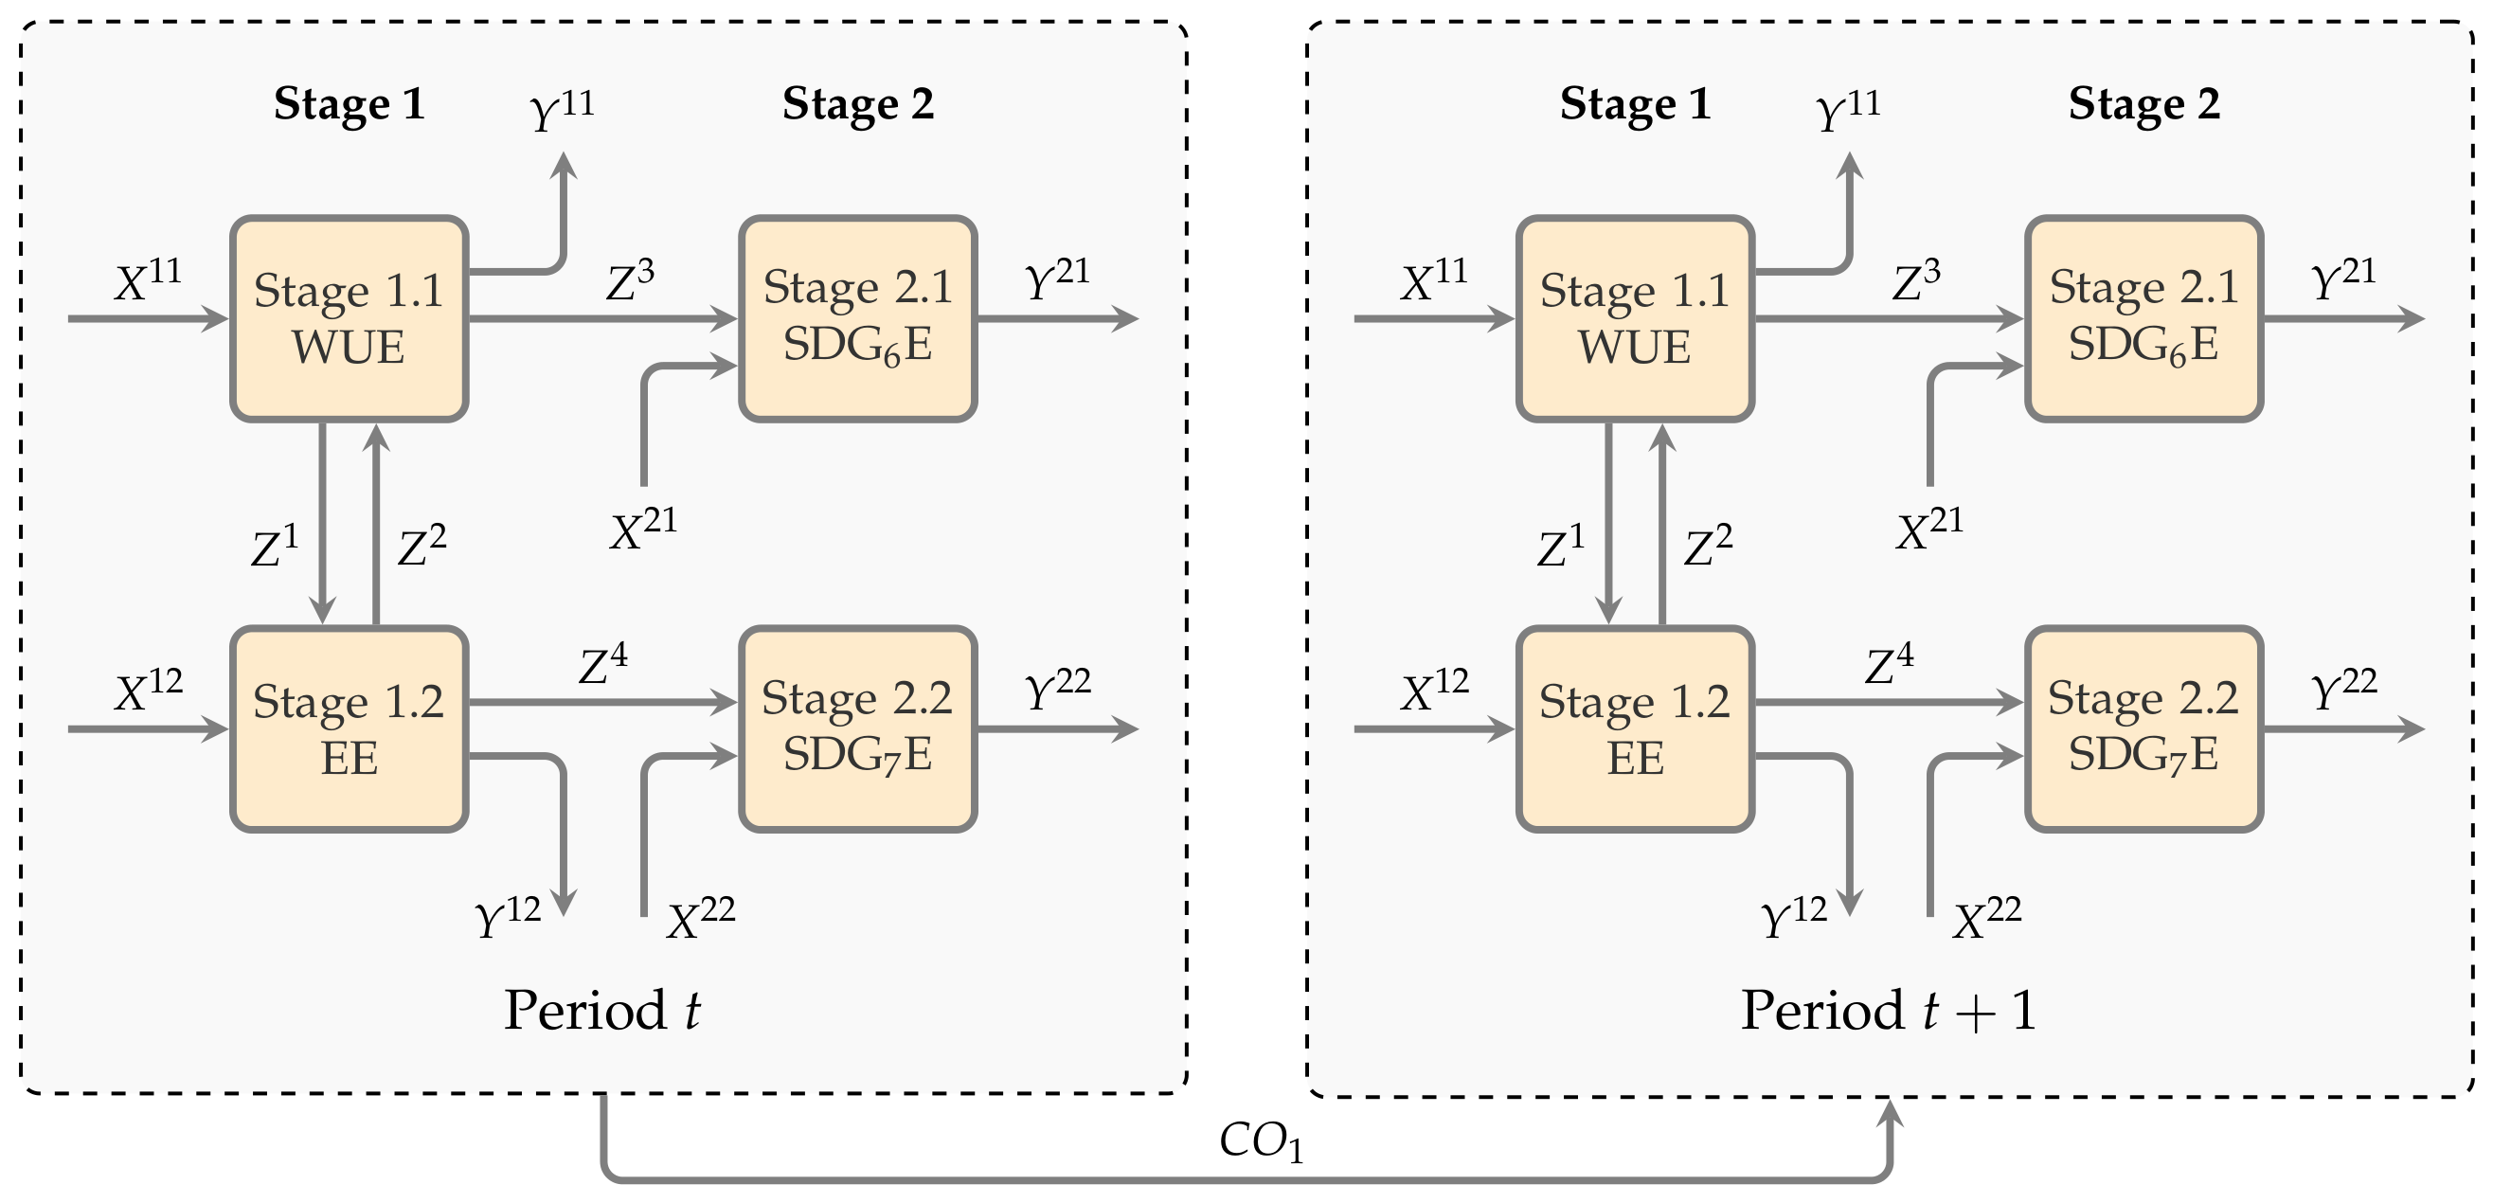
The model for assessing industrial circular efficiency in paper [184] is based on a two-stage parallel model of the water use efficiency (WUE) and energy efficiency (EE) subsystems. This process includes the sustainable development goals (SDGs) related to environmental management and energy consumption (SDGs 6 and 7). The scheme of the proposed model is shown in Figure 14.
In stage 1.1, the model takes into account inputs such as the labor force and total water supply when analyzing WUE. The economic assessment is based on gross domestic product, water consumption per person, and the value added in the agricultural and industrial sectors as a percentage of total water use. This stage also includes undesirable environmental outputs such as wastewater, waste gas emissions and solid industrial waste. The link to the following substage is industrial water consumption or water utilization in production activities.
The input variables for Stage 1.2, which deals with energy efficiency, consist of the labor force participation in energy production and the total energy consumption of all economic activities and households. The desired outputs are economic benefits in terms of value added by the secondary sector, and the undesired outputs are total carbon emissions from different fossil fuel sources. The model integrates hydroelectric power generation as a connection to the WUE substage, demonstrating the interdependence of WUE and EE systems.
Further advancing the framework, the model includes sustainable development goal assessments: stage 2.1, related to SDG 6, is given wastewater treatment and pollution control investments as inputs, and produces the volume of solid waste treated and wastewater treatment capacity, considered as outputs. Stage 2.2 aligns with SDG 7, using environmental protection funding as an input, and produces three outputs: energy intensity measured as consumption per GDP, the proportion of population reliant on non-renewable gas, and the share of new energy generation including nuclear, wind, and solar.
An intertemporal carryover variable, a resource to be transmitted across time periods, is accounted for in the fixed asset investment across provinces. Overall, the model provides a comprehensive regional level assessment of water and energy use, and progress towards the sustainable development goals.
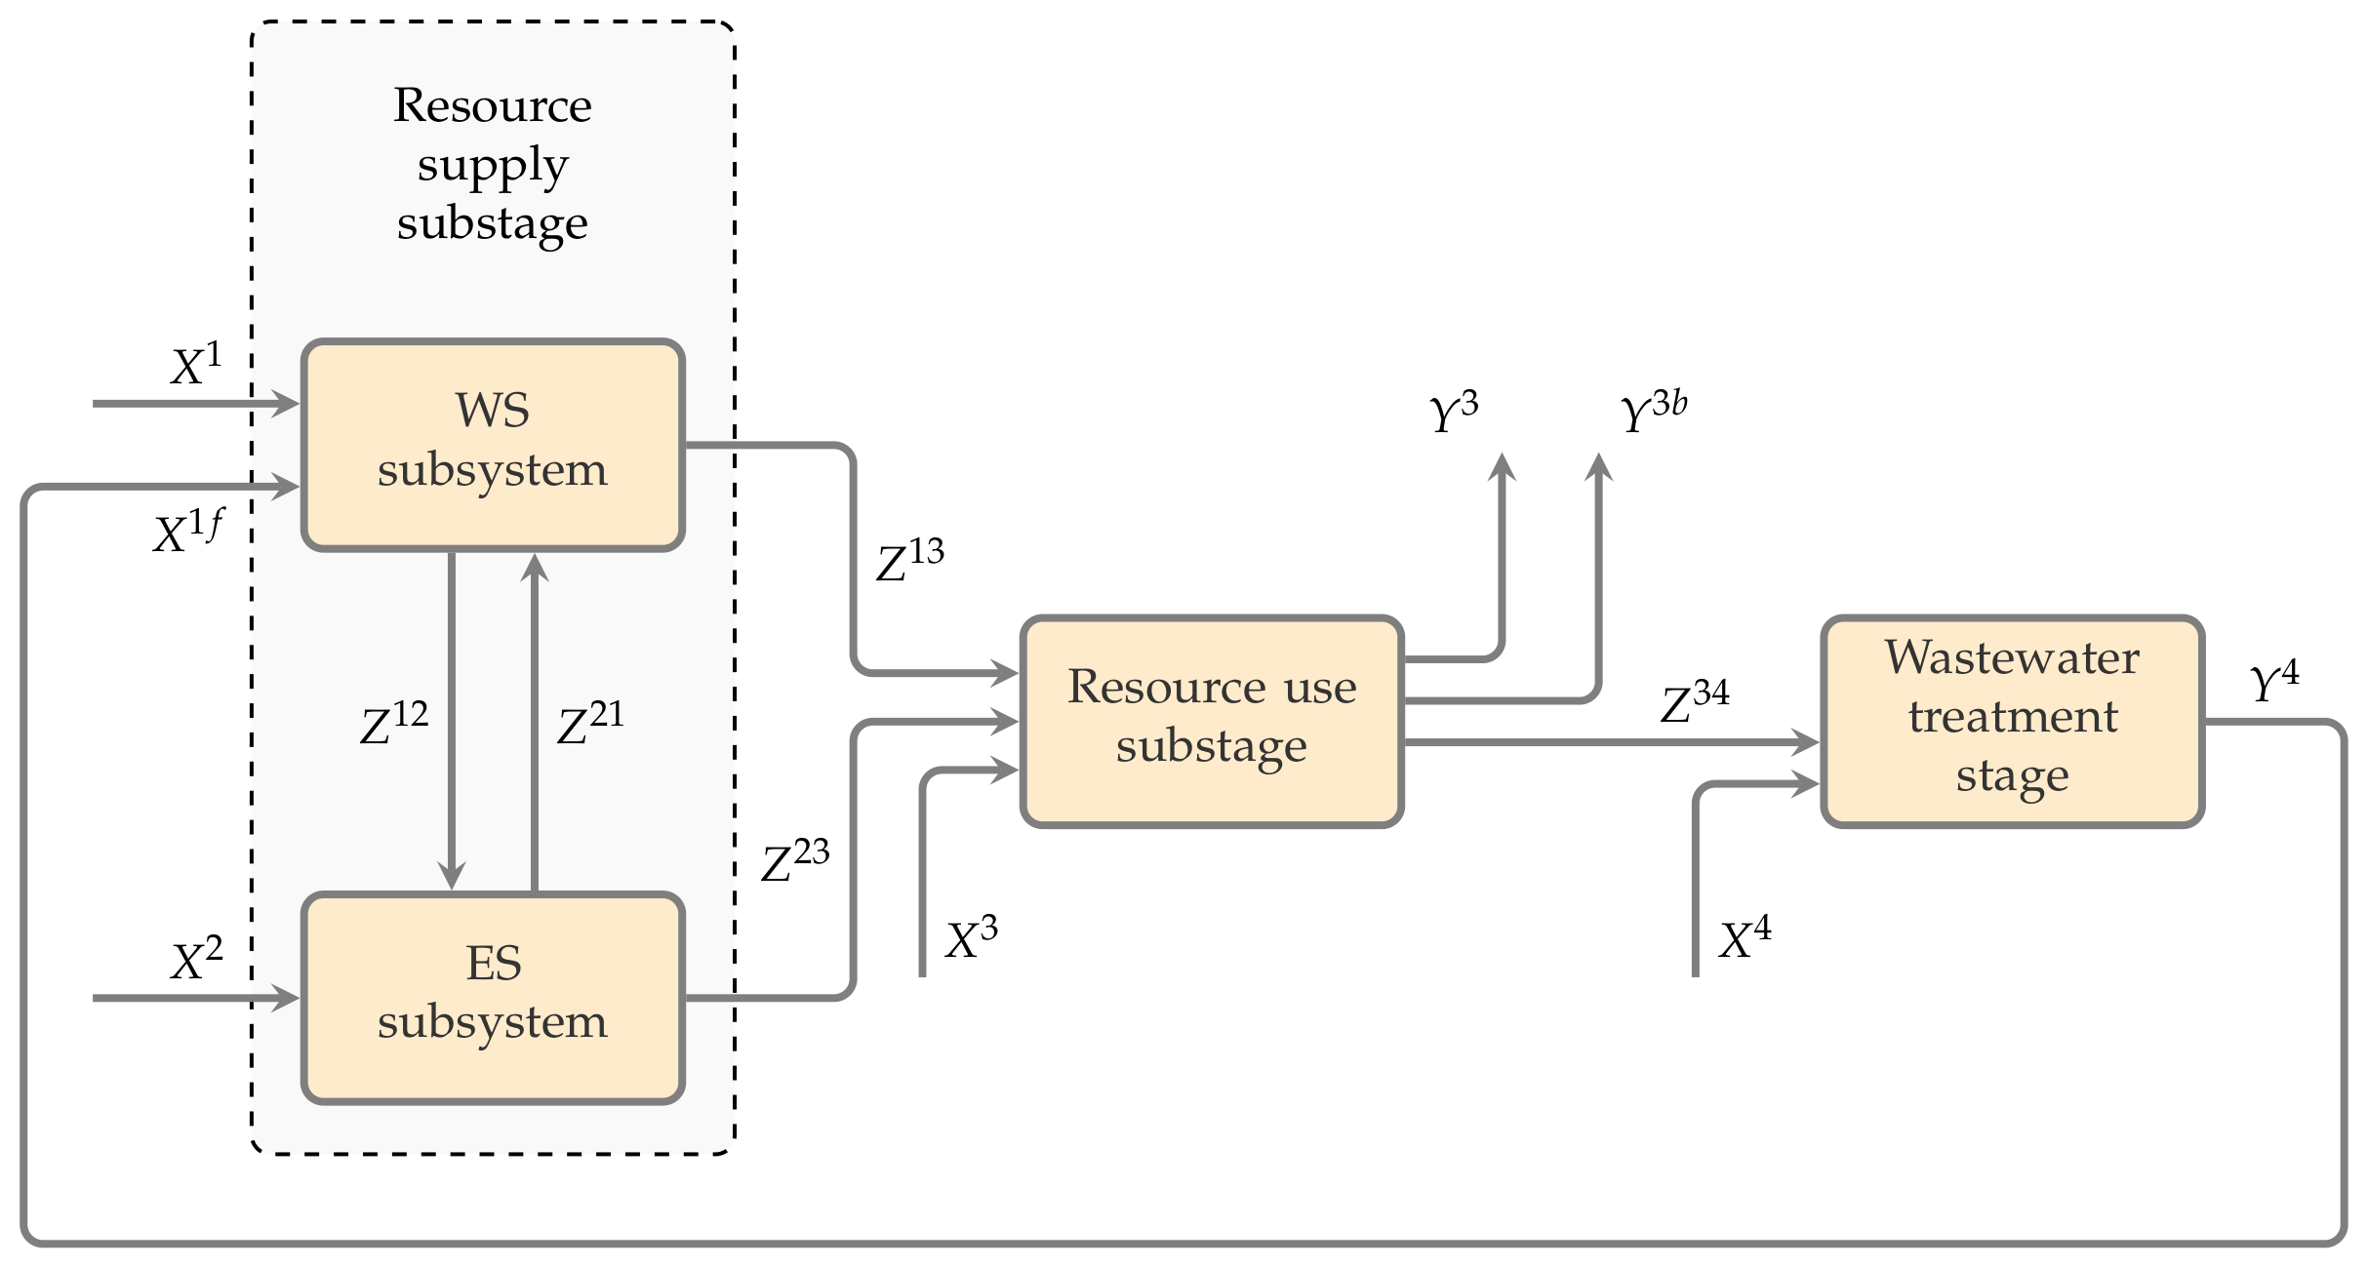
Zhuang et al. [185] proposed a series–parallel network CE model to evaluate the efficiency of industrial water management systems. The network structure is based on three substages connected sequentially: resource supply, resource use (RU) and wastewater treatment (WT). The resource supply substage is split into two parallel subsystems, namely water supply (WS) and energy supply (ES). This leads to a series–parallel network configuration as shown in Figure 15.
The WS subsystem takes in inputs related to employees, capital, and water sources, facilitating the acquisition and transportation of natural water sources, and supplies this water to the ES and RU subsystems. It tracks both the direct consumption of water in thermal and nuclear power generation and the industrial water provision. The capital invested in the production and supply of water is considered as a carryover variable linking the consecutive periods.
The ES subsystem utilizes inputs of employees, capital, installed capacity, and energy consumption to generate electricity and heat. Here, the system accounts for capital investments in the production and supply of electric power and heat power that carry over between periods of the dynamic model. The produced electricity is supplied to support the water supply system and industrial activities in the RU subsystem.
The RU subsystem includes industrial operations that add value and emit emissions (CO2, etc.) and generate solid waste. It also includes the management of wastewater discharge, connecting industrial activity with the wastewater treatment (WT) process. The model takes into account the labor force and investment in productive assets necessary for industrial activity, including measures of environmental impact and outputs of resources.
The WT process uses employees, capital and infrastructure to treat industrial wastewater for reuse water. The reclaimed water is then fed back to the WS subsystem, forming a closed loop that shows sustainable resource utilization and environmental management.
A dynamic double-closed-loop network structure is proposed in the paper [186]. In this model, each DMU is specified as a dual-closed-loop network with two stages (coal production and coal utilization) and each stage has two subsystems (manufacturing subsystem and waste recycling subsystem). These four subsystems are connected by intermediate linking variables (within a period), and carryover variables (across periods). In the production stage, mining-damaged land area, wastewater discharge, and coal gangue production connect manufacturing subsystem to the waste recycling subsystem. Reused water, coal gangue utilized, and mine land restoration feedback from waste recycling to manufacturing subsystem in the next period. Raw coal production links the production-stage manufacturing subsystem to the utilization-stage manufacturing subsystem. The coal gangue reused in utilization connects the waste recycling in the utilization stage to the manufacturing in the next period. The carryover variables are depreciation of coal mining equipment (production stage) and depreciation of coal utilization equipment (utilization stage), connecting each manufacturing subsystem through time periods. Similarly, at the utilization stage, the waste gas emissions, wastewater discharge and solid waste generated connect manufacturing with waste recycling, and the amounts of wastewater and solid waste utilization feedback into the manufacturing subsystem of the next period.
Chang et al. [187] proposed a three-stage network structure by modeling the mining activity of each Chinese province as three subsystems sequentially, with a feedback loop from the last stage to the middle one. It represents the real sequence of processes: exploration, extraction and reclamation. Geological exploration, the first stage, takes exploration valid registered area licenses and exploration employees as inputs to generate exploration amount as a desirable output and illegal exploration cases as an undesirable output. The output of this stage is newly discovered mineral prospects, which links to the next stage. The second stage, mineral production, uses the mineral prospects from the first stage together with its own inputs, mining valid registered area licenses and mining employees, to produce crude ore production and output value of comprehensive use as desirable outputs, and illegal mining cases as an undesirable output. Production also produces a second link variable, the existing area of land destructed by mining. This is the intermediate link to the third stage. The third stage is land restoration. There are two outputs of the third stage: the restoration of mines and the restoration of mine area by combining the land destruction of the second stage and the mining environmental governance fund. This second output closes the loop of the network by feeding back into the second stage, as restored land flows back into the pool for future production. This feedback linkage is what gives the model its recycling character and differs from conventional two- stage models where restoration is an disconnected output.
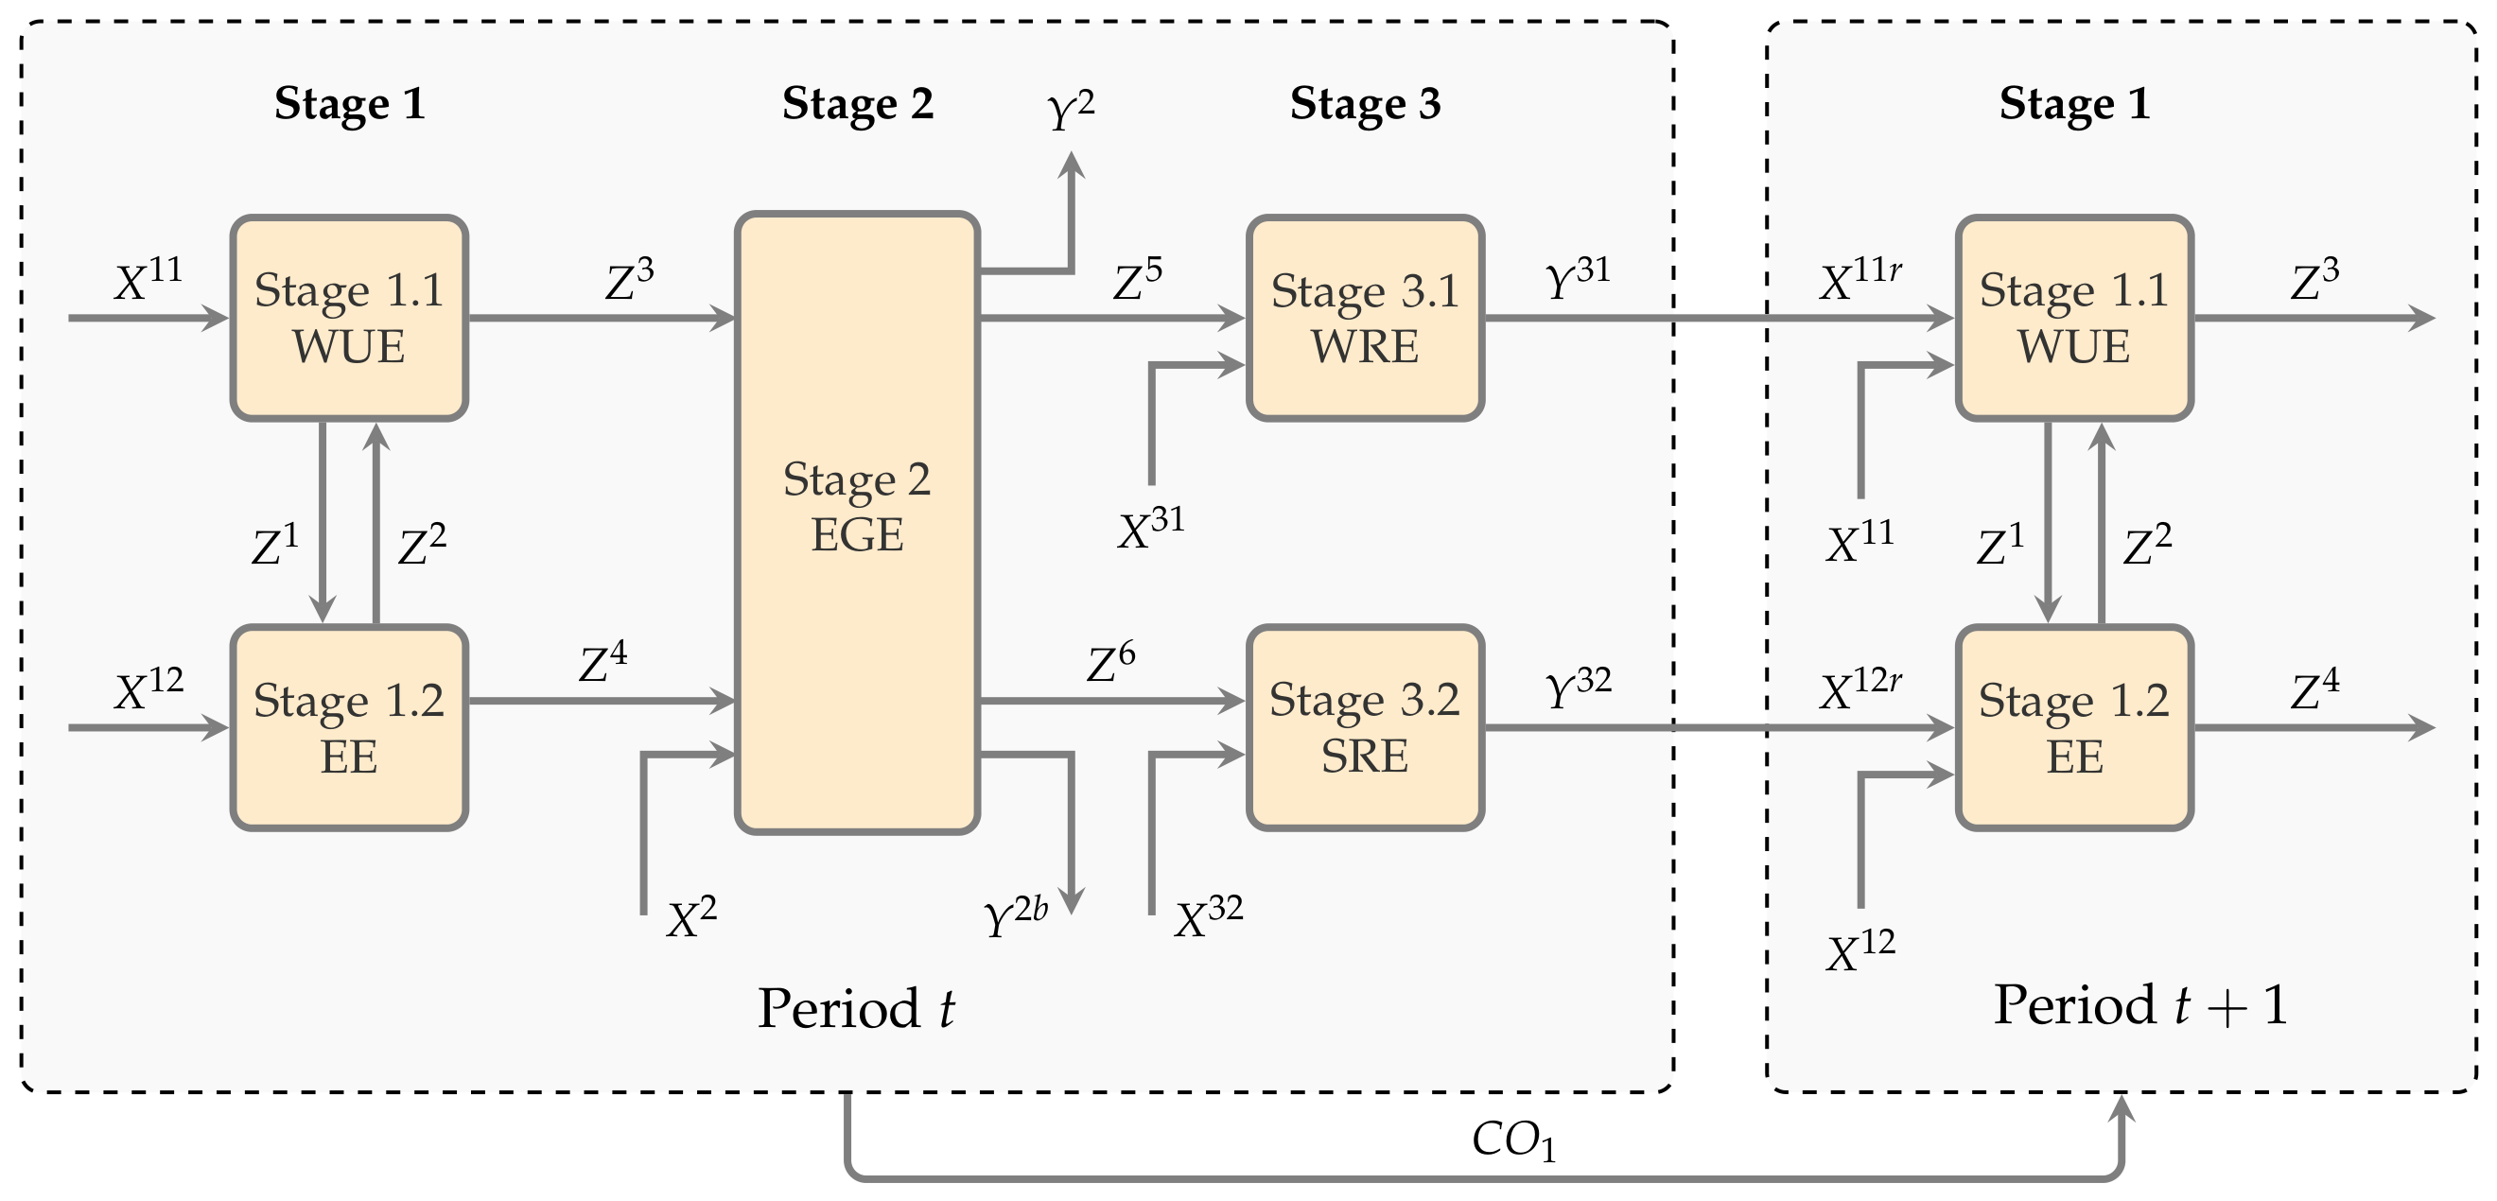
In the paper of Yang et al. [188], a parallel–sequential three-stage model is developed to represent China’s CE. The network structure unfolds in three subsequent stages that reflect the material and pollution flow of a real CE system. Two out of three stages are further decomposed in parallel subdivisions instead of a single linear chain. The scheme of this model is represented in Figure 16.
The first stage is production and is itself split into two parallel divisions, water use efficiency (WUE) and energy efficiency (EE), that reflect the simultaneous water and energy consumption in industrial activity. Each division uses its own input, with the water division using water sector labor X 11 and the energy division using energy sector labor X 12 , and each produces its own desirable output, total water consumption and energy consumption. The second stage represents environmental governance and is a single division, which receives inputs from both divisions of the first stage through link variables. The link variable Z 3 of industrial water flows from the water use division and the link variable Z 4 of hydroelectricity flows from the energy division are inputs into this stage. The governance stage itself takes environmental protection personnel as its input X 2 , produces GDP as a desirable output Y 2 , and produces waste gas emissions as an undesirable output Y 2 b at the same time. The third stage is recycling, which is divided into two parallel subdivisions, just like the first stage. They are wastewater recycling efficiency (WRE) and solid waste recycling efficiency (SRE). These subdivisions are fed with link variables that are transmitted from the governance stage. Wastewater emissions Z 5 are fed to the wastewater recycling subdivisions and industrial solid waste discharge Z 6 is fed to the solid waste recycling subdivisions. For each recycling subdivisions, a corresponding financial input (wastewater treatment investment X 31 for the former and industrial pollution control investment X 32 for the latter) and a desirable output (reuse of industrial water Y 31 for the former and integrated utilization of general industrial solid waste Y 32 for the latter) were also specified.
In this dynamic model, system outputs do not leave the system, but are redirected to the first-stage subdivisions of the next period. Recycled industrial water Y 31 is fed back into the water use division as X 11 r and recycled solid waste Y 32 is reused in the energy division as X 12 r . A carryover variable C O 1 , fixed asset investment, is used to model connections over periods.

5. Discussion and Future Research Directions

5.1. Discussion

In the previous section, we utilized the classic network DEA taxonomies established by pioneering scholars like Kao and Tone to structure our analysis of stage-quantity and multi-stage configurations. Rather than aiming to propose a novel mathematical classification framework, our goal was to map these standardized architectures directly onto the practical realities of the circular economy. Our synthesis reveals that as models progress from simple two-stage structures to complex general networks, their theoretical capacity to reflect the CE hierarchy increases. While open-loop multi-stage models merely separate production from waste treatment (still binding the analysis to R8/R9 steps), true closed-loop network architectures with feedback links allow researchers to capture internal resource recovery and circular feedback. Thus, the transition from generic single-stage to advanced network DEA models represents not just an increase in mathematical stages, but a methodological shift toward capturing the genuine complexity of closed-loop economic systems.
A review of the DEA literature has shown that traditional CCR and BCC currently lead in the CE performance measurement among other DEA models. From the point of view of efficiency measurement, these models typically measure efficiency radially by proportionally contracting inputs or increasing outputs. However, they do not allow for simultaneous input reductions and output increases. Non-radial models using SBM are based on slack variables that characterize input excess and output shortfall. SBM simultaneously takes into account both input and output factors, but it does not explicitly specify the proportions between input and output indicators. The DDF models provide additional flexibility by measuring efficiency in a given direction within the multidimensional input–output space. The chosen direction must be aligned with strategic sustainability goals. Thus, this measure provides a clearer understanding of how close the system is to achieving its targets. In the CE context, DDF models help to assess how effectively resources are reduced, simultaneously expanding recycling and recovery outputs. Measuring efficiency in network models is more complex because they combine multiple interconnected subsystems with distinct production possibility sets connected to each other through intermediates. The efficiency objective function should take into account production changes in each of the subsystems, which is more convenient for the SBM and DDF models, so non-radial efficiency measures are much more often used in network DEA models.
Currently, the most advanced DEA models for CE assessment are based on multi-stage and network approaches that explicitly consider the features inherent in CE. These include two-stage and multi-stage DEA models, which consist of a series of steps that reflect the sequential nature of CE processes such as production, waste collection, recycling and resource recovery. DEA network models make it possible to model interconnections and material flows between integrated subsystems, regardless of whether the subprocesses are organized sequentially or in parallel. Dynamic DEA models add a time dimension to performance measurement, which make it easier to analyze performance over multiple periods, evaluate changes over time and detect long-term effects, which are crucial for understanding the evolution of CE systems. Moreover, dynamic DEA models allow capturing for temporal effects and inter-period relationships, such as carryover of resources to subsequent time periods. Compared to the traditional DEA approach, these models offer obvious advantages. By taking into account the intertemporal transfer of resources, they provide a more realistic view of economic and environmental performance. On the other hand, network DEA models allow us to take into account the complex internal structure of the system and the interactions between subsystems, which helps to identify inefficiencies in each component of the system. They allow you to identify specific areas for improvement and develop strategies for targeted improvements that align with the dynamic and complex nature of CE processes. The dynamic network DEA models, considering the time dynamics and the interdependencies among systems, provide a significant improvement on the analytical capabilities and depth of the conventional models. They permit a more accurate, detailed and comprehensive evaluation of the performance of CE systems, which is vital for the development of effective sustainable development strategies and policies.
Figure 17 is constructed based on the actual data obtained as a result of the literature analysis and illustrates the evolution of research interests across DEA models of CE over recent years. The first publications on DEA models for CE performance measurement emerged as early as 2008. However, until 2018, research interest in the application of DEA within this context remained relatively restricted. Since then, there has been a consistent increase in the application of single-stage DEA models. Nevertheless, in recent years the number of CE studies employing these models has not experienced substantial growth. Regarding two-stage models, although two-stage DEA studies appeared in the literature between 2015 and 2017, sustained scholarly interest in these models appears to have begun only around 2020, with a visible upward trend persisting to the present. Advanced network models remain relatively scarce within the literature; nonetheless, since 2022, interest in this approach has been steadily increasing.
It is worth expecting that in the upcoming years, studies on the CE using two-stage models will surpass those using traditional single-stage DEA models. Moreover, due to the steady growth of research using the advanced network DEA models, we believe these will become the state-of-the-art approach in this field. Currently, the growth of such studies is constrained by the need for more detailed data for each stage and the lack of available software packages capable of performing these complex computations.
A review of empirical studies in general has revealed that when choosing DEA models, preference is often given not only to theoretical justification, but mainly due to practical limitations. In particular, the restricted availability of detailed data on intermediates and recycling processes has been identified as a significant barrier to the implementation of modern network models. Furthermore, the lack of readily available software tools [189] for solving complex problems related to network models often forces practical researchers to prefer simpler traditional DEA models, despite their limited ability to provide an accurate representation of the circular systems.

5.2. Future Research Directions

As a consequence of the literature review, we have identified the following potential research directions for DEA performance measurement of CE.
Expanding the scope of DEA models for assessing the CE. The DEA literature mainly defines DMUs for performance measurement based on the availability of suitable data. Most of the research is conducted at the national and international levels, as determined by the available public databases by countries (OECD database, Eurostat database) and regions (database of the National Bureau of Statistics of China, database of the Italian Institute for Environmental Protection and Research (ISPRA), database of the National System for the Declaration of Waste (SINADER) of Chile, etc.). Therefore, the investigation of local and municipal CE efficiency studies represents a potential research direction for the application of DEA models.
Combining DEA with other types of models. A significant area of research is developing new hybrid approaches that combine DEA with other methods to supplement empirical analysis. This integration improves the quality of modeling and identifies new aspects of the CE functioning. In the reviewed studies, the second-stage analysis is often carried out to identify the causes of inefficiency with the help of statistical methods. Regression models based on the Cobb–Douglas function are typically employed for this purpose, with the Tobit model of truncated regression being used for model estimation. Methods based on the Malmquist index, which allow evaluation productivity changes over time, are also popular in the presented studies. Meanwhile, although machine learning-based approaches have recently become popular [190,191,192], they are scarcely represented in the CE literature. We believe that combining DEA and machine learning approaches is a promising area for further research. This combination could significantly expand traditional DEA analysis by providing deeper insights, uncovering hidden patterns to optimize operational processes, and supporting decision-making by interpreting efficiency scores and providing practical suggestions.
Applying for empirical research network models with more complex structure. Currently, two-stage models are the most common type of network models. Typically, the first stage describes the production process, while the second stage relates to the recycling or disposal of waste in order to reduce unwanted emissions from production. However, this representation of circular systems is overly simplified, since processing various products usually occurs in parallel. Therefore, in general, circular systems generally have complex sequential–parallel structures. This review describes some models of these models. However, these models are rarely used in practice. In this regard, disseminating existing models and developing new advanced network models is one of the priority areas of future CE research.
Extending existing network models by incorporating shared inputs. Network DEA models applied in CE assessment, especially those with shared inputs, are still under-investigated. We hope to draw the attention of researchers to this important class of models. In two-stage network DEA models, resources can be reallocated between the production and recycling stages within a certain range. These models allow for a more accurate assessment of the effectiveness of circular network systems by considering the internal redistribution of resources within the system. A major problem for network DEA models with shared inputs is the absence of an a priori allocation mechanism of shared resources used by two or more substages at the same time. Two main modeling approaches have been developed to deal with this situation. The centralized approach assumes that the entire production network is optimized by a single controller, while the decentralized (non-cooperative) one assumes that the individual substages optimize their own efficiency with different optimality conditions. The application of centralized DEA models specifically designed for the optimal sharing of inputs in network systems is another promising extension [193]. Thus, developing and exploring new network models with shared inputs is a promising and valuable direction for future research.
The idea of resource reallocation can be extended not only between stages in a two-stage model but also in more complex network models. For example, the processing stage in the model proposed by Zhang et al. [179] considers three parallel subprocesses. Each of these subprocesses has as an input indicator of the capital investment in the respective waste treatment. From a pragmatic point of view, it is a very feasible proposition to include in the model the possibility of changing the distribution of this input among the treatment subprocesses. This improvement would result in more accurate efficiency estimates in the circular network model.

6. Conclusions

This review shows how DEA models for CE assessment have evolved from traditional single-stage efficiency measurement to more complex network-based structures that can represent the internal complexity of circular systems. In the early studies, conventional CCR, BCC, SBM and DDF models were mainly used for the evaluation of eco-efficiency and waste reduction, while recent studies have shown a clear tendency towards two-stage, dynamic and advanced multi-stage network DEA models, that better reflect the logic of circular resource flows.
The analysis confirms that CE processes cannot be adequately characterized as simple “black box” production systems. The transformation of waste into secondary resources, the interaction between production and treatment subsystems, feedback loops of recycled materials, and intertemporal carryover effects require explicit modeling of internal network structures. In this regard, dynamic two-stage DEA models currently represent the most mature and practically applicable methodological frontier, offering substantial advantages in evaluating both operational efficiency and long-term sustainability performance.
The review of variables used in CE-oriented DEA models also reveals a strong concentration on measurable indicators associated with lower-order circular strategies, particularly recycling and recovery (R8–R9). Inputs such as energy, water, labor, and capital, together with outputs such as GDP, recycling rates, and undesirable emissions, dominate the literature due to their statistical availability. In contrast, higher-order circular strategies such as refuse, repair, reuse and redesign are significantly underrepresented due to the lack of standardized, publicly available data. This involves a significant methodological bias since the DEA models often measure the efficiency of the waste management rather than the broader systemic transformation implied by the principles of the CE.
This study also contributes to the second research question. It shows that the choice of DEA models is often not based on theoretical appropriateness but on practical limitations. Limited access to detailed data on intermediate products and recycling processes significantly restricts the use of advanced network models. In addition, the absence of widely available software packages for solving complex network DEA problems often leads applied researchers to choose simpler traditional models, even when they provide a less accurate representation of the studied system.
Among advanced approaches, models with shared inputs appear to be particularly underexplored despite their strong practical relevance. In real circular systems, resources such as labor, capital, and energy are often jointly allocated between production and recycling stages, and allowing endogenous redistribution of these resources can significantly improve the realism of efficiency assessment. We believe that shared-input network DEA models deserve much greater attention in future research.
Future studies should therefore move in three main directions: expanding the application of DEA to new CE domains, combining multiple DEA extensions within unified hybrid models, and developing more advanced network structures that incorporate shared resources, feedback mechanisms, and dynamic intertemporal relationships. The increased use of survey-based data may also help to overcome limitations of official statistics and enable the inclusion of higher-order circular strategies that are largely invisible in the current empirical models.
In general, the future of CE efficiency assessment will shift from simple static models to comprehensive intelligent network DEA systems that are capable of capturing the true complexity of circular production and consumption processes. Such methodological advances are important for more accurate, policy-relevant and strategically useful assessments of sustainable development performance.

Supplementary Materials

The following supporting information can be downloaded at https://www.mdpi.com/article/10.3390/a19070585/s1: Table S1: Summary of selected articles for the review of DEA models for CE performance assessment.

Author Contributions

Conceptualization, A.V.L. and S.V.R.; methodology, A.V.L. and S.V.R.; software, A.V.L.; validation, A.V.L. and S.V.R.; formal analysis, A.V.L. and S.V.R.; investigation, A.V.L. and S.V.R.; resources, A.V.L. and S.V.R.; data curation, A.V.L.; writing—original draft preparation, A.V.L. and S.V.R.; writing—review and editing, A.V.L. and S.V.R.; visualization, A.V.L.; supervision, S.V.R. All authors have read and agreed to the published version of the manuscript.

Funding

This research received no external funding.

Institutional Review Board Statement

Not applicable.

Informed Consent Statement

Not applicable.

Data Availability Statement

The original contributions presented in this study are included in the article/Supplementary Materials. The raw data supporting the conclusions of this article will be made available by the authors on request.

Acknowledgments

The authors thank the journal editor and anonymous reviewers for their guidance and constructive feedback, which significantly improved the quality of this paper.

Conflicts of Interest

The authors declare no conflicts of interest.

Abbreviations

The following abbreviations are used in this manuscript:
ANAmmonia Nitrogen
BCCBanker, Charnes, Cooper
BoDBenefit of the Doubt
CCRCharnes, Cooper, Rhodes
CRSConstant Returns to Scale
CECircular Economy
CODChemical Oxygen Demand
DDFDirectional Distance Function
DEAData Envelopment Analysis
DMUDecision-Making Unit
EBMEpsilon-Based Measure
FDHFree Disposal Hull
GDPGross Domestic Product
GHGGreenhouse Gas
ICTInformation and Communication Technologies
MLPIMalmquist–Luenberger Productivity Index
MPIMalmquist Productivity Index
RAMRange-Adjusted Measure
SBMSlacks-Based Measure
SDGSustainable Development Goal
VRSVariable Returns to Scale

References

  1. Dehghani, M.; Azad, Z.; Erisian, Z.; Naeini, A.B.; Naeini, H.S.; Rahmani, A. Advancing sustainability through eco-design in the circular economy: A bibliometric analysis. Clean. Responsible Consum. 2026, 22, 100436. [Google Scholar] [CrossRef] [Scilit]
  2. Sewenet, A.D.; Boulaksil, Y.; Pisano, P. Circular economy, circularity, and sustainability: A systematic review and conceptual framework. Clean. Environ. Syst. 2026, 20, 100405. [Google Scholar] [CrossRef] [Scilit]
  3. Dadsena, K.K.; Rathore, P.; Mathiyazhagan, K.; Jayaraman, R.; Saha, E. Adoption of circular economy practices in supply chains to enhance firm performance: Industrial symbiosis and ecological modernization theory perspective. Int. J. Logist. Manag. 2026, 37, 755–785. [Google Scholar] [CrossRef] [Scilit]
  4. Barahmand, Z.; Wang, L.; Eikeland, M. Mapping the circular economy: Insights from 2,701 indicators. Clean. Environ. Syst. 2026, 20, 100392. [Google Scholar] [CrossRef] [Scilit]
  5. Rasor, A.; Vehmeyer, J.; Kirchberg, L.; Scholtysik, M.; Koldewey, C.; Dumitrescu, R. Key performance indicator system for evaluating the circular economy along the value chain. Procedia CIRP 2025, 135, 972–977. [Google Scholar] [CrossRef] [Scilit]
  6. Ferrante, M.; Vitti, M.; Sassanelli, C. The evolution of circular economy performance assessment: A systematic literature review. Renew. Sustain. Energy Rev. 2025, 217, 115757. [Google Scholar] [CrossRef] [Scilit]
  7. Ratner, S.V.; Lychev, A.V.; Muravleva, E.D.; Muravlev, D.M. Measuring Circular Economy with Data Envelopment Analysis: A Systematic Literature Review. Math. Comput. Appl. 2025, 30, 102. [Google Scholar] [CrossRef] [Scilit]
  8. Pearce, D.W.; Turner, R.K. Economics of Natural Resources and the Environment; Johns Hopkins University Press: Baltimore, MD, USA, 1990; p. 378. [Google Scholar]
  9. Petticrew, M.; Roberts, H. Systematic Reviews in the Social Sciences: A Practical Guide; John Wiley & Sons, Ltd.: Hoboken, NJ, USA, 2006. [Google Scholar] [CrossRef] [Scilit]
  10. Staples, M.; Niazi, M. Experiences using systematic review guidelines. J. Syst. Softw. 2007, 80, 1425–1437. [Google Scholar] [CrossRef] [Scilit]
  11. Garrido, S.; Rodríguez-Antón, J.; Amado, C.A.F.; Santos, S.; Dias, L.C. Development and application of a composite circularity index. J. Environ. Manag. 2023, 337, 117752. [Google Scholar] [CrossRef] [Scilit] [PubMed]
  12. Charnes, A.; Cooper, W.W.; Rhodes, E. Measuring the efficiency of decision making units. Eur. J. Oper. Res. 1978, 2, 429–444. [Google Scholar] [CrossRef] [Scilit]
  13. Banker, R.D.; Charnes, A.; Cooper, W.W. Some models for estimating technical and scale inefficiencies in data envelopment analysis. Manag. Sci. 1984, 30, 1078–1092. [Google Scholar] [CrossRef] [Scilit]
  14. Ratkovic, B.; Andrejic, M.; Vidovic, M. Measuring the efficiency of a healthcare waste management system in Serbia with data envelopment analysis. Waste Manag. Res. J. Sustain. Circ. Econ. 2011, 30, 635–638. [Google Scholar] [CrossRef] [Scilit] [PubMed]
  15. Pagotto, M.; Halog, A. Towards a circular economy in Australian agri-food industry: An application of input-output oriented approaches for analyzing resource efficiency and competitiveness potential. J. Ind. Ecol. 2016, 20, 1176–1186. [Google Scholar] [CrossRef] [Scilit]
  16. Callao, C.; Martinez-Nuñez, M.; Latorre, M.P. European Countries: Does common legislation guarantee better hazardous waste performance for European Union member states? Waste Manag. 2019, 84, 147–157. [Google Scholar] [CrossRef] [Scilit] [PubMed]
  17. Jiang, Z.; Ding, Z.; Zhang, H.; Cai, W.; Liu, Y. Data-driven ecological performance evaluation for remanufacturing process. Energy Convers. Manag. 2019, 198, 111844. [Google Scholar] [CrossRef] [Scilit]
  18. Fan, Y.; Fang, C. Circular economy development in China-current situation, evaluation and policy implications. Environ. Impact Assess. Rev. 2020, 84, 106441. [Google Scholar] [CrossRef] [Scilit]
  19. Taboada, G.L.; Seruca, I.; Sousa, C.; Pereira, Á. Exploratory data analysis and Data Envelopment Analysis of construction and Demolition Waste management in the European Economic Area. Sustainability 2020, 12, 4995. [Google Scholar] [CrossRef] [Scilit]
  20. Yuan, G.; Yang, Y.; Tian, G.; Zhuang, Q. Comprehensive evaluation of disassembly performance based on the ultimate cross-efficiency and extension-gray correlation degree. J. Clean. Prod. 2020, 245, 118800. [Google Scholar] [CrossRef] [Scilit]
  21. Llanquileo-Melgarejo, P.; Molinos-Senante, M.; Romano, G.; Carosi, L. Evaluation of the impact of separative collection and recycling of municipal solid waste on performance: An empirical application for Chile. Sustainability 2021, 13, 2022. [Google Scholar] [CrossRef] [Scilit]
  22. Ríos, A.M.; Picazo-Tadeo, A.J. Measuring environmental performance in the treatment of municipal solid waste: The case of the European Union-28. Ecol. Indic. 2021, 123, 107328. [Google Scholar] [CrossRef] [Scilit]
  23. Llanquileo-Melgarejo, P.; Molinos-Senante, M. Evaluation of economies of scale in eco-efficiency of municipal waste management: An empirical approach for Chile. Environ. Sci. Pollut. Res. 2021, 28, 28337–28348. [Google Scholar] [CrossRef] [Scilit] [PubMed]
  24. Volsuuri, E.; Owusu-Sekyere, E.; Zarouk Imoro, A.; Napoleon Bellua, S. Assessing the efficiency of solid waste collection services in urban Ghana. Waste Manag. Bull. 2023, 1, 71–81. [Google Scholar] [CrossRef] [Scilit]
  25. Ferraro, A.; Garofalo, A.; Marchesano, K. Measuring differences in efficiency in waste collection and disposal services from the EU targets in Campania municipalities. Environ. Ecol. Stat. 2023, 30, 81–101. [Google Scholar] [CrossRef] [Scilit]
  26. Maziotis, A.; Molinos-Senante, M. A comprenhesive Eco-efficiency analysis of wastewater treatment plants: Estimation of optimal operational costs and greenhouse gas emissions. Water Res. 2023, 243, 120354. [Google Scholar] [CrossRef] [Scilit] [PubMed]
  27. Huang, J.; Wen, J.; He, F. Research on evaluation of power battery recycling efficiency of new energy vehicle based on DEA. Ind. Eng. Innov. Manag. 2023, 6, 71–77. [Google Scholar] [CrossRef] [Scilit]
  28. Castellano, R.; De Bernardo, G.; Punzo, G. Sustainable well-being and sustainable consumption and production: An efficiency analysis of Sustainable Development Goal 12. Sustainability 2024, 16, 7535. [Google Scholar] [CrossRef] [Scilit]
  29. Sala-Garrido, R.; Mocholi-Arce, M.; Maziotis, A.; Molinos-Senante, M. Eco-efficiency approach in sustainable waste management: An uncertainty analysis for Chile. Environ. Sci. Policy 2024, 160, 103859. [Google Scholar] [CrossRef] [Scilit]
  30. das Mercês Costa, I.; Dias, M.F.; Robaina, M. Evaluation of the efficiency of urban solid waste management in Brazil by data envelopment analysis and possible variables of influence. Waste Dispos. Sustain. Energy 2024, 6, 283–295. [Google Scholar] [CrossRef] [Scilit]
  31. Guedes, W.P.; Ferreira, D.H.L.; Branchi, B.A. Proposal for an integrated model to assess municipal efficiency in managing sanitation and water risks. Environ. Dev. Sustain. 2025. [Google Scholar] [CrossRef] [Scilit]
  32. Tone, K. A slacks-based measure of efficiency in data envelopment analysis. Eur. J. Oper. Res. 2001, 130, 498–509. [Google Scholar] [CrossRef] [Scilit]
  33. Guo, X.; Zhu, Q.; Lv, L.; Chu, J.; Wu, J. Efficiency evaluation of regional energy saving and emission reduction in China: A modified slacks-based measure approach. J. Clean. Prod. 2017, 140, 1313–1321. [Google Scholar] [CrossRef] [Scilit]
  34. Castillo-Giménez, J.; Montañés, A.; Picazo-Tadeo, A.J. Performance and convergence in municipal waste treatment in the European Union. Waste Manag. 2019, 85, 222–231. [Google Scholar] [CrossRef] [Scilit] [PubMed]
  35. Zhou, J.; Zhang, R. Efficiency evaluation of industrial solid waste recycling utilization based on improved DEA model. IOP Conf. Ser. Earth Environ. Sci. 2019, 295, 032024. [Google Scholar] [CrossRef] [Scilit]
  36. Lu, C.; Zhang, Y.; Li, H.; Zhang, Z.; Cheng, W.; Jin, S.; Liu, W. An integrated measurement of the efficiency of China’s industrial circular economy and associated influencing factors. Mathematics 2020, 8, 1610. [Google Scholar] [CrossRef] [Scilit]
  37. Yao, C.; Liu, G.; Hao, X.; Liu, Y. Symbiotic integration of waste disposal capability within a city cluster: The case of the Yangtze River Delta. J. Environ. Manag. 2023, 330, 117166. [Google Scholar] [CrossRef] [Scilit] [PubMed]
  38. Rebolledo-Leiva, R.; Barros, M.V.; Entrena-Barbero, E.; Vásquez-Ibarra, L.; Fernández, M.; Feijoo, G.; Teresa Moreira, M.; González-García, S. Embedding Water-Energy-Food nexus and circularity assessment for organization benchmarking: A case study for dairy farms. Waste Manag. 2024, 189, 410–420. [Google Scholar] [CrossRef] [Scilit] [PubMed]
  39. Zhan, X.; Yi Man Li, R.; Xia, J. Inverted U-shape Impact of China’s Manufacturing Digitization on Low-carbon Environmental Governance Performance. Politi. Ekon. 2025, 73, 243–274. [Google Scholar] [CrossRef] [Scilit]
  40. Abulimiti, A.; Wang, X.; Ren, N. Exploring the pathway for the energy-environment synergistic WWTPs through comprehensive efficiency assessment. J. Water Process Eng. 2025, 76, 108269. [Google Scholar] [CrossRef] [Scilit]
  41. Krstic-Srejovic, A.; Mimović, P. Waste management efficiency within the circular economy framework: A macro-level SBM-DEA analysis of European countries with evidence from Serbia. J. Econ. Stud. 2026. ahead of print. [Google Scholar] [CrossRef] [Scilit]
  42. Cooper, W.W.; Park, K.S.; Pastor, J.T. RAM: A Range Adjusted Measure of Inefficiency for Use with Additive Models, and Relations to Other Models and Measures in DEA. J. Prod. Anal. 1999, 11, 5–42. [Google Scholar] [CrossRef] [Scilit]
  43. Expósito, A.; Velasco, F. Municipal solid-waste recycling market and the European 2020 Horizon Strategy: A regional efficiency analysis in Spain. J. Clean. Prod. 2018, 172, 938–948. [Google Scholar] [CrossRef] [Scilit]
  44. Sala-Garrido, R.; Mocholi-Arce, M.; Molinos-Senante, M.; Maziotis, A. Measuring technical, environmental and eco-efficiency in municipal solid waste management in Chile. Int. J. Sustain. Eng. 2022, 15, 71–85. [Google Scholar] [CrossRef] [Scilit]
  45. Huang, S. The impact of globalization on comprehensive environmental efficiency and its sub-stage efficiencies: An adjusted range adjusted measure network data envelopment analysis model approach. Environ. Prog. Sustain. Energy 2023, 42, e14121. [Google Scholar] [CrossRef] [Scilit]
  46. de Oliveira Frascareli, F.C.; Furlan, M.; Mariano, E.B.; Jugend, D. A macro-level circular economy index: Theoretical proposal and application in European Union countries. Environ. Dev. Sustain. 2024, 26, 18297–18331. [Google Scholar] [CrossRef] [Scilit]
  47. Tone, K.; Tsutsui, M. An epsilon-based measure of efficiency in DEA—A third pole of technical efficiency. Eur. J. Oper. Res. 2010, 207, 1554–1563. [Google Scholar] [CrossRef] [Scilit]
  48. Huang, K.Y.; Chang, T.H.; Chiu, Y.H.; Yang, C.Y.; Lin, T.Y. Considering climate change and regional differences: An efficiency assessment of coal mine use and land restoration. Nat. Resour. Forum 2023, 47, 578–601. [Google Scholar] [CrossRef] [Scilit]
  49. Feng, C.; Wu, F.; Zhang, C.; Wang, R.; Zhou, Y.; Ji, Y. Assessing provincial reclaimed water utilization efficiency and influencing factors. Environ. Dev. Sustain. 2025. [Google Scholar] [CrossRef] [Scilit]
  50. Andersen, P.; Petersen, N.C. A Procedure for Ranking Efficient Units in Data Envelopment Analysis. Manag. Sci. 1993, 39, 1261–1264. [Google Scholar] [CrossRef] [Scilit]
  51. Nazarko, J.; Chodakowska, E.; Nazarko, Ł. Evaluating the transition of the European Union member states towards a circular economy. Energies 2022, 15, 3924. [Google Scholar] [CrossRef] [Scilit]
  52. Lee, D.H. Production efficiency and economic benefit evaluation of biohydrogen produced using macroalgae as a biomass feedstock in Asian circular economies. Int. J. Hydrogen Energy 2022, 47, 40532–40551. [Google Scholar] [CrossRef] [Scilit]
  53. Molinos-Senante, M.; Maziotis, A.; Sala-Garrido, R.; Mocholí-Arce, M. Factors influencing eco-efficiency of municipal solid waste management in Chile: A double-bootstrap approach. Waste Manag. Res. J. Sustain. Circ. Econ. 2023, 41, 457–466. [Google Scholar] [CrossRef] [Scilit] [PubMed]
  54. Banjerdpaiboon, A.; Limleamthong, P. Assessment of national circular economy performance using super-efficiency dual data envelopment analysis and Malmquist productivity index: Case study of 27 European countries. Heliyon 2023, 9, e16584. [Google Scholar] [CrossRef] [Scilit] [PubMed]
  55. Rezaie, B.; Javadian, N.; Kazemi, M. The customer-based supplier selection and order allocation problem based on the waste management and resilience dimensions: A data-driven approach. Eng. Appl. Artif. Intell. 2025, 153, 110692. [Google Scholar] [CrossRef] [Scilit]
  56. Marjanović, I.; Stanković, J.J.; Östh, J.; Marković, M.; Stanojević, M. Insight into territorial efficiency of circular economy through data envelopment analysis. Front. Environ. Sci. 2025, 13, 1494184. [Google Scholar] [CrossRef] [Scilit]
  57. Liu, X.; Guo, P.; Guo, S. Assessing the eco-efficiency of a circular economy system in China’s coal mining areas: Emergy and data envelopment analysis. J. Clean. Prod. 2019, 206, 1101–1109. [Google Scholar] [CrossRef] [Scilit]
  58. Yan, D.; Kong, Y.; Ye, B.; Shi, Y.; Zeng, X. Spatial variation of energy efficiency based on a Super-Slack-Based Measure: Evidence from 104 resource-based cities. J. Clean. Prod. 2019, 240, 117669. [Google Scholar] [CrossRef] [Scilit]
  59. Chen, Y.; Liu, L. Improving eco-efficiency in coal mining area for sustainability development: An emergy and super-efficiency SBM-DEA with undesirable output. J. Clean. Prod. 2022, 339, 130701. [Google Scholar] [CrossRef] [Scilit]
  60. Gu, Z.; Tian, C.; Zheng, Z.; Zhang, S. Favorable fiscal self-sufficiency enables local governments to better improve the environmental governance—Evidence from China’s lower-pollution areas. Sustainability 2022, 14, 16202. [Google Scholar] [CrossRef] [Scilit]
  61. Zhang, L.; Yang, S.; Dong, Z. Evaluating disparities and convergence of financial support efficiency for resource recycling industry in China. J. Clean. Prod. 2023, 398, 136655. [Google Scholar] [CrossRef] [Scilit]
  62. Wang, M.; Yang, C.; Deng, M.; Tao, J.; Jing, X.; Zhao, C. Spatial-temporal differentiation of coupling coordination degree for green finance and green innovation efficiency: A case study in China. Environ. Sci. Pollut. Res. 2023, 30, 70621–70635. [Google Scholar] [CrossRef] [Scilit] [PubMed]
  63. Chen, P. The spatial impacts of the circular economy on carbon intensity—New evidence from the super-efficient SBM-DEA model. Energy Environ. 2024, 35, 47–63. [Google Scholar] [CrossRef] [Scilit]
  64. Han, X.; Zhang, X.; Lei, H. Analysis of the spatial association network structure of water-intensive utilization efficiency and its driving factors in the Yellow River Basin. Ecol. Indic. 2024, 158, 111400. [Google Scholar] [CrossRef] [Scilit]
  65. Chen, Q.; Chen, P.; Chu, Z. Riddled with challenges: Are zero-waste cities transitioning to circular economies? Insights from Chinese cities. J. Environ. Manag. 2025, 385, 125662. [Google Scholar] [CrossRef] [Scilit] [PubMed]
  66. Jin, B.; Li, W. Spatial Effects and Driving Factors of Consumption Upgrades on Municipal Solid Waste Eco-Efficiency, Considering Emission Outputs. Sustainability 2025, 17, 2356. [Google Scholar] [CrossRef] [Scilit]
  67. Li, S.; Zhang, Y.; Xie, Y. Spatiotemporal Evolution and Influencing Factors of Agricultural Biomass Recycling Efficiency Based on a Three-Stage Super-Efficiency SBM Model. Sustainability 2026, 18, 3050. [Google Scholar] [CrossRef] [Scilit]
  68. Shang, Y.; Song, M.; Zhao, X. The development of China’s Circular Economy: From the perspective of environmental regulation. Waste Manag. 2022, 149, 186–198. [Google Scholar] [CrossRef] [Scilit] [PubMed]
  69. Chambers, R.G.; Chung, Y.; Färe, R. Benefit and Distance Functions. J. Econ. Theory 1996, 70, 407–419. [Google Scholar] [CrossRef] [Scilit]
  70. Chambers, R.G.; Chung, Y.; Färe, R. Profit, Directional Distance Functions, and Nerlovian Efficiency. J. Optim. Theory Appl. 1998, 98, 351–364. [Google Scholar] [CrossRef] [Scilit]
  71. Luenberger, D.G. Benefit functions and duality. J. Math. Econ. 1992, 21, 461–481. [Google Scholar] [CrossRef] [Scilit]
  72. Färe, R.; Grosskopf, S. Theory and Application of Directional Distance Functions. J. Prod. Anal. 2000, 13, 93–103. [Google Scholar] [CrossRef] [Scilit]
  73. Yang, H.; Zhang, S.; Ye, W.; Qin, Y.; Xu, M.; Han, L. Emission reduction benefits and efficiency of e-waste recycling in China. Waste Manag. 2020, 102, 541–549. [Google Scholar] [CrossRef] [Scilit] [PubMed]
  74. Delgado-Antequera, L.; Gémar, G.; Molinos-Senante, M.; Gómez, T.; Caballero, R.; Sala-Garrido, R. Eco-efficiency assessment of municipal solid waste services: Influence of exogenous variables. Waste Manag. 2021, 130, 136–146. [Google Scholar] [CrossRef] [Scilit] [PubMed]
  75. Llanquileo-Melgarejo, P.; Molinos-Senante, M. The impact of recycling on the productivity of Municipal Solid Waste: A comparison of the Malmquist and Malmquist–Luenberger Productivity Indexes. Int. J. Sustain. Eng. 2023, 16, 236–247. [Google Scholar] [CrossRef] [Scilit]
  76. Daraio, C.; Di Leo, S.; Simar, L. Viable eco-efficiency targets for waste collection communities. Sci. Rep. 2024, 14, 15038. [Google Scholar] [CrossRef] [Scilit] [PubMed]
  77. lo Storto, C. Measuring ecoefficiency of municipal solid waste management in Apulia to account for governance heterogeneities. Clean. Waste Syst. 2024, 7, 100131. [Google Scholar] [CrossRef] [Scilit]
  78. lo Storto, C. Evaluating the Eco-Efficiency of Municipal Solid Waste Management: Determinants, Paradoxes, and Trade-Offs. Urban Sci. 2025, 9, 395. [Google Scholar] [CrossRef] [Scilit]
  79. Mocholi-Arce, M.; Sala-Garrido, R.; Molinos-Senante, M.; Maziotis, A. A comprehensive evaluation of eco-productivity of the municipal solid waste service in Chile. Front. Environ. Sci. Eng. 2025, 19, 11. [Google Scholar] [CrossRef] [Scilit]
  80. Hernández-Chover, V.; Castellet-Viciano, L.; Fuentes, R.; Hernández-Sancho, F. Circular economy and efficiency to ensure the sustainability in the wastewater treatment plants. J. Clean. Prod. 2023, 384, 135563. [Google Scholar] [CrossRef] [Scilit]
  81. Lin, H.Y.; Rijal, S. Comparative study of eco-performance evaluation for municipal solid waste management practices. Int. J. Appl. Sci. Eng. 2024, 21, 2022363. [Google Scholar] [CrossRef] [Scilit]
  82. Romano, G.; Molinos-Senante, M. Factors affecting eco-efficiency of municipal waste services in Tuscan municipalities: An empirical investigation of different management models. Waste Manag. 2020, 105, 384–394. [Google Scholar] [CrossRef] [Scilit] [PubMed]
  83. Romano, G.; Molinos-Senante, M.; Carosi, L.; Llanquileo-Melgarejo, P.; Sala-Garrido, R.; Mocholi-Arce, M. Assessing the dynamic eco-efficiency of Italian municipalities by accounting for the ownership of the entrusted waste utilities. Util. Policy 2021, 73, 101311. [Google Scholar] [CrossRef] [Scilit]
  84. Marques, R.C.; Simões, P.; Pinto, F.S. Tariff regulation in the waste sector: An unavoidable future. Waste Manag. 2018, 78, 292–300. [Google Scholar] [CrossRef] [Scilit] [PubMed]
  85. Song, X.; Zhou, Y.; Jia, W. How do economic openness and R&D investment affect green economic growth?—Evidence from China. Resour. Conserv. Recycl. 2019, 146, 405–415. [Google Scholar] [CrossRef] [Scilit]
  86. Halkos, G.; Petrou, K.N. Assessing 28 EU member states’ environmental efficiency in national waste generation with DEA. J. Clean. Prod. 2019, 208, 509–521. [Google Scholar] [CrossRef] [Scilit]
  87. Gastaldi, M.; Lombardi, G.V.; Rapposelli, A.; Romano, G. The efficiency of waste sector in Italy: An application by Data Envelopment Analysis. Environ. Clim. Technol. 2020, 24, 225–238. [Google Scholar] [CrossRef] [Scilit]
  88. Lombardi, G.V.; Gastaldi, M.; Rapposelli, A.; Romano, G. Assessing efficiency of urban waste services and the role of tariff in a circular economy perspective: An empirical application for Italian municipalities. J. Clean. Prod. 2021, 323, 129097. [Google Scholar] [CrossRef] [Scilit]
  89. Marques, A.C.; Teixeira, N.M. Assessment of municipal waste in a circular economy: Do European Union countries share identical performance? Clean. Waste Syst. 2022, 3, 100034. [Google Scholar] [CrossRef] [Scilit]
  90. Wang, N.; Chai, X.; Guo, Z.; Guo, C.; Liu, J.; Zhang, J. Hierarchy performance assessment of industrial solid waste utilization—Tracking resource recycling and utilization centers in China. Environ. Sci. Pollut. Res. 2023, 30, 83330–83340. [Google Scholar] [CrossRef] [Scilit] [PubMed]
  91. Fu, D.; Huang, Y.; Li, M.; Wang, C. Research on the Measurement of Ecological Performance Levels and Influencing Factors in the Yangtze River Delta Region. Int. Core J. Eng. 2023, 9, 230–238. [Google Scholar] [CrossRef]
  92. Chioatto, E.; Khan, M.A.; Sospiro, P. Sustainable solid waste management in the European Union: Four countries regional analysis. Sustain. Chem. Pharm. 2023, 33, 101037. [Google Scholar] [CrossRef] [Scilit]
  93. Radovanov, B.; Marcikić-Horvat, A.; Stojić, D.; Sedlak, O.; Bobera, D. Assessing circular economy performance of European countries and Serbia using data envelopment analysis. Eur. J. Appl. Econ. 2023, 20, 1–11. [Google Scholar] [CrossRef] [Scilit]
  94. D’Adamo, I.; Daraio, C.; Di Leo, S.; Gastaldi, M.; Rossi, E.N. Driving EU sustainability: Promoting the circular economy through municipal waste efficiency. Sustain. Prod. Consum. 2024, 50, 462–474. [Google Scholar] [CrossRef] [Scilit]
  95. Lingjuan, T.; Hongjuan, Y. Evolution characteristics and influencing factors of the human-earth system in minority areas of Yunnan, China. J. Resour. Ecol. 2024, 15, 372–384. [Google Scholar] [CrossRef] [Scilit]
  96. Wang, X.; Zhou, H.; Liu, J. Measurement and coupling analysis of the efficiency of resource-based treatment of municipal solid waste in Chengdu–Chongqing area. Energy Sci. Eng. 2024, 12, 4641–4661. [Google Scholar] [CrossRef] [Scilit]
  97. Óskarsson, G.K.; Agnarsson, S.; Davíðsdóttir, B. Evaluating municipal solid waste management efficiency in Iceland: A data envelopment analysis of socioeconomic and geographic influences. Environ. Sustain. Indic. 2025, 26, 100676. [Google Scholar] [CrossRef] [Scilit]
  98. Jiang, Y.; Song, H.; Ampaw, E.M. Evaluating Circular Economy Efficiency in Western China’s Logistics Industry Using Slack-Based Measure. J. Knowl. Econ. 2026, 17, 563–586. [Google Scholar] [CrossRef] [Scilit]
  99. Ekici, F.; Orhan, İ. Environmental Efficiency of Global Airports: Integrating Emission Reduction and Waste Recycling Performance. Int. J. Chem. Technol. 2025, 9, 344–352. [Google Scholar] [CrossRef] [Scilit]
  100. Caetano, R.V.; Marques, A.M.C.; Afonso, T.L. Circularity in waste management system: An assessment of the recycling rate performance of developing countries. Environ. Dev. Sustain. 2025. [Google Scholar] [CrossRef] [Scilit]
  101. Gobbi, C.N.; Sanches, V.M.L.; Guimarães, M.J.d.O.C.; Freitas, M.A.V.d.; Pacheco, E.B.A.V. Efficiency in the environmental management of plastic wastes at Brazilian ports based on data envelopment analysis. Mar. Pollut. Bull. 2019, 142, 377–383. [Google Scholar] [CrossRef] [Scilit] [PubMed]
  102. Lacko, R.; Hajduová, Z.; Zawada, M. The efficiency of circular economies: A comparison of Visegrád Group countries. Energies 2021, 14, 1680. [Google Scholar] [CrossRef] [Scilit]
  103. Gupta, N.; Vishwakarma, A. Multi-level data envelopment approach for performance evaluation of MSW generated in urban area of Madhya Pradesh, India. Pol. J. Environ. Stud. 2023, 32, 3577–3589. [Google Scholar] [CrossRef] [Scilit] [PubMed]
  104. Ji, L.; Sun, Y.; Liu, J.; Chiu, Y.H. Analysis of the circular economy efficiency of China’s industrial wastewater and solid waste—Based on a comparison before and after the 13th Five-Year Plan. Sci. Total Environ. 2023, 881, 163435. [Google Scholar] [CrossRef] [Scilit] [PubMed]
  105. Halkos, G.E.; Moll de Alba, J.; Aslanidis, P.S.C.; Bampatsou, C. Monitoring Eco-Efficiency and Its Convergence Towards Sustainability in the European Rubber and Plastics Industry Through Circular Economy Transition. Sustainability 2025, 17, 1272. [Google Scholar] [CrossRef] [Scilit]
  106. Halkos, G.E.; Moll de Alba, J.; Aslanidis, P.S.C. Examining Energy and Carbon Intensity of the European Fashion Industry: A Hybrid DEA Analysis for Circular Economy. Circ. Econ. Sustain. 2025, 5, 921–948. [Google Scholar] [CrossRef] [Scilit]
  107. Wu, H.q.; Shi, Y.; Xia, Q.; Zhu, W.d. Effectiveness of the policy of circular economy in China: A DEA-based analysis for the period of 11th five-year-plan. Resour. Conserv. Recycl. 2014, 83, 163–175. [Google Scholar] [CrossRef] [Scilit]
  108. Pais-Magalhães, V.; Moutinho, V.; Marques, A.C. Scoring method of eco-efficiency using the DEA approach: Evidence from European waste sectors. Environ. Dev. Sustain. 2021, 23, 9726–9748. [Google Scholar] [CrossRef] [Scilit]
  109. Osińska, M. The determinants of municipal solid waste management efficiency in EU countries. Econ. Environ. 2024, 88, 637. [Google Scholar] [CrossRef] [Scilit]
  110. Gabrielyan, B.; Kesoyan, N.; Ghazaryan, A.; Artashyan, A. Measuring comparative eco-efficiency in the Eurasian Economic Union using MaxDEA X 12.2 software. Appl. Comput. Sci. 2025, 21, 98–109. [Google Scholar] [CrossRef] [Scilit]
  111. Campoli, J.S.; Kodama, T.K.; Nagano, M.S.; Burnquist, H.L. Progress of G20 Nations on the 6th Sustainable Development Goal Under the Circular Economy Perspective. J. Knowl. Econ. 2025, 16, 16966–16995. [Google Scholar] [CrossRef] [Scilit]
  112. Campoli, J.S.; Nagano, M.S.; Kodama, T.K.; Burnquist, H.L. Advancing the 15th SDG: G20 Nations’ Progress in Protecting Life on Land Through Circular Economy Strategies. Bus. Strategy Dev. 2025, 8, e70141. [Google Scholar] [CrossRef] [Scilit]
  113. Meleddu, M.; Vecco, M.; Mazzanti, M. The role of voluntary environmental policies towards achieving circularity. Ecol. Econ. 2024, 219, 108134. [Google Scholar] [CrossRef] [Scilit]
  114. De Jaeger, S.; Rogge, N. Waste pricing policies and cost-efficiency in municipal waste services: The case of Flanders. Waste Manag. Res. J. A Sustain. Circ. Econ. 2013, 31, 751–758. [Google Scholar] [CrossRef] [Scilit] [PubMed]
  115. Mavi, N.K.; Mavi, R.K. Energy and environmental efficiency of OECD countries in the context of the circular economy: Common weight analysis for malmquist productivity index. J. Environ. Manag. 2019, 247, 651–661. [Google Scholar] [CrossRef] [Scilit] [PubMed]
  116. Xu, X.; Zhou, Q.; Chen, X.; Li, Y.; Jiang, Y. The efficiency of green technology innovation and its influencing factors in wastewater treatment companies. Separations 2022, 9, 263. [Google Scholar] [CrossRef] [Scilit]
  117. Xiao, L.; Ye, H.; Xu, S.; Lin, T. Assessment of waste management efficiency using subjective and objective indicators in 26 major Chinese cities. Ecosyst. Health Sustain. 2023, 9, 0024. [Google Scholar] [CrossRef] [Scilit]
  118. Sajadifar, S.; Karimi, B.; Mogouie, H.; Dolatshahi, H.; Sajadifar, S.A. Enhancing Data Envelopment Analysis (DEA) for Incorporating Energy Recycling in Circular Economy. Circ. Econ. Sustain. 2025, 5, 3073–3094. [Google Scholar] [CrossRef] [Scilit]
  119. Szaruga, E.; Czermański, E.; Kotowska, I.; Oniszczuk-Jastrząbek, A.; Pluciński, M. Evaluation of transshipment productivity through the implementation of the Malmquist DEA method. Evidence from circular cargo handling in Polish seaports. Econ. Environ. 2025, 94, 1085. [Google Scholar] [CrossRef] [Scilit]
  120. Álvarez, I.; Expósito, A.; Sánchez, D.; Velasco, F. Closing the loop? Assessing efficiency in advancing circular economy transitions in the EU-27 countries. J. Clean. Prod. 2026, 551, 147937. [Google Scholar] [CrossRef] [Scilit]
  121. Llanquileo-Melgarejo, P.; Molinos-Senante, M. Assessing eco-productivity change in Chilean municipal solid waste services. Util. Policy 2022, 78, 101410. [Google Scholar] [CrossRef] [Scilit]
  122. Li, H.; Lu, C.C.; Yang, C.Y.; Chung, Y.C. Evaluating the resource recovery efficiency of garbage removal and disposal in Taiwan. Waste Manag. Res. J. Sustain. Circ. Econ. 2024, 42, 569–582. [Google Scholar] [CrossRef] [Scilit] [PubMed]
  123. Li, X.N.; Feng, Y.; Chiu, Y.H.; Lin, T.Y.; Chiu, S.Y. Recycling water and sludge disposal efficiency in China’s sewage treatment industry. Manag. Decis. Econ. 2021, 42, 1703–1717. [Google Scholar] [CrossRef] [Scilit]
  124. Ren, F.R.; Chen, K.J.; Tian, Z.; Zhang, Y. The investment and treatment efficiencies of industrial solid waste in China’s Yangtze and non-Yangtze River Economic Belts. J. Mater. Cycles Waste Manag. 2022, 24, 900–916. [Google Scholar] [CrossRef] [Scilit]
  125. Ratner, S.V.; Lychev, A.V.; Krivonozhko, V.E.; Balashova, S.A. Governmental effectiveness in the transition to a circular economy: Dynamic DEA model. Unconv. Resour. 2025, 6, 100161. [Google Scholar] [CrossRef] [Scilit]
  126. Barbosa, A.; Gonçalves, T.J.d.C.; Simões, P. Improving Municipal Solid Waste Services: Insights into Efficiency, Productivity, and Recycling in Brazil. Sustainability 2025, 17, 2519. [Google Scholar] [CrossRef] [Scilit]
  127. Wang, S.; Lei, L.; Xing, L. Urban circular economy performance evaluation: A novel fully fuzzy data envelopment analysis with large datasets. J. Clean. Prod. 2021, 324, 129214. [Google Scholar] [CrossRef] [Scilit]
  128. Wang, H.F.; Hu, C.F. Carbon emission abatement allocation of a recycling production system in a fuzzy environment. J. Uncertain. Syst. 2022, 15, 2243005. [Google Scholar] [CrossRef] [Scilit]
  129. Huang, H.C.; Liu, F.B.; Hu, C.F. A slacks-based measure approach for efficiency measurement of recycling production systems with imprecise data. J. Math. 2022, 2022, 4909856. [Google Scholar] [CrossRef] [Scilit]
  130. Melyn, W.; Moesen, W. Towards a Synthetic Indicator of Macroeconomic Performance: Unequal Weighting When Limited Information Is Available; Public Economics Discussion Paper 17; Center for Economic Studies, Katholieke Universiteit Leuven: Leuven, Belgium, 1991. [Google Scholar]
  131. Cherchye, L.; Moesen, W.; Rogge, N.; Puyenbroeck, T.V. An Introduction to ‘Benefit of the Doubt’ Composite Indicators. Soc. Indic. Res. 2007, 82, 111–145. [Google Scholar] [CrossRef] [Scilit]
  132. Elia, V.; Gnoni, M.G.; Tornese, F. Measuring circular economy strategies through index methods: A critical analysis. J. Clean. Prod. 2017, 142, 2741–2751. [Google Scholar] [CrossRef] [Scilit]
  133. Claudio-Quiroga, G.; Poza, C. Measuring the circular economy in Europe: Big differences among countries, great opportunities to converge. Sustain. Dev. 2024, 32, 4707–4725. [Google Scholar] [CrossRef] [Scilit]
  134. Drofenik, J.; Seljak, T.; Novak Pintarič, Z. A multi-level approach to circular economy progress: Linking national targets with corporate implementation. J. Clean. Prod. 2025, 493, 144902. [Google Scholar] [CrossRef] [Scilit]
  135. Brando, R.M.; Ardi, R. Circular economy index evaluation: Global trends and applications in developing countries. Environ. Prog. Sustain. Energy 2026, 45, e70177. [Google Scholar] [CrossRef] [Scilit]
  136. Milanović, T.; Savić, G.; Martić, M.; Milanović, M.; Petrović, N. Development of the waste management composite index using DEA method as circular economy indicator: The case of European Union countries. Pol. J. Environ. Stud. 2022, 31, 771–784. [Google Scholar] [CrossRef] [Scilit] [PubMed]
  137. Chioatto, E.; Fedele, A.; Ciro Liscio, M.; Sospiro, P. Testing data envelopment analysis models on the performance of European Union regions in sustainable waste management. Waste Manag. 2024, 175, 170–182. [Google Scholar] [CrossRef] [Scilit] [PubMed]
  138. Molinos-Senante, M.; Maziotis, A.; Sala-Garrido, R. Estimating the eco-efficiency of urban waste services towards sustainable waste management. Sustain. Dev. 2024, 32, 5677–5691. [Google Scholar] [CrossRef] [Scilit]
  139. Karsak, E.E.; Ucar, E. Circular economy performance assessment of countries using a common-weight DEA-based approach. Environ. Dev. Sustain. 2025, 27, 30995–31013. [Google Scholar] [CrossRef] [Scilit]
  140. Bellver-Domingo, Á.; Fuentes, R.; Hernández-Sancho, F.; Carmona, E.; Picó, Y.; Hernández-Chover, V. MCDA-DEA approach to construct a composite indicator for effluents from WWTPs considering the influence of PPCPs. Environ. Sci. Pollut. Res. 2023, 30, 47234–47247. [Google Scholar] [CrossRef] [Scilit] [PubMed]
  141. Wang, M.; Huang, Y.; Li, D. Assessing the performance of industrial water resource utilization systems in China based on a two-stage DEA approach with game cross efficiency. J. Clean. Prod. 2021, 312, 127722. [Google Scholar] [CrossRef] [Scilit]
  142. Martínez, J.M.G.; Puertas, R.; Martín, J.M.M.; Ribeiro-Soriano, D. Digitalization, innovation and environmental policies aimed at achieving sustainable production. Sustain. Prod. Consum. 2022, 32, 92–100. [Google Scholar] [CrossRef] [Scilit]
  143. Huang, H.C.; Liu, F.B.; Hu, C.K.; Hu, C.F. Efficiency measurement of the water recycling system in a fuzzy environment. Sustain. Water Resour. Manag. 2024, 10, 124. [Google Scholar] [CrossRef] [Scilit]
  144. Ding, L.L.; Lei, L.; Wang, L.; Zhang, L.F. Assessing industrial circular economy performance and its dynamic evolution: An extended Malmquist index based on cooperative game network DEA. Sci. Total Environ. 2020, 731, 139001. [Google Scholar] [CrossRef] [Scilit] [PubMed]
  145. Ding, L.L.; Lei, L.; Wang, L.; Zhang, L.F.; Calin, A.C. A novel cooperative game network DEA model for marine circular economy performance evaluation of China. J. Clean. Prod. 2020, 253, 120071. [Google Scholar] [CrossRef] [Scilit]
  146. Sun, J.; Li, G.; Wang, Z. Technology heterogeneity and efficiency of China’s circular economic systems: A game meta-frontier DEA approach. Resour. Conserv. Recycl. 2019, 146, 337–347. [Google Scholar] [CrossRef] [Scilit]
  147. Liu, F.B.; Hu, C.F. Fuzzy game approach network data envelopment analysis models for the waste management performance evaluation. Int. J. Fuzzy Syst. 2023, 25, 3193–3203. [Google Scholar] [CrossRef] [Scilit]
  148. Tavassoli, M.; Farzipoor Saen, R. Game theory meets circular economy and sustainability: Bargaining game range adjusted measure unleashed. Socio-Econ. Plan. Sci. 2025, 102, 102341. [Google Scholar] [CrossRef] [Scilit]
  149. Struk, M.; Bod’a, M. Factors influencing performance in municipal solid waste management—A case study of Czech municipalities. Waste Manag. 2022, 139, 227–249. [Google Scholar] [CrossRef] [Scilit] [PubMed]
  150. Wu, J.; Zhu, Q.; Chu, J.; Liang, L. Two-stage network structures with undesirable intermediate outputs reused: A DEA based approach. Comput. Econ. 2015, 46, 455–477. [Google Scholar] [CrossRef] [Scilit]
  151. Yadollahi, A.H.; Ebrahimnejad, A.; Kazemi Matin, R. Centralized resource reallocation in two-stage network structures with undesirable products. Comput. Appl. Math. 2022, 41, 228. [Google Scholar] [CrossRef] [Scilit]
  152. Wu, J.; Huang, D.; Zhou, Z.; Zhu, Q. The regional green growth and sustainable development of China in the presence of sustainable resources recovered from pollutions. Ann. Oper. Res. 2020, 290, 27–45. [Google Scholar] [CrossRef] [Scilit]
  153. Liu, D.; Liu, T.; Zheng, Y.; Zhang, Q. The construction efficiency study of China National Ecological Civilization Pilot Zone with network SBM model: A city-based analysis. Environ. Sci. Pollut. Res. 2023, 30, 47685–47698. [Google Scholar] [CrossRef] [Scilit] [PubMed]
  154. Zou, W.; Yang, Y.; Yang, M.; Zhang, X.; Lai, S.; Chen, H. Analyzing efficiency measurement and influencing factors of China’s marine green economy: Based on a two-stage network DEA model. Front. Mar. Sci. 2023, 10, 1020373. [Google Scholar] [CrossRef] [Scilit]
  155. Qin, J.; Wang, M. Assessing the performance of industrial water resource systems in China with total constraints on water consumption and pollution emissions. Environ. Sci. Pollut. Res. 2023, 30, 110251–110279. [Google Scholar] [CrossRef] [Scilit] [PubMed]
  156. Hu, J.L.; Honma, S.; Chang, T.M. Recycling efficiencies in Japan’s administrative regions: Findings from network data envelopment analysis. Circ. Econ. Sustain. 2024, 4, 1–21. [Google Scholar] [CrossRef] [Scilit]
  157. Li, D.; Wang, M.Q.; Lee, C. The waste treatment and recycling efficiency of industrial waste processing based on two-stage data envelopment analysis with undesirable inputs. J. Clean. Prod. 2020, 242, 118279. [Google Scholar] [CrossRef] [Scilit]
  158. Maghbouli, M.; Amirteimoori, A.; Kordrostami, S. Two-stage network structures with undesirable outputs: A DEA based approach. Measurement 2014, 48, 109–118. [Google Scholar] [CrossRef] [Scilit]
  159. Shi, X.; Emrouznejad, A.; Yu, W. Overall efficiency of operational process with undesirable outputs containing both series and parallel processes: A SBM network DEA model. Expert Syst. Appl. 2021, 178, 115062. [Google Scholar] [CrossRef] [Scilit]
  160. Xia, Q.; Li, M.; Wu, H.; Lu, Z. Does the Central Government’s environmental policy work? Evidence from the provincial-level environment efficiency in China. Sustainability 2016, 8, 1241. [Google Scholar] [CrossRef] [Scilit]
  161. Chen, D.; Ma, Y.; Yang, R.; Sun, J. Performance analysis of China’s regional circular economy from the perspective of circular structure. J. Clean. Prod. 2021, 297, 126644. [Google Scholar] [CrossRef] [Scilit]
  162. Wu, J.; Zhu, Q.; Ji, X.; Chu, J.; Liang, L. Two-stage network processes with shared resources and resources recovered from undesirable outputs. Eur. J. Oper. Res. 2016, 251, 182–197. [Google Scholar] [CrossRef] [Scilit]
  163. Li, W.; Li, Z.; Liang, L.; Cook, W.D. Evaluation of ecological systems and the recycling of undesirable outputs: An efficiency study of regions in China. Socio-Econ. Plan. Sci. 2017, 60, 77–86. [Google Scholar] [CrossRef] [Scilit]
  164. Huang, H.C.; Hu, C.F. Performance measurement for the recycling production system using cooperative game network data envelopment analysis. Sustainability 2021, 13, 11060. [Google Scholar] [CrossRef] [Scilit]
  165. Rebolledo-Leiva, R.; Vásquez-Ibarra, L.; Entrena-Barbero, E.; Fernández, M.; Feijoo, G.; Moreira, M.T.; González-García, S. Coupling Material Flow Analysis and Network DEA for the evaluation of eco-efficiency and circularity on dairy farms. Sustain. Prod. Consum. 2022, 31, 805–817. [Google Scholar] [CrossRef] [Scilit]
  166. Shabanpour, H.; Dargusch, P.; Wadley, D.; Farzipoor Saen, R. A breakthrough in circular economy: Using a closed-loop framework to assess the circularity of supply chains. J. Clean. Prod. 2024, 444, 141265. [Google Scholar] [CrossRef] [Scilit]
  167. Zhang, L.; Zhuang, Y.; Chiu, Y.H.; Pang, Q.; Chen, Z.; Shi, Z. Measuring urban integrated water use efficiency and spatial migration path in China: A dynamic two-stage recycling model within the directional distance function. J. Environ. Manag. 2021, 298, 113379. [Google Scholar] [CrossRef] [Scilit] [PubMed]
  168. Zhuang, Y.; Zhang, L.; Chiu, Y.H.; Guo, Z.; Chu, Y.; Du, X. Evaluating the recycling efficiency of industrial water use systems in China: Basin differences and factor analysis. J. Environ. Manag. 2022, 316, 115313. [Google Scholar] [CrossRef] [Scilit] [PubMed]
  169. Lin, T.Y.; Chiu, Y.H.; Lin, Y.N.; Chang, T.H. Profit-seeking enterprise production and business waste treatment efficiency in Taiwan. Environ. Dev. Sustain. 2023, 25, 10661–10683. [Google Scholar] [CrossRef] [Scilit]
  170. Guan, X.G.; Ren, F.R.; Fan, G.; Zhang, Q.Q.; Wu, T.F. Dynamic evaluation and sensitivity analysis of China’s industrial solid waste management efficiency based on ecological environment cycle perspective. Front. Environ. Sci. 2024, 12, 1462975. [Google Scholar] [CrossRef] [Scilit]
  171. Lei, A.; Yang, L.; Chiu, Y.H.; Niu, Y.Y.; Chang, T.H. Reassessment of the efficiency of China’s industrial circular economy considering quality of life: A meta recycle SBM dynamic under exogenous model. Environ. Dev. Sustain. 2024, 27, 19435–19466. [Google Scholar] [CrossRef] [Scilit]
  172. Shi, Z.; Wu, Y.; Chiu, Y.H.; Pang, Q.; Zhang, L. Optimizing the allowance allocations of water consumption, industrial solid waste and carbon emissions in China. Process Saf. Environ. Prot. 2024, 183, 835–847. [Google Scholar] [CrossRef] [Scilit]
  173. Li, Y.; Du, L.; Chiu, Y.H. Energy poverty impact on sustainable development of water resources in China: The study of an entropy recycling dynamic two-stage SBM model. Water 2024, 16, 876. [Google Scholar] [CrossRef] [Scilit]
  174. Shabanpour, H.; Dargusch, P.; Wadley, D.; Saen, R.F.; Lieske, S.N. A breakthrough in macro-scale circularity and eco-efficiency assessment: A case study of OECD countries. J. Environ. Manag. 2024, 360, 121070. [Google Scholar] [CrossRef] [Scilit] [PubMed]
  175. Shabanpour, H.; Yousefi, S.; Farzipoor Saen, R. Forecasting sustainability of supply chains in the circular economy context: A dynamic network data envelopment analysis and artificial neural network approach. J. Enterp. Inf. Manag. 2025, 38, 68–93. [Google Scholar] [CrossRef] [Scilit]
  176. Shabanpour, H.; Lieske, S.N.; Dargusch, P.; Wadley, D.; Farzipoor Saen, R. Advancing circular economy assessments for sustainability benchmarking in resource and manufacturing supply chains: A scalable dynamic network framework. J. Environ. Manag. 2025, 393, 127180. [Google Scholar] [CrossRef] [Scilit] [PubMed]
  177. García-Valderrama, T.; Sánchez-Ortiz, J.; Pérez-González, M.D.C.; Puentes-Graña, M.D.C. Relationship between recycling, circular economy and eco-innovation in Europe. Application of a dynamic network data envelopment analysis model. Bus. Strategy Environ. 2024, 33, 5955–5974. [Google Scholar] [CrossRef] [Scilit]
  178. Lu, L.C.; Chiu, S.Y.; Chiu, Y.H.; Chang, T.H. Three-stage circular efficiency evaluation of agricultural food production, food consumption, and food waste recycling in EU countries. J. Clean. Prod. 2022, 343, 130870. [Google Scholar] [CrossRef] [Scilit]
  179. Zhang, L.; Du, X.; Chiu, Y.H.; Pang, Q.; XiaoWang; Yu, Q. Measuring industrial operational efficiency and factor analysis: A dynamic series-parallel recycling DEA model. Sci. Total Environ. 2022, 851, 158084. [Google Scholar] [CrossRef] [Scilit] [PubMed]
  180. He, K.; He, X. Dynamic Evaluation of Eco-efficiency in China’s Industrial Sectors: Addressing Scale and Regional Heterogeneities. Environ. Model. Assess. 2026. [Google Scholar] [CrossRef] [Scilit]
  181. Bronner, M.; See, K.F.; Yu, M.M. Circular water economy performance evaluation based on dynamic network data envelopment analysis. J. Clean. Prod. 2022, 367, 132474. [Google Scholar] [CrossRef] [Scilit]
  182. Ren, W.; Zhang, Z.; Wang, Y.; Xue, B.; Chen, X. Measuring regional Eco-efficiency in China (2003–2016): A “full world” perspective and network data envelopment analysis. Int. J. Environ. Res. Public Health 2020, 17, 3456. [Google Scholar] [CrossRef] [Scilit] [PubMed]
  183. Yang, R.; Wu, S.; Wong, C.W.Y.; Liu, K.; Miao, X.; Chen, Y.; Wang, S.; Tang, Y. The recent ecological efficiency development in China: Interactive systems of economy, society and environment. Technol. Econ. Dev. Econ. 2023, 29, 217–252. [Google Scholar] [CrossRef] [Scilit]
  184. Yang, L.; Chen, S.; Chiu, Y.H.; Chang, T.H.; Wang, Y. Reassessment of industrial eco-efficiency in China under the sustainable development goals: A meta two-stage parallel entropy dynamic DDF-DEA model. J. Clean. Prod. 2024, 447, 141275. [Google Scholar] [CrossRef] [Scilit]
  185. Zhuang, Y.; Zhang, L.; Chiu, Y.H.; Pang, Q.; Wang, X.; Yu, Q. Layer-by-layer investigation of the black box: A case of assessing the industrial water-related system in China. J. Environ. Manag. 2023, 344, 118353. [Google Scholar] [CrossRef] [Scilit] [PubMed]
  186. Hou, Y.; Xi, S.; Li, H.; Fan, Y.; Li, F.; Wen, Q.; Hao, J. The Development of Circular Economy in China’s Coal Industry: Facing Challenges of Inefficiency in the Waste Recycling Process. Sustainability 2025, 17, 8147. [Google Scholar] [CrossRef] [Scilit]
  187. Chang, T.H.; Chiu, Y.h.; Chen, H.Y.; Yeh, L.; Ji, L. Efficiency analysis of geological exploration, mineral production, and land restoration in China’s provinces under natural change. Energy Environ. 2025. [Google Scholar] [CrossRef] [Scilit]
  188. Yang, L.; Chiu, Y.h.; Chen, S.; Chang, T.H.; Wang, Y. Estimating the Efficiency of China’s Circular Economy Using an Entropy Approach. Water Econ. Policy 2025, 11, 2550004. [Google Scholar] [CrossRef] [Scilit]
  189. Daraio, C.; Kerstens, K.H.; Nepomuceno, T.C.C.; Sickles, R. Productivity and Efficiency Analysis Software: An Exploratory Bibliographical Survey of the Options. J. Econ. Surv. 2019, 33, 85–100. [Google Scholar] [CrossRef] [Scilit]
  190. Guerrero, N.M.; Aparicio, J.; Valero-Carreras, D. Combining Data Envelopment Analysis and Machine Learning. Mathematics 2022, 10, 909. [Google Scholar] [CrossRef] [Scilit]
  191. Ren, T.; Chen, J.; Li, S.; Xiao, H. Evaluation and simulation of congestion effects of digital production factors in industrial virtual agglomeration: Based on DEA and swarm intelligence-driven neural networks. Expert Syst. Appl. 2026, 323, 132430. [Google Scholar] [CrossRef] [Scilit]
  192. Kehinde, T.O.; Akpan, J.; Orisaremi, K.K.; Olanrewaju, O.A.; Anyebe, D.I.; Kareem, M.K. Three decades of DEA-machine learning integration (1996–2025): A bibliometric analysis, science mapping, and state-of-the-art review. Mach. Learn. Appl. 2026, 24, 100868. [Google Scholar] [CrossRef] [Scilit]
  193. Lin, S.W.; Lu, W.M. Optimizing public sector resources: A centralized DEA model for effective allocation of shared inputs. Socio-Econ. Plan. Sci. 2024, 96, 102094. [Google Scholar] [CrossRef] [Scilit]
Figure 1. PRISMA flow diagram.
Algorithms 19 00585 g001
Figure 2. Annual trends in publications on CE performance assessment using DEA (2008–2026).
Algorithms 19 00585 g002
Figure 3. The general scheme of the two-stage CE process.
Algorithms 19 00585 g003
Figure 4. General two-stage DEA model with undesirable outputs.
Algorithms 19 00585 g004
Figure 5. Two-stage DEA model with shared inputs.
Algorithms 19 00585 g005
Figure 6. Two-stage DEA model with feedback.
Algorithms 19 00585 g006
Figure 7. Two-stage DEA model with feedback at each stage.
Algorithms 19 00585 g007
Figure 8. Two-stage dynamic DEA model.
Algorithms 19 00585 g008
Figure 9. Three-stage CE dynamic model with eco-innovation stage. Source: Adapted from [177].
Algorithms 19 00585 g009
Figure 10. The structure of a dynamic three-stage DEA model for measuring agricultural CE efficiency. Source: Adapted from [178].
Algorithms 19 00585 g010
Figure 11. Dynamic series–parallel DEA model for industrial CE efficiency evaluation. Source: Adapted from [179].
Algorithms 19 00585 g011
Figure 12. Circular dynamic network DEA model for water economy performance evaluation. Source: Adapted from [181].
Algorithms 19 00585 g012
Figure 13. Hybrid network DEA model with three interactive subsystems. Source: Adapted from [183].
Algorithms 19 00585 g013
Figure 14. Dynamic network DEA model for assessment of industrial circular efficiency. Source: Adapted from [184].
Algorithms 19 00585 g014
Figure 15. Series–parallel DEA model for efficiency evaluation of industrial water management systems. Source: Adapted from [185].
Algorithms 19 00585 g015
Figure 16. Dynamic parallel three-stage DEA model for assessment of CE efficiency. Source: Adapted from [188].
Algorithms 19 00585 g016
Figure 17. Temporal distribution of publications across various DEA models in the field of CE (2008–2026).
Algorithms 19 00585 g017
Table 1. Classification of input variables with the frequency analysis.
Group of InputsCountFrequency (%)
Labor and workforce (number of employees/workers, labor force, staff, working hours)12015.15%
Energy (coal/electricity/power/fuel consumption, energy intensity, renewable energy share)9712.25%
Capital and infrastructure (fixed capital, capital stock, gross fixed capital formation, vehicles, treatment plants, pipelines, facilities, mileage of transport networks)8710.98%
Investment (fixed asset investment, capital investment, pollution control investment, waste
treatment investment)
8710.98%
Waste management costs (costs/expenditures specifically tied to waste collection, treatment,
disposal, recycling)
668.33%
Waste generation (volumes/quantities of MSW, industrial, hazardous, or household waste generated)607.58%
Water (water consumption, supply, withdrawals, footprint)506.31%
General costs and expenditures (non-waste-specific costs: production costs, OPEX, fuel/electricity costs, tariffs)425.30%
Emissions, pollution (CO2/GHG, SO2, NOx, industrial effluent/exhaust emissions)253.16%
Population, demographics (population, population density, age, rural share)232.90%
Land area (land area, built-up area, service area, territorial surface)222.78%
Waste treatment (landfill, incineration, recycling, composting, reuse rates)212.65%
Others (process parameters (pH, temperature, concentrations), ratings/indices, ICT usage, agricultural inputs, emergy flows, ship dimensions, etc.)9211.62%
Table 2. Output variable categories and their frequencies.
Group of OutputsCountFrequency (%)
Recycling, circular material use (recycling rates, circular material use rates, sorted/separated waste, collected recyclables)16823.63%
Economic and financial performance (GDP, revenue, income, value added, profit, etc.)13018.28%
Resource efficiency, industrial waste utilization (industrial solid waste utilization rates, water reuse, resource productivity)669.28%
Wastewater treatment (wastewater treatment rates, COD/N/P removed, sewage treatment)628.72%
Emissions and pollution reduction (reduction of GHG, CO2, SO2, NOx, dust, emissions)547.59%
Waste generation and collection (waste generated, collected, volume of waste)385.34%
Solid waste treatment and disposal (harmless treatment, landfilling, non-energy incineration,
disposal rates)
344.78%
Social and demographic indicators (population, urban unemployment, income per capita, urbanization rate)324.50%
Energy, renewable energy (renewable energy, energy recovery, energy efficiency, biogas)324.50%
Environmental benefits (composite environmental indexes, SDG index, climate change impact)243.38%
Water supply, sanitation services (water consumers, connections, water produced, sanitation coverage)212.95%
Biodiversity, land (green area, protected land, biomass, forestation)141.97%
Others (remanufacturing metrics, petroleum product composition ratios, green patent applications, SDG education indicators, service quality ratings, agricultural outputs, flood risk mapping, and governance indicators)365.06%
Table 3. Undesirable output categories and their frequencies.
Group of Undesirable OutputsCountFrequency (%)
Air emissions (GHG, CO2, CH4, N2O, SO2, NOx, dust/soot, ammonia)4335.83%
Solid waste (municipal/unsorted, industrial, landfill/incineration, mining byproducts)4235.00%
Water pollution (wastewater discharge, sludge, COD, eutrophication)1714.17%
Economic, resource and composite indicators (costs, resource use/efficiency, pollution indices)1310.83%
Others (illegal mining/exploration, straw burning)54.17%
Table 4. Categorization and frequency distribution of intermediate products.
Group of Intermediate ProductsCountFrequency (%)
Solid waste generation, discharge, and recycling (industrial/household/business solid waste, food waste, total wastes generated, waste collection/utilization/recycling)4029.9%
Wastewater discharge, treatment, and reuse (industrial/municipal wastewater discharge, sewage emissions, treated/recycled wastewater, grey water footprint, COD, ammonia nitrogen emissions)3425.4%
Air emissions (industrial waste gas, SO2, NOx, dust/soot, smoke, total pollutant emissions from exhaust gas, greenhouse gas emissions, total annual carbon emissions)2720.1%
Water supply and consumption (water delivered to end users, industrial water supply, total water consumption, water abstracted for public supply)107.5%
Raw material inputs (iron ore, coal gangue, raw coal, land destructed by mining, mineral prospects, extracted oil)107.5%
Energy and electricity (electricity consumption, industrial power supply, hydroelectricity generation, energy consumption)53.7%
Others (agricultural output, crops, tertiary industry share of GDP/employment, green coverage rate, circular material use rate, resource productivity, pollution-treatment investment)86.0%
Disclaimer/Publisher’s Note: The statements, opinions and data contained in all publications are solely those of the individual author(s) and contributor(s) and not of MDPI and/or the editor(s). MDPI and/or the editor(s) disclaim responsibility for any injury to people or property resulting from any ideas, methods, instructions or products referred to in the content.