Article

Towards Explainable and Robust Cervical Cancer Screening Using Domain-Specific Transfer Learning Algorithm
1
School of Computer Engineering, Kalinga Institute of Industrial Technology (KIIT) Deemed to be University, Bhubaneswar 751024, Odisha, India
2
School of Electronics Engineering, Kalinga Institute of Industrial Technology (KIIT) Deemed to be University, Bhubaneswar 751024, Odisha, India
3
Faculty of Electronics, Communication and Computers, Piteşti University Centre, The National University of Science and Technology POLITEHNICA Bucharest, 110040 Pitesti, Romania
4
“Carol Davila” University of Medicine and Pharmacy, 050474 Bucharest, Romania
*
Authors to whom correspondence should be addressed.
Algorithms 2026, 19(7), 584; https://doi.org/10.3390/a19070584
Submission received: 23 June 2026 / Revised: 10 July 2026 / Accepted: 13 July 2026 / Published: 16 July 2026
(This article belongs to the Special Issue AI-Powered Biomedical Image Analysis)

Abstract

Cervical cancer is the fourth most frequent malignancy in women globally. Pap smear screening is important for early cancer detection, but manual smear analysis is time-consuming, labor-intensive and error-prone for diagnosis. Such issues in resource-limited areas have led to the introduction of deep learning (DL) methods for automated cervical cancer diagnosis. But the majority of current methodologies depend on models pretrained on natural image datasets like ImageNet, which may inadequately represent domain-specific pathological characteristics. To mitigate this constraint, this research employs a domain-specific transfer learning algorithm approach using the PathMNIST histopathological dataset to enhance cervical cell classification. An accuracy score of 96.77% is achieved for the proposed YOLO* model, using the SIPAKMED dataset. To the best of available knowledge, no previous study has reported the use of PathMNIST as a pretraining source for cytology image classification. As domain-specific medical pretraining is becoming more popular, our study shows the importance of cross-domain generalization.

1. Introduction

The WHO estimates that there were 660,000 new cases of cervical cancer and 350,000 related deaths worldwide in 2022 [1]. Diagnosis is made by the pap test. Cells taken by smear are stained and inspected under a microscope. Manual evaluation of a single slide with 100–10,000 cells by pathologists is slow and error-prone. A John Hopkins study indicates 1–10% of pap tests are false positives [2]. This has created interest in deep learning for cervical cancer screening. Pretrained convolutional neural networks (CNNs) trained on large natural image datasets have shown great performance despite the disparities between natural and medical images. Transfer learning [3] is the main strategy, exploiting the hierarchical feature extraction of these models to overcome the limitations of small and imbalanced medical datasets. Many research works focus on building new classifier models and applying them to a dataset [4]. There are inherent difficulties when applying a pretrained model to a new dataset. Despite the distinctions between natural and medical images, it is noted that natural image collections are useful for disease diagnostic tasks. It requires applying information from one source to another target set of data. Transfer learning [5,6] or domain adaptation techniques [7] can meet these needs. Several studies use these methods to categorize cervical cancer.
For reducing model uncertainty and improving robustness against inter-observer variation in ground-truth labeling, ensemble and multi-branch architectures have gained popularity alongside traditional CNNs [8]. InceptionV3, MobileNetV2, and InceptionResNetV2 are all included in this work’s fuzzy distance ensemble, which achieves improved reliability by combining complementary decision boundaries rather than just averaging. Numerous researchers have improved CNN architectures by integrating supplementary modules instead of creating fully new networks. Incorporation of attention blocks, squeeze-and-excitation (SE) modules, residual connections, dense connectivity layers, feature fusion blocks, and hidden layers are often used to enhance feature representation and classification efficacy. Zhou et al. [9] have suggested a method for pneumonia recognition utilizing a CNN for automated diagnosis from chest X-ray images. Specifically, a squeeze-and-excitation block is added into the transfer-learning-based ShuffleNetV1. Bădoi et al. [10] have introduced a comprehensive deep learning framework for classification of breast ultrasound images, utilizing nine empirical models on the MobileNetv2 model. The system necessitates the training of only one hidden layer, facilitating effective implementation on conventional consumer computers, irrespective of the clinical environment’s scale. By successfully capturing long-range interactions of spatial cell architectures, transformer-based models represent a significant improvement that challenges CNNs’ dominance. Transformer-based models and their variants are therefore helpful in a variety of scenarios, including image classification [11,12]. This paper develops a new scratch hybrid model that is mostly YOLO-based and uses an attention algorithm inspired by selective transformers.
The main contributions of this work are summarized as follows:
(i)
Domain-specific transfer learning—unlike conventional approaches that rely on ImageNet-pretrained models, the proposed system performs domain-specific pretraining on the PathMNIST histopathology dataset before fine-tuning on cervical cancer dataset. This method enables the model to learn pathology-oriented representations that are more relevant than generic natural-image attributes.
(ii)
In order to improve multi-scale feature extraction and discriminative representation learning for cervical cell images, we suggest a YOLO* classifier with components that enhance multi-scale feature representation and contextual information extraction.
(iii)
A unified pretraining and fine-tuning pipeline is designed to transfer histopathology-specific knowledge from PathMNIST to cervical cancer dataset. Hence, this system efficiently bridges the domain gap between natural-image pretraining and medical pathological image analysis.
(iv)
Extensive experimental validation shows that when compared to training from scratch and traditional ImageNet-based transfer learning techniques, the suggested domain-specific transfer learning framework consistently improves classification performance.
The following sections comprise the paper. The literature review is included in Section 2. The materials and techniques used in this study are described in Section 3. The investigation is conducted using information from results and analysis that are presented in Section 4, whereas Section 5 emphasizes the links between the suggested study and other relevant research. The conclusion and future directions are discussed in Section 6.

2. Literature Review

Automated cervical cancer screening has significantly improved recently due to deep learning developments, particularly through transfer learning techniques. Haryanto et al. [13] utilized a padding strategy on the CNN model known as the AlexNet architecture. To stop feature maps from quickly becoming smaller and to keep important information, the authors used zero padding before convolution. When compared to the non-padded baseline, this technique shows that the model’s accuracy increased from 84.88% to 87.32%. In 2021, Arifianto et al. [14] in their study focused on using a CNN with transfer learning to automatically classify images of cervical cancer. To enhance classification performance, the authors used pre-trained deep learning models (often architectures like VGG or ResNet) that are trained on extensive datasets like ImageNet and then refined on cervical cell imaging datasets. Their research indicates that initializing models with pretrained weights enhances feature extraction and decreases computing expense for the Pap smear image classification task. The work reports a maximum classification accuracy of 98.41% using SqueezeNet, demonstrating good efficacy for early cervical cancer screening support. Experimental results also show that transfer learning greatly improves performance when compared to training from scratch. Additionally, Rahaman et al. [15] proposed the DeepCervix framework, which uses a hybrid deep feature fusion (HDFF) technique to sort cervical cells. The model combines many pretrained CNN architectures, such as VGG16, VGG19, ResNet50, and Xception, to obtain multi-level features that work well together. To fix class imbalance and make the model more general, the authors employed a two-stage augmentation procedure and a better feature fusion technique. DeepCervix achieved state-of-the-art accuracies of 99.85% (binary), 99.38% (3-class), and 99.14% (5-class) classification when tested on SIPAKMED. The model also achieved accuracy values of 98.32% (binary) and 90.32% (7-class) on the Herlev dataset.
The work of Basak et al. [16] employed a PCA on features derived from pretrained CNNs (VGG16, ResNet50, InceptionV3, DenseNet121) and the Grey Wolf Optimizer for redundant feature selection, resulting in an accuracy of 97.87% on SIPAKMED. Liu et al. [17] merged local features of a CNN with global features of a vision transformer using a multilayer perceptron, yielding 91.72% accuracy on the same dataset. Pacal and Kılıcarslan [18] used data augmentation and ensemble learning to benchmark more than 20 Vision Transformers (ViTs) and 40 CNN models on SIPAKMED. The best individual models are ViT/B16 (91.93%) and EfficientNet-B6 (89.95%), while the mx-voting ensemble of them had the highest overall accuracy of 92.95%.
Wong et al. [19] created an automatic cervical cancer diagnostic system using deep learning and transfer learning on the Liquid-Based Cytology (LBC) dataset. A dataset is created from this publicly accessible LBC dataset by augmenting it to make a total of 2676 images. Deep learning and transfer learning are used with ImageNet-pretrained models ResNet50V2 and ResNet101V2. The evaluation demonstrates that the ResNet50V2 model has superior performance, achieving a precision of 98% and an accuracy of 97% in the categorization of HSIL and SCC type images. Additionally, Deo et al. [20] developed the Cerviformer framework, a transformer-based approach that employs cross-attention mechanisms for the classification of cervical cancer cells from pap smear images. The design captures both local cellular characteristics and global contextual data via latent transformer representations. The model reached an accuracy of 96.67% on the SIPAKMED (3-class) dataset and 94.57% on the Herlev dataset. This framework, on the other hand, used ImageNet pretraining instead of a domain-specific dataset like PathMNIST.
By 2025, comparative research has further substantiated the efficacy of transfer learning. Payne et al. [21] have used a unique EfficientNet model that is pretrained on the extensively utilized MNIST-digit dataset and then subsequently fine-tuned on publicly available cervical cancer datasets. The suggested model has shown accuracy values of 97.14% and 84.30% on SIPAKMED and Mendeley LBC datasets, respectively. Jadhav et al. [22] employed various pretrained CNN models that are fine-tuned on cervical cancer imaging datasets to make them work for stage-wise classification. Experimental results show that EfficientNet-B7 has surpassed VGG-16, EfficientNet-B7, and CapsNet CNN models and has reached the highest accuracy value of 91.34% on the SIPAKMED dataset. Recently, Hossain et al. [23] have suggested a lightweight cervical cancer classification framework that integrates CNNs with Multi-Head Attention to improve feature extraction from Pap smear images. The study is evaluated on several pretrained models, including MobileNetV2, ResNet variants, InceptionV3, AlexNet, DenseNet121, and VGG19. By integrating attention blocks and pooling layers, the framework has efficiently captured important visual features with reduced computational complexity. This proposed approach has achieved a maximum accuracy of 96.23%. Mondal et al. [24] have developed an innovative hybrid model called CASPNet, which incorporates rapid spatial pyramid pooling layers with self-attention transformer blocks to perform the image classification task. This suggested scratch model has achieved a maximum of 97.07% utilizing the SIPAKMED dataset. Table 1 displays the analysis of the above research articles.

3. Materials and Methods

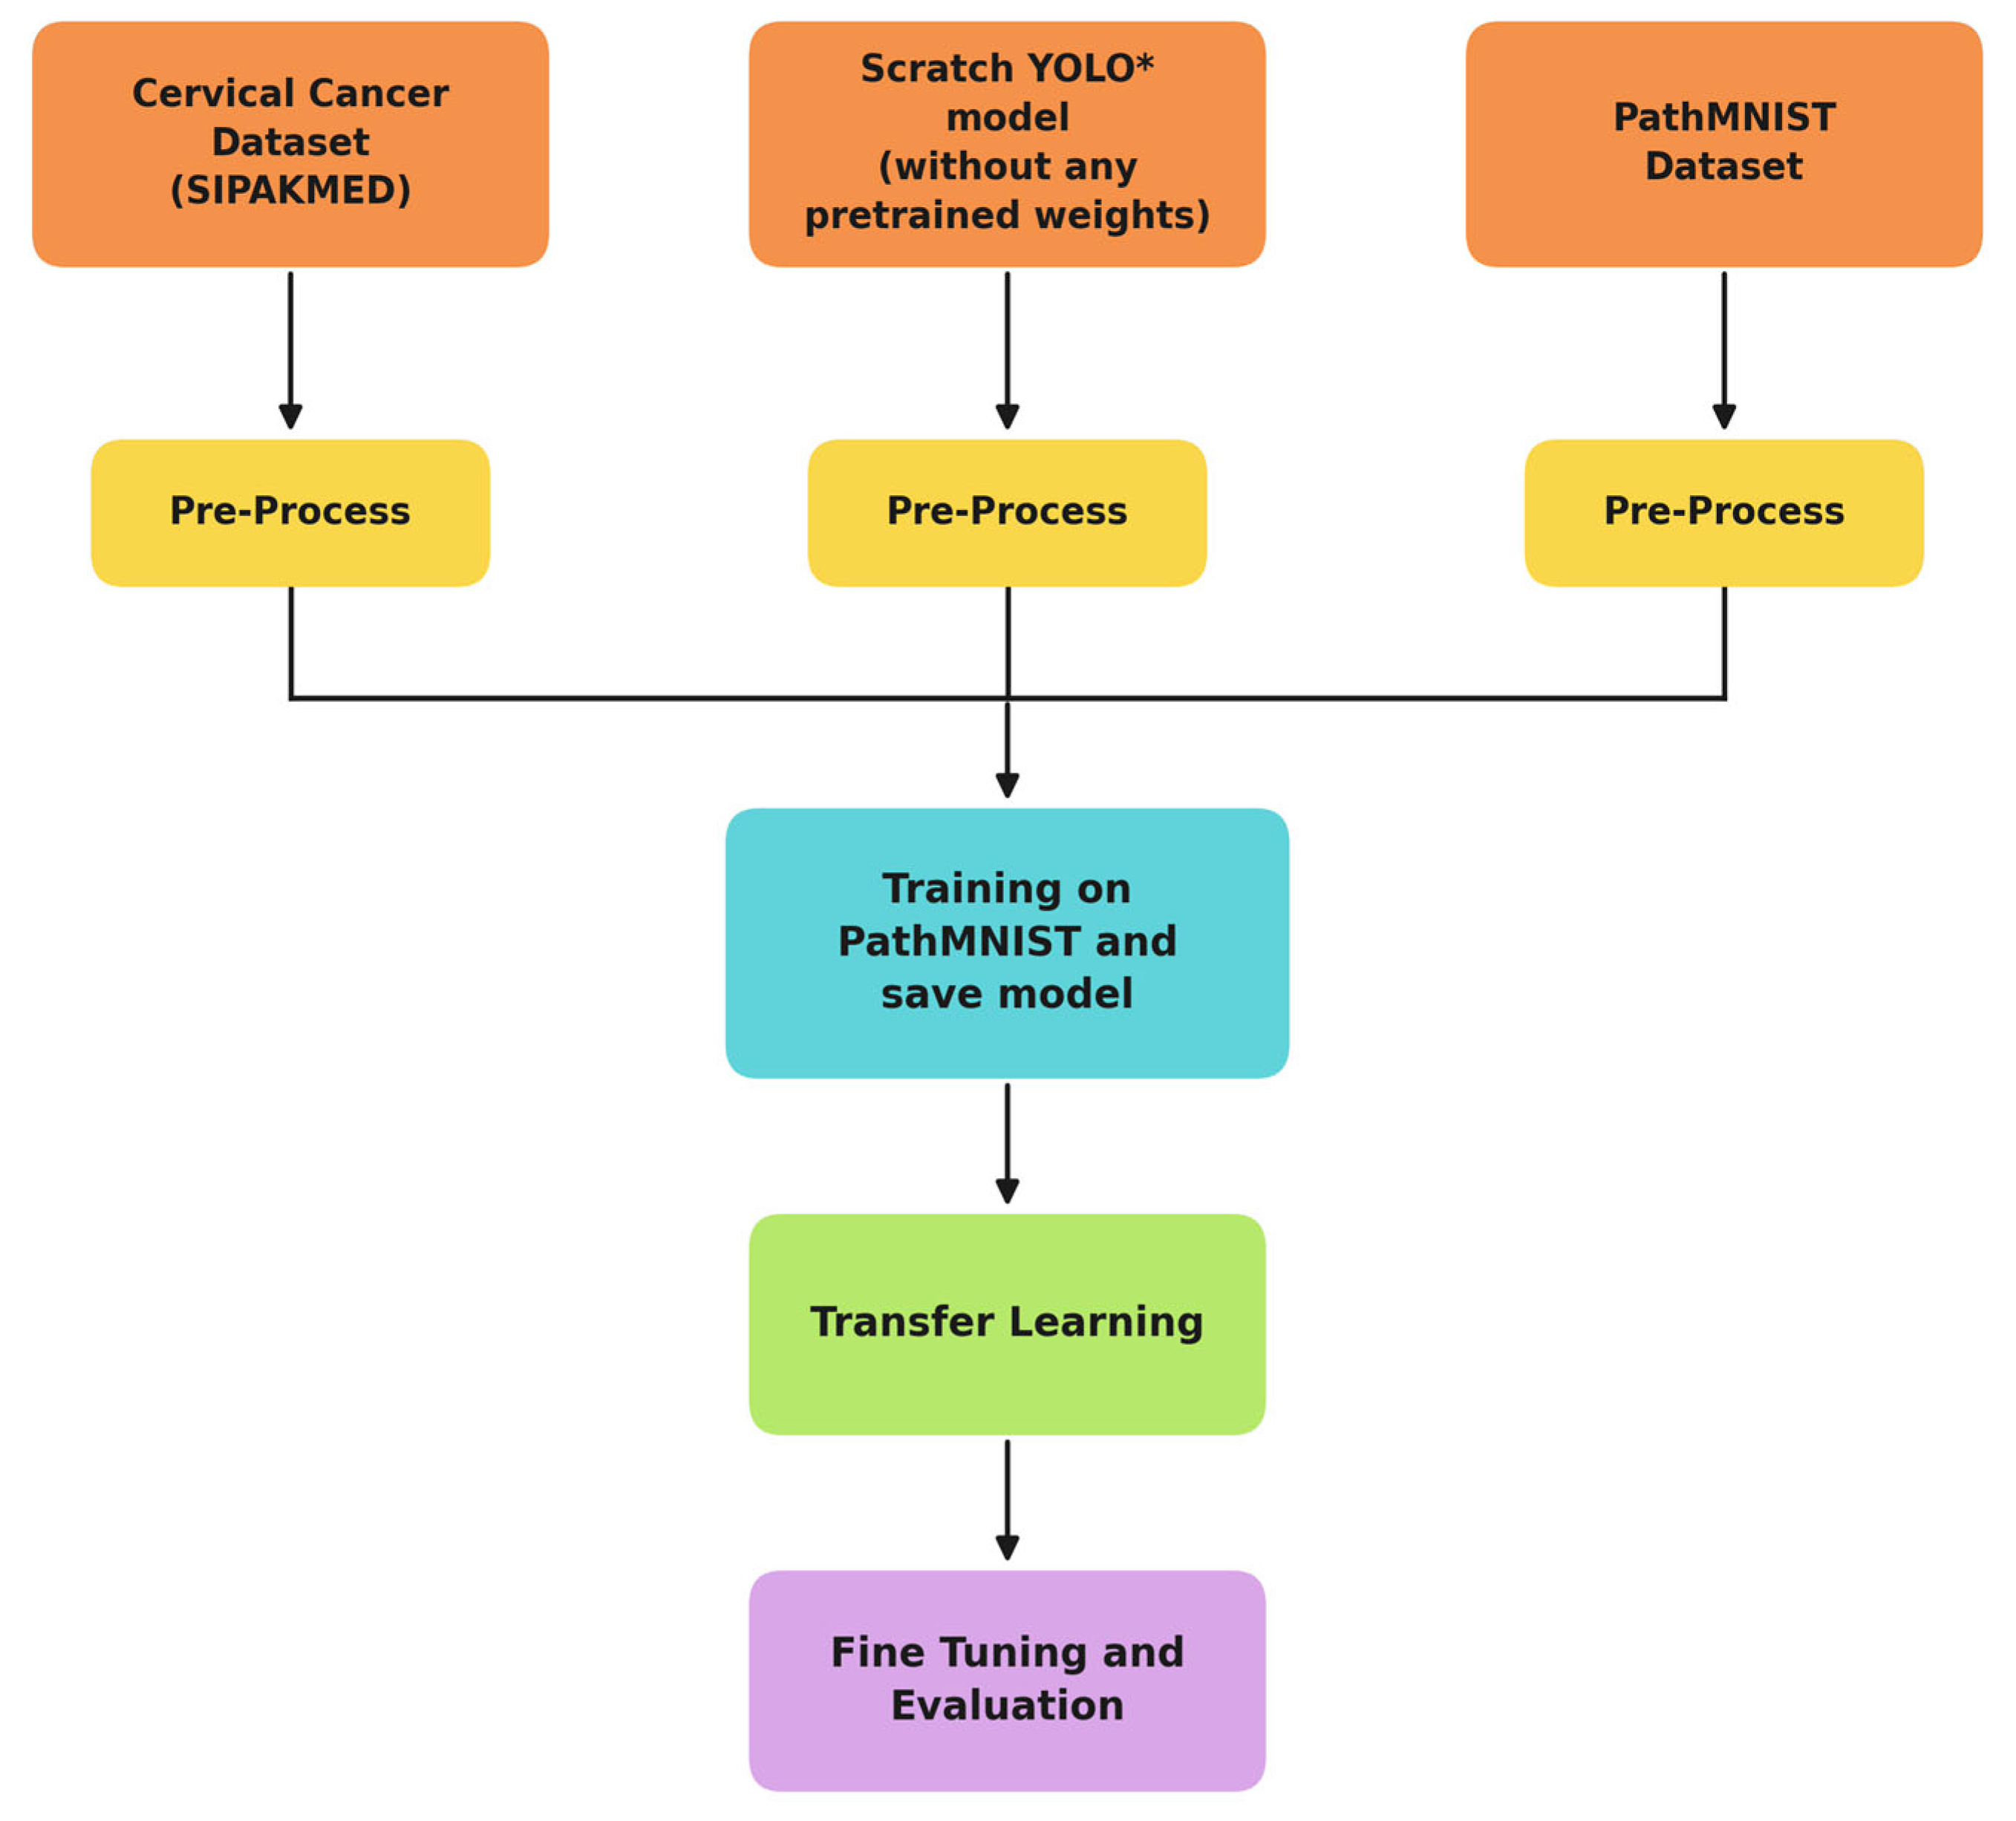
The materials and techniques utilized in this experimental setup are listed in this section. Figure 1 below describes the basic workflow of our proposed work. The proposed methodology follows a sequential pipeline that begins with three parallel input components: the cervical cancer dataset (SIPAKMED), a scratch-built YOLO* model initialized without any pretrained weights and the PathMNIST dataset. Each of these three components independently undergoes a pre-processing stage, ensuring that the image data (both from SIPAKMED and PathMNIST) and the model architecture are appropriately prepared and standardized before further use. Following pre-processing, the pipeline converges into a single training stage, where the scratch YOLO* model is trained from the scratch using the PathMNIST dataset. This step allows the model to learn generalizable low- and mid-level histopathological features from a large-scale medical imaging benchmark, in the absence of any pretrained (e.g., ImageNet) weights. Once training is complete, the resulting model is saved as a base model for subsequent adaptation to the target domain. In simple words, the saved model then undergoes transfer learning, wherein the learned weights from PathMNIST are transferred and adapted to the SIPAKMED cervical cancer dataset. This step leverages the feature representations acquired during PathMNIST training, enabling the model to adapt more efficiently to the target task despite the comparatively smaller size of the cervical cancer dataset. Finally, the model undergoes fine-tuning and evaluation, where the transferred model’s parameters are further refined on the SIPAKMED dataset, and its performance is assessed using standard classification metrics.

3.1. Dataset Description

We have used the PathMNIST dataset from the MedMNIST repository [25] for pretraining our proposed model. MedMNIST is a compilation of standardized 2D and 3D biomedical images used to evaluate classification and regression algorithms. PathMNIST is a reduced colon pathology dataset incorporated in MedMNIST for effective medical imaging evaluation. It consists of a total of 107,180 images belonging to 9 different classes. In our experimental setup, we used an image size of 28 × 28. Table 2 presents the number of images for each class in the MedMNIST dataset.
Experimental analysis is performed on the freely available SIPAKMED dataset [26], which is a popular benchmark for cervical cytology image categorization. This collection contains 4049 cervical cell images obtained from 966 pap smear cluster images, and is classified by experienced pathologists into five diagnostic categories according to cellular morphology. Table 3 shows the class-wise distribution of images in the SIPAKMED dataset.

3.2. Dataset Visualization

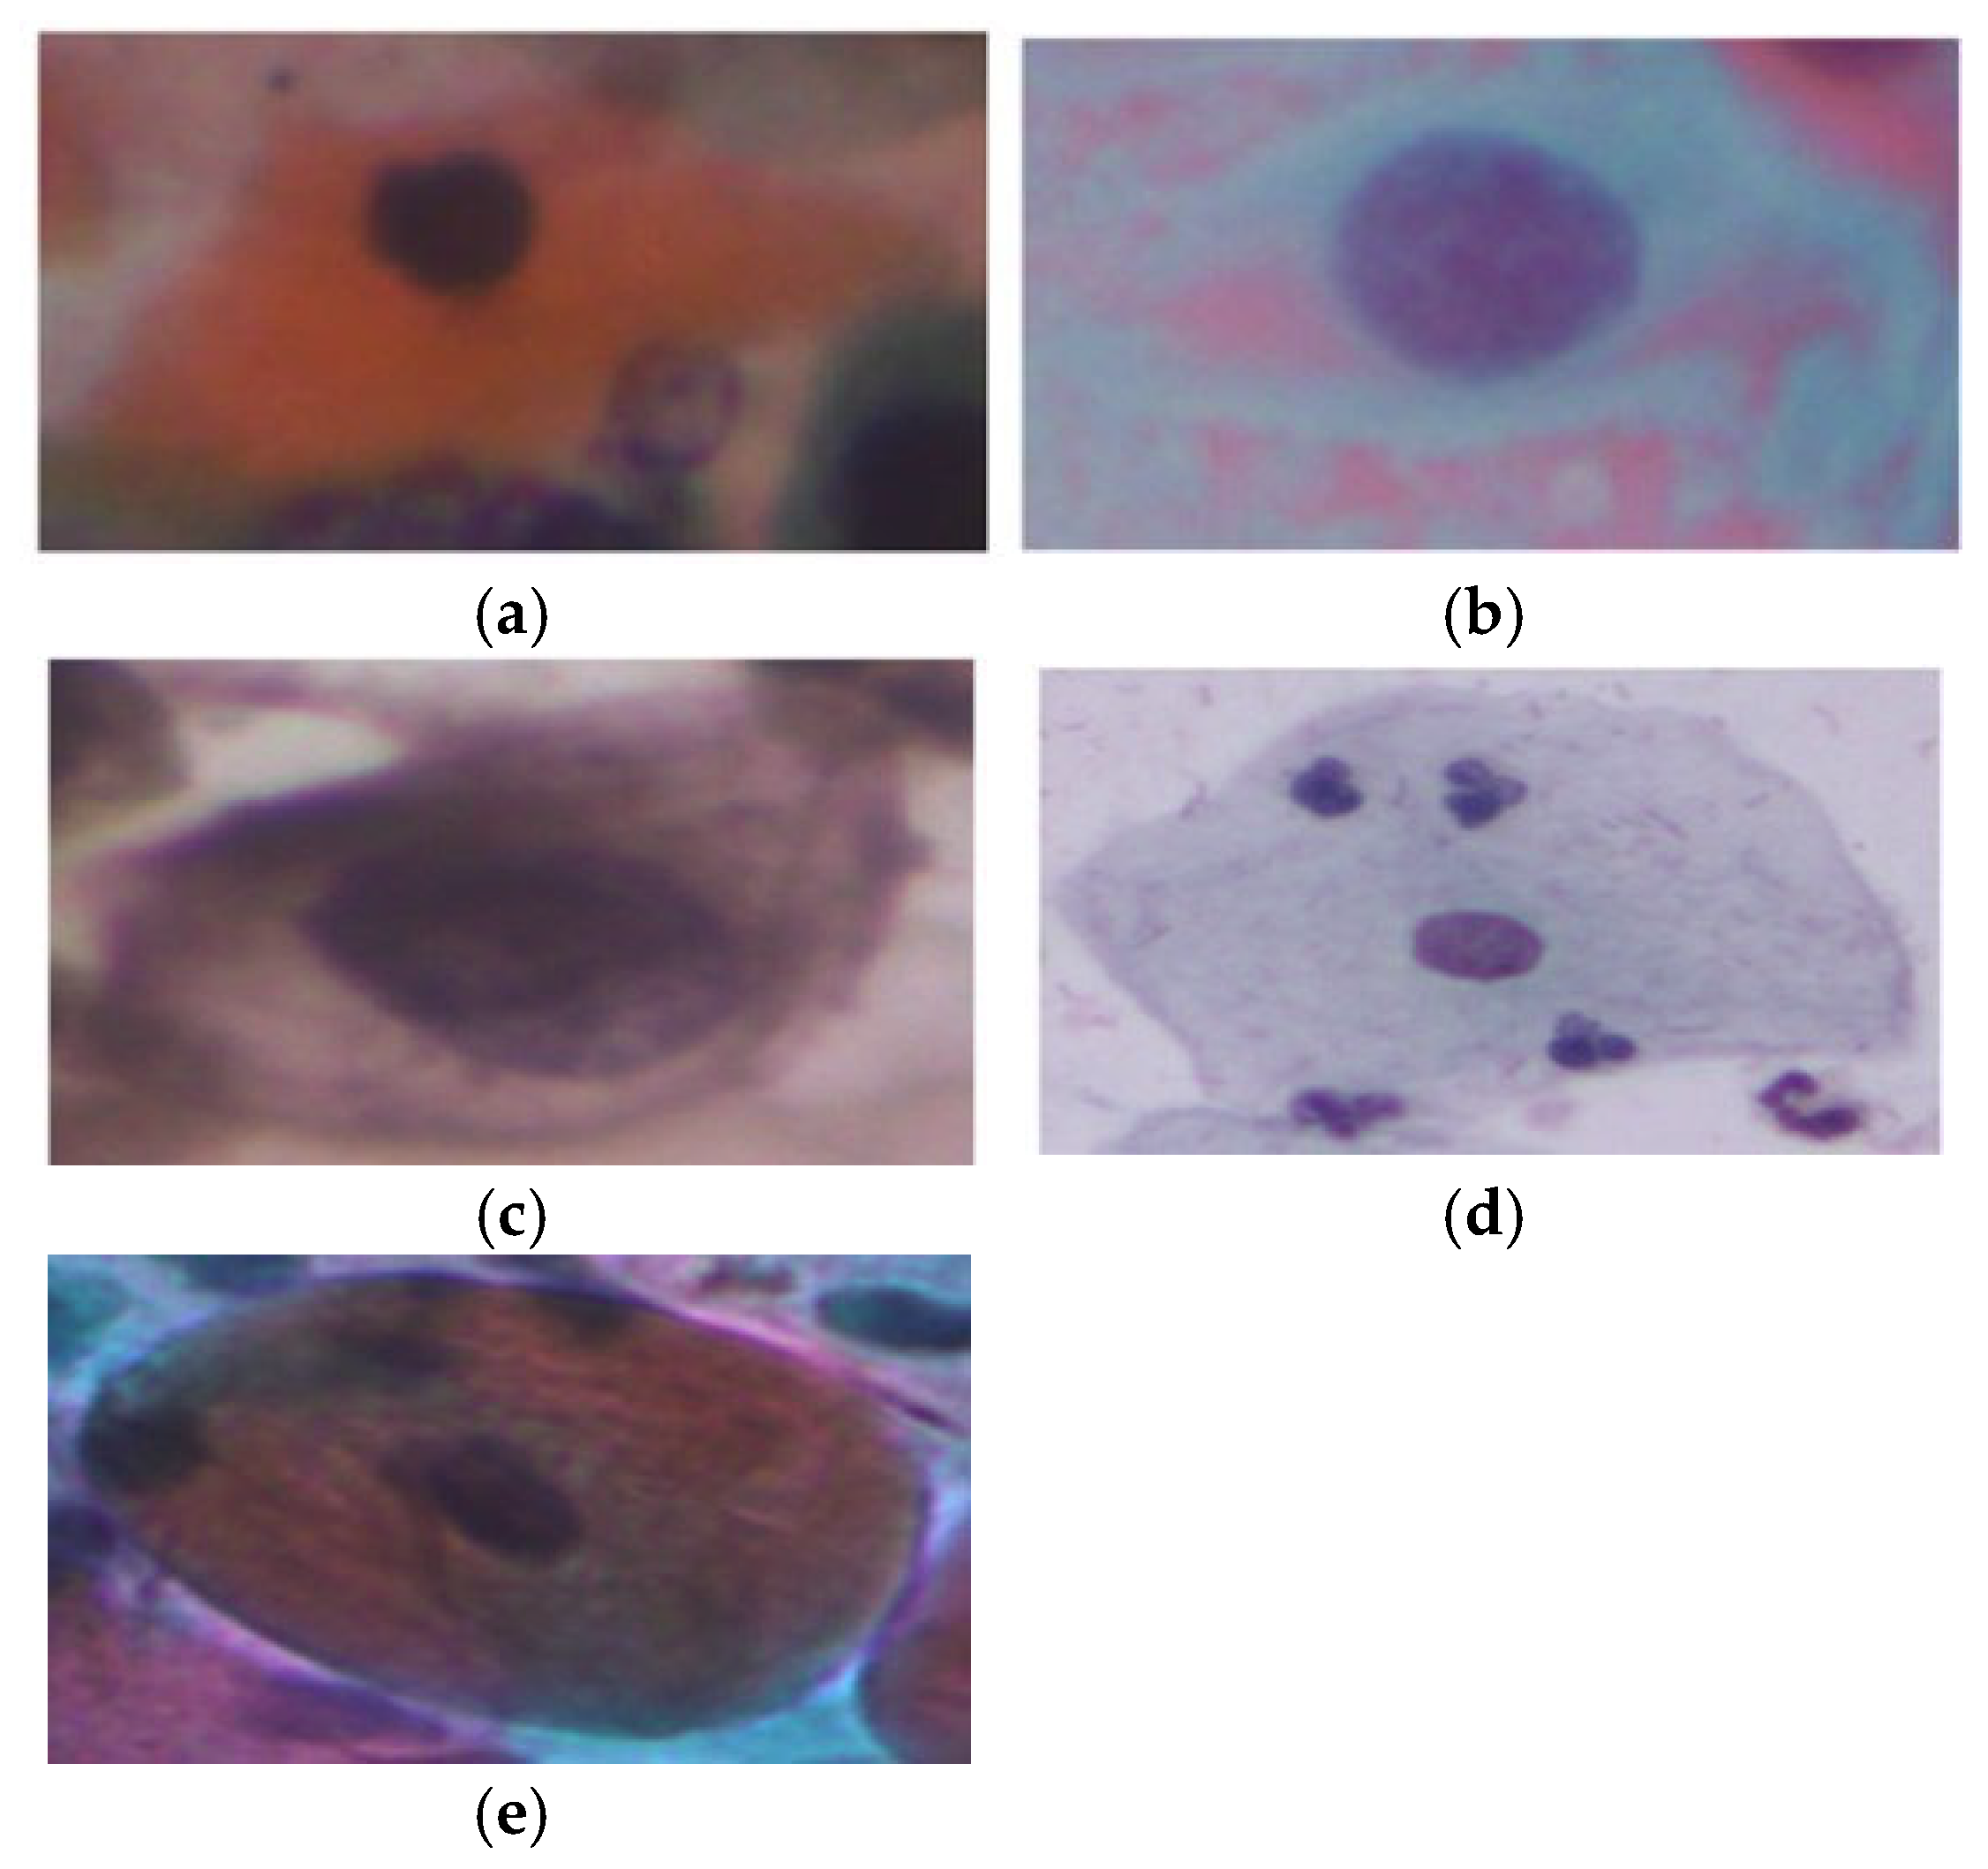
The SIPAKMED dataset includes five cell types; parabasal and superficial–intermediate (normal), metaplastic (benign) and koilocytotic and dyskeratotic (abnormal). Figure 2 shows example images for each class.

3.3. Data Augmentation and Image Processing

Data augmentation [27] strategy is key to solving the problem of class imbalance. It aids in balancing data distribution. The image quantities of numerous classes are variable as seen in Table 2 and Table 3. Data augmentation is used to reconstruct images from original ones by using several parameters such as cropping, flipping and rotating. Table 4 below lists the parameters taken into account for data augmentation. The following factors have been considered in the processing of the images.
(a)
Image Resizing—All images are resized to 28 × 28 pixels to match PathMNIST resolution.
(b)
Image Normalization—Since images are captured under varying lighting conditions, normalization is applied to standardize pixel values. This stabilizes gradients and speeds up convergence during training. The mean and standard deviation values used are shown in Table 5.

3.4. Comparative Analysis of Various Scratch YOLO Frameworks in Classification Task

Below in Table 6, we have done a comparative analysis across various scratch YOLO models (nano, small, and medium variants) to select the best-performing scratch model. As per observation, the YOLO* model has achieved the best accuracy as well as in terms of GFLOPs and total time taken to train the model using the PathMNIST dataset.
YOLO*m shows the best balance of classification accuracy, computational efficiency, and model complexity among all the YOLO variations that are tested. This model has achieved an accuracy of 98.30% and an F1-score of 98.29%, which is about the same as the best models, but it has cost much less to execute. YOLOv5m has a slightly better accuracy value of 98.60%, but it needed 25.37 M trainable parameters and 0.683 GFLOPs, which is more complex to compute. YOLO*m, on the other hand, has a reduced parameter count of 20.126 M, and the number of GFLOPs is 0.487, which is a better balance between performance and efficiency. So, YOLO*m is the best model because it is quite accurate and does not need as much processing resources.
As PathMNIST dataset has moderate class imbalance with unequal numbers of samples for the nine class types, we display the class-wise precision, recall, F1-score values generated when our proposed model is evaluated on this dataset. Table 7 shows the results of these metrics across all class labels.
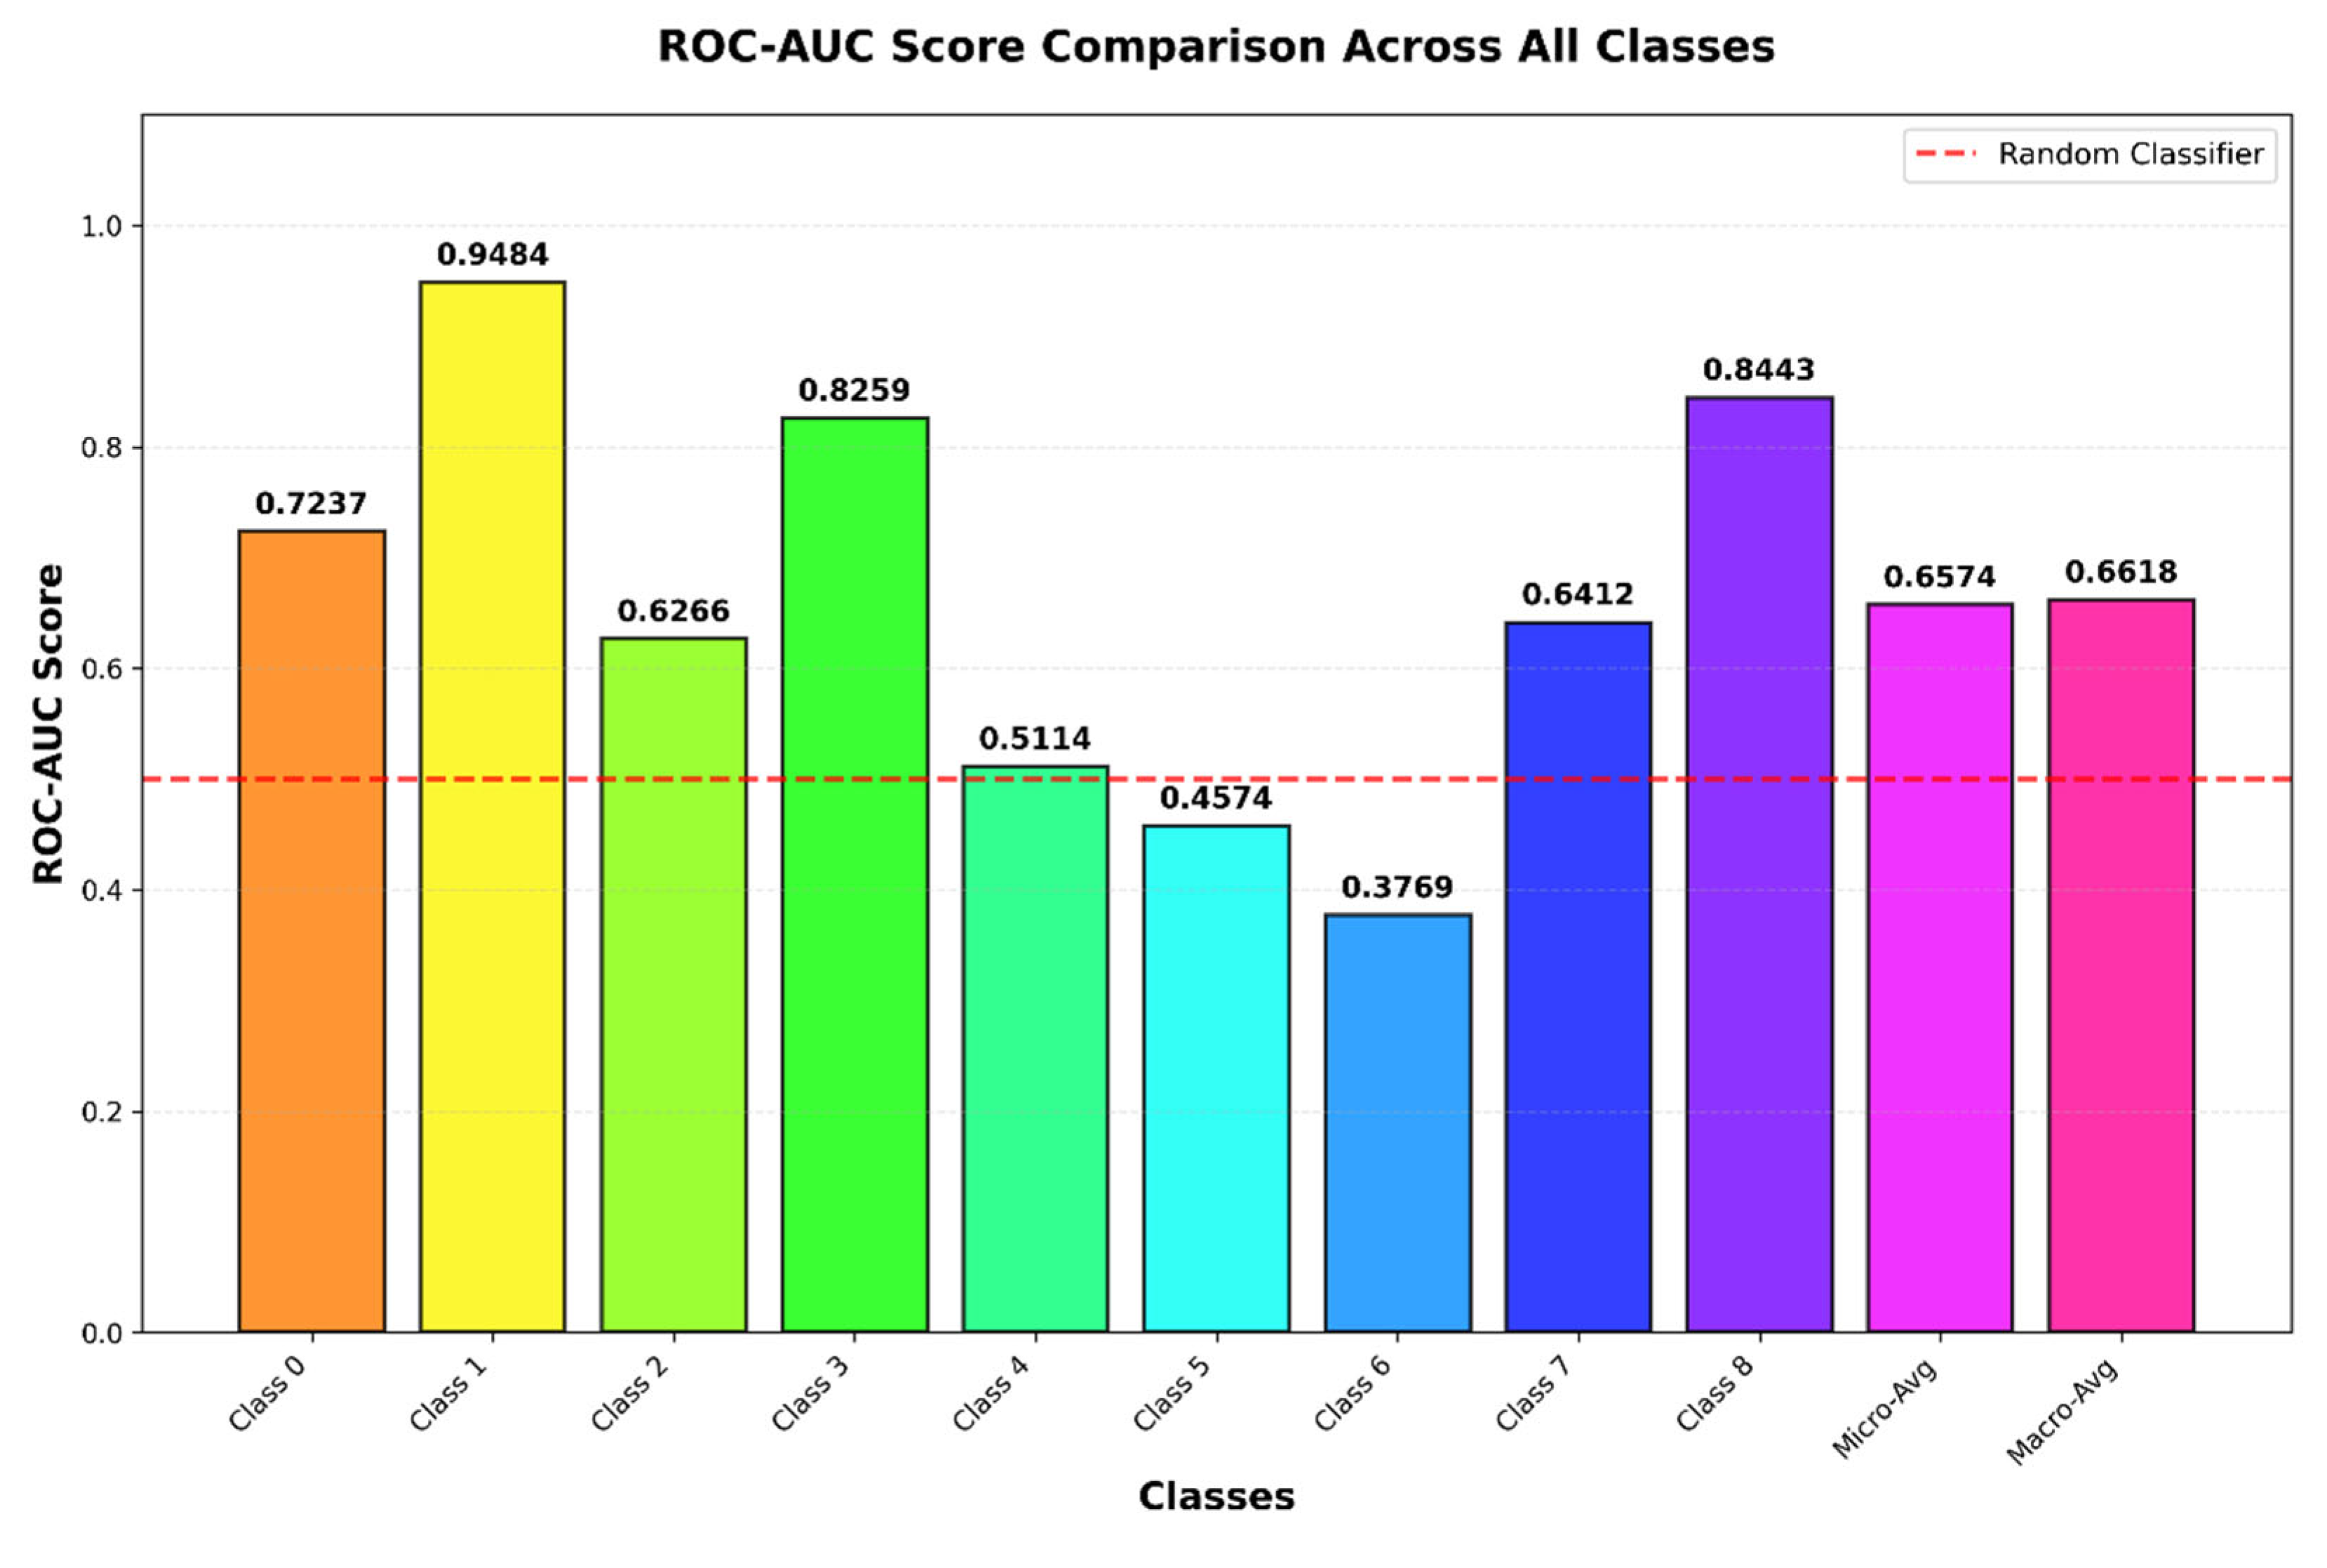
The proposed model when evaluated with PathMNIST dataset is evaluated using class-wise ROC-AUC, micro-average ROC-AUC and macro-average ROC-AUC, which are widely accepted evaluation measures for imbalanced multi-class classification problems. The ROC-AUC results presented in below Figure 3 demonstrates that the proposed model achieves strong discriminative capability for most tissue categories.
Class 1 achieves the highest AUC of 0.9484, indicating excellent discrimination between this class and the remaining classes. Class 8 and Class 3 also achieve high AUC values of 0.8443 and 0.8259, respectively, demonstrating robust classification performance. Class 0 obtains an AUC of 0.7237 indicating good separability. The AUC values of classes 2 and 7 are moderate having values as 0.6266 and 0.6412, respectively, but still above random performance. The substantial lower AUC values for classes 4, 5 and 6 are mostly due to the inherent difficulty of these tissue classes that are morphologically quite similar to adjacent classes and have relatively fewer representation samples. These challenging categories are commonly reported in the PathMNIST benchmark and are therefore not unique to the proposed method. More importantly, the overall evaluation remains balanced as evidenced by micro-average AUC value of 65.74% and macro-average AUC value of 66.18%. The close agreement between these two values indicates that the classifier maintains consistent discrimination across different classes and is not excessively biased towards the majority categories. If the model was dominated by larger classes, a substantially higher micro-average than macro-average AUC would typically be observed. The similarity between these two measures therefore suggests that the proposed framework generalizes reasonably well despite the moderate class imbalance.

3.5. Scratch Classification Model Architecture

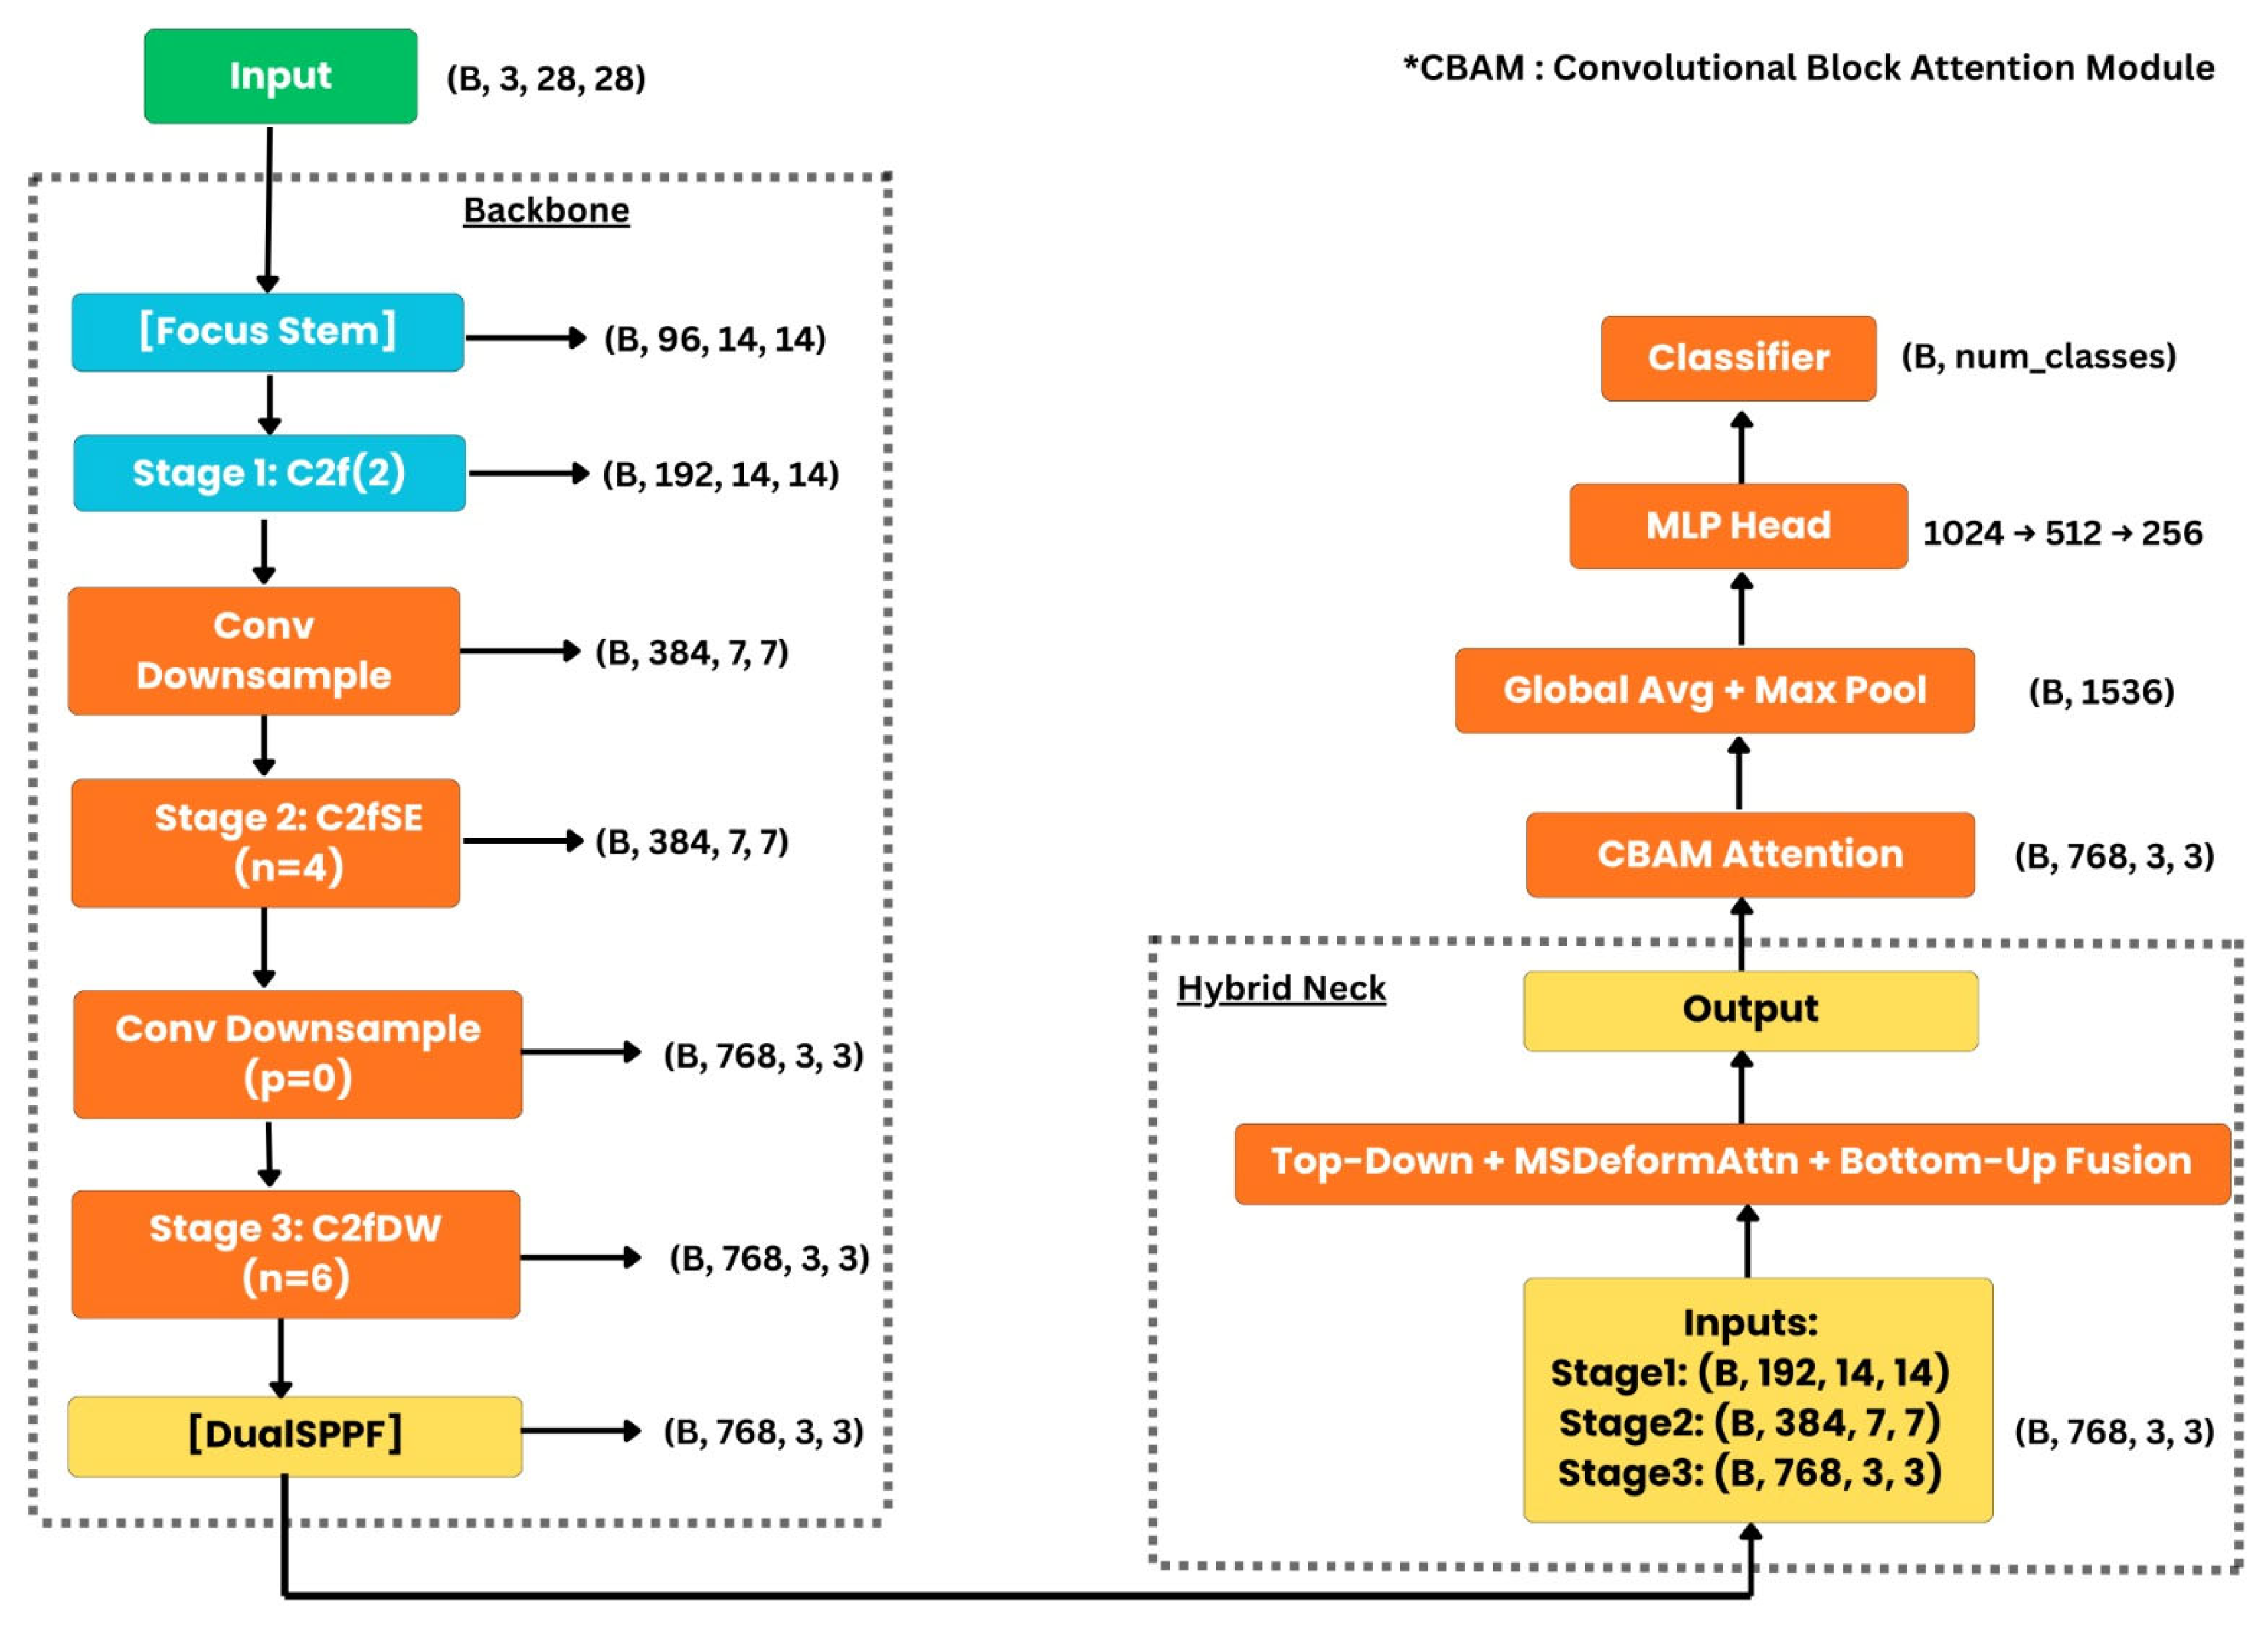
Our proposed model is named YOLO* since it is an improved and optimized version of the basic YOLOv5 medium variant that uses a number of sophisticated architectural parts. The * symbol stands for the addition of specific feature extraction, attention, and feature fusion algorithms that make the original YOLO framework more powerful. The model combines the efficient YOLOv5m backbone with C2f-based feature learning, Dual-Spatial Pyramid Pooling Fast (SPPF) for multi-scale contextual feature aggregation, Multiscale Deformable Attention-based (MSDeformAttn) hybrid neck fusion, top-down and bottom-up feature propagation, and Convolutional Block Attention Module (CBAM) to improve the ability of cervical cell image classification. Also, a custom multi-layer perceptron (MLP) classification head is included to improve the accuracy of class predictions. The backbone, neck, attention block and classification head are the four main modules that make up the architecture. The detailed workflow of our proposed model YOLO* is shown below in Figure 4.
(i)
Backbone Structure—this progresses linearly through five stages. Focus stem, Stage1, Down1, Stage2, Down2 and Stage 3. The backbone uses a hierarchical feature extractor with progressive spatial downsampling and channel expansion, inspired by YOLOv5. It starts with a Focus stem that reduces spatial resolution from 28 × 28 to 14 × 14 by rearranging spatial information into channel space without information loss. C2f-based modules, which are cross-stage partial (CSP) variations that improve gradient flow and parameter efficiency, are used for further feature extraction. There are three variations used. C2fSE uses SE attention to recalibrate channel-wise responses; C2fDW uses depthwise separable convolutions to lower computational complexity in deeper layers, and C2f (conventional bottleneck blocks) is used for early-stage feature learning. Strided convolutions diminish spatial resolution (14->7->3) while increasing channel dimensionality (96->192->384->768), allowing for the abstraction of hierarchical features.
(ii)
Hybrid Neck—For multi-scale fusion, the neck presents a Hybrid Feature Pyramid Network (FPN) that blends top-down and bottom-up routes. After being projected into a single channel dimension, features from the three backbone stages (14 × 14, 7 × 7, and 3 × 3) are fused through.
Top-down method: Upsampling and combining low-level and high-level semantic features.
Bottom-up refinement: To further enhance aggregated features, downsampling and fusion are employed. An essential component of the method is the integration of Multiscale Deformable Attention (MSDeformAttn), which enables adaptive spatial sampling across feature maps. By learning a sparse set of sample offsets, this module significantly reduces computing complexity while maintaining global context modeling, in contrast to traditional attention algorithms. This hybrid design effectively captures both global contextual relationships and local fine-grained details.
(iii)
Attention Module (CBAM)—To further improve the feature representation, a Convolutional Block Attention Module (CBAM) is employed following the neck. While channel attention employs global average and max-pooling followed by shared MLPs, spatial attention requires convolution over aggregated channel descriptors, as CBAM gradually deduces. Because of this dual attention approach, which improves feature quality prior to classification, this network focuses on discriminative feature channels and informative areas.
(iv)
Classification Head—The classification head is implemented using a deep MLP with residual connections. Spatial information is initially aggregated using Global Max Pooling (GMP) and Global Average Pooling (GAP), whose outputs are concatenated to provide a comprehensive global descriptor. The final feature vector is calculated using three fully connected layers with progressively decreasing dimensionality (1024->512->256), which incorporate residual skip connections for gradient propagation, batch normalization, and SiLU activation for non-linearity. Lastly, the final linear layer maps the learned representation to the necessary number of output classes.
Thus, the model integrates multiscale feature fusion, convolutional efficiency, and attention mechanisms into a single framework. This method makes it particularly suitable for fine-grained image classification jobs on low-resolution inputs, such as medical cytology datasets, where both local detail and global context are essential.

3.6. Software and Hardware Used

The experiments are run at Google Colab on an NVIDIA A100 GPU for training, using PyTorch (2.5.1) and Torchvision (0.20.1). The system has an 11th generation Intel Core i5 processor with 16 GB of RAM.

4. Execution Results

This section presents the analysis and results of our experimental investigation.

4.1. Hyperparameters Used

In the experimental setting, we first trained our scratch model (nano, small, and medium variants) for 100 epochs using the hyperparameter values as mentioned in Table 8. It is observed that the medium variant has outperformed the remaining variants in terms of accuracy, F1 score, trainable parameters, and GFLOPs. Hence, we choose the medium variant of our proposed scratch model, and it is then fine-tuned and executed on the SIPAKMED dataset. In this phase, the model is run for 750 epochs with the AdamW optimization method. The learning rate value is 0.0001, the weight decay coefficient value is 0.0001 and the scheduler is CosineAnnealingWarmRestarts, with a parameter value for the anneal strategy as ‘cos’. The AdamW optimizer is chosen because it routinely surpasses other optimizers in vision tasks, owing to its efficient weight decay regularization. We applied cross-entropy Loss with label smoothing. PathMNIST is a multi-class histopathology image classification problem with nine tissue classes; hence, cross-entropy loss is a good choice for optimizing class discrimination. To reduce overconfident predictions and enhance model generalization, especially in histopathology images where tissue borders and morphological traits may exhibit inter-class similarities, we included a label smoothing factor of 0.1. Additionally, label smoothing helps with probability calibration and prevents overfitting, leading to more robust classification results on unseen samples. Cross-entropy loss with label smoothing provides a good trade-off between optimization stability and classification accuracy due to the moderate class imbalance of PathMNIST.

4.2. Performance of Competitive CNN Classification Models

Among several CNN models, ResNet34, MobileNetV2, and EfficientNetB0 are chosen carefully as they have different architectural features that are widely used and have shown consistent results for analyzing medical images. These models embody distinct design philosophies in deep learning, facilitating a thorough assessment of the proposed domain-specific transfer learning technique [28,29].
ResNet34 is famous for its residual learning process, which solves the vanishing gradient problem and allows more features to be extracted from the data. MobileNetV2 is chosen because it has a lightweight design that uses depthwise separable convolutions and inverted residual blocks. As it is computationally efficient and has fewer parameters and GFLOPs, it is good for medical screening applications that need to be performed in real-time and with limited resources. We also selected EfficientNetB0 because its compound scaling technique balances network depth, width, and resolution for high accuracy with fewer parameters. This makes it possible to learn features quickly while keeping the computational cost low. Our experimental results show the efficacy of PathMNIST-based domain-transfer pretraining across these three prevalent CNN architectures, differing in complexity, computational complexity, and feature extraction capabilities. Constant improvement is seen in all topologies, which supports the strength and generalizability of the proposed transfer learning method for classifying cervical cancer.
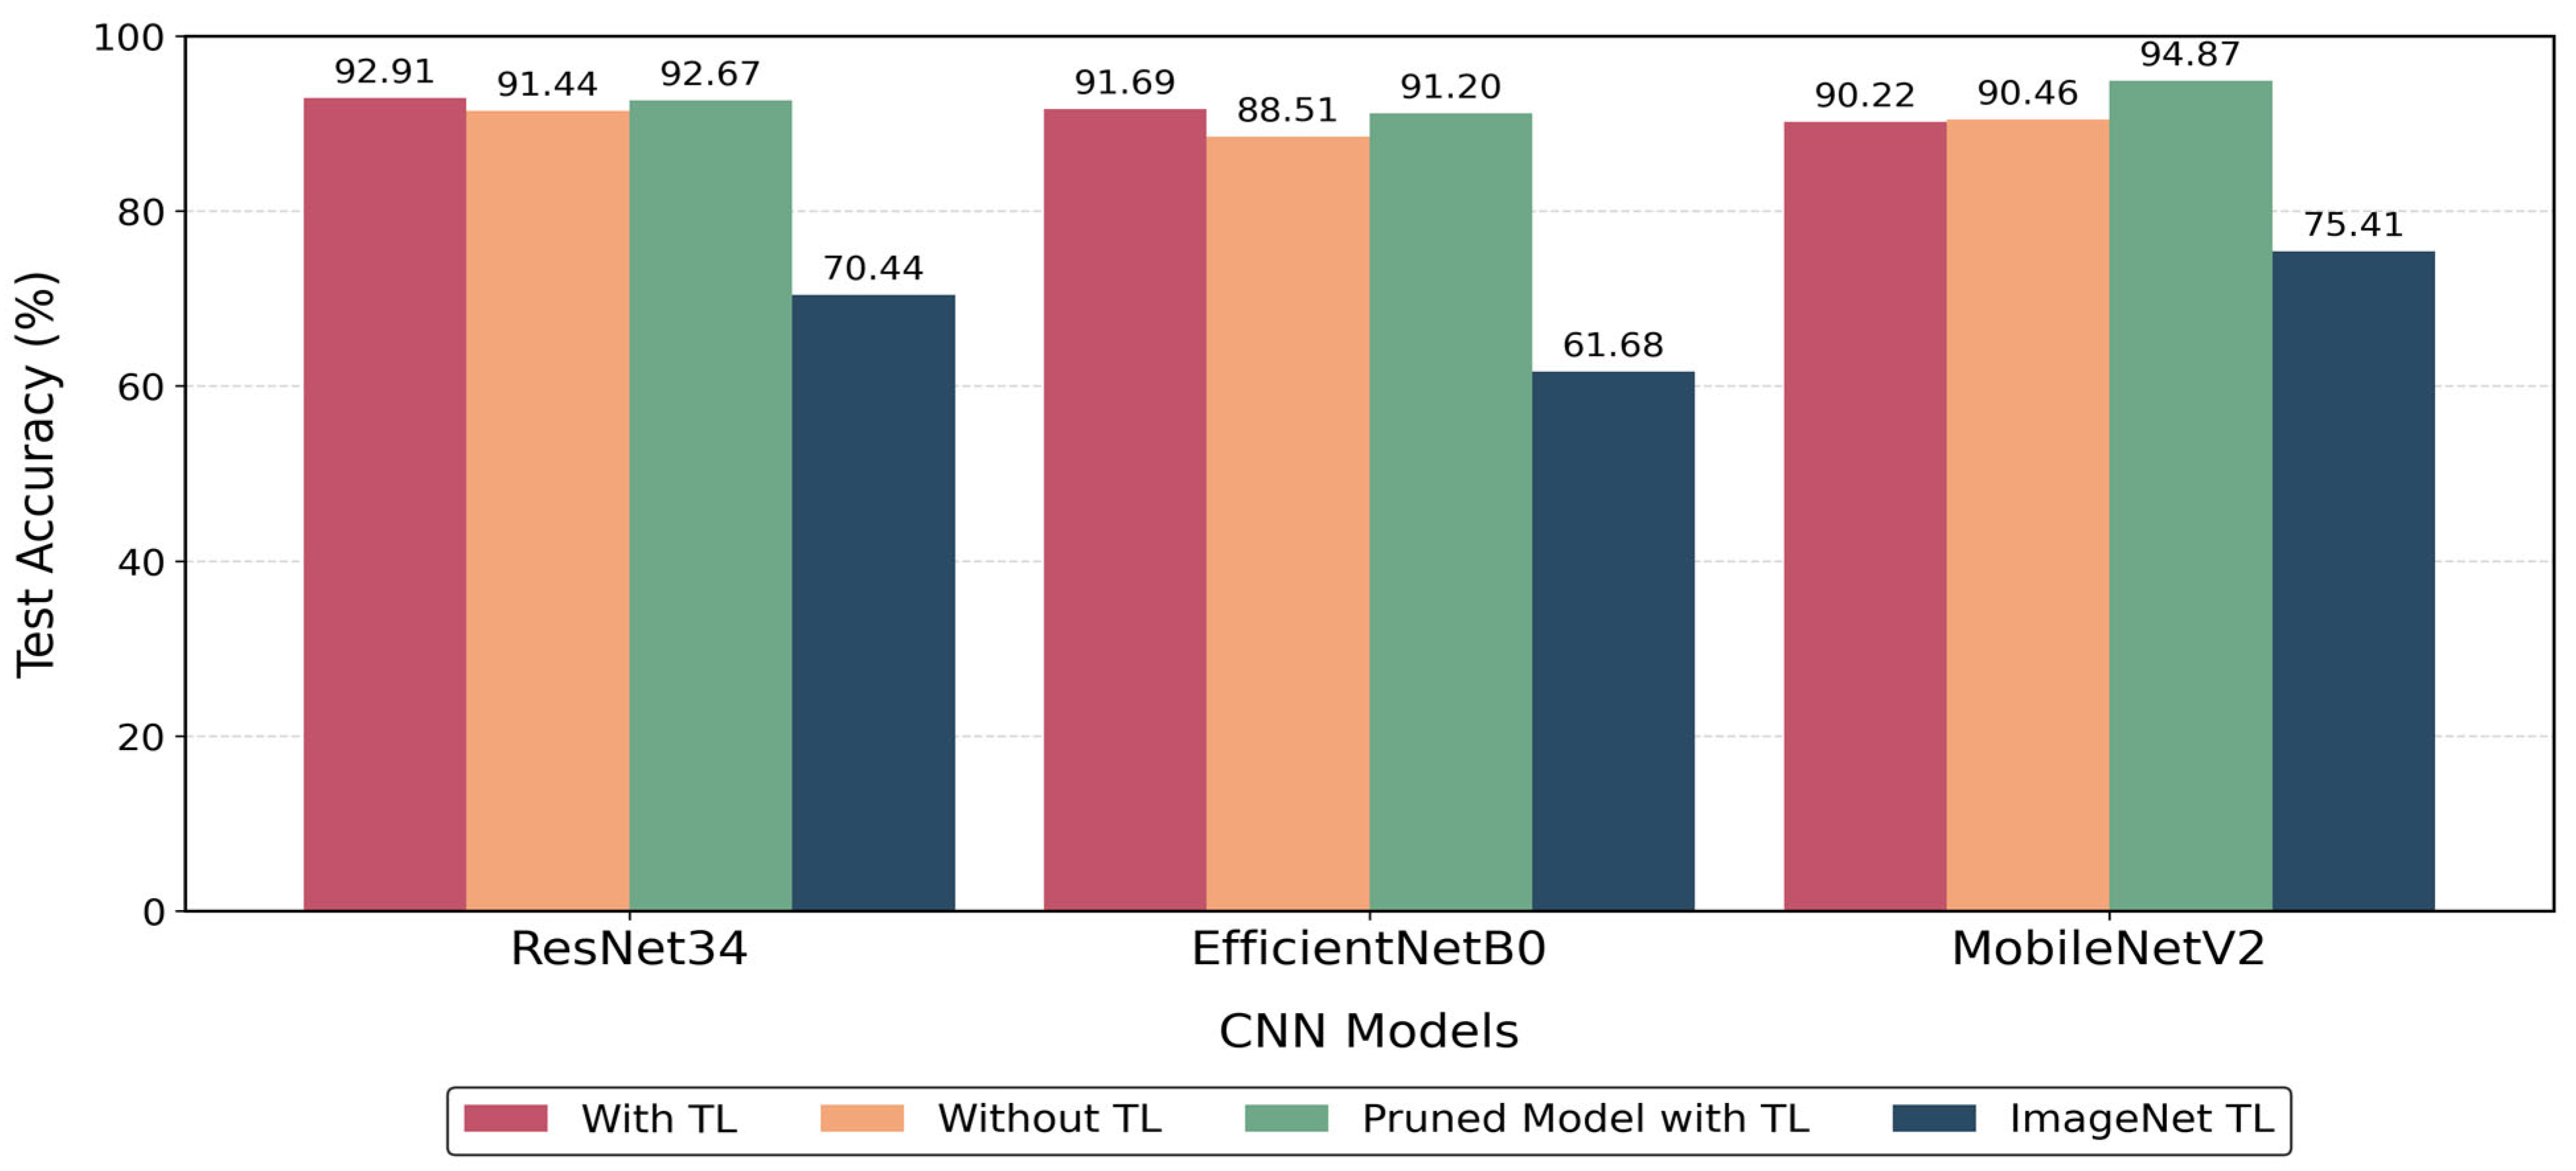
The experimental findings unequivocally indicate that domain-specific pretraining on PathMNIST, succeeded by fine-tuning on SIPAKMED, consistently surpasses traditional ImageNet-pretrained transfer learning methodologies for cervical cell classification. The enhancement is due to PathMNIST’s inclusion of histological and medical image features that are more pertinent to cervical cytology compared to the natural images seen in ImageNet. The suggested domain-specific transfer learning strategy for ResNet34 has attained a test accuracy of 92.91% and F1-score of 92.88%, while the ImageNet-pretrained version only achieved 70.44% accuracy. EfficientNetB0 with PathMNIST pretraining also performed better than the ImageNet-based model, which only achieved 61.68% accuracy and 91.68% F1-score. The ImageNet-pretrained model for MobileNetV2 achieved 75.41% accuracy. The proposed medical-domain transfer learning technique raised the accuracy to 90.22%, and the pruned model variation raised it even more to 94.87%. Table 9 contains the experimental results across scratch ResNet34, EfficientNetB0, and MobileNetV2 models using transfer learning (pretrained on PathMNIST and fine-tuned on our custom dataset), without transfer learning, a pruned model with transfer learning (pretrained on PathMNIST and fine-tuned on our custom dataset), and an ImageNet-pretrained model run on our dataset. All the test scenarios were executed for 500 epochs.
Figure 5 displays the justification for the above table data with more clarity. These results show that pretraining in the medical domain helps the models learn texture, cellular morphology, and staining properties that are specific to the disease. This makes it easier for them to generalize and classify features. On the other hand, models that have been trained on ImageNet are better at interpreting natural images and may not be able to pick up on fine-grained cytological patterns as well. Consequently, the suggested two-stage transfer learning approach offers enhanced discriminative learning for the cervical cancer classification task.
We have also performed the trade-off between classification performance and computational complexity for nano, small, and medium versions of the YOLO* model in cervical cancer image analysis. Each variation has a varied number of parameters, feature extraction capabilities, memory use, and computational cost. This approach helps us fully test the suggested architecture under varying resource limits. Table 10 shows the classification metrics across all the variants along with the trainable parameter count and GFLOPs value. For medical image classification tasks, relying solely on accuracy may not provide a sufficiently comprehensive evaluation of model performance. Hence, for a clinically meaningful assessment of the proposed model’s diagnostic performance, we calculated all the classification metrics such as accuracy, precision, recall/sensitivity, specificity and F1-score for providing a sufficiently comprehensive evaluation of model performance.
The experimental findings indicate that the pruned YOLO* variants consistently surpass both the conventional transfer learning (TL) models and the models trained without TL throughout the nano, small, and medium configurations. This shows that pruning not only gets rid of unnecessary parameters, but it also makes learning features and generalizing models better. The regular YOLO*n model with TL has achieved an accuracy of 93.05% for the nano variant. The pruned YOLO* nano model, on the other hand, achieved an accuracy value of 96.77%. The version without likewise stayed at 93.05%, which shows that pruning and domain-specific TL together make a big difference. In the small variant, the regular YOLO*s model with TL achieved an accuracy value of 95.29%, while the pruned YOLO*s model achieved an accuracy of 97.27%. The model trained without TL only attained 94.54%, which further shows that the suggested pruning and TL technique works. For the medium variant, YOLO*m with TL achieved an accuracy of 96.53%. The pruned YOLO*m model performed even better, with an accuracy value of 96.77%. The non-TL model of this variant only achieved an accuracy value of 95.04%. All five metrics performed equally well for pruned YOLO*m (with TL). This proposed model achieves similar accuracy, recall and F1 score values, suggesting that the model’s performance is not because of class imbalance or bias towards the majority class. That is why we performed our model comparison with the whole set of metrics, since a high-accuracy model can have a low recall of minority class. Table 9 results show that model pruning not only reduced computational complexity, but also maintained and slightly increased the diagnostic performance of the model across all evaluation metrics.
Overall, the results show that utilizing PathMNIST for domain-specific TL and structured pruning together helps the models learn more general and specialized cervical cytology characteristics while cutting down on unwanted network redundancy. As a result, the trimmed variants do a better job of classifying than both the regular TL models and the models that are trained directly on SIPAKMED without TL.

4.3. Performance of Our Proposed Pruned YOLO*m Model

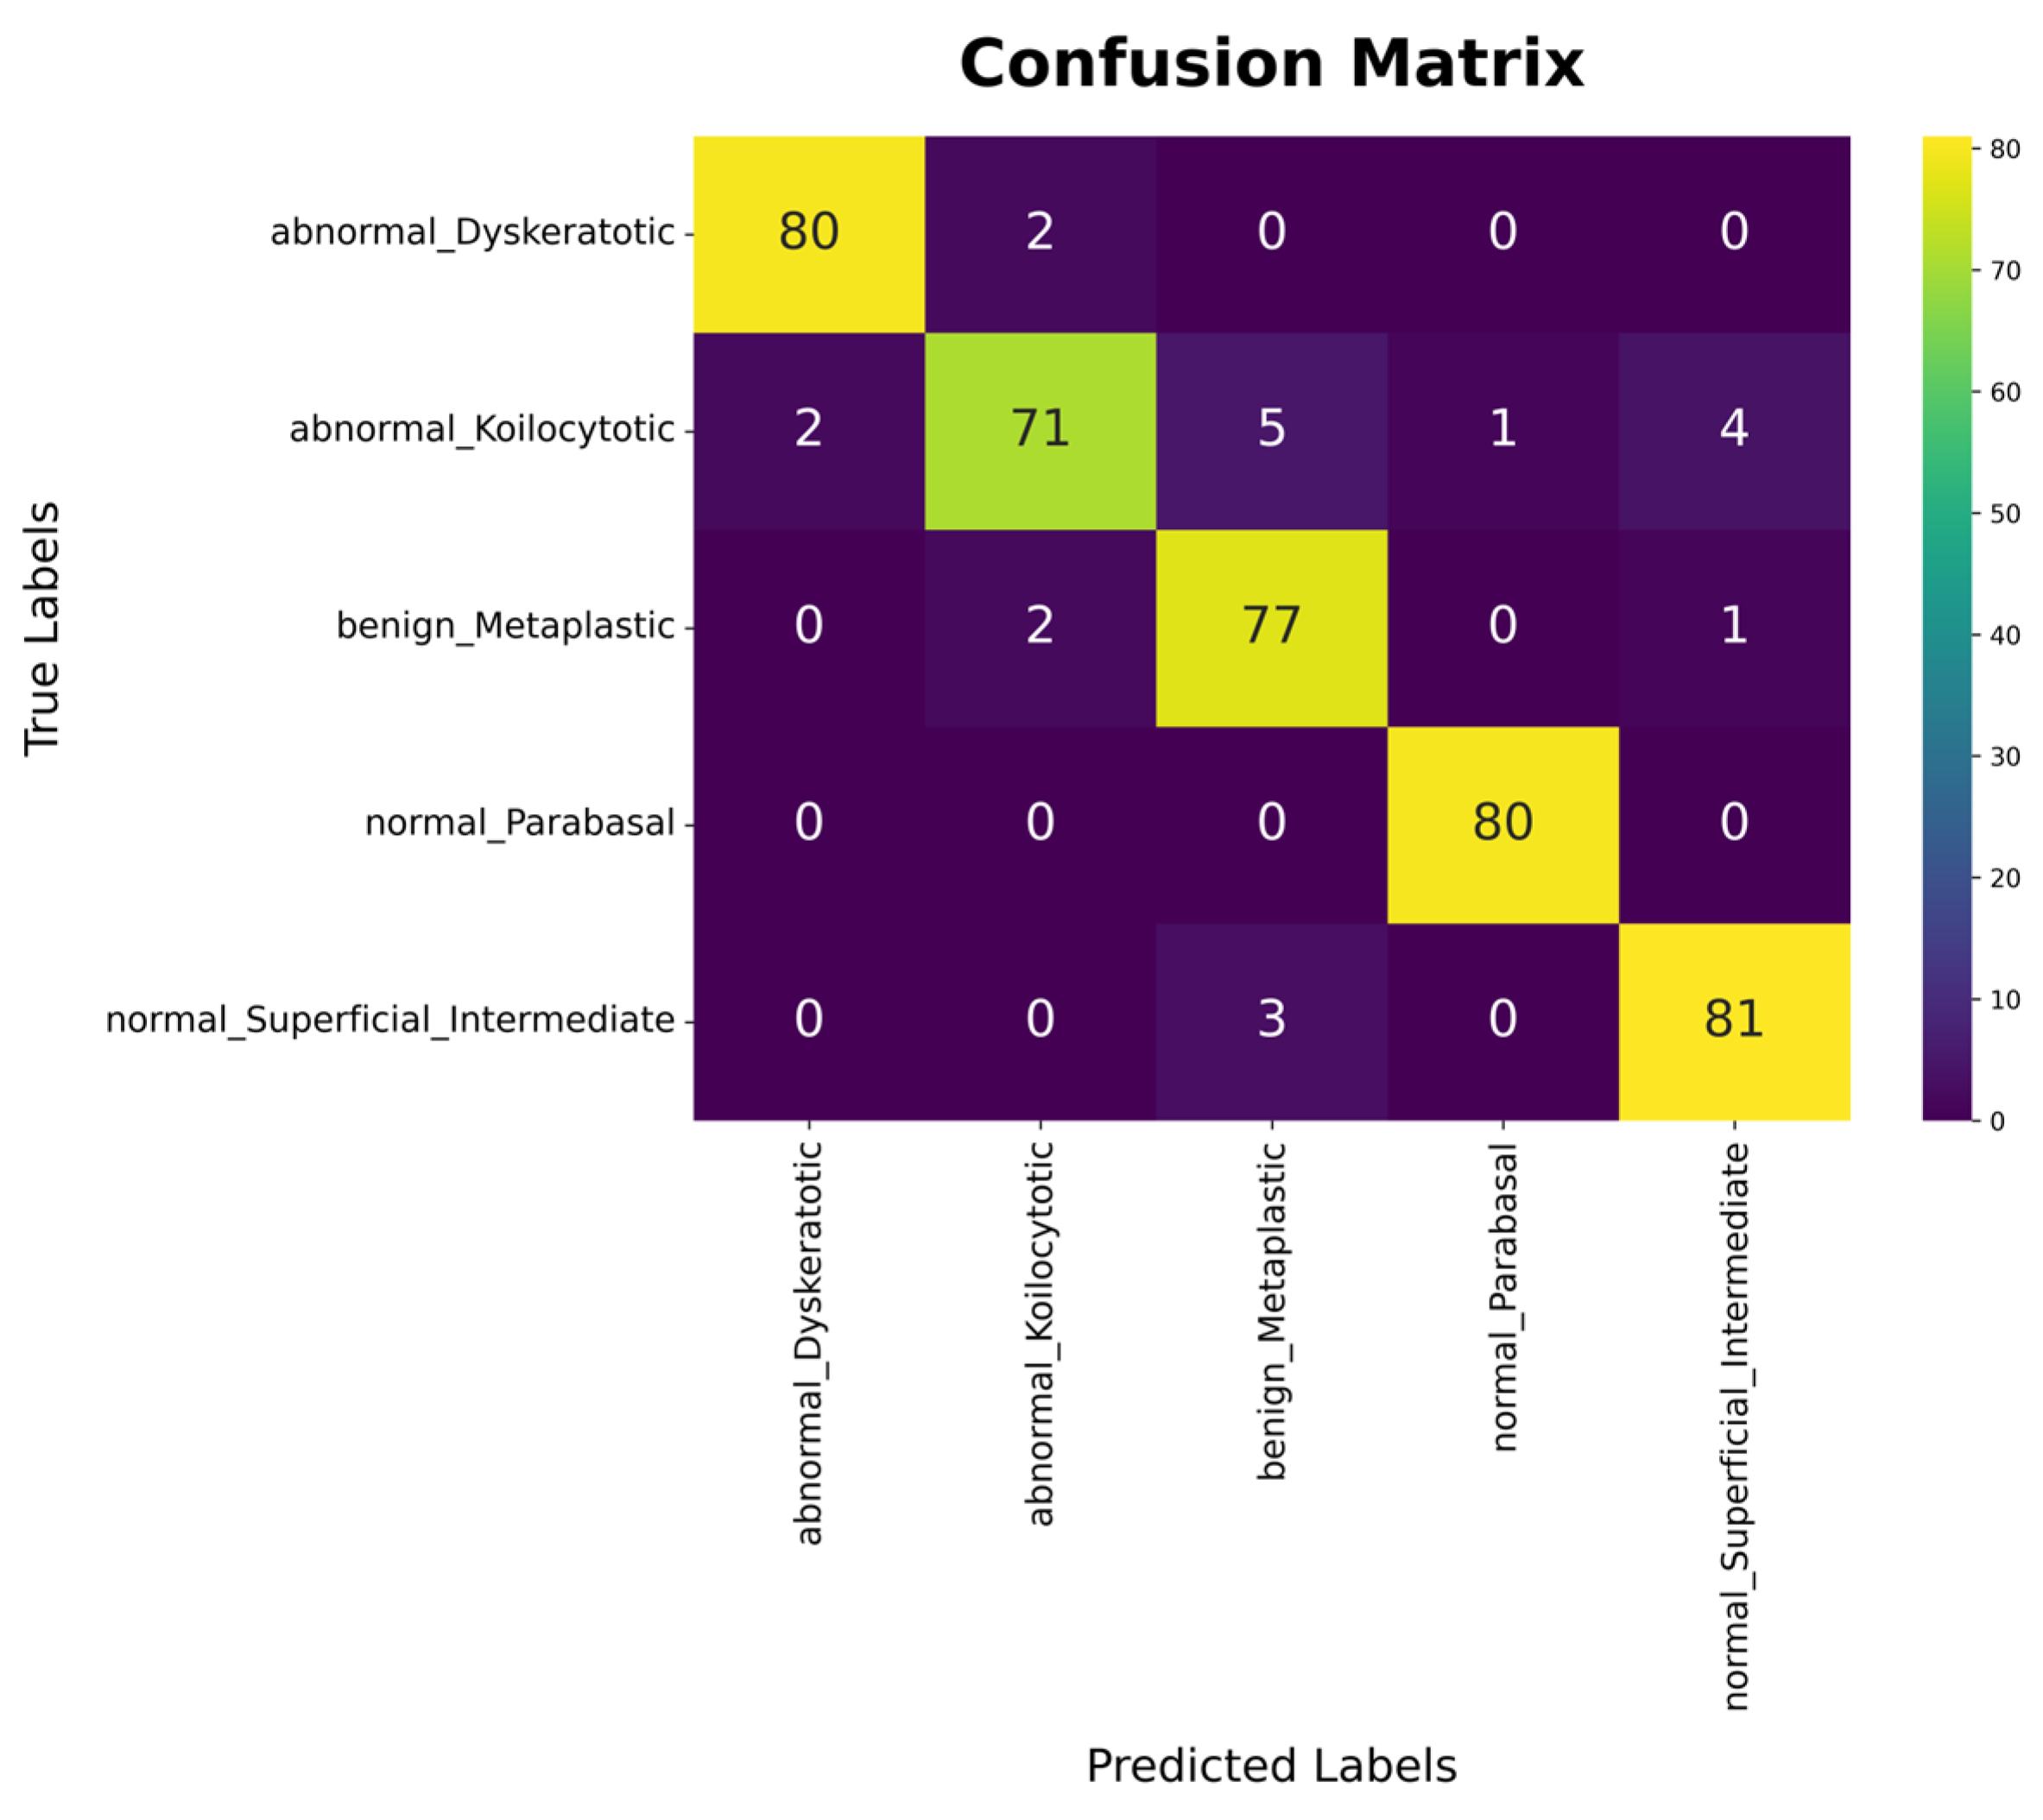
The confusion matrix illustrates the performance of classification model on test data. It shows how well the predicted class labels coincide with the actual class labels. The matrix displays the number of false positives, false negatives, true positives and true negatives. The confusion matrix of our proposed technique on the SIPAKMED dataset is shown in Figure 6.
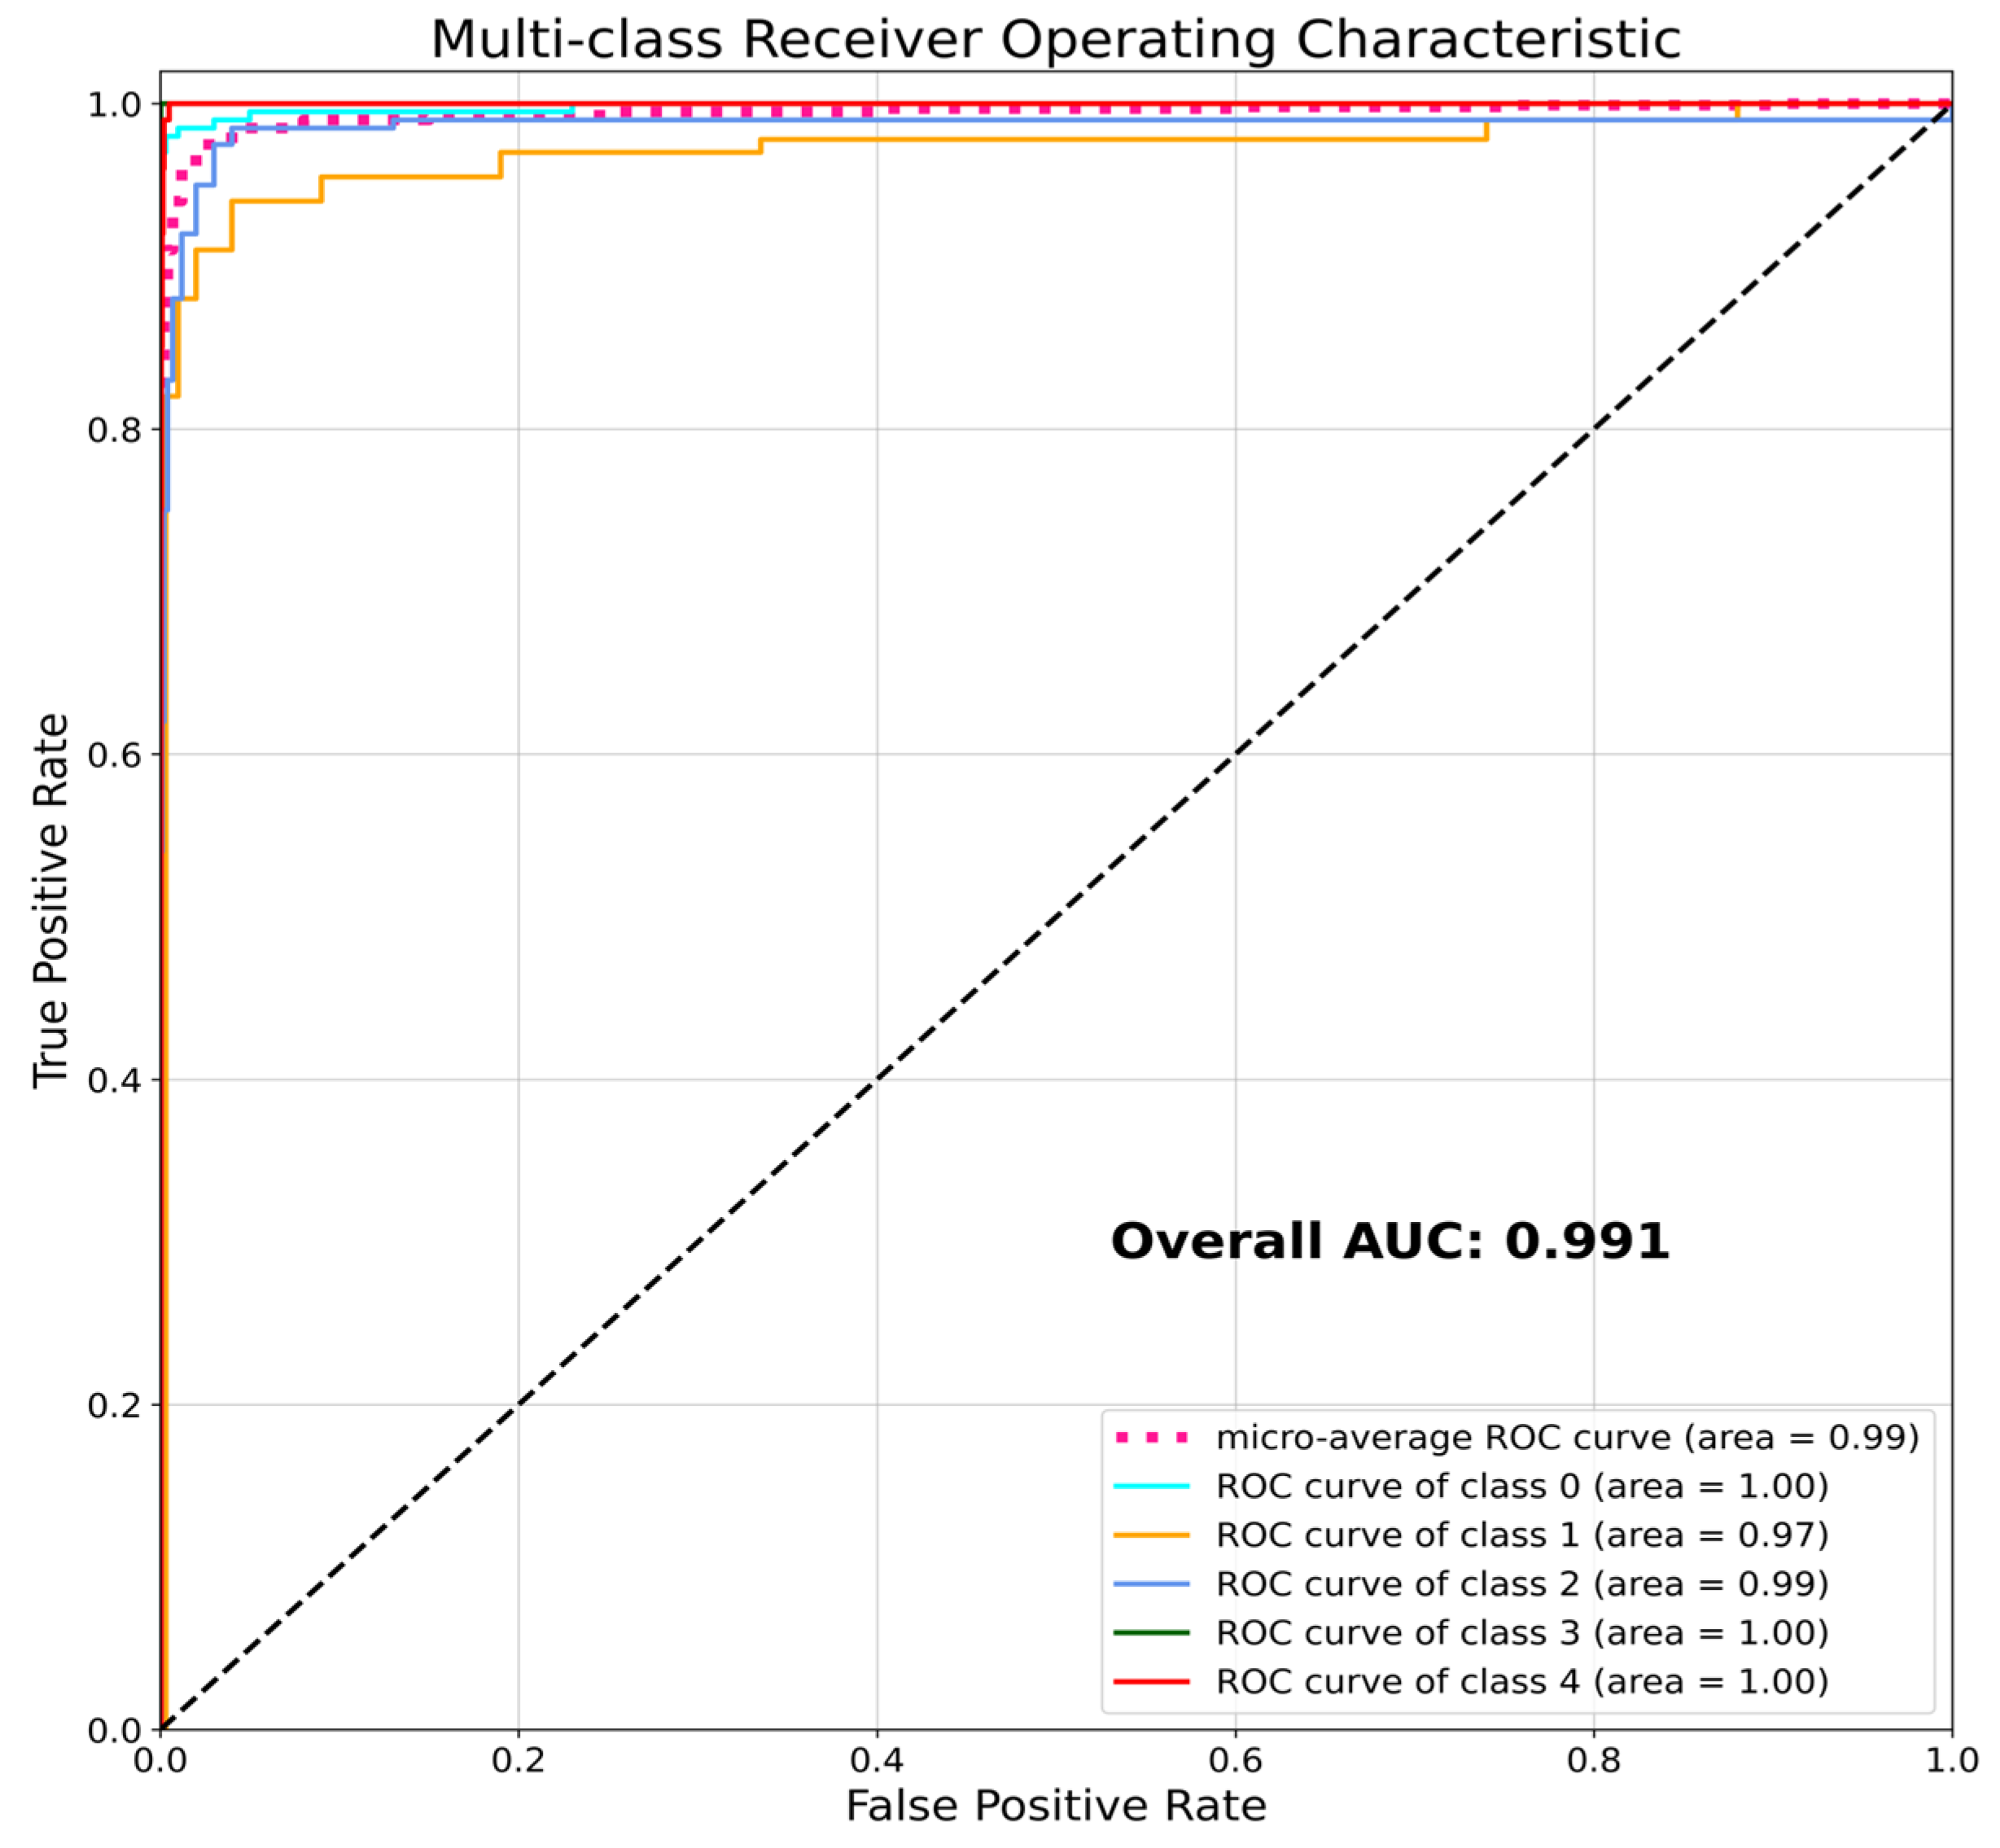
The Receiver-Operating Characteristic-Area Under the Curve (ROC-AUC) figure displayed in Figure 7 demonstrates how well our multi-class classifier worked on the SIPAKMED cervical cell dataset, with each class being compared to the others. The AUC of 0.991 shows that it can tell the difference between different classes very well. Our model can predict the difference between different types of cervical cells perfectly. The micro-average curve adds up the contributions from all classes. A value near 1 suggests that the model works well on all samples, not just some classes. The model learned strong representations of cellular morphological features.
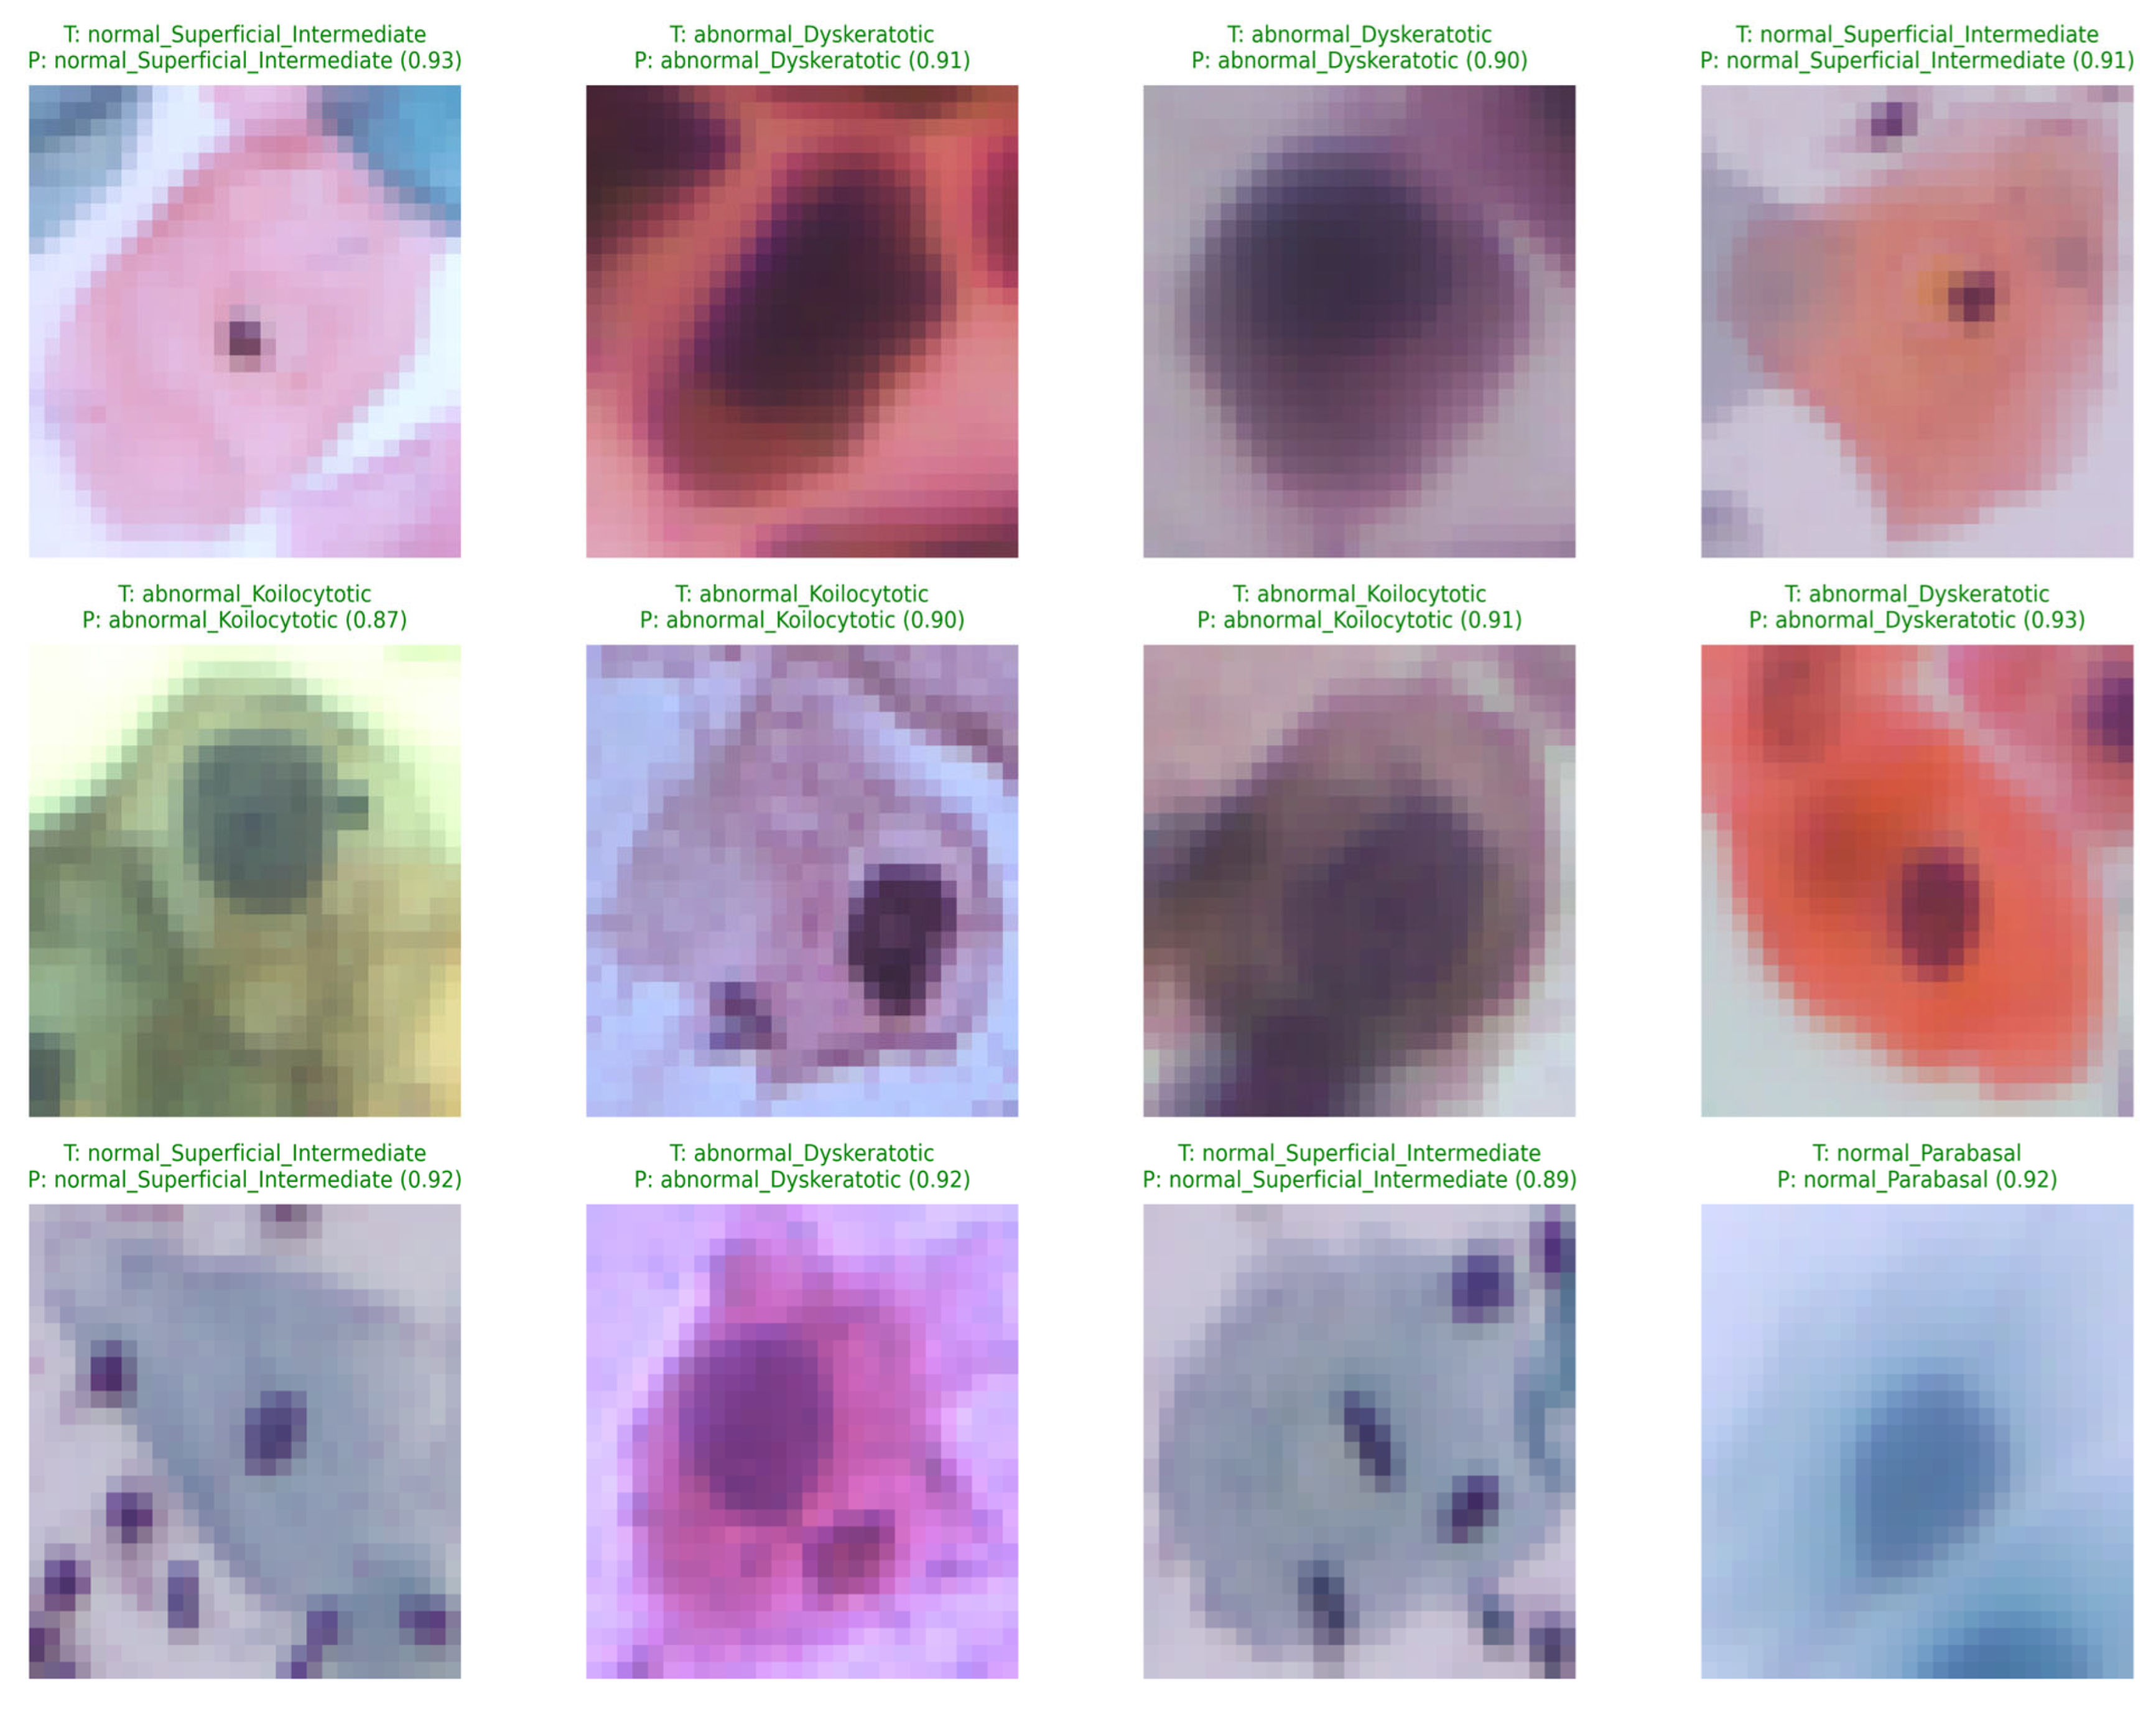
Figure 8 below demonstrates that each of the 28 × 28 SIPAKMED dataset cervical cell patches in the following 3 × 4 grid are labeled with their ground truth label (T:), the model’s projected label (P:), and softmax confidence. Red text indicates that the prediction is incorrect, while green text indicates the prediction is accurate. The proposed model performs well across the five classes of the SIPAKMED dataset, with all green labels across 12 patches.

4.4. Explainability and Interpretability

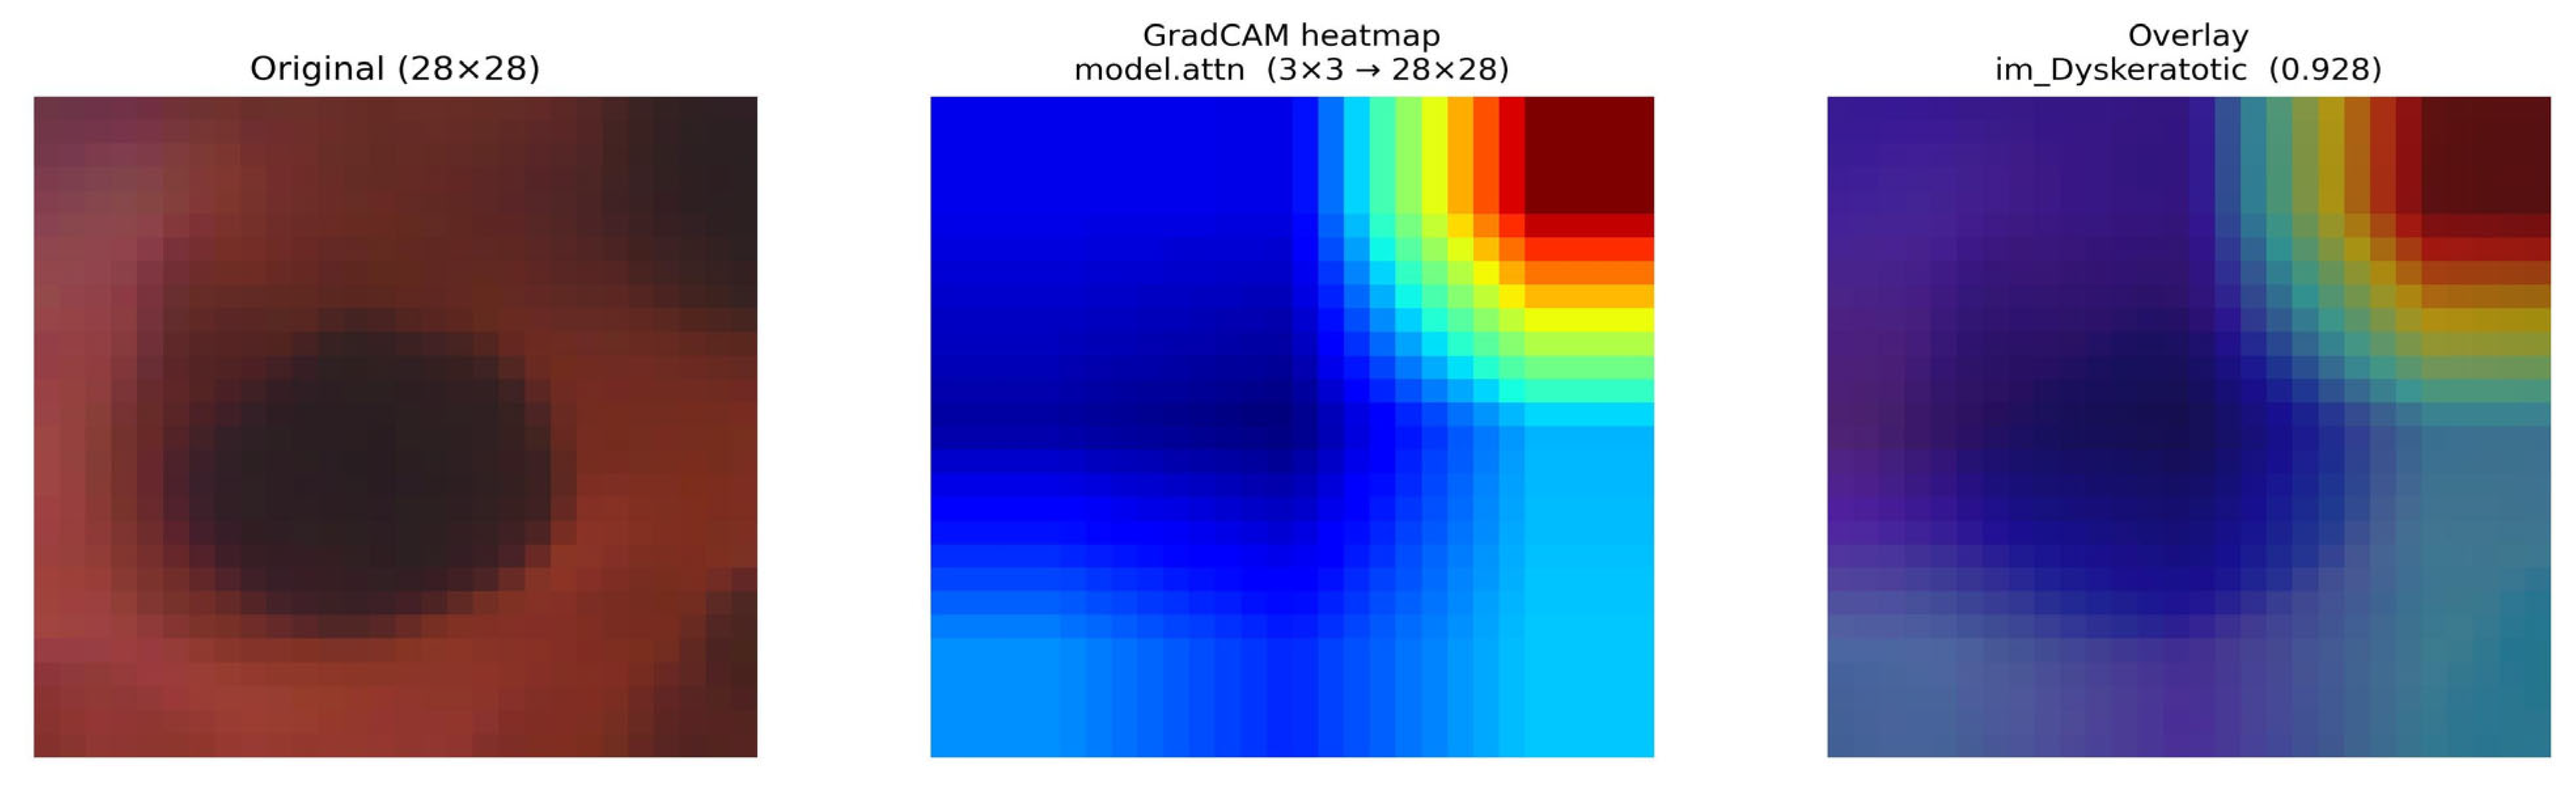
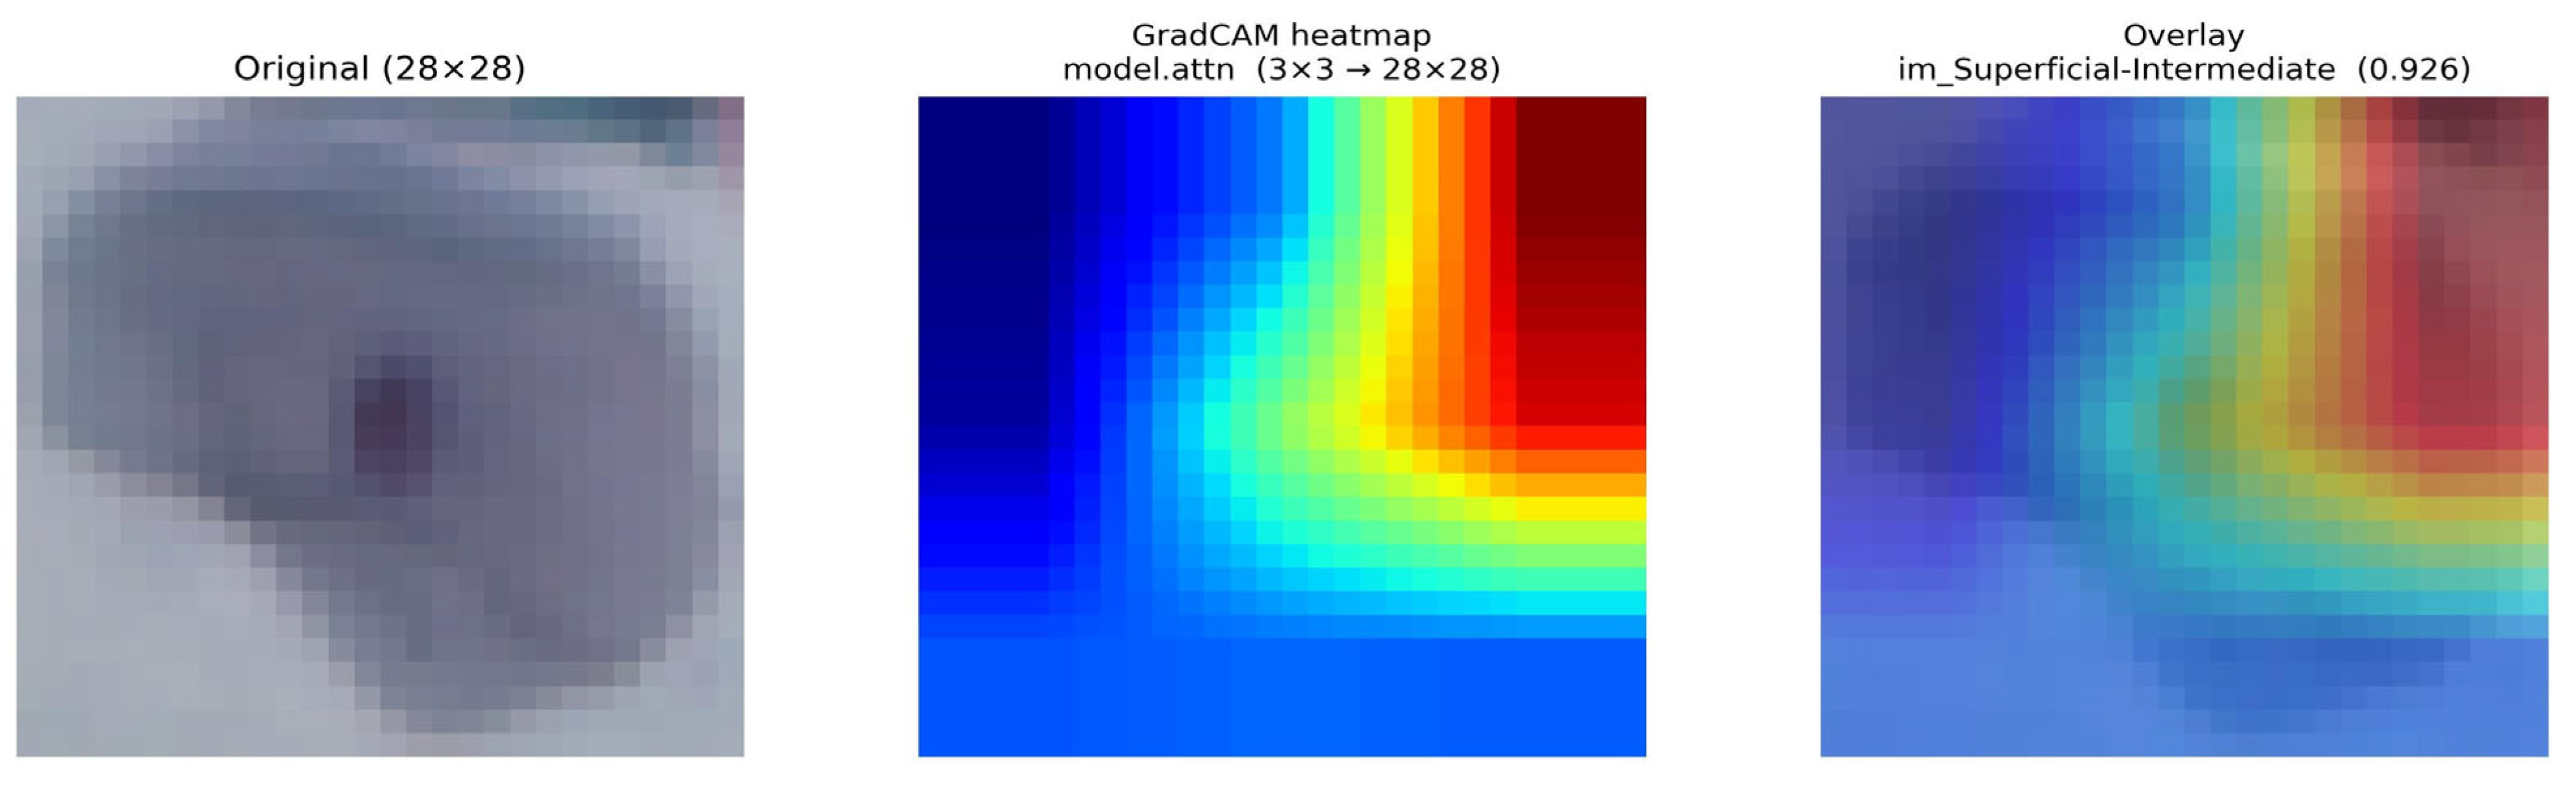
The spatial regions of the input image that most affected the predicted class are displayed using Gradient-Weighted Class Activation Mapping (Grad-CAM) [30]. Whereas a heatmap is a spatial visualization that gives each place in an image a color based on a scalar value, in this case, the significance of that area to the model’s choice. Figure 9 and Figure 10 show how the original input image compares with the Grad-CAM overlay of the dyskeratotic cell image and superficial–intermediate cell image, respectively. The prediction confidence values of 92.80% in Figure 9 and 92.60% in Figure 10 also back up the idea that the highlighted area has a big impact on the final choice. The heatmap’s seamless transition from low-importance to high-importance areas also shows that the model is not making a random guess; it is using spatially relevant characteristics from the image instead. This behavior shows that the model’s attention mechanism is learning diagnostically important areas, which makes the categorization process easier to understand and more reliable.
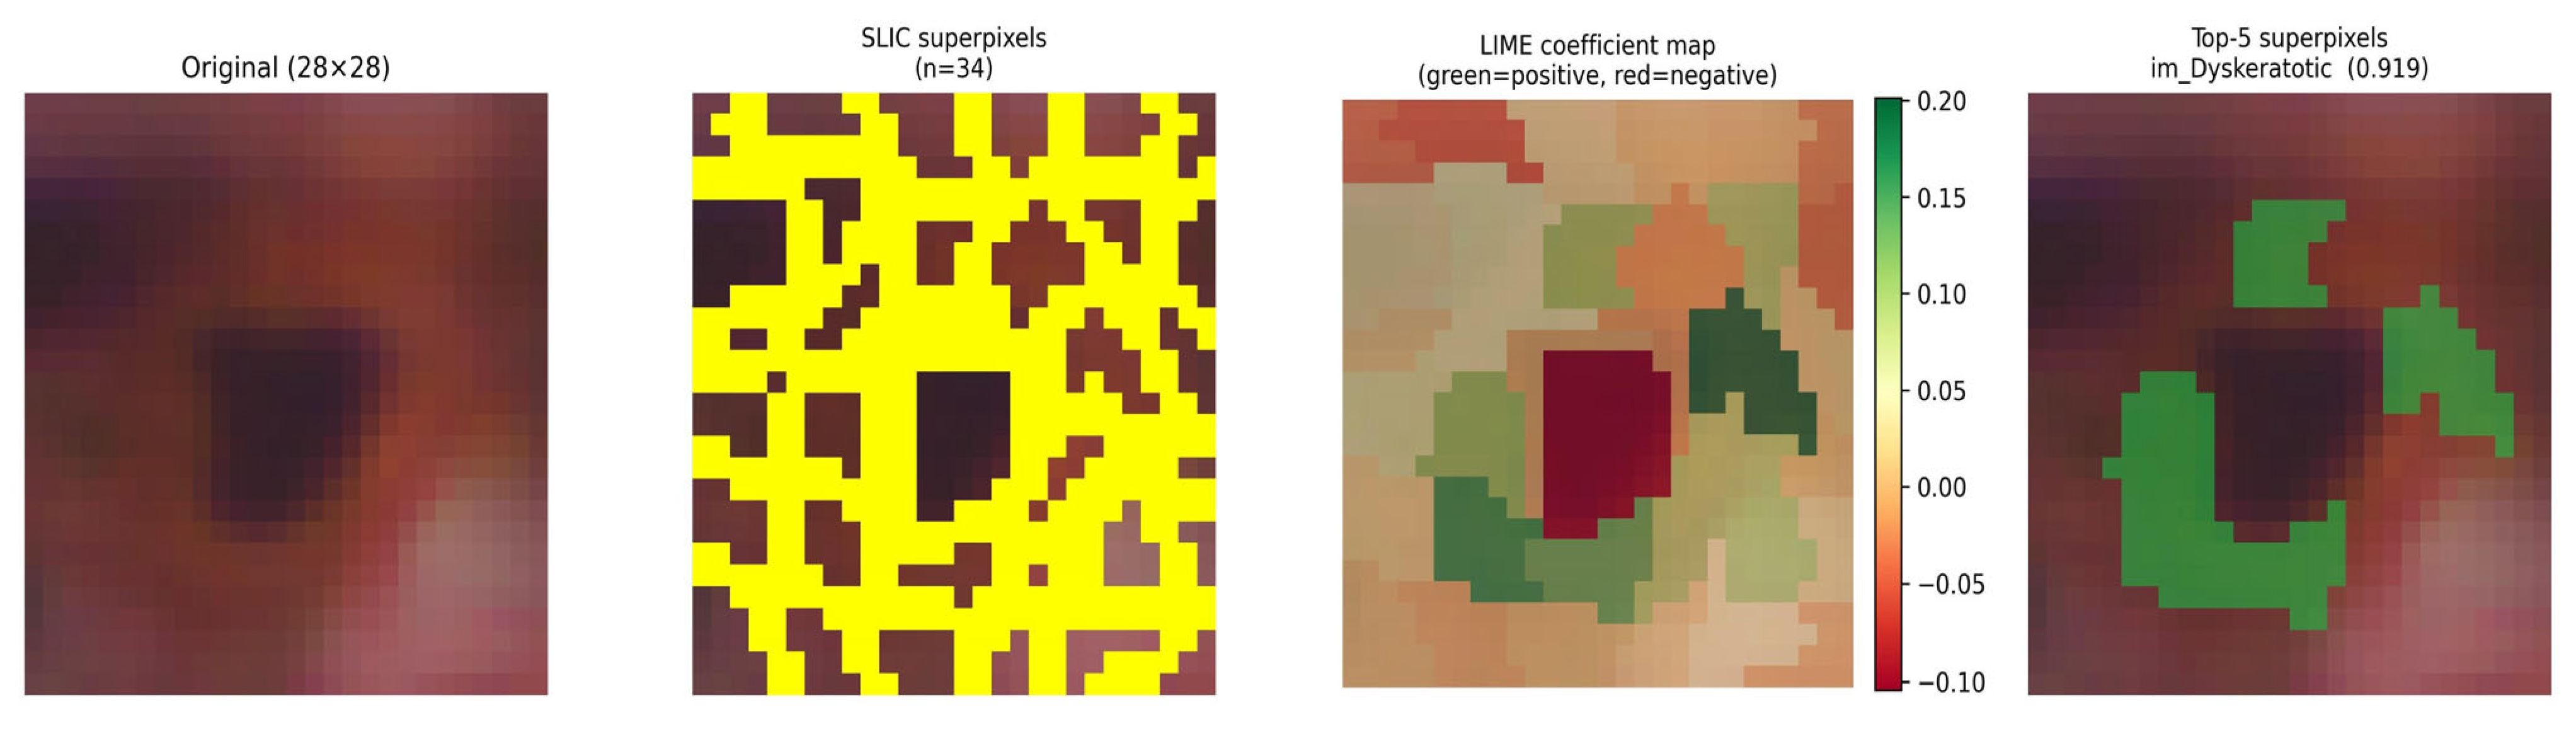
The Local Interpretable Model-Agnostic Explanations (LIME) explainability analysis indicates that the model correctly classifies the input image as a dyskeratotic cervical cell with a high prediction confidence of 91.9%. By breaking the 28 × 28 image into 34 superpixels, LIME shows which parts of the image have the biggest impact on the model’s choice. The green areas on the coefficient map show positive effects on the anticipated class, while the red areas show negative effects. The explanation shows that the model mostly uses the texture and boundary information around the dark center cellular structure instead of the background areas. The top five most important superpixels further show that the classifier is looking at small, biologically relevant areas that are related to the shape of cervical cells. This targeted attention shows that the prediction is based on useful distinguishing factors and not random artifacts.
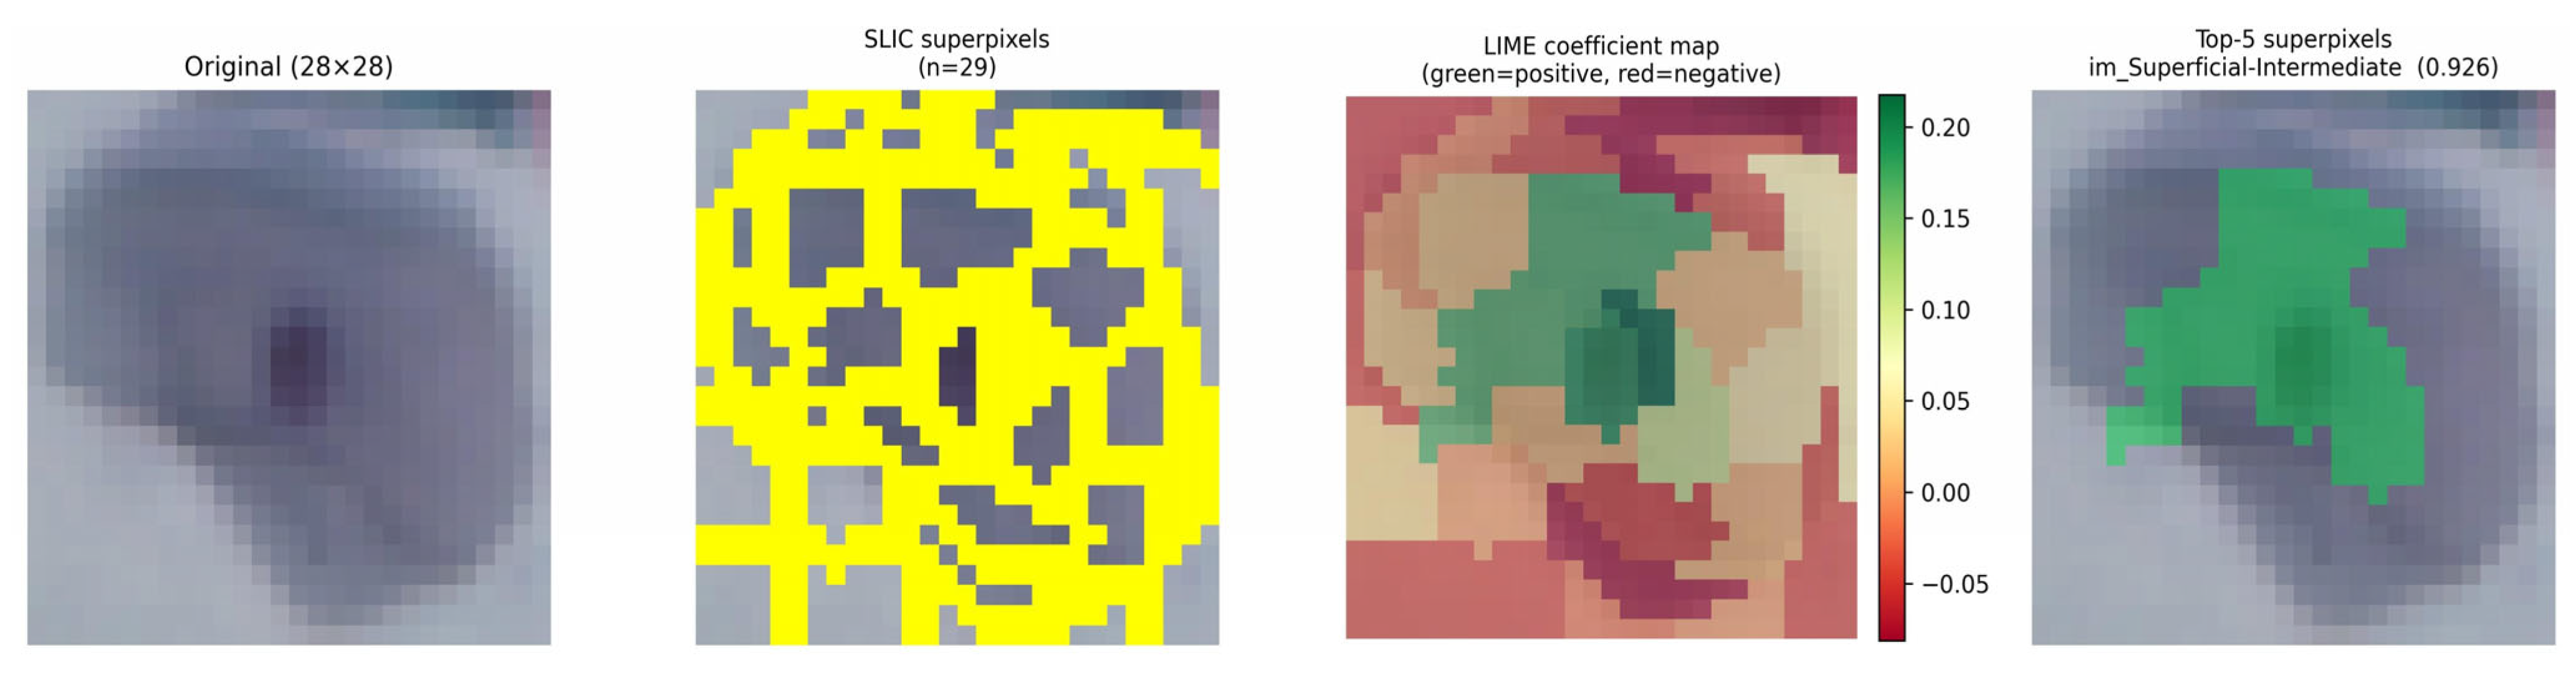
The visualization shows that the model is easy to understand and reliable since it shows that the categorization choice is based on significant cellular patterns with consistent and high-confidence reasoning. Figure 11 and Figure 12 display the LIME output for dyskeratotic cell and superficial intermediate cell input images.
We have observed the Grad-CAM visuals that the model consistently attended to regions of diagnostic significance, such as aberrant nuclei chromatin abnormalities and unusual cellular structures, suggesting that the learnt representations are medically meaningful and not driven by artifacts. Likewise, LIME explanations showed prominent superpixel regions associated with questionable cervical cell patterns, further supporting the trustworthiness of the model’s predictive behavior at a local interpretability level.

5. Discussion

5.1. Robustness and Uncertainty Study

The consistency and dependability of our findings were checked by carrying out more tests to assess how sensitive our suggested model is towards random initialization. In particular, we used five distinct random seeds (20, 30, 40, 42 and 50) to retain the suggested model while maintaining the same data splits, network architecture, hyperparameters and training schedule for each iteration. This separates the impact on the final performance of stochastic elements like dropout masking, weight initialization and data shuffling order. The multi-seed run results below show that the suggested model consistently achieves excellent accuracy and F1-score throughout all five separate runs, with a mean accuracy of 96.77 ± 0.46% and a mean F1-score of 96.79 ± 0.47%. For both metrics, the coefficient of variation is less than 0.5%, suggesting minimal sensitivity to random seed selection. Table 11 below shows the results across multiple seed values.
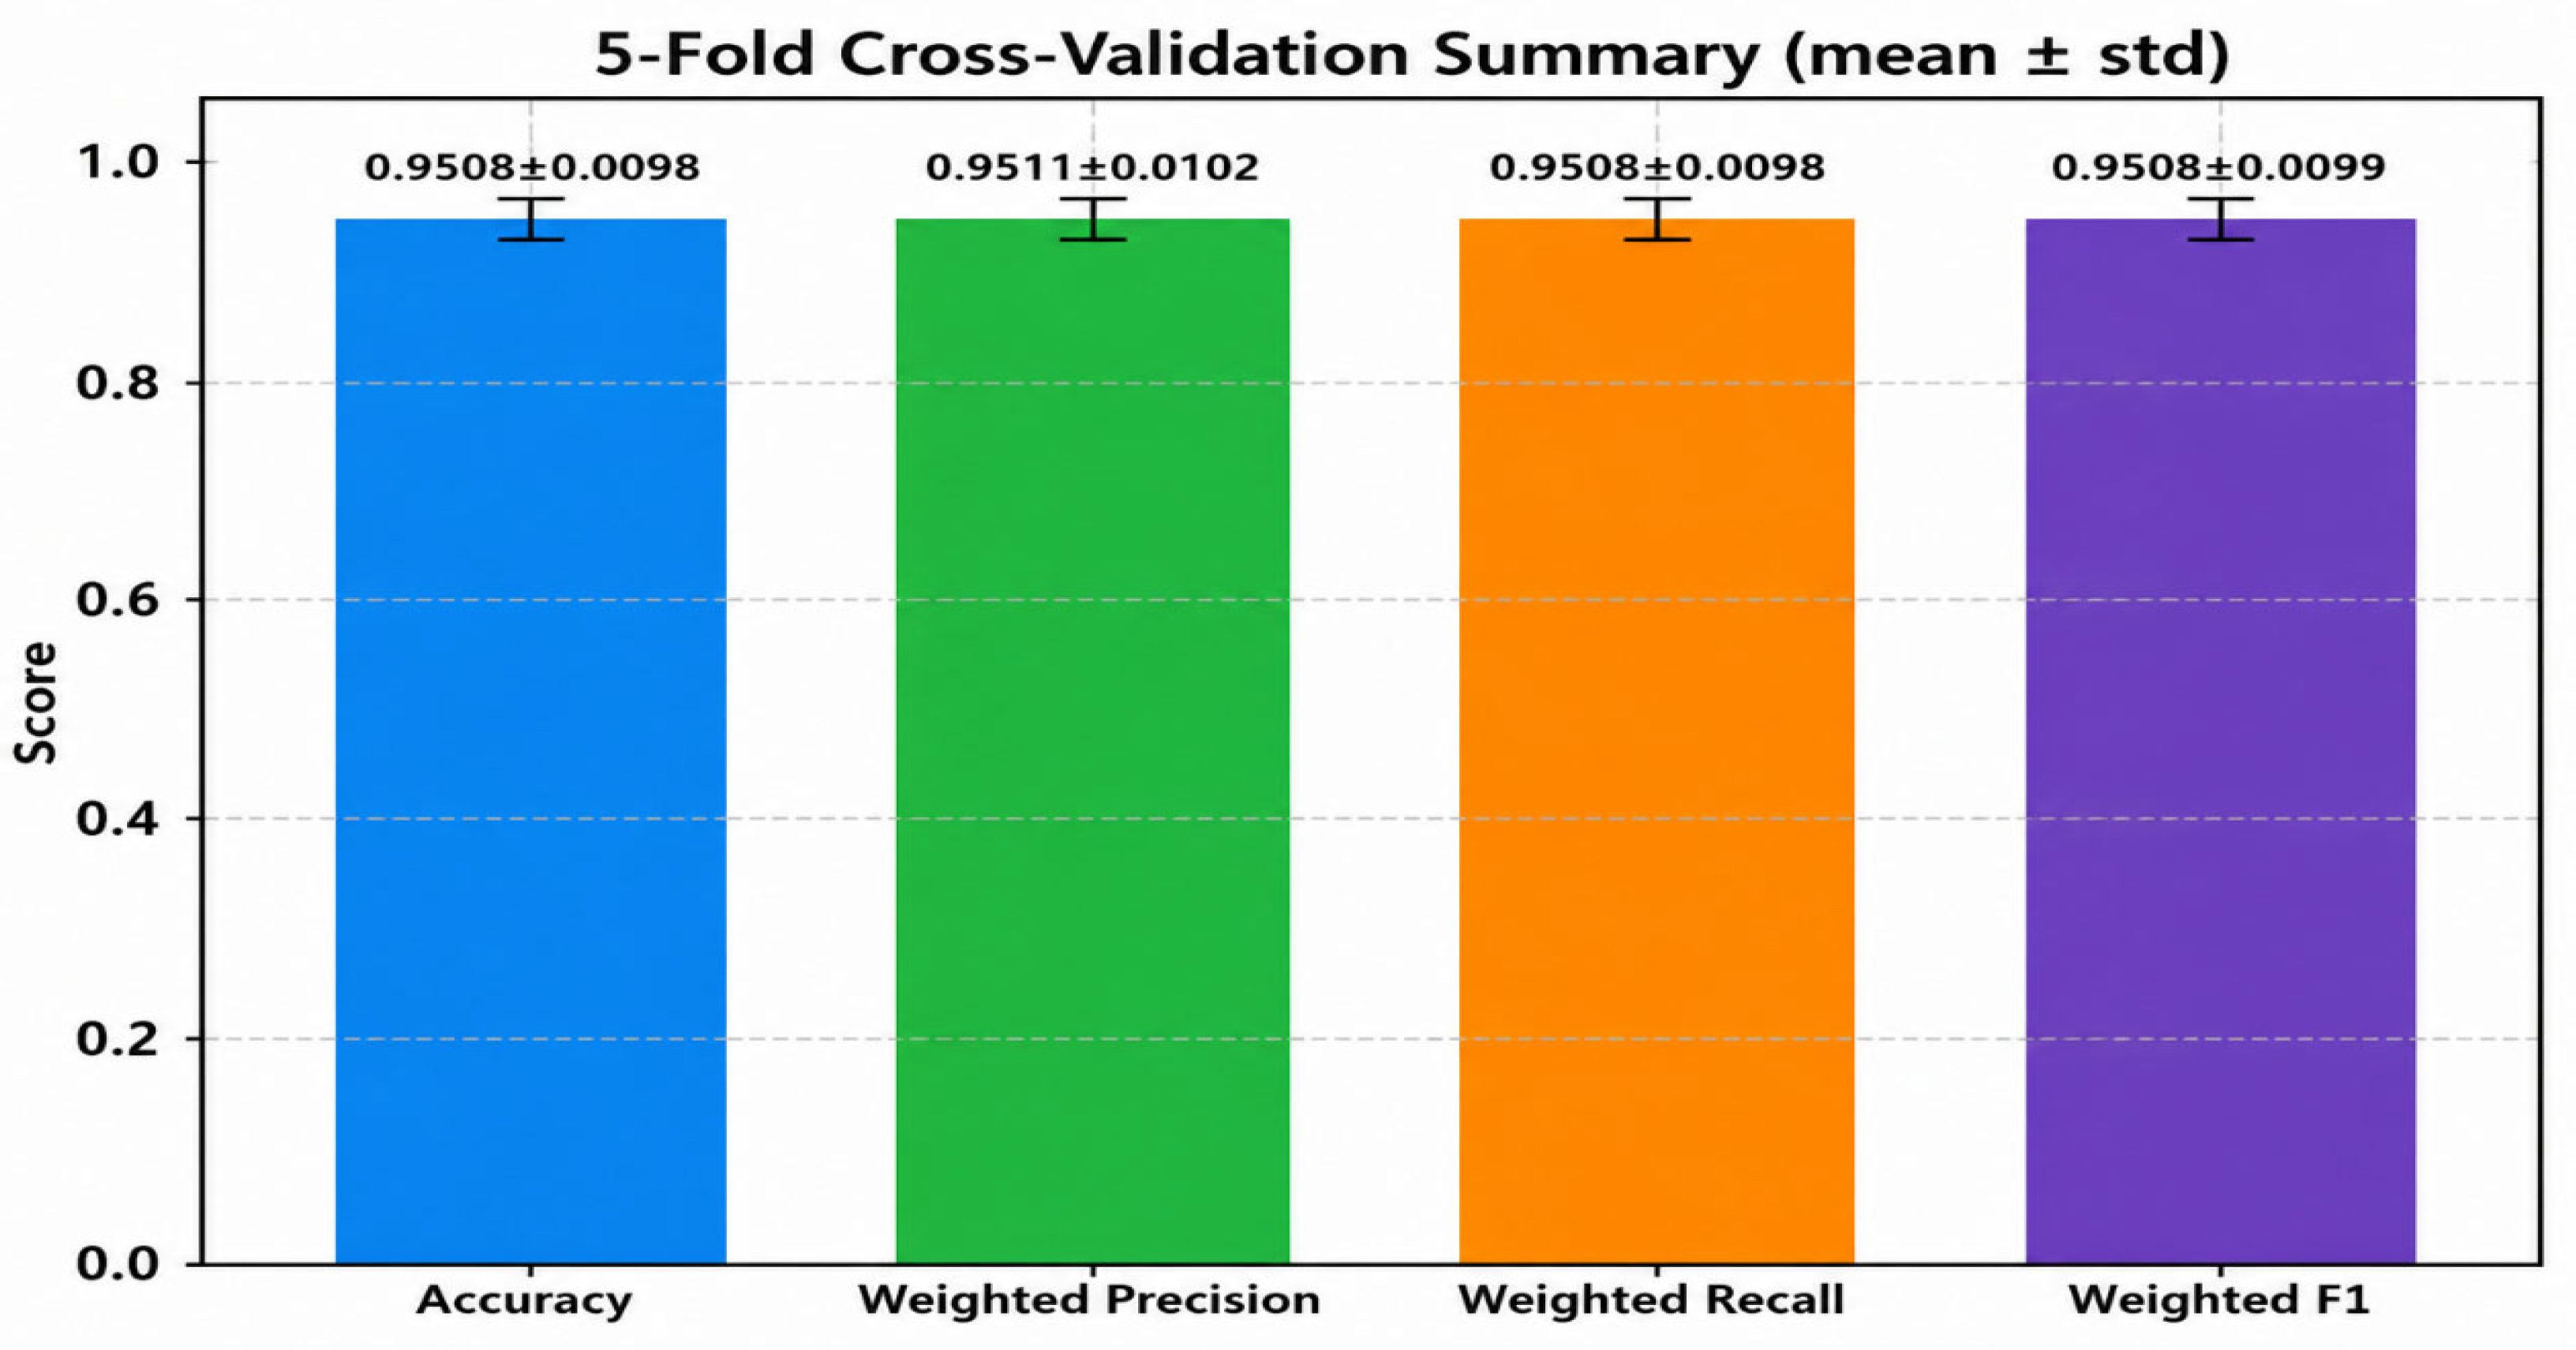
Again, to assess the statistical robustness of the claimed performance, we conducted five-fold cross-validation. Across folds, the model’s mean accuracy is 95.08% ± 0.98%, and its mean weighted F1 is 95.08% ± 0.99%. The low standard deviation (coefficient of variation approximately 1%) implies that the model’s performance is stable and not dependent on a specific train/test split, supporting the generalizability of the presented results. Figure 13 displays the five-fold cross validation summary diagram across metrics and Table 12 provides the findings of the K-fold cross-validation.
The strong generalization capability of the suggested technique is demonstrated by the low standard deviation (ranging from 0.98% to 1.02%) and narrow confidence intervals across all four metrics, which show that the model’s performance is consistent and independent of a specific train/validation split. Accuracy, precision, recall and F1 all have near-identical width of the confidence intervals. This showcases that the model is not biased towards any particular class or metric.

5.2. Comparison with State-of-the-Art Works

Table 13 below displays that the proposed YOLO* model exhibits enhanced performance on the SIPAKMED dataset, with 96.77% classification accuracy, while ensuring remarkable computational efficiency with merely 0.467 GFLOPs and 16.736 M trainable parameters. It is in the third position out of all the cutting-edge methodologies, significantly outperforming robust ensembles and transformer-based systems. Heavier ensemble and transformer-based methods include Rahaman et al. [15], which combines VGG16, VGG19, ResNet50 and Xception to reach 99.14% accuracy at the cost of 85.66 GFLOPs and 336.30 M parameters, or Basak et al. [16], which fuses ResNet50, VGG16, InceptionV3 and DenseNet121, containing 206.44 M parameters with 28.261 GFLOPs and achieving 97.82% accuracy. These factors render them unsuitable for clinical application. Notably, when benchmarked against other lightweight architectures, the proposed model remains highly efficient. Payne et al. [21] achieves a lower accuracy of 84.30% despite using a custom EfficientNet with only 4.84 M parameters, while Jadhav et al. [22] requires 66.70 M parameters and 10.2 GFLOPs to reach a comparable 91.34% accuracy. Similarly, more recent hybrid-attention-based frameworks such as CASPNet by Mondal et al. [24] and Cerviformer by Deo et al. [20] have attained 97.07% and 96.67% accuracy, respectively, but at 17.731 GFLOPs with 90.60 M parameters and 16.848 GFLOPs with 88.23 M parameters. These are roughly 38 times and 36 times more computationally expensive than the proposed approach, respectively, for essentially equivalent or slightly lower accuracy. Consequently, YOLO* effectively achieves the optimal balance between accuracy and efficiency, establishing it as the most practical solution for real-world, resource-limited medical imaging applications.
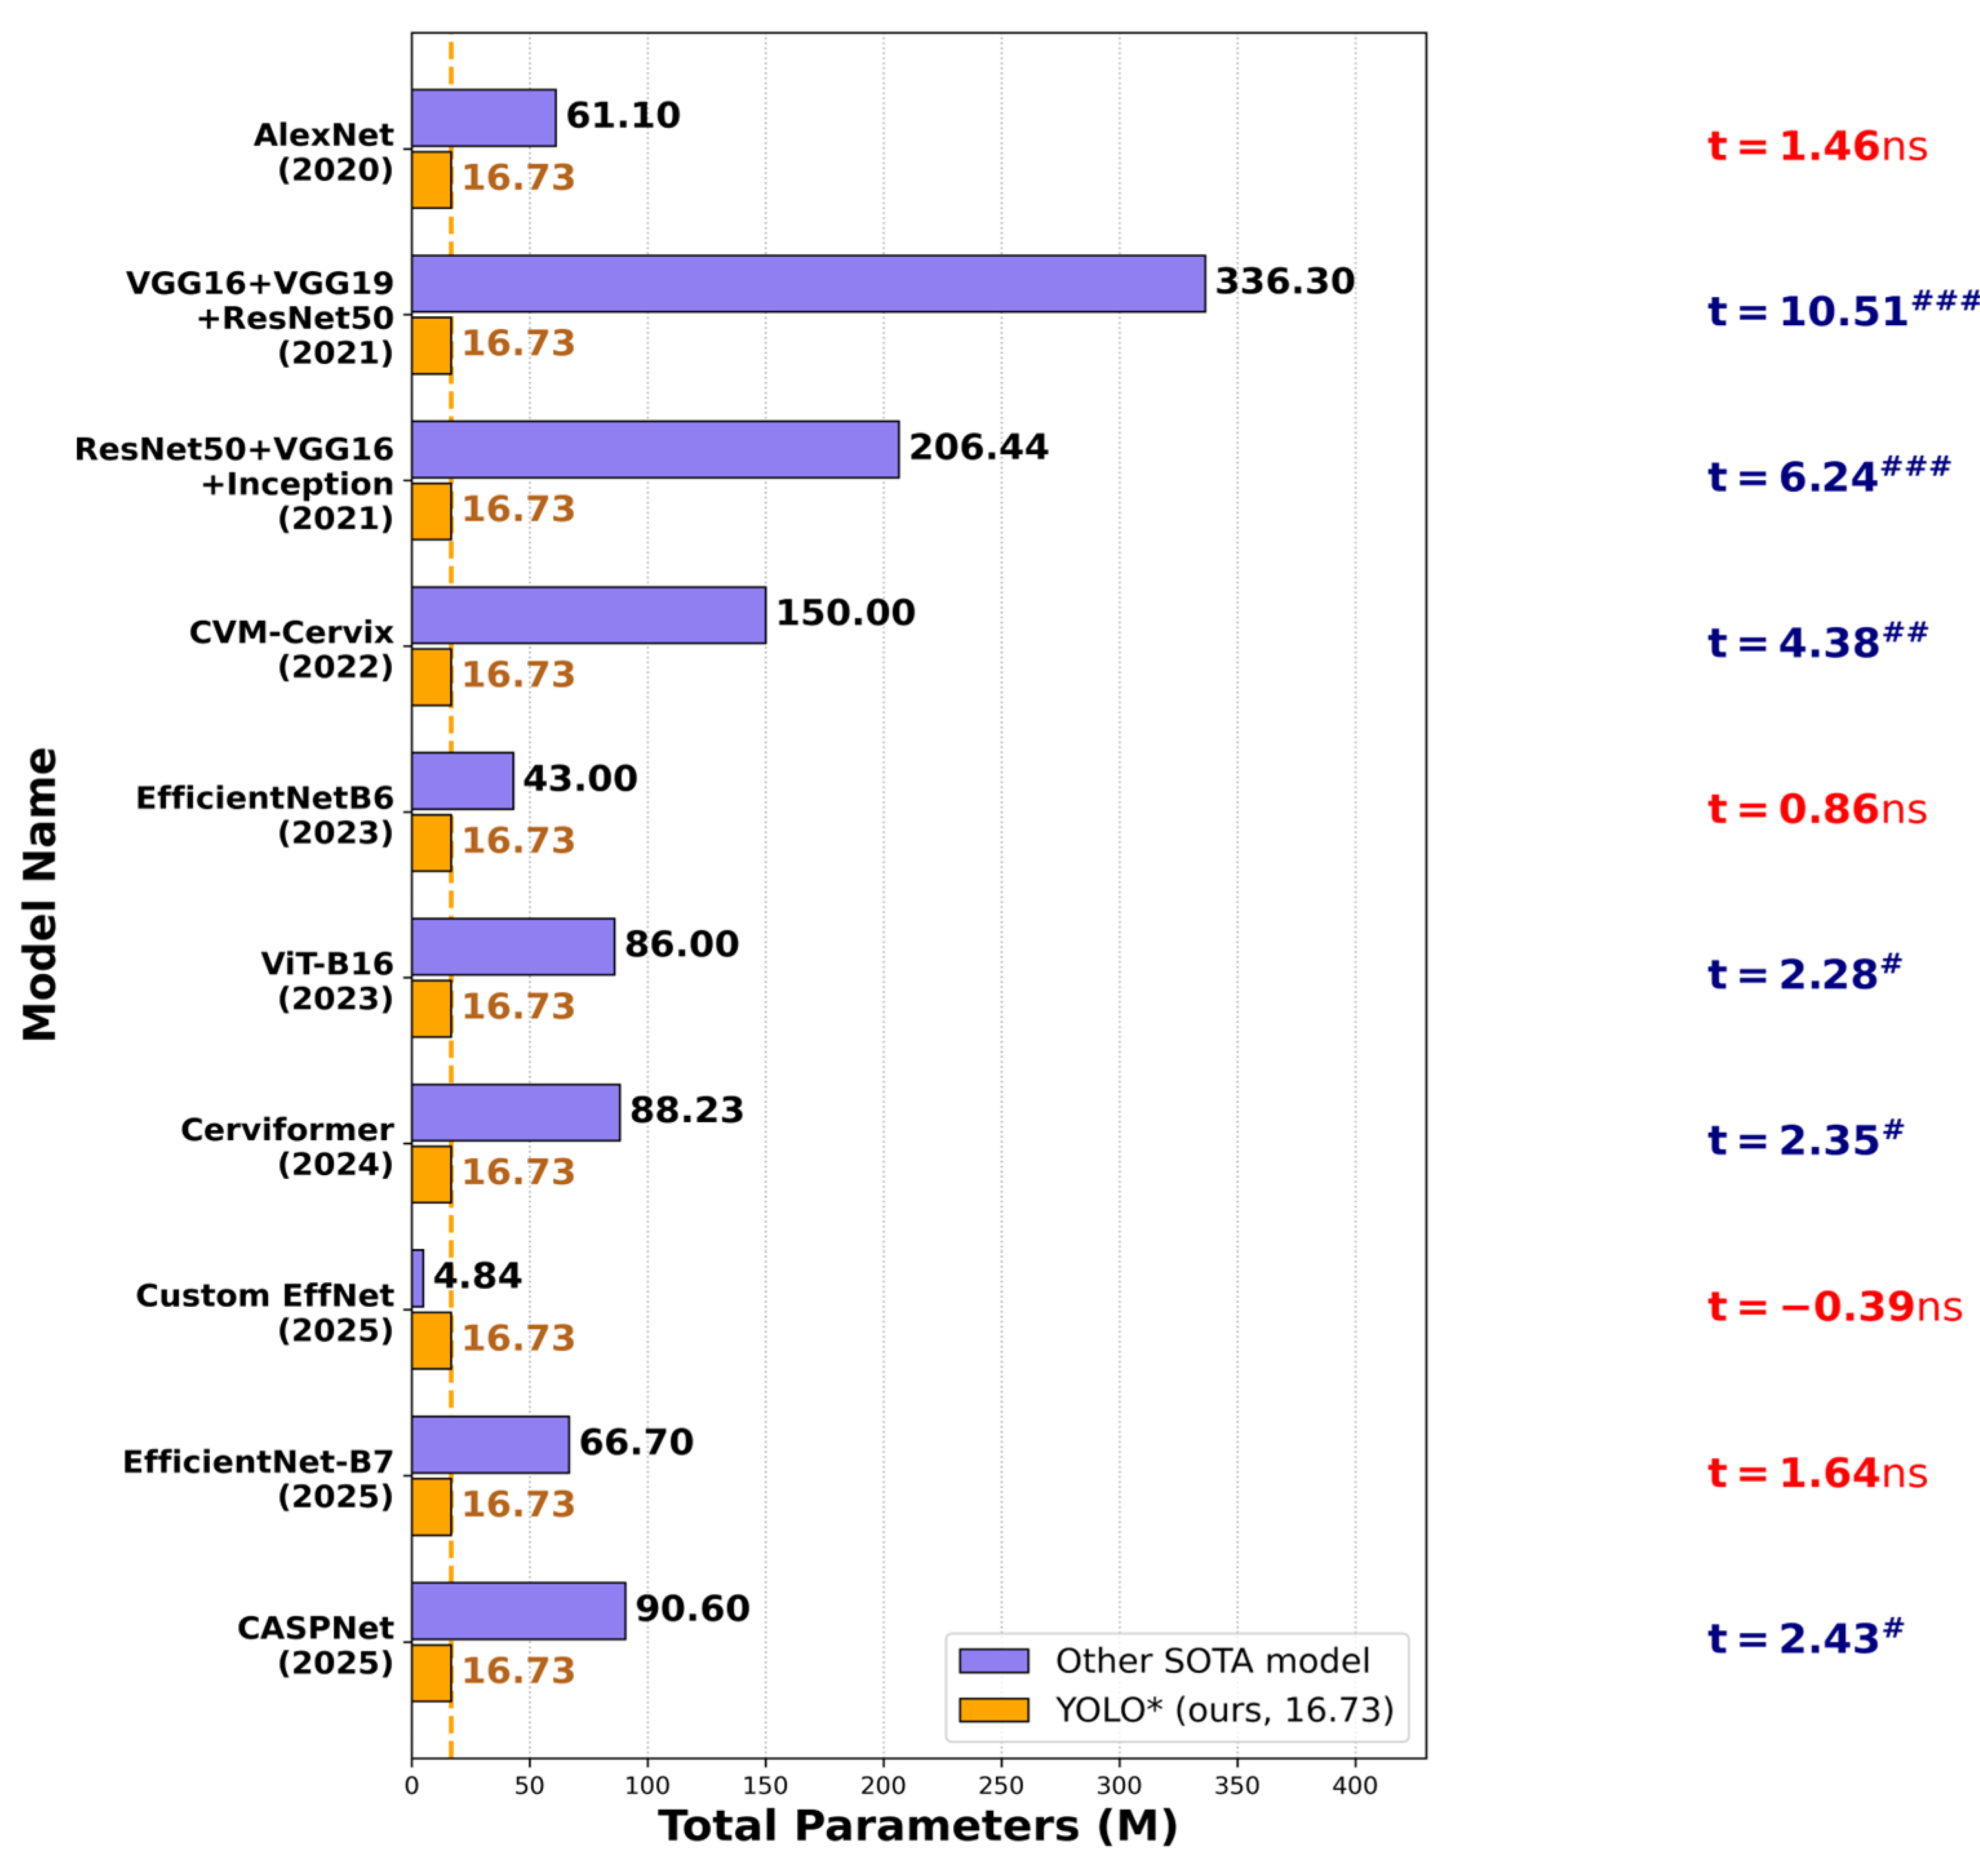
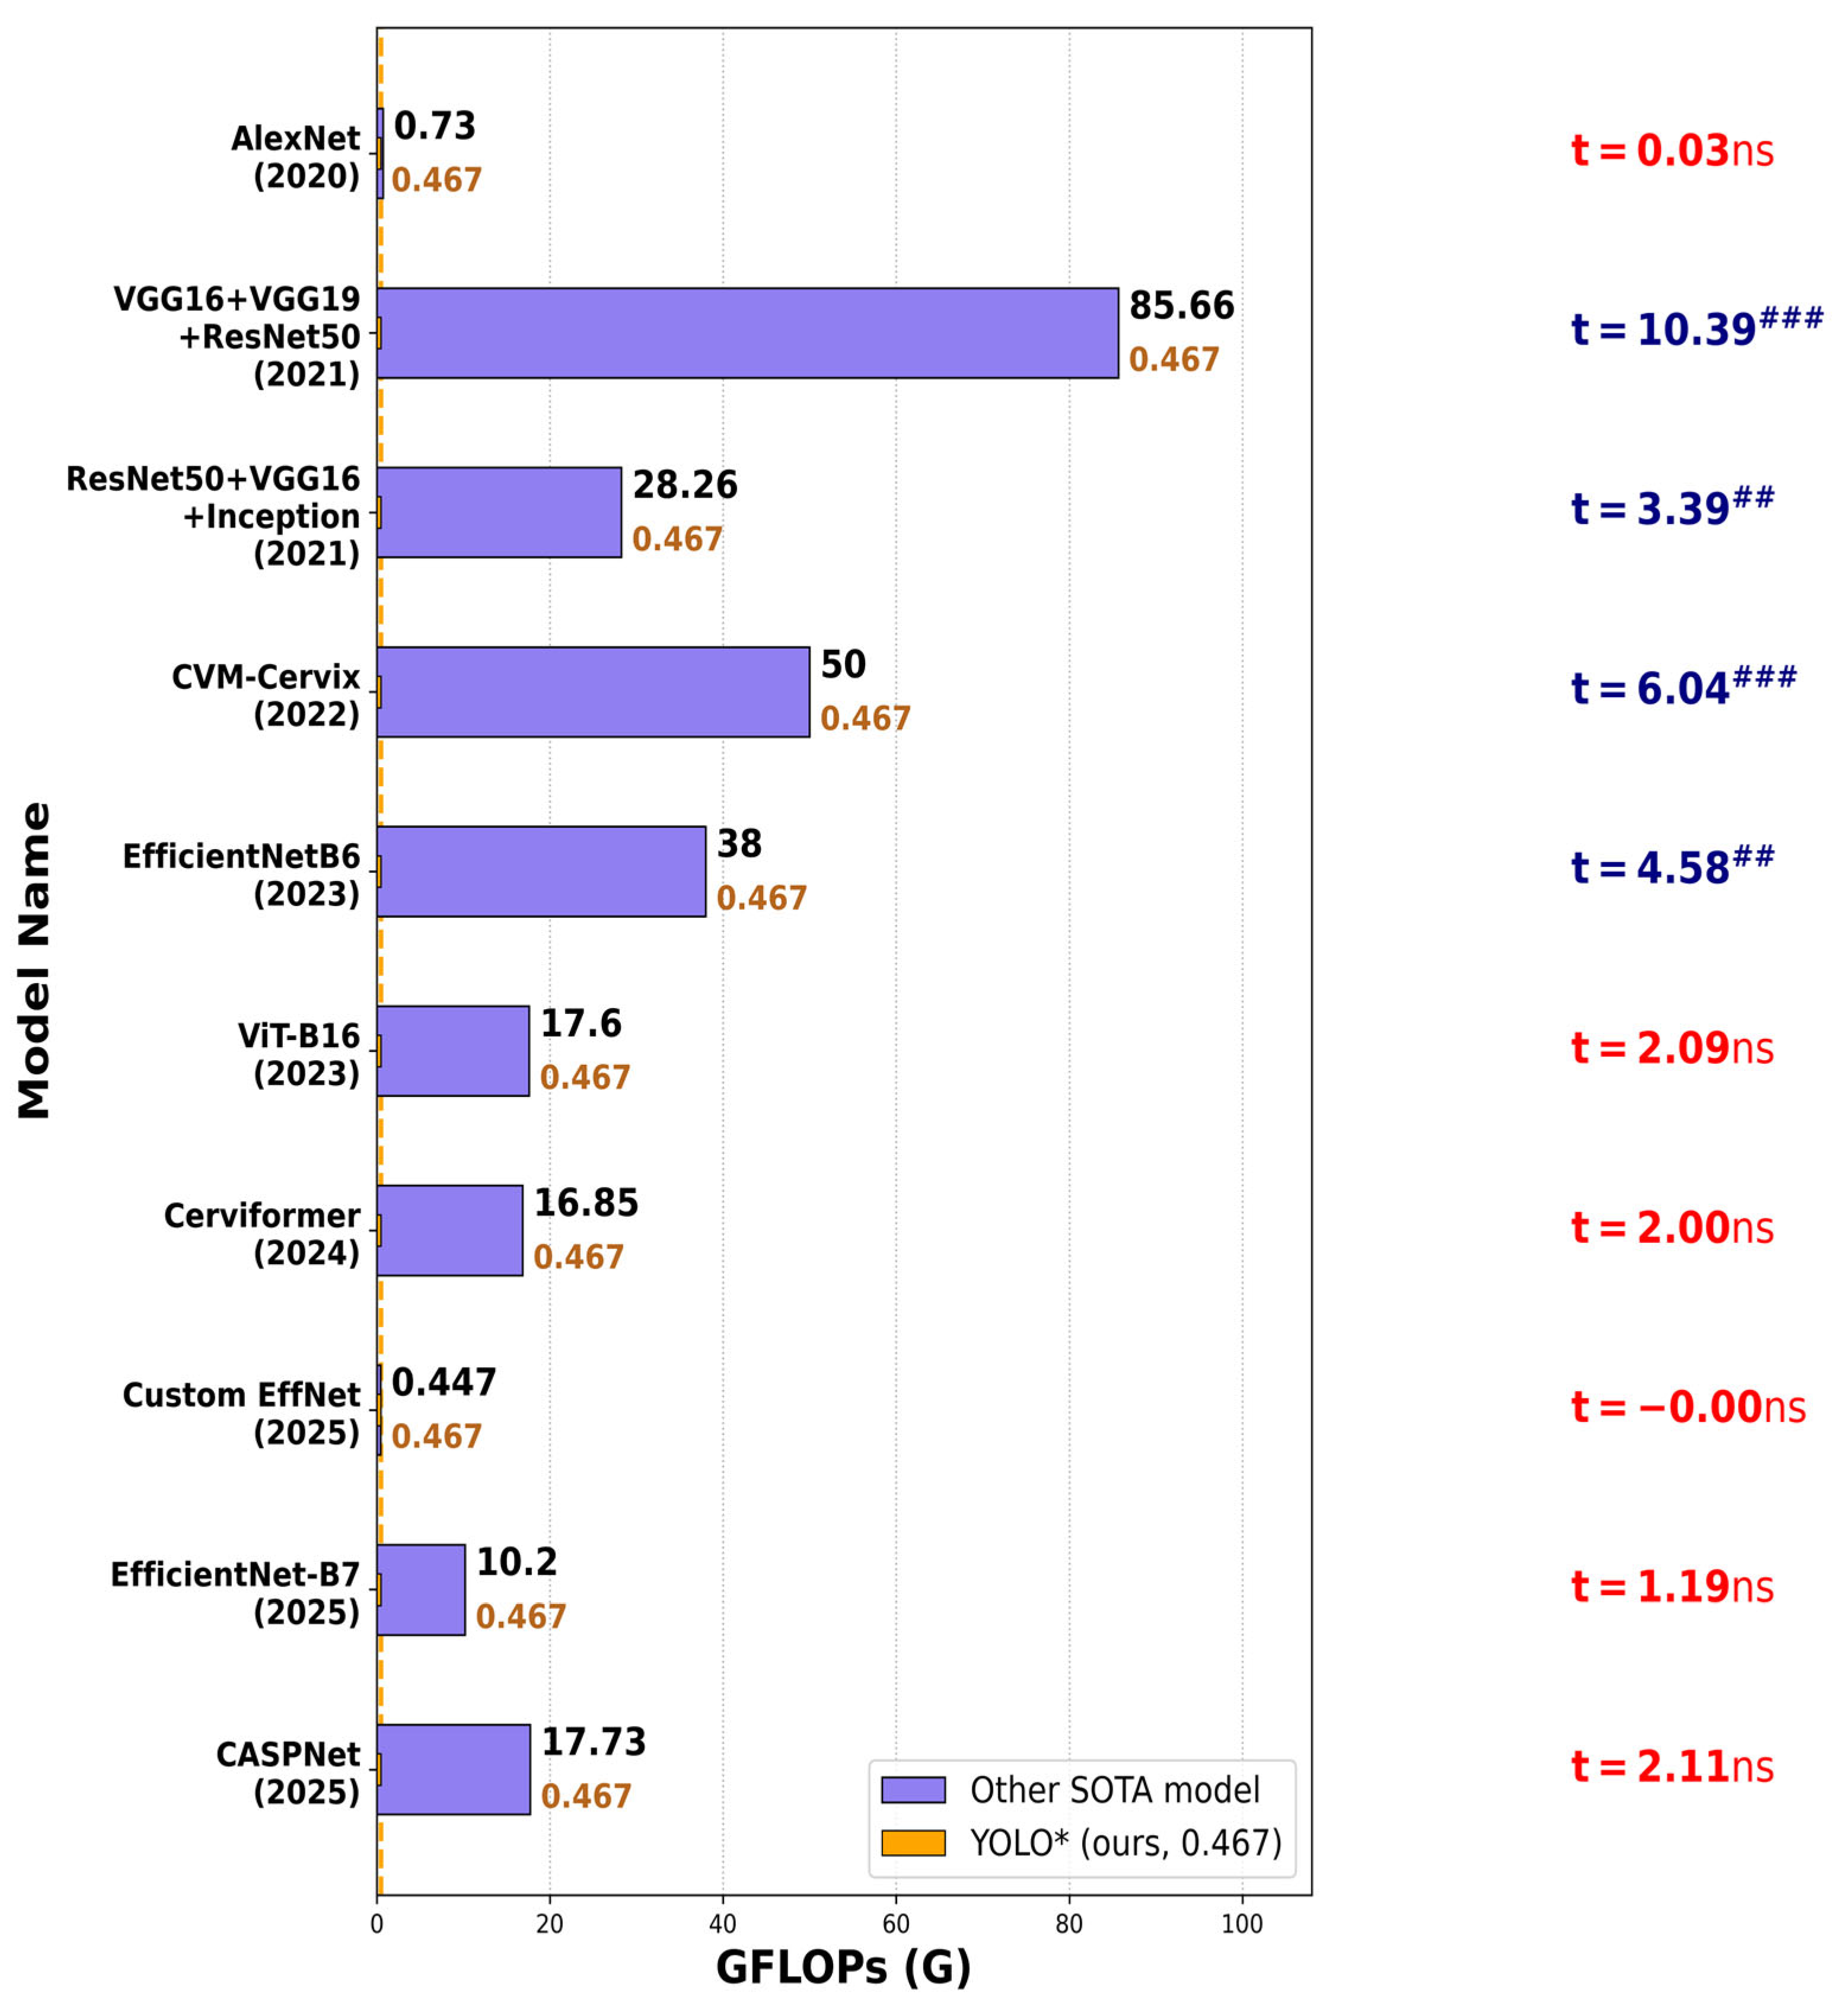
The paired t-test analysis indicates that the suggested YOLO* model attains an excellent equilibrium between classification performance and computational efficiency in comparison to current state-of-the-art methods. YOLO* demonstrates statistically substantial reductions (p < 0.05) in trainable parameters and GFLOPs compared to the majority of the SOTA models. These findings validate that the YOLO* model significantly reduces memory demands and computational intricacy, rendering it highly appropriate for use in resource-limited clinical settings.
Figure 14 below shows a comparison of total trainable parameters (in millions) between the proposed YOLO* model and nine SOTA methods using the SIPAKMED dataset and using a paired t-test. The suggested model has only 16.736 M parameters, making it much more lightweight than most of the competing models. The only model with slightly fewer parameters is Custom EfficientNet [21], although the difference is not statistically significant (t = −0.39 ns), implying equal scales of parameters, and it also suffers from a diagnostically disqualifying accuracy collapse of 12.47%. The YOLO* model thus provides the statistically confirmed best solution at the confluence of model compactness and diagnosis accuracy for automated cervical cancer screening on the SIPAKMED dataset.
Additionally, Figure 15 shows a paired t-test comparison of GFLOPs (Giga Floating Point Operations) between the proposed YOLO* model, with 0.467 G, and the other nine SOTA models that are evaluated on the SIPAKMED dataset. The computational complexity of YOLO* is significantly reduced (p < 0.01) when compared to computationally costly models like VGG16 + VGG19 + ResNet50, attaining 85.66 G, CVM-Cervix, attaining 50.00 G, and ResNet50 + VGG16 + Inception, attaining 28.26 G. EfficientNetB6, Cerviformer, EfficientNetB7, and CASPNet exhibit non-significant individual differences, but their GFLOP values range from 10.20 G to 17.731 G and are still 17× to 38× higher than YOLO*. The only other comparable model (t~0.00 ns) is Custom EfficientNet, with 0.447 G, which indicates nearly the same computational cost at that scale.
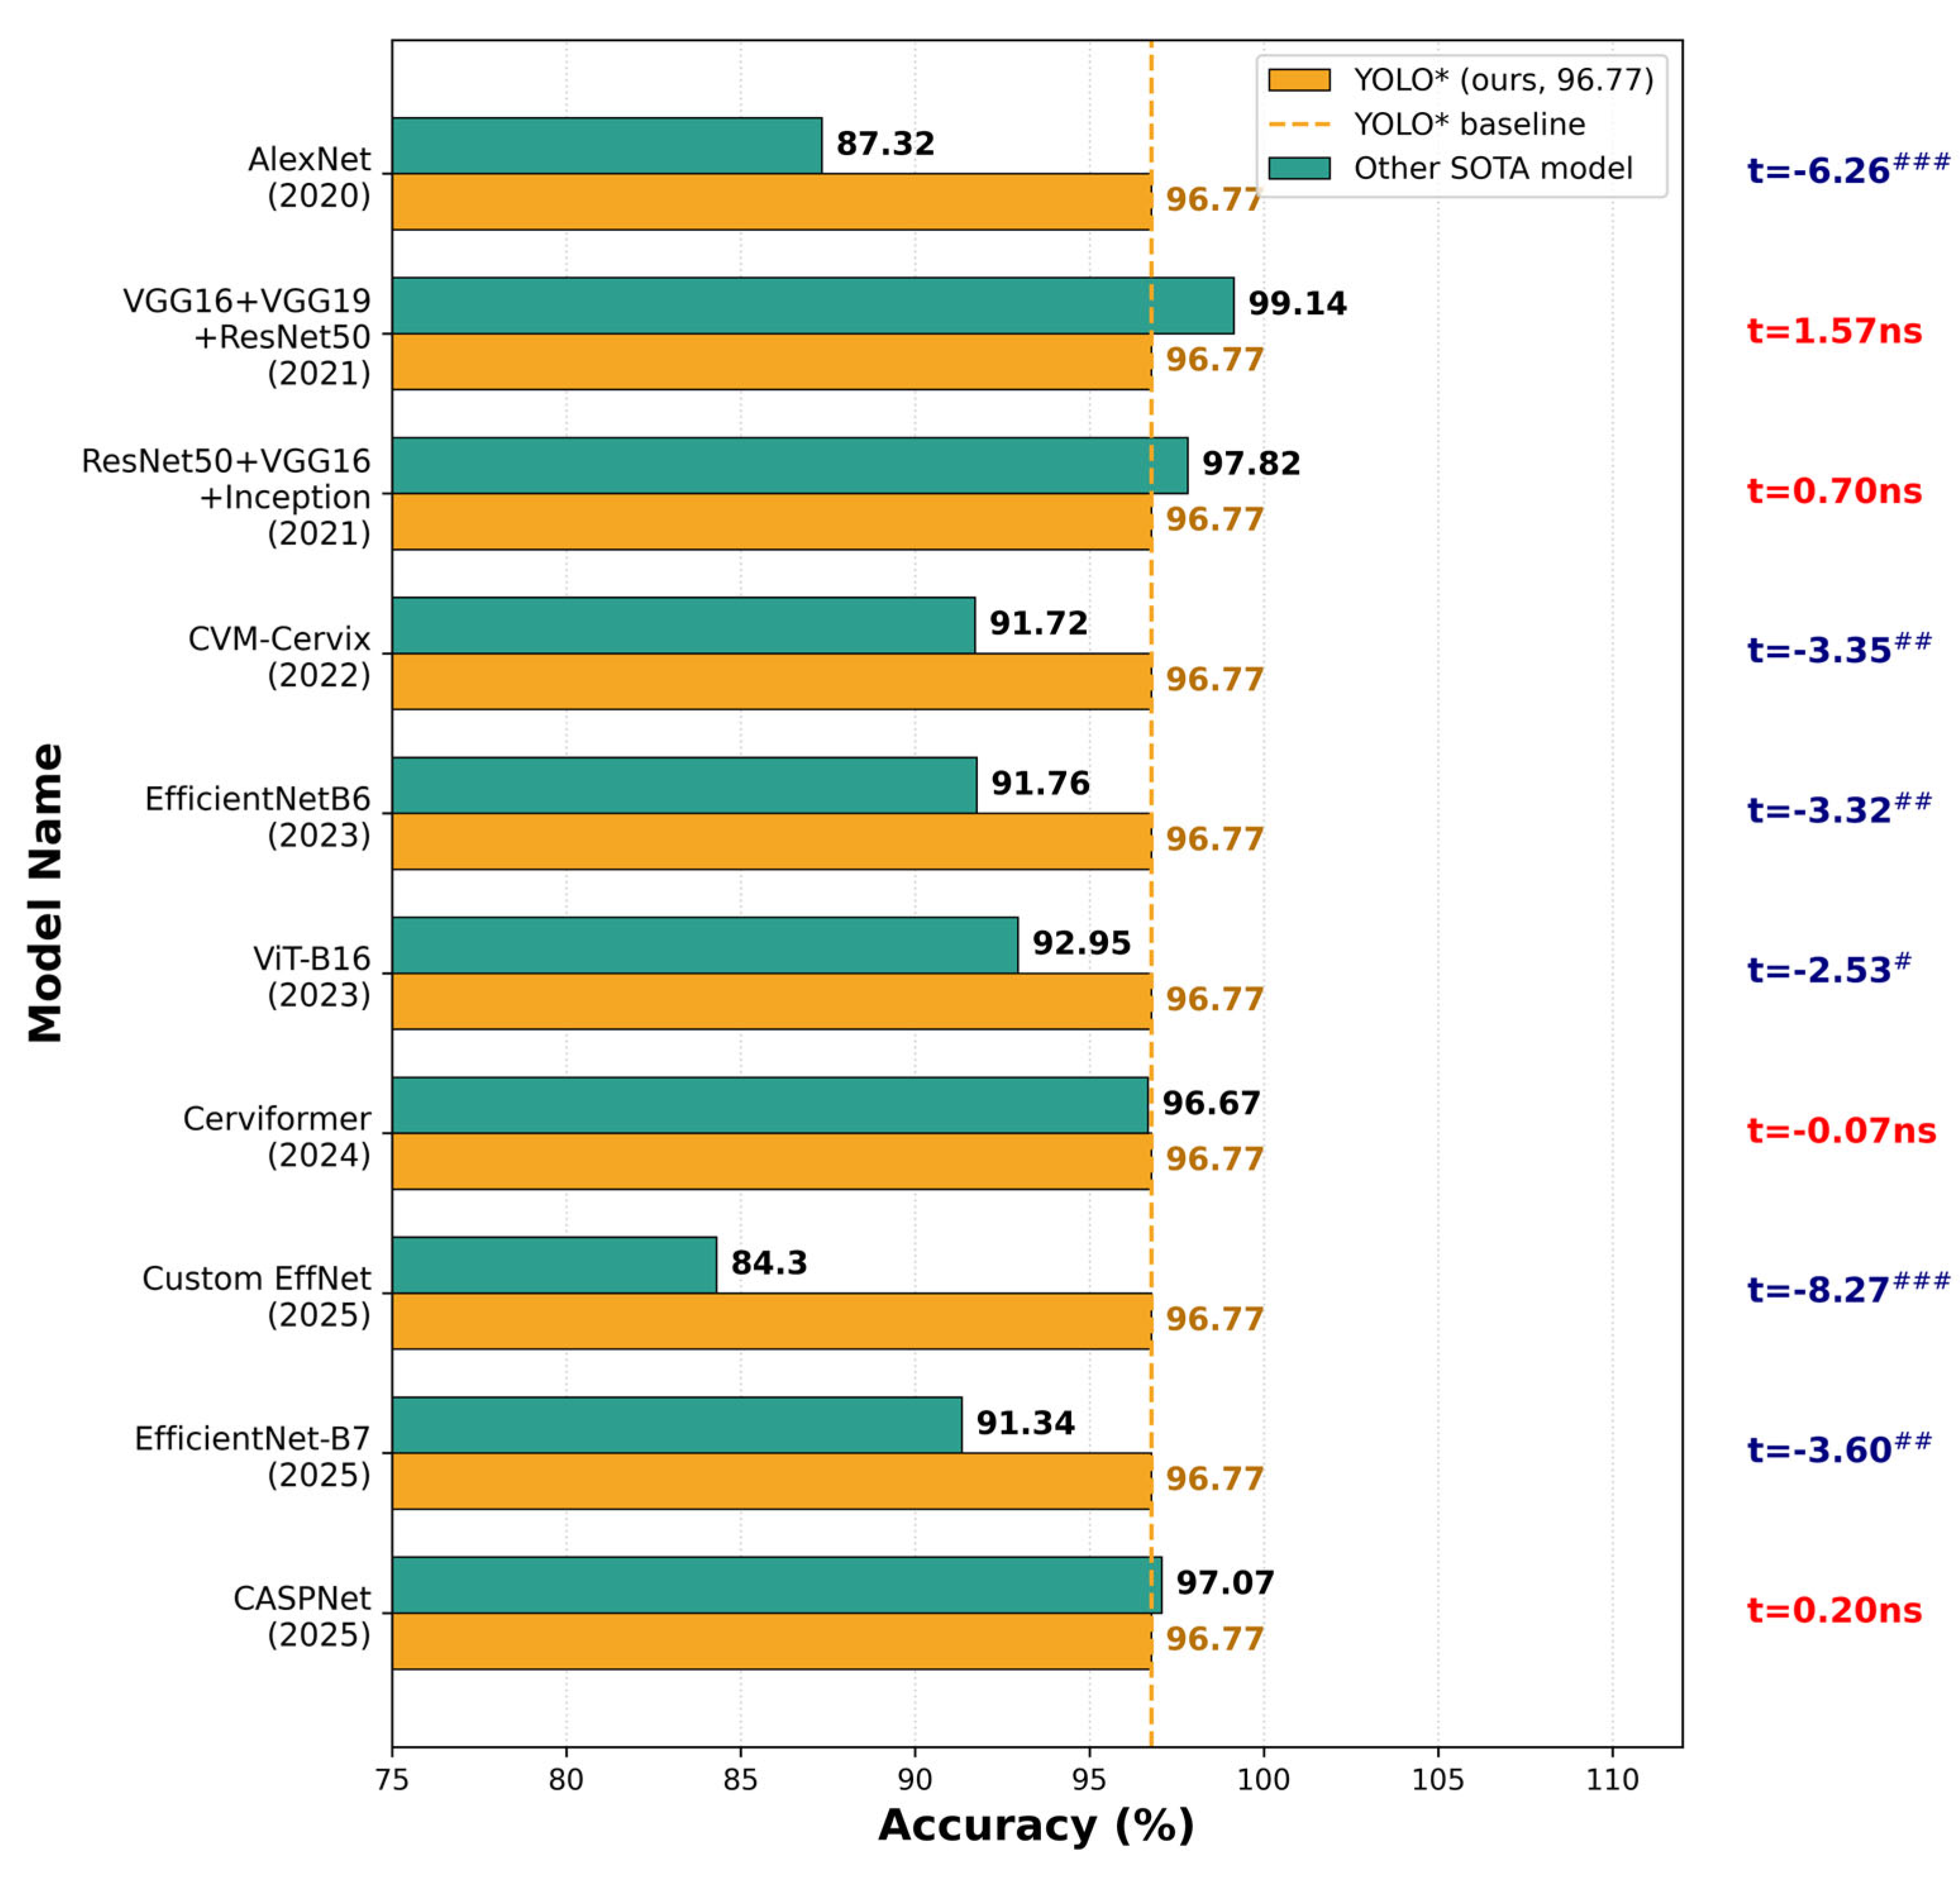
Again, in terms of classification accuracy, YOLO* attains 96.77%, which markedly surpasses the AlexNet model implementation by Haryanto et al. [13], the Custom EfficientNet model developed by Pyne et al. [21], the CVM-Cervix model built by Liu et al. [17], and various EfficientNet-derived models. Ensemble work by Rahaman et al. [15] attained 99.14%, and work by Basak et al. [16] attained 97.82%, which are somewhat superior accuracies, but they necessitate significantly greater parameter counts and computational expenses. Moreover, the disparities between the YOLO* model, which achieves 96.77%, Cerviformer by Deo et al. [20], which achieves 96.67%, and CASPNet by Mondal et al. [24], which achieves 97.07%, are statistically insignificant, suggesting analogous predictive efficacy. The statistical study indicates that our proposed YOLO* model achieves near state-of-the-art accuracy while significantly reducing model complexity and inference costs, hence offering an excellent accuracy–efficiency balance.
Figure 16 below shows the paired t-test comparison of the classification accuracy between the proposed YOLO* model and ten SOTA models on the SIPAKMED dataset. Our proposed YOLO* model achieved 96.77% and is compared with all other models. A negative ∆ means that YOLO* is better than the compared model. YOLO* performs much better than six of the nine SOTA models, all with highly significant t-statistic values. Against the highest-accuracy ensemble-based models, the difference is not statistically significant, indicating that YOLO* achieves statistically equivalent accuracy to such heavy models.
Table 14 displays the comparison between the best existing SOTA works along with our proposed model. The table evaluates four different methodologies, including the suggested approach, using the SIPAKMED dataset, contrasting them in terms of accuracy, computational cost (GFLOPs), and model size (trainable parameters).
The suggested YOLO* model necessitates merely 0.467 GFLOPs, which is approximately 38 times less than Mondal et al. [24], 60 times less than Basak et al. [16], and 183 times less than Rahaman et al. [15]. This renders it very appropriate for resource-limited and real-time clinical settings. The suggested model, with only 16.736 M trainable parameters, is the lightest among all compared methods, approximately 5 times smaller than CASPNet and 20 times smaller than the Rahaman et al. ensemble. This facilitates simpler deployment on edge devices, mobile platforms, and low-memory systems. The proposed work attains optimal equilibrium between precision and efficiency. No alternative method approaches the performance-to-computational cost ratio of the YOLO* model, rendering it the most feasible strategy for deployment.
Although the suggested framework achieves a little lower classification accuracy than the highest-performing computationally costly models, the reduction in complexity and model size is substantial. From a practical engineering standpoint, this is a positive trade-off, particularly for resource-constrained clinical situations where CPU resources, memory capacity, and power consumption are significant factors. Consequently, a slight drop in classification accuracy in exchange for more than an order-of-magnitude improvement in processing efficiency is often acceptable for real-time clinical screening and deployment on edge devices or portable diagnostic platforms. Therefore, the suggested YOLO* model achieves an effective balance between diagnostic effectiveness and computing efficiency, making it a realistic solution for real-world clinical applications.

6. Conclusions and Future Work

In this work, we present a unique architecture that improves cervical cytology image classification task on the popular benchmark dataset, SIPAKMED, by utilizing domain-specific pretraining with PathMNIST. Our technique takes advantage of histopathology-oriented representations to better match the target medical domain, in contrast to traditional methods that rely on generic pretraining on ImageNet. Overall, this work shows how domain-specific pretraining can improve automated cervical cancer screening systems and adds to the research community supporting this approach for medical image analysis. The study also showed the importance of model transparency, in addition to achieving enhanced classification performance, by incorporating explainable AI techniques such as Grad-CAM and LIME. The high concordance between Grad-CAM activation regions and LIME superpixel explanations provided cross-method validation of the model’s decision-making process, hence enhancing confidence in the robustness and trustworthiness of the proposed framework.
One of the limitations of our approach is its reliance on a domain-specific pretraining dataset, PathMNINST. Furthermore, there is a necessity for further validation on larger multi-center datasets gathered under varied clinical situations. Scaling this method to bigger datasets, incorporating multi-modal data and implementing lightweight models for practical clinical applications, especially in environments with limited resources, can be considered subjects for future research work. Another aspect can be investigating contrastive or self-supervised learning methods that can improve representation learning without requiring a lot of annotations. Despite these drawbacks, the suggested domain-specific transfer learning framework shows that histopathology-oriented pretraining in conjunction with the suggested attention-enhanced YOLO* architecture offers a reliable and efficient method for classifying cervical cells.

Author Contributions

Conceptualization: M.K.G. and J.M.; Methodology: M.K.G. and J.M.; Software: J.M.; Validation: R.C.; Formal Analysis: B.A.; Investigation: M.K.G. and J.M.; Resources: A.V.J.; Data curation: R.C.; Writing—original draft: M.K.G. and J.M.; Writing—review and editing: C.T., N.B. and A.V.J.; Visualization: B.A.; Supervision: N.B. and C.T.; Project administration: M.K.G. and A.V.J.; Funding acquisition: N.B. and C.T. All authors have read and agreed to the published version of the manuscript.

Funding

The research was fully supported by the PubArt program of the National University of Science and Technology POLITEHNICA Bucharest.

Data Availability Statement

PathMNIST Dataset Link: https://medmnist.com/ accessed on 20 March 2026. SIPAKMED Dataset Link: https://www.kaggle.com/datasets/prahladmehandiratta/cervical-cancer-largest-dataset-sipakmed?resource=download accessed on 20 March 2026.

Acknowledgments

The first author is thankful to all other authors for their guidance and support.

Conflicts of Interest

The authors declare no conflicts of interest.

References

  1. Who Facts. Available online: https://www.who.int/news-room/fact-sheets/detail/cervical-cancer (accessed on 15 February 2026).
  2. Dominck Cunningham Yaffa. Available online: https://www.pbglaw.com/blog/how-accurate-is-the-pap-test (accessed on 15 February 2026).
  3. Salehi, A.W.; Khan, S.; Gupta, G.; Alabduallah, B.I.; Almjally, A.; Alsolai, H.; Siddiqui, T.; Mellit, A. A study of CNN and transfer learning in medical imaging: Advantages, challenges, future scope. Sustainability 2023, 15, 5930. [Google Scholar] [CrossRef]
  4. Mondal, J.; Chatterjee, R.; Gourisaria, M.K. Multiscale Deformable Attention Enhanced YOLO Framework for Cervical Cancer Cell Classification. In Proceedings of the 2026 7th International Conference on Computational Intelligence and Networks (CINE); IEEE: New York, NY, USA, 2026; pp. 1–7. [Google Scholar] [CrossRef]
  5. Wen, Y.; Chen, L.; Deng, Y.; Zhou, C. Rethinking pre-training on medical imaging. J. Vis. Commun. Image Represent. 2021, 78, 103145. [Google Scholar] [CrossRef]
  6. Zhuang, F.; Qi, Z.; Duan, K.; Xi, D.; Zhu, Y.; Zhu, H.; Xiong, H.; He, Q. A comprehensive survey on transfer learning. Proc. IEEE 2021, 109, 43–76. [Google Scholar] [CrossRef]
  7. Wang, Z.; Du, B.; Guo, Y. Domain adaptation with neural embedding matching. IEEE Trans. Neural Netw. Learn. Syst. 2019, 31, 2387–2397. [Google Scholar] [CrossRef] [PubMed]
  8. Duary, K.; Rajgarhia, J. Advanced Methodologies in Cervical Cancer Classification using Deep Learning and Ensemble Techniques. In Proceedings of the 2025 3rd International Conference on Self Sustainable Artificial Intelligence Systems (ICSSAS); IEEE: New York, NY, USA, 2019; pp. 1225–1231. [Google Scholar] [CrossRef]
  9. Zhou, Y. A Novel Deep Learning Method for Pneumonia Recognition based on X-ray Images. UPB Sci. Bull. Ser. C 2025, 87. Available online: https://www.scientificbulletin.pub.ro/static/pdfs/rez5a9_805291.pdf (accessed on 9 July 2026).
  10. Bădoi, C.I. Integrated Deep Learning Framework for Breast Cancer Detection. UPB Sci. Bull. Ser. C 2025, 87. Available online: https://www.scientificbulletin.pub.ro/static/pdfs/rez67e_253467.pdf (accessed on 9 July 2026).
  11. Maurício, J.; Domingues, I.; Bernardino, J. Comparing vision transformers and convolutional neural networks for image classification: A literature review. Appl. Sci. 2023, 13, 5521. [Google Scholar] [CrossRef]
  12. Jamil, S.; Jalil Piran, M.; Kwon, O.J. A comprehensive survey of transformers for computer vision. Drones 2023, 7, 287. [Google Scholar] [CrossRef]
  13. Haryanto, T.; Sitanggang, I.S.; Agmalaro, M.A.; Rulaningtyas, R. The utilization of padding scheme on convolutional neural network for cervical cell images classification. In Proceedings of the 2020 International Conference on Computer Engineering, Network, and Intelligent Multimedia (CENIM); IEEE: New York, NY, USA, 2020; pp. 34–38. [Google Scholar] [CrossRef]
  14. Arifianto, D.; Agoes, A.S. Cervical cancer image classification using cnn transfer learning. In Proceedings of the 2nd International Seminar of Science and Applied Technology (ISSAT 2021); IEEE: New York, NY, USA, 2021; pp. 145–149. [Google Scholar] [CrossRef]
  15. Rahaman, M.M.; Li, C.; Yao, Y.; Kulwa, F.; Wu, X.; Li, X.; Wang, Q. DeepCervix: A deep learning-based framework for the classification of cervical cells using hybrid deep feature fusion techniques. Comput. Biol. Med. 2021, 136, 104649. [Google Scholar] [CrossRef] [PubMed]
  16. Basak, H.; Kundu, R.; Chakraborty, S.; Das, N. Cervical cytology classification using PCA and GWO enhanced deep features selection. SN Comput. Sci. 2021, 2, 369. [Google Scholar] [CrossRef]
  17. Liu, W.; Li, C.; Xu, N.; Jiang, T.; Rahaman, M.; Sun, H.; Wu, X.; Hu, W.; Chen, H.; Sun, C.; et al. CVM-Cervix: A hybrid cervical Pap-smear image classification framework using CNN, visual transformer and multilayer perceptron. Pattern Recognit. 2022, 130, 108829. [Google Scholar] [CrossRef]
  18. Pacal, I.; Kılıcarslan, S. Deep learning-based approaches for robust classification of cervical cancer. Neural Comput. Appl. 2023, 35, 18813–18828. [Google Scholar] [CrossRef]
  19. Wong, L.; Ccopa, A.; Diaz, E.; Valcarcel, S.; Mauricio, D.; Villoslada, V. Deep Learning and Transfer Learning Methods to Effectively Diagnose Cervical Cancer from Liquid-Based Cytology Pap Smear Images. Int. J. Online Biomed. Eng. 2023, 19, 77–93. [Google Scholar] [CrossRef]
  20. Deo, B.S.; Pal, M.; Panigrahi, P.K.; Pradhan, A. CerviFormer: A pap smear-based cervical cancer classification method using cross-attention and latent transformer. Int. J. Imaging Syst. Technol. 2024, 34, e23043. [Google Scholar] [CrossRef]
  21. Payne, P.; Romould, R.V.; Mondal, J.; Chatterjee, R.; Gourisaria, M.K. Beyond Microscope: Advances in Technology for Detection of Cervical Cancer. In Proceedings of the International Conference on Pattern Recognition; IEEE: New York, NY, USA, 2024; pp. 180–193. [Google Scholar] [CrossRef]
  22. Jadhav, V.S.; Yakkundimath, R.; Saunshi, G.; Konnurmath, G. Deep Learning Based Classification of Cervical Cancer Stages Using Transfer Learning Models. Indian J. Med. Paediatr. Oncol. 2025, 46, 480–488. [Google Scholar] [CrossRef]
  23. Hossain, J.; Xu, P. Transfer Learning Assisted Cervical Cancer Categorization from Pap Smear Images Via the Multihead Attention Technique. In Proceedings of the 2025 IEEE 5th International Conference on Smart Information Systems and Technologies (SIST); IEEE: New York, NY, USA, 2025; pp. 1–6. [Google Scholar] [CrossRef]
  24. Mondal, J.; Chatterjee, R.; Gourisaria, M.K.; Sahni, M.; León-Castro, E. Cervical cancer classification using a novel hybrid approach. Front. Oncol. 2025, 15, 1703772. [Google Scholar] [CrossRef] [PubMed]
  25. PathMNIST Dataset URL. Available online: https://medmnist.com/ (accessed on 20 March 2026).
  26. SIPAKMED Dataset URL. Available online: https://www.kaggle.com/datasets/prahladmehandiratta/cervical-cancer-largest-dataset-sipakmed?resource=download (accessed on 20 March 2026).
  27. Mikołajczyk, A.; Grochowski, M. Data augmentation for improving deep learning in image classification problem. In Proceedings of the 2018 International Interdisciplinary PhD Workshop (IIPhDW); IEEE: New York, NY, USA, 2018; pp. 117–122. [Google Scholar]
  28. Xu, Y.; Khan, T.M.; Song, Y.; Meijering, E. Edge deep learning in computer vision and medical diagnostics: A comprehensive survey. arXiv 2026, arXiv:2605.06714. [Google Scholar] [CrossRef]
  29. Morid, M.A.; Borjali, A.; Del Fiol, G. A scoping review of transfer learning research on medical image analysis using ImageNet. Comput. Biol. Med. 2021, 128, 104115. [Google Scholar] [CrossRef] [PubMed]
  30. Ennab, M.; Mcheick, H. Advancing AI interpretability in medical imaging: A comparative analysis of pixel-level interpretability and Grad-CAM models. Mach. Learn. Knowl. Extr. 2025, 7, 12. [Google Scholar] [CrossRef]
Figure 1. Basic methodology diagram of cervical cancer classification. Here, YOLO* represents our proposed model derived from YOLO.
Algorithms 19 00584 g001
Figure 2. Example images of each class from the SIPAKMED dataset: (a) Dyskeratotic. (b) Parabasal. (c) Koilocytotic. (d) Superficial–Intermediate. (e) Metaplastic.
Algorithms 19 00584 g002
Figure 3. Comparison of ROC-AUC score across classes.
Algorithms 19 00584 g003
Figure 4. The attention-based proposed model architecture.
Algorithms 19 00584 g004
Figure 5. Various transfer learning techniques applied on the CNN models.
Algorithms 19 00584 g005
Figure 6. Confusion matrix (CM) on SIPAKMED.
Algorithms 19 00584 g006
Figure 7. ROC-AUC curve on SIPAKMED.
Algorithms 19 00584 g007
Figure 8. Ground truth vs. predicted class using SIPAKMED, green color text = correct predictions and red color text = incorrect predictions.
Algorithms 19 00584 g008
Figure 9. Grad-CAM of dyskeratotic cell image.
Algorithms 19 00584 g009
Figure 10. Grad-CAM of superficial–intermediate cell image.
Algorithms 19 00584 g010
Figure 11. LIME output for dyskeratotic cell image.
Algorithms 19 00584 g011
Figure 12. LIME output for superficial–intermediate cell image.
Algorithms 19 00584 g012
Figure 13. K-fold cross-validation summary.
Algorithms 19 00584 g013
Figure 14. Paired t-test on Parameters: SOTA models versus proposed model. Here, # p < 0.05, ## p < 0.01, ### p < 0.001, ns = not significant, Overall t = 3.180, p = 0.0113, ∆ = Another model—YOLO*, Positive ∆ = YOLO* is leaner.
Algorithms 19 00584 g014
Figure 15. Paired t-test based across GFLOPs values: SOTA versus proposed model. (Here, ## p < 0.01, ### p < 0.001, ns = not significant, Overall t = 3.182, p = 0.0111, ∆ = Another model—YOLO*, Positive ∆ = YOLO* is leaner.
Algorithms 19 00584 g015
Figure 16. Paired t-test based on model accuracy values: Proposed model versus SOTA models. (Here, # p < 0.05, ## p < 0.01, ### p < 0.001, ns = not significant, Overall t = −2.493, p = 0.0343, ∆ = Other model—YOLO*, Negative ∆ = YOLO* leads.
Algorithms 19 00584 g016
Table 1. Analysis of selected research papers.
Author/Year/Ref.MethodDataset UsedHighest Accuracy (%)Limitations
Haryanto et al. (2020) [13]AlexNetSIPAKMED87.32The CNN algorithm is based on the AlexNet architecture and a method called “non-padding”. To make the model more accurate, pixel0 is added to the source images as padding. Even though the model’s overall accuracy went up by 2.44% after using the padding strategy, the accuracy value for the benign class metaplastic is only 54%.
Arifianto et al. (2021) [14]SqueezeNetPrivate dataset98.41This study used a relatively limited dataset of cervical cell images, which can make it harder for the model to generalize and more likely to overfit. Transfer learning has made things better, but the pretrained CNN models are first trained on natural image datasets like ImageNet. Because of this, the models might not be able to accurately capture pathological features that are specific to the domain in cervical cytology images.
Rahaman et al. (2021) [15]VGG16 + VGG19 + ResNet50 + Xception
for multi-level feature
extraction
SIPAKMED
(2-class),
(3-class),
(5-class), Herlev
(2-class),
(7-class)
99.85
99.38
99.14
98.32
90.32
This framework uses several pretrained CNN models, namely VGG16, VGG19, ResNet50, and Xception, which makes it more expensive to run, uses more memory, and takes longer to train. This hybrid deep feature fusion technique makes a complicated architecture that could be hard to use on clinical systems with few resources or in real time.
Basak et al. (2021) [16]ResNet-50 + VGG16 + Inceptionv3 + DenseNet121 + PCA + GWOSIPAKMED97.82It is feasible to look into ensemble techniques based on different base learners in the future.
Liu et al. (2022) [17]CVM-Cervix
CNN + ViT + MLP
SIPAKMED91.72The absence of explainability, risk of overfitting, and dependence on pretrained natural-image models may restrict its practical usage.
Pacal and Kılıcarslan (2023) [18]EfficientNetB6 + max voting
ViT-B16 + max-voting
SIPAKMED91.76
92.95
This method can be used to find solutions for diagnosing different medical diseases.
Wong et al. (2023) [19] ResNet50V2Mendeley LBC97.00This study is constrained by limited dataset diversity, reliance on ImageNet-pretrained models, and overfitting challenges.
Deo et al. (2024) [20]Cerviformer (Cross attention + latent transformer)SIPAKMED (3 class)
Herlev (2-class)
93.70
94.57
Future research will concentrate on integrating supplementary confounding variables, enlarging the dataset to enhance consistency across diverse dysplasia levels, and also assessing ThinPrep Pap smear images.
Payne et al. (2025) [21]Custom EfficientNetSIPAKMED (5-class)
Mendeley LBC (4-class)
84.30
97.14
Future work will focus on enhancing dataset diversity via data augmentation to mitigate overfitting and enhance generalization. Explainable AI techniques can make the model easier to understand and more reliable in medical settings.
Jadhav et al. (2025) [22]EfficientNet-B7SIPAKMED (5-class)91.34In the future, work will be undertaken on improving model interpretability, investigating hybrid models, and enhancing computing performance for real-time clinical applications.
Hossain and Xu (2025) [23]CNN + Multi-Head Attention mechanismPap smear images96.23Model computational complexity, small dataset usage, and overfitting issues are a few drawbacks of this work.
Mondal et al. (2025) [24]CASPNet (multi-head self-attention blocks, cross-stage partial blocks and feature fusion integration via spatial pyramid pooling fast layer)SIPAKMED (5-class)97.07Future work will be to augment the dataset to preserve the consistent overall accuracy, using multimodal data and also increasing the accuracy for the metaplastic class.
Table 2. Image class labels present in the PathMNIST dataset.
Class LabelClass Name
Class 0adipose
Class 1background
Class 2debris
Class 3lymphocytes
Class 4mucus
Class 5smooth muscle
Class 6normal colon mucosa
Class 7cancer-associated stroma
Class 8colorectal adenocarcinoma epithelium
Table 3. Organization of image classes labels in the SIPAKMED dataset.
Name of the ClassCount of Cells
Dyskeratotic813
Koilocytotic825
Metaplastic793
Parabasal787
Superficial–Intermediate813
Total Cell Count4049
Table 4. Parameters used in augmentation technique.
ParametersValues
RandomHorizontalFlip0.5
RandomVerticalFlip0.3
RandomRotation15
ColorJittersaturation = 0.3, hue = 0.1,
brightness = 0.3, contrast = 0.3
Table 5. Parameters used for normalizing the image.
ParametersValues
Standard deviation[0.229, 0.224, 0.225]
Mean[0.485, 0.456, 0.406]
Table 6. Comparison of various scratch classifier models.
Scratch ModelVariantTrainable Params (M)Total Training Time (s)Accuracy (%)GFLOPs (G)F1 Score (%)
YOLOv5nNano1.854932.894.310.03594.40
YOLOv5sSmall9.535114.197.050.23997.09
YOLOv5mMedium25.375415.398.600.68398.60
YOLOv8nNano1.945019.393.980.03994.04
YOLOv8sSmall6.955076.395.840.15295.89
YOLOv8mMedium19.434899.198.150.53498.13
YOLOv12nNano1.944942.494.590.03094.72
YOLOv12sSmall11.485033.096.730.16196.73
YOLOv12mMedium19.325111.497.520.31497.52
YOLO*nNano1.6725074.796.070.04496.10
YOLO*sSmall9.155029.197.580.19497.61
YOLO*mMedium20.1265065.598.300.48798.29
Table 7. Per class precision, recall and F1-score.
Class LabelPrecisionRecallF1 Score (%)
00.96860.99100.9797
10.96911.00000.9843
20.73900.84370.7879
30.93830.98260.9599
40.99260.90630.9475
50.85100.70440.7708
60.92190.97170.9461
70.62290.69830.6585
80.96240.93510.9486
Table 8. Experimental setup parameters.
HyperparametersValues
Learning Rate0.0001
Loss FunctionCrossEntropy Loss and Focal loss
Batch Size128
Epochs750
Image Size28 × 28
OptimizerAdamW
SchedulerCosineAnnealingWarmRestarts
Table 9. Performance analysis of various CNN models for test cases—PathMNIST with TL, without TL, pruned model with TL and ImageNet with TL.
Scratch Model NameMethodologyTotal Training Time (s)Accuracy (%)F1 Score (%)
Scratch ResNet34With TL (PathMNIST, SIPAKMED)1193.6692.9194.54
Scratch ResNet34Without TL (SIPAKMED) 1188.6991.4493.85
Scratch ResNet34Pruned model with TL (PathMNIST, SIPAKMED)1245.7092.6795.04
Pretrained ResNet34ImageNet TL1316.7870.4470.50
Scratch EfficientNetB0With TL (PathMNIST, SIPAKMED)1249.2891.6992.01
Scratch EfficientNetB0Without TL (SIPAKMED)1226.1888.5192.10
Scratch EfficientNetB0Pruned model with TL (PathMNIST, SIPAKMED)1271.3391.2092.10
Pretrained EfficientNetB0ImageNet TL1325.1871.0071.10
Scratch MobileNetV2With TL (PathMNIST, SIPAKMED)1180.8090.2291.06
Scratch MobileNetV2Without TL (SIPAKMED)1164.4590.4692.89
Scratch MobileNetV2Pruned model with TL (PathMNIST, SIPAKMED)7274.6094.8793.52
Pretrained MobileNetV2ImageNet TL1300.7975.4175.50
Table 10. Performance of different variants of YOLO* model.
Scratch Model NameVariant Total Params (M)GFLOPs (G)Accuracy (%)Precision (%)Recall/Sensitivity (%)F1 Score (%)Specificity (%)
YOLO*n (With TL)Nano1.6720.04493.0593.1893.0593.1398.26
YOLO*n (Without TL)Nano1.6720.04493.0593.0793.0593.0698.26
Pruned YOLO*n (With TL)Nano1.7410.04496.7796.7996.7796.7799.19
YOLO*s (With TL)Small9.6080.19895.2995.3895.2895.3198.82
YOLO*s (Without TL)Small9.6080.19894.5494.6594.5494.5298.63
Pruned YOLO*s (With TL)Small9.6010.19897.2797.2897.2797.2699.31
YOLO*m (With TL)Medium20.1260.48796.5396.5496.5296.5199.13
YOLO*m (Without TL)Medium20.1260.48795.0495.0995.0395.0398.75
Pruned YOLO*m (With TL)Medium16.7360.46796.7796.8696.7796.7799.19
Table 11. Experimental results across multiple seed values.
Seed ValueAccuracy (%)F1 Score (%)
2096.2896.30
3096.5396.54
4096.7796.80
4296.7796.79
5097.5297.54
Mean ± SD96.77 ± 0.4696.79 ± 0.47
95% CI[96.20, 97.34][96.21, 97.37]
Table 12. Experimental results for K-fold cross validation (K = 5).
MetricFold 1Fold 2Fold 3Fold 4Fold 5MeanStd95% CI
Accuracy0.96770.94200.94810.94680.94960.95080.0098[0.9386, 0.9631]
Weighted Precision0.96860.94230.94840.94650.94960.95110.0102[0.9384, 0.9637]
Weighted Recall0.96770.94200.94810.94680.94960.95080.0098[0.9386, 0.9631]
Weighted F10.96770.94210.94820.94640.94950.95080.0099[0.9385, 0.9630]
Table 13. Performance comparison with various SOTA works.
Author/Year/Ref.MethodDataset UsedAccuracy (%)FLOPs (G)Parameters (M)
Haryanto et al. (2020) [13]AlexNetSIPAKMED87.320.73061.10
Rahaman et al. (2021) [15]VGG16 + VGG19 + ResNet50 + Xception for multi-level feature extractionSIPAKMED99.1485.660336.30
Basak et al. (2021) [16]ResNet-50 + VGG16 + Inceptionv3 + DenseNet121 + PCA + GWOSIPAKMED97.8228.261206.44
Liu et al. (2022) [17]CVM-Cervix
(CNN + ViT + MLP)
SIPAKMED91.7250.000150.00
Pacal and Kılıcarslan (2023) [18]EfficientNetB6 + max voting
ViT-B16 + max-voting
SIPAKMED91.76
92.95
38.000
17.600
43.00
86.00
Deo et al. (2024) [20]Cerviformer (Cross attention + latent transformer)SIPAKMED96.6716.84888.23
Payne et al. (2025) [21]Custom EfficientNetSIPAKMED84.300.4474.84
Jadhav et al. (2025) [22]EfficientNet-B7SIPAKMED91.3410.20066.70
Mondal et al. (2025) [24]CASPNet (multi-head self-attention blocks, cross-stage partial network and feature fusion integration by spatial pyramid pooling fast layer)SIPAKMED97.0717.73190.60
Our work (2026)YOLO* modelSIPAKMED96.770.46716.73
Table 14. Comparison with best-performing SOTA works.
Author/YearMethodModel TypeAccuracy (%)FLOPs (G)Parameters (M)
Rahaman et al. (2021) [15]VGG16 + VGG19 + ResNet50 + Xception for multi-level feature extractionPretrained99.1485.660336.30
Basak et al. (2021) [16]ResNet-50 + VGG16 + Inceptionv3 + DenseNet121 + PCA + GWOPretrained97.8228.261206.44
Mondal et al. (2025) [24]CASPNet (multi-head self-attention blocks, cross-stage partial network and feature fusion integration by spatial pyramid pooling fast layer)Scratch97.0717.73190.60
Our work (2026)YOLO* modelScratch96.770.46716.73
Disclaimer/Publisher’s Note: The statements, opinions and data contained in all publications are solely those of the individual author(s) and contributor(s) and not of MDPI and/or the editor(s). MDPI and/or the editor(s) disclaim responsibility for any injury to people or property resulting from any ideas, methods, instructions or products referred to in the content.