3.2. Joint Classification
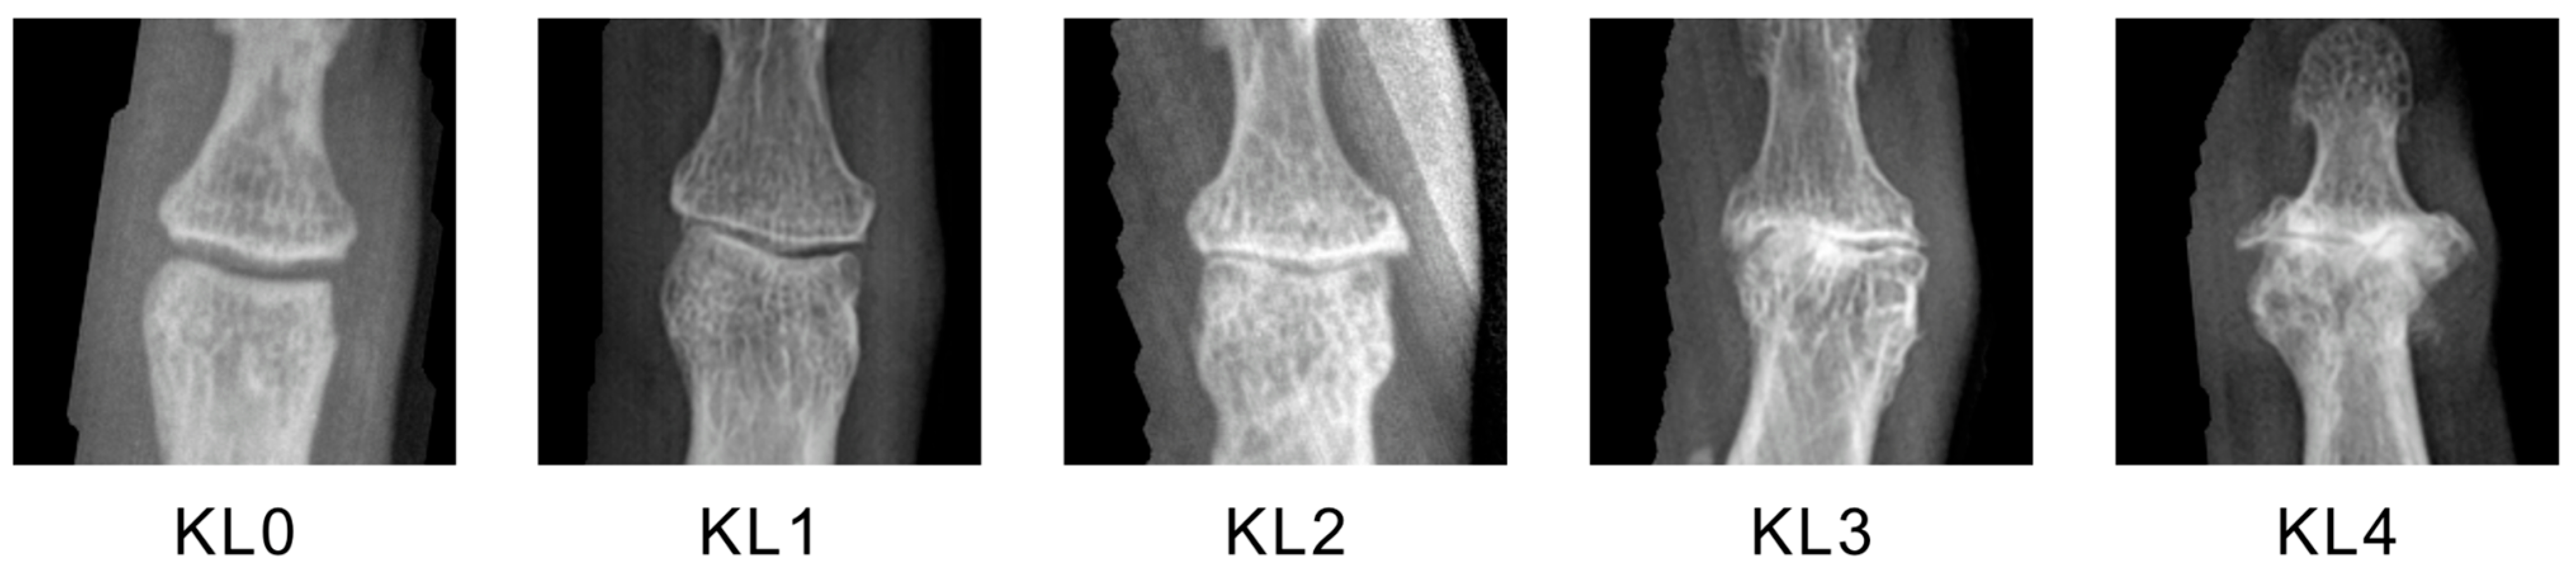
To ensure consistent experimental conditions and fair comparisons across training strategies, we adopted a KL3-focused augmentation scheme for all VGG19 experiments. KL3 was chosen as the primary augmentation target for three key reasons: (1) KL3 represents the early severe stage at which timely intervention can delay disease progression, making the critical threshold where management transitions from conservative to more aggressive treatment approaches. (2) KL3 presents a “borderline grade”, falling between minimal osteoarthritis (KL2) and severe osteoarthritis (KL4), with features such as moderate joint space narrowing and osteophyte formation that are subtle and frequently overlap with those of adjacent grades, making it particularly challenging for both clinicians and deep learning models to recognize consistently. (3) Among the severe grades, KL3 is more underrepresented relative to its clinical importance, with only 151 samples (1.4% of the dataset). For these reasons, KL3-focused augmentation was adopted.
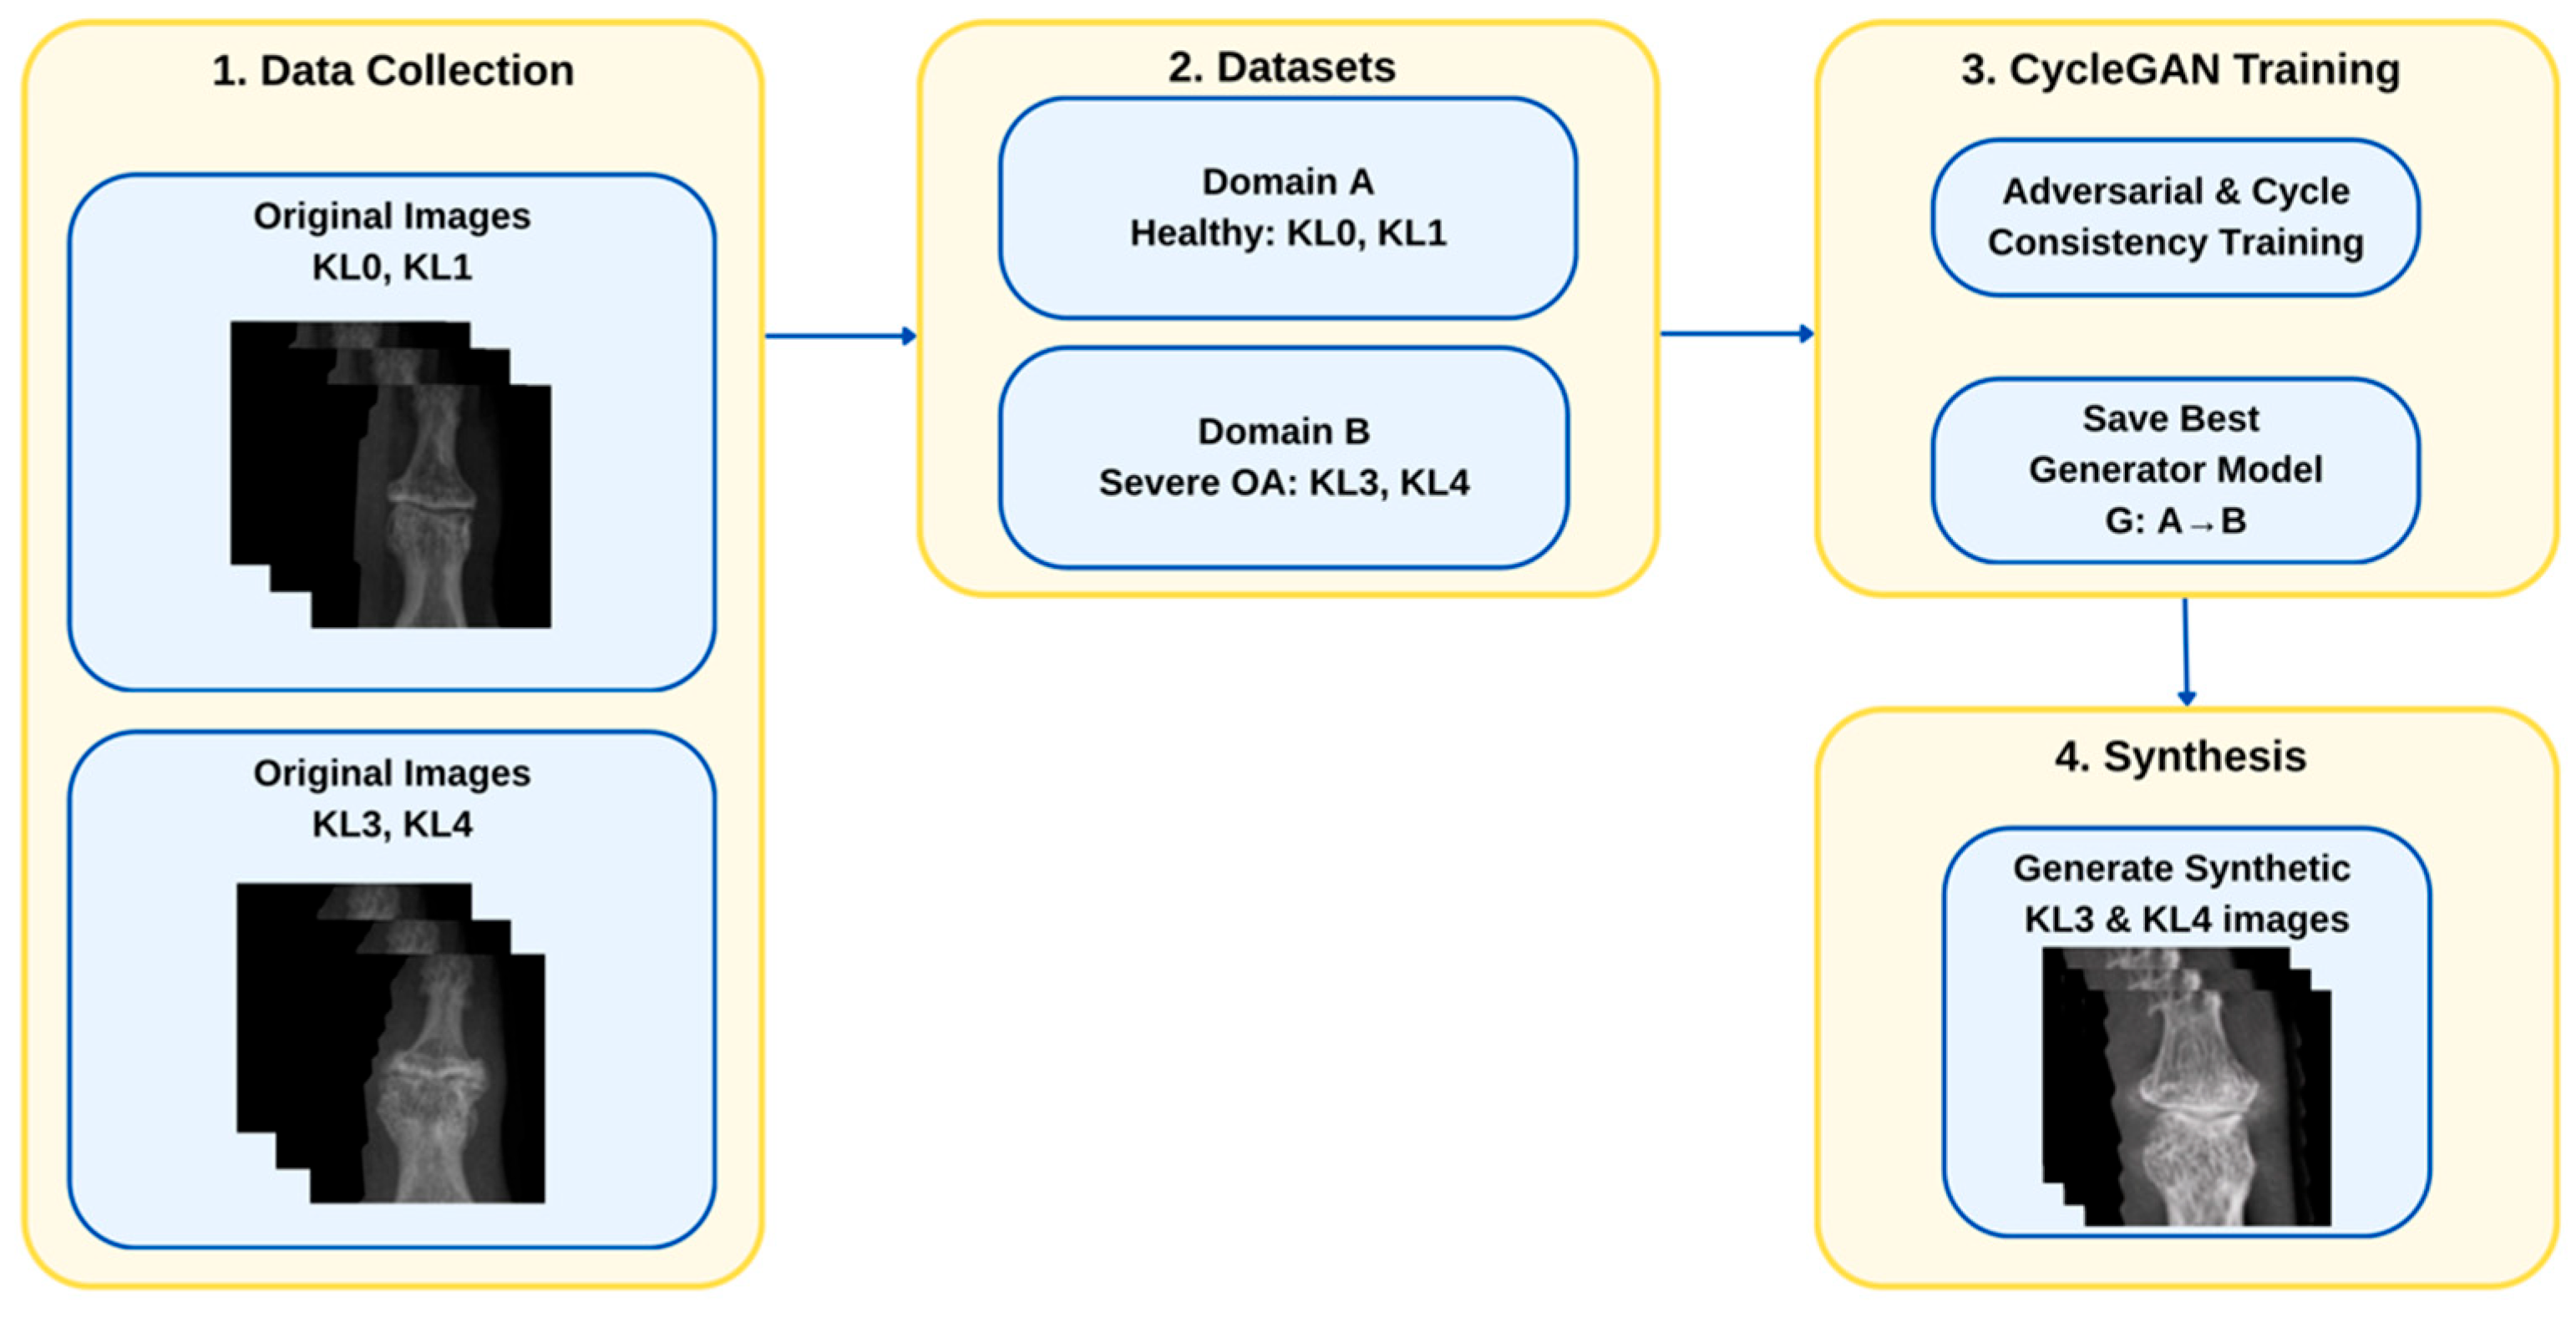
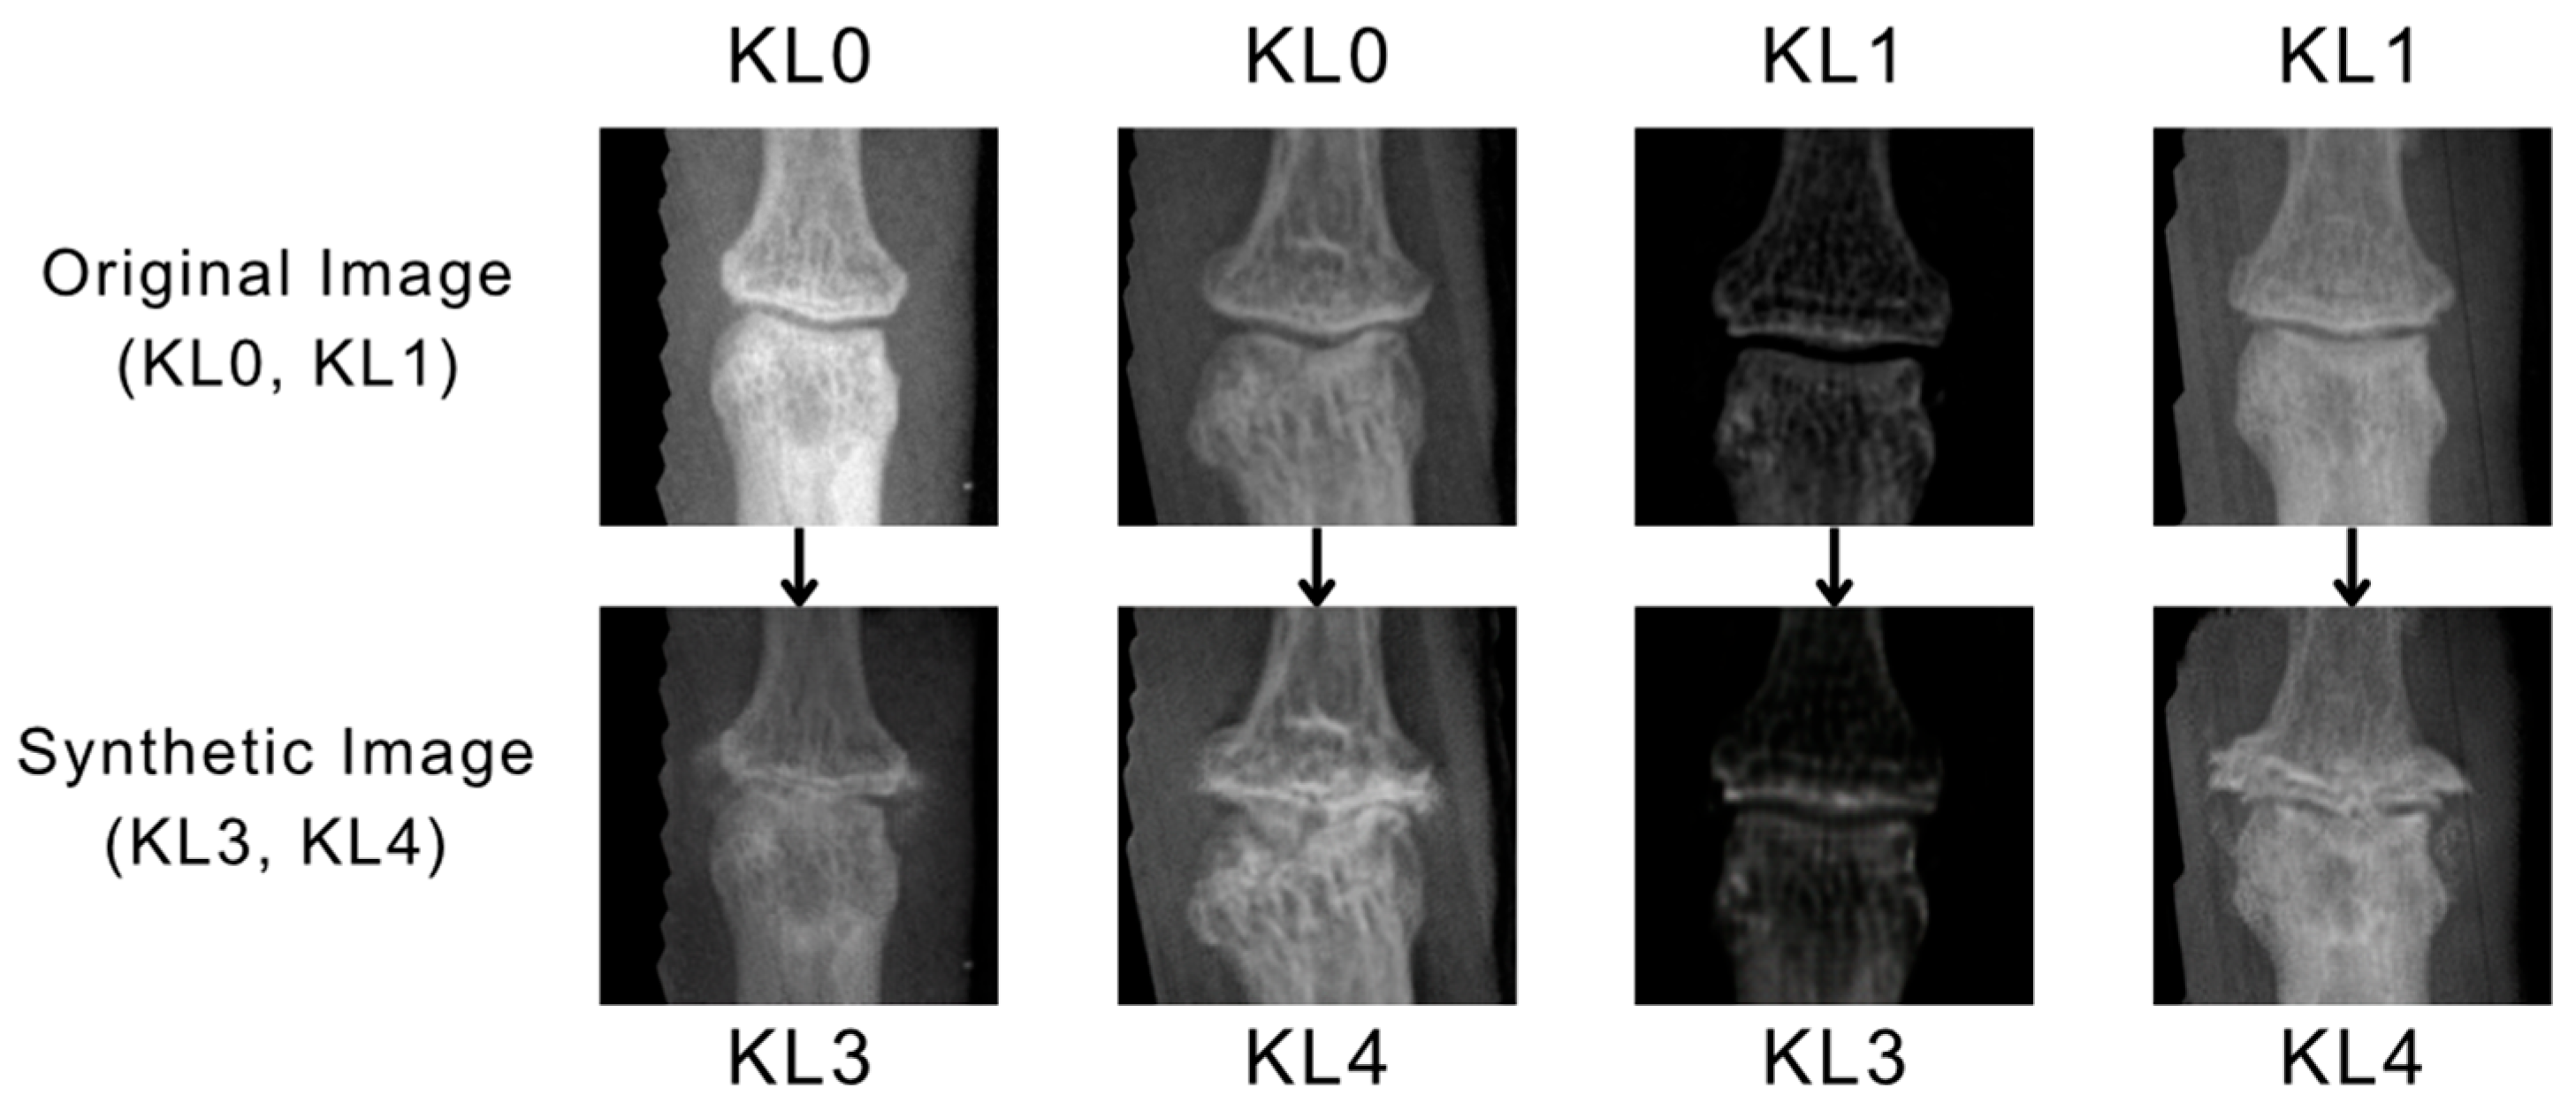
From the synthetic KL3 image pool generated by CycleGAN, 300 images were randomly selected and submitted to a rheumatologist for quality review, as described in
Section 2.3.5. Of these, 182 images were approved as clinically plausible and included in the augmented training set; the remaining were rejected for failing to exhibit diagnostically consistent KL3 features. The final distribution of the DIP joint images across the training, validation, and test sets for the VGG19 model is shown in
Table 3.
To ensure unbiased evaluation and stable model selection, a two-stage evaluation protocol was employed. First, the dataset was split into fixed training, validation, and test subsets, as summarized in
Table 3, with the test set held out and never used during model training or hyperparameter tuning. Model development and optimization were performed exclusively using the training and validation sets. To further account for variability due to stochastic weight initialization and training dynamics, each model configuration was independently trained three times with different random initialization. Final performance for each model was reported as the mean across the three independent runs. Statistical significance between competing strategies was evaluated using paired two-sample
t-tests based on performance metrics obtained from the three independent training runs. For each model, a
p-value threshold of 0.05 (corresponding to a 95% confidence level) was used to determine statistical significance. In addition, 95% confidence intervals were computed to report uncertainty in model performance estimates. Training was performed for up to 200 epochs with a batch size of 32, using the Adam optimizer with an initial learning rate of 1 × 10
−5. A learning rate scheduler (ReduceLROnPlateau) was applied to reduce the learning rate upon plateau of validation loss with a patience of 5 epochs. Early stopping was applied based on validation loss, and the best model checkpoint was saved during the training. Evaluation metrics included per-class accuracy, per-class F1-score, overall accuracy, and overall F1-score. Additionally, binary classification performance (OA vs. non-OA) was assessed to reflect clinical decision-making scenarios.
3.2.1. Strategy 1—Baseline Performance
The baseline VGG19 model, trained on the original imbalanced dataset with standard cross-entropy loss, exhibited the expected pattern: strong majority class performance with severe under detection of the minority class. As shown in
Table 4 (row 1), the model achieved high accuracy and F1-scores for well-represented healthy grades: KL0 (accuracy = 90.3%, F1 = 0.887) and KL2 (accuracy = 76.3%, F1 = 0.713). The precision-recall breakdown further contextualizes this pattern: KL0 precision was 0.863 with recall of 0.903. However, performance degraded sharply for minority classes. For the KL3 class, which contains 23 test samples, the model demonstrated consistently poor and unstable performance across all experimental runs. The number of correctly classified KL3 samples varied between 3 and 6 out of 23, corresponding to an accuracy range of approximately 13.0–26.1% across runs. This variation highlights the sensitivity of the baseline model to random initialization under severe class imbalance conditions. The mean KL3 F1-score remained low (0.280), indicating poor recall and limited ability to correctly identify severe osteoarthritic cases. Similarly, KL4 performance remained suboptimal (accuracy = 58.3%, F1 = 0.573; precision = 0.690, recall = 0.533), suggesting partial but inconsistent recognition of advanced disease patterns.
KL1 presented a distinct challenge despite being relatively abundant (1574 samples). The model achieved only 23% accuracy (F1 = 0.267; precision = 0.330, recall = 0.230), frequently misclassifying KL1 joints as KL0 (48.46% of errors) or KL2 (28.68% of errors). This reflects KL1’s transitional nature: “questionable osteophyte or JSN” represents inherently ambiguous radiographic findings that challenge both human graders and automated classifiers.
Overall metrics appeared deceptively reasonable (accuracy = 76.3%, F1 = 0.747), masking the critical weakness in severe OA detection. This baseline establishes the severity of class imbalance and the urgent need for targeted mitigation strategies.
3.2.2. Strategy 2—Synthetic Data (SD) Only Results
Introducing 182 rheumatologist-validated synthetic KL3 samples improved minority-class detection compared to baseline. KL3 accuracy rose to 29% (F1 = 0.350), with recall improving from 0.203 to 0.290, confirming that additional training examples directly increase the model’s ability to detect true KL3 cases. KL4 also improved modestly to 53.3% accuracy (F1 = 0.590). This demonstrates that data-level augmentation can enhance minority-class recognition by providing the model with additional training examples that exhibit the target pathology. KL0 and KL2 performance remained stable, confirming that validated synthetic augmentation does not degrade majority-class learning. Overall accuracy was 76.7% (F1 = 0.740).
However, KL1 declined slightly (accuracy = 16%, F1 = 0.21; precision = 0.313, recall = 0.157), and the gains for KL3, while meaningful, remained limited in absolute terms. These results confirm that clinically validated data-level augmentation provides a useful foundation for minority-class improvement, but additional strategies are needed to fully address severe class imbalance.
3.2.3. Strategy 3—Oversampling (OS) Only Results
Random Oversampling of KL3 (×5) and KL4 (×10) on the original training data produced a markedly different performance profile. KL4 accuracy surged to 93.3% (F1 = 0.750)—driven by a dramatic recall improvement to 0.933 (the highest across all strategies)—while precision declined to 0.627, reflecting oversampling’s effectiveness at restoring frequency balance for the more visually distinct end-stage grade. KL3 reached 48% accuracy (F1 = 0.447; precision = 0.423, recall = 0.480), representing the strongest recall gain among single-intervention strategies for KL3, though precision remained lower than baseline (0.424 vs. 0.550), indicating some over-detection of the grade.
KL0 and KL2 performance remained stable, while KL1 (accuracy = 19.3%, F1 = 0.243; precision = 0.337, recall = 0.193) remained consistently challenging across data-level strategies. Overall accuracy was 76.7% (F1 = 0.747). A key trade-off is evident when comparing Strategy 3 to Strategy 2: oversampling dramatically improves KL4 detection (93.3% vs. 53.3%) but offers limited KL3 generalization, since it only replicates existing feature patterns without introducing new pathological variation, which is more important for transitional grades with ambiguous features such as KL3. These two data-level strategies are therefore complementary, motivating their combination in Strategy 5.
3.2.4. Strategy 4—Focal Loss (FL) Only Results
Replacing cross-entropy with focal loss yielded notable improvements in minority-class detection without requiring additional data. KL3 accuracy increased to 51% (F1 = 0.427), with recall rising to 0.510—the highest among all single-intervention strategies, while precision declined to 0.370, reflecting the adaptive reweighting mechanism pushing the model to identify more KL3 cases at the cost of some false positives. KL4 showed a different dynamic: recall dropped to 0.500 (below oversampling’s 0.933) while precision improved to 0.687, indicating that focal loss produces more conservative but higher-confidence KL4 predictions.
KL0 and KL2 performance remained consistent with baseline (accuracy change within 3%), confirming that focal loss’s adaptive reweighting does not sacrifice majority-class accuracy. KL1 detection declined to 11.3% accuracy (F1 = 0.167), likely because focal loss down-weights this already-challenging transitional grade in favor of the more critical KL3 and KL4 classes. Notably, KL4 accuracy was 50% (F1 = 0.56), lower than oversampling alone (93%), revealing a meaningful trade-off: focal loss excels at attention-weighted KL3 learning but does not match oversampling’s frequency-based effectiveness for KL4. The overall accuracy was 76.7%, with an F1-score of 0.737. These results confirm that loss-function engineering addresses class imbalance more directly than data augmentation alone for KL3, but that its limitations in KL4 motivate combining it with other strategies.
3.2.5. Strategy 5—Synthetic + Oversampling (SD + OS) Results
Combining synthetic data (Strategy 2) with random oversampling (Strategy 3) yielded the strongest purely data-level performance profile across all strategies. KL3 accuracy reached 55% (F1 = 0.503), with recall of 0.550 and precision of 0.467—representing the best KL3 precision-recall balance at the data-level. KL4 reached 88.3% accuracy (F1 = 0.740; precision = 0.640, recall = 0.883), maintaining strong recall slightly below oversampling alone (0.933) but with improved precision (0.640 vs. 0.627). Overall accuracy was maintained at 77% (F1 = 0.753).
The result confirms the complementary dynamic between the two strategies: oversampling stabilizes class frequency and drives strong KL4 detection, while synthetic data introduces novel pathological feature variation that improves KL3 generalization beyond what oversampling can achieve. Neither strategy in isolation matched this combination—Strategy 2 showed lower KL4 performance (53.3%), while Strategy 3 showed more limited KL3 generalization (48%). KL1 (accuracy = 21.7%, F1 = 0.263; precision = 0.343, recall = 0.217) showed a slight recovery compared to other strategies, and KL2 remained stable (74%, F1 = 0.717). Strategy 5 represents the most effective purely data-level approach in this study.
3.2.6. Strategy 6—Full Combined Strategy (SD + OS + FL) Results
The full combined strategy integrating validated synthetic data, oversampling (KL3 ×5, KL4 ×10), and focal loss achieved the highest KL3 detection performance across all strategies. KL3 accuracy increased to 56.7% (F1 = 0.527), with recall of 0.567 and precision of 0.497, confirming a genuine synergistic gain when adaptive loss reweighting is layered on top of data-level balancing. Compared to Strategy 5, focal loss further increased KL3 recall from 0.550 to 0.567 and precision from 0.467 to 0.497. KL4 accuracy was 85% (F1 = 0.733), while overall accuracy was 76% (F1 = 0.730; precision = 0.647, recall = 0.850), slightly below Strategy 5’s KL4 recall (0.883) but with improved precision (0.647 vs. 0.640), reflecting focal loss’s tendency to refine confidence of minority-class predictions.
Comparing Strategy 6 to Strategy 5 (SD + OS), the addition of focal loss increased KL3 F1 from 0.503 to 0.527, confirming a further incremental gain when all three mechanisms are combined. KL4 decreased slightly from 88.3% (Strategy 5) to 85%, reflecting a minor trade-off introduced by focal loss reweighting. KL1 (accuracy = 10%, F1 = 0.15; precision = 0.300, recall = 0.100) declined further compared to other strategies, consistent with focal loss deprioritizing this transitional grade. KL0 and KL2 remained stable. The progression across Strategies 1–6 demonstrates a clear hierarchy: validated synthetic data provides a qualitative foundation, oversampling substantially boosts frequency-sensitive minority detection, their combination maximizes data-level KL3 generalization, and focal loss provides a final incremental algorithmic gain. Overall, strategy 5 achieves the best performance and balanced improvement across all categories in this study.
3.2.7. Binary OA Classification Results
To contextualise clinical utility, all six configurations were evaluated under a binary OA vs. non-OA scheme (clinically, KL0–KL2 are non-OA; KL3–KL4 are OA), with results summarised in
Table 5. In a screening context, OA sensitivity (recall) is the most critical metric, as missed OA cases carry a higher clinical cost than false positive referrals.
The baseline achieved high accuracy (98.7%) and specificity (99.9%) but only 56.6% OA sensitivity, meaning more than 4 in 10 true OA cases were missed—confirming that global accuracy is a misleading indicator of clinical utility under severe class imbalance. Strategy 2 (Synthetic Only) improved sensitivity modestly to 63.6%, and minimal cost to specificity (99.81%).
Strategy 3 (Oversampling Only) raised OA sensitivity to 95.4% and achieved an F1-score of 0.828, reducing the FN rate from 43.41% to 4.65%. Strategy 4 (Focal Loss Only) improved sensitivity substantially to 83.7% without requiring additional data, maintaining high precision (0.910) and specificity (99.4%).
Strategy 5 (SD + OS) achieved the highest OA sensitivity overall (96.1%) and the lowest FN rate (3.88%), while also maintaining high precision (0.910)—outperforming Strategy 3 on both precision and sensitivity. Strategy 6 (SD + OS + FL) matched Strategy 3’s sensitivity (95.4%) with superior precision (0.910 vs. 0.732), offering the best sensitivity-specificity balance among all strategies.
Overall, oversampling-inclusive strategies dominated in sensitivity, with Strategy 5 achieving peak sensitivity and Strategy 6 offering the most clinically balanced profile. Strategies without oversampling produced higher precision but fell consistently short on sensitivity, reinforcing frequency-based resampling as the primary driver of OA sensitivity improvement.
3.2.8. Confusion Matrix Analysis
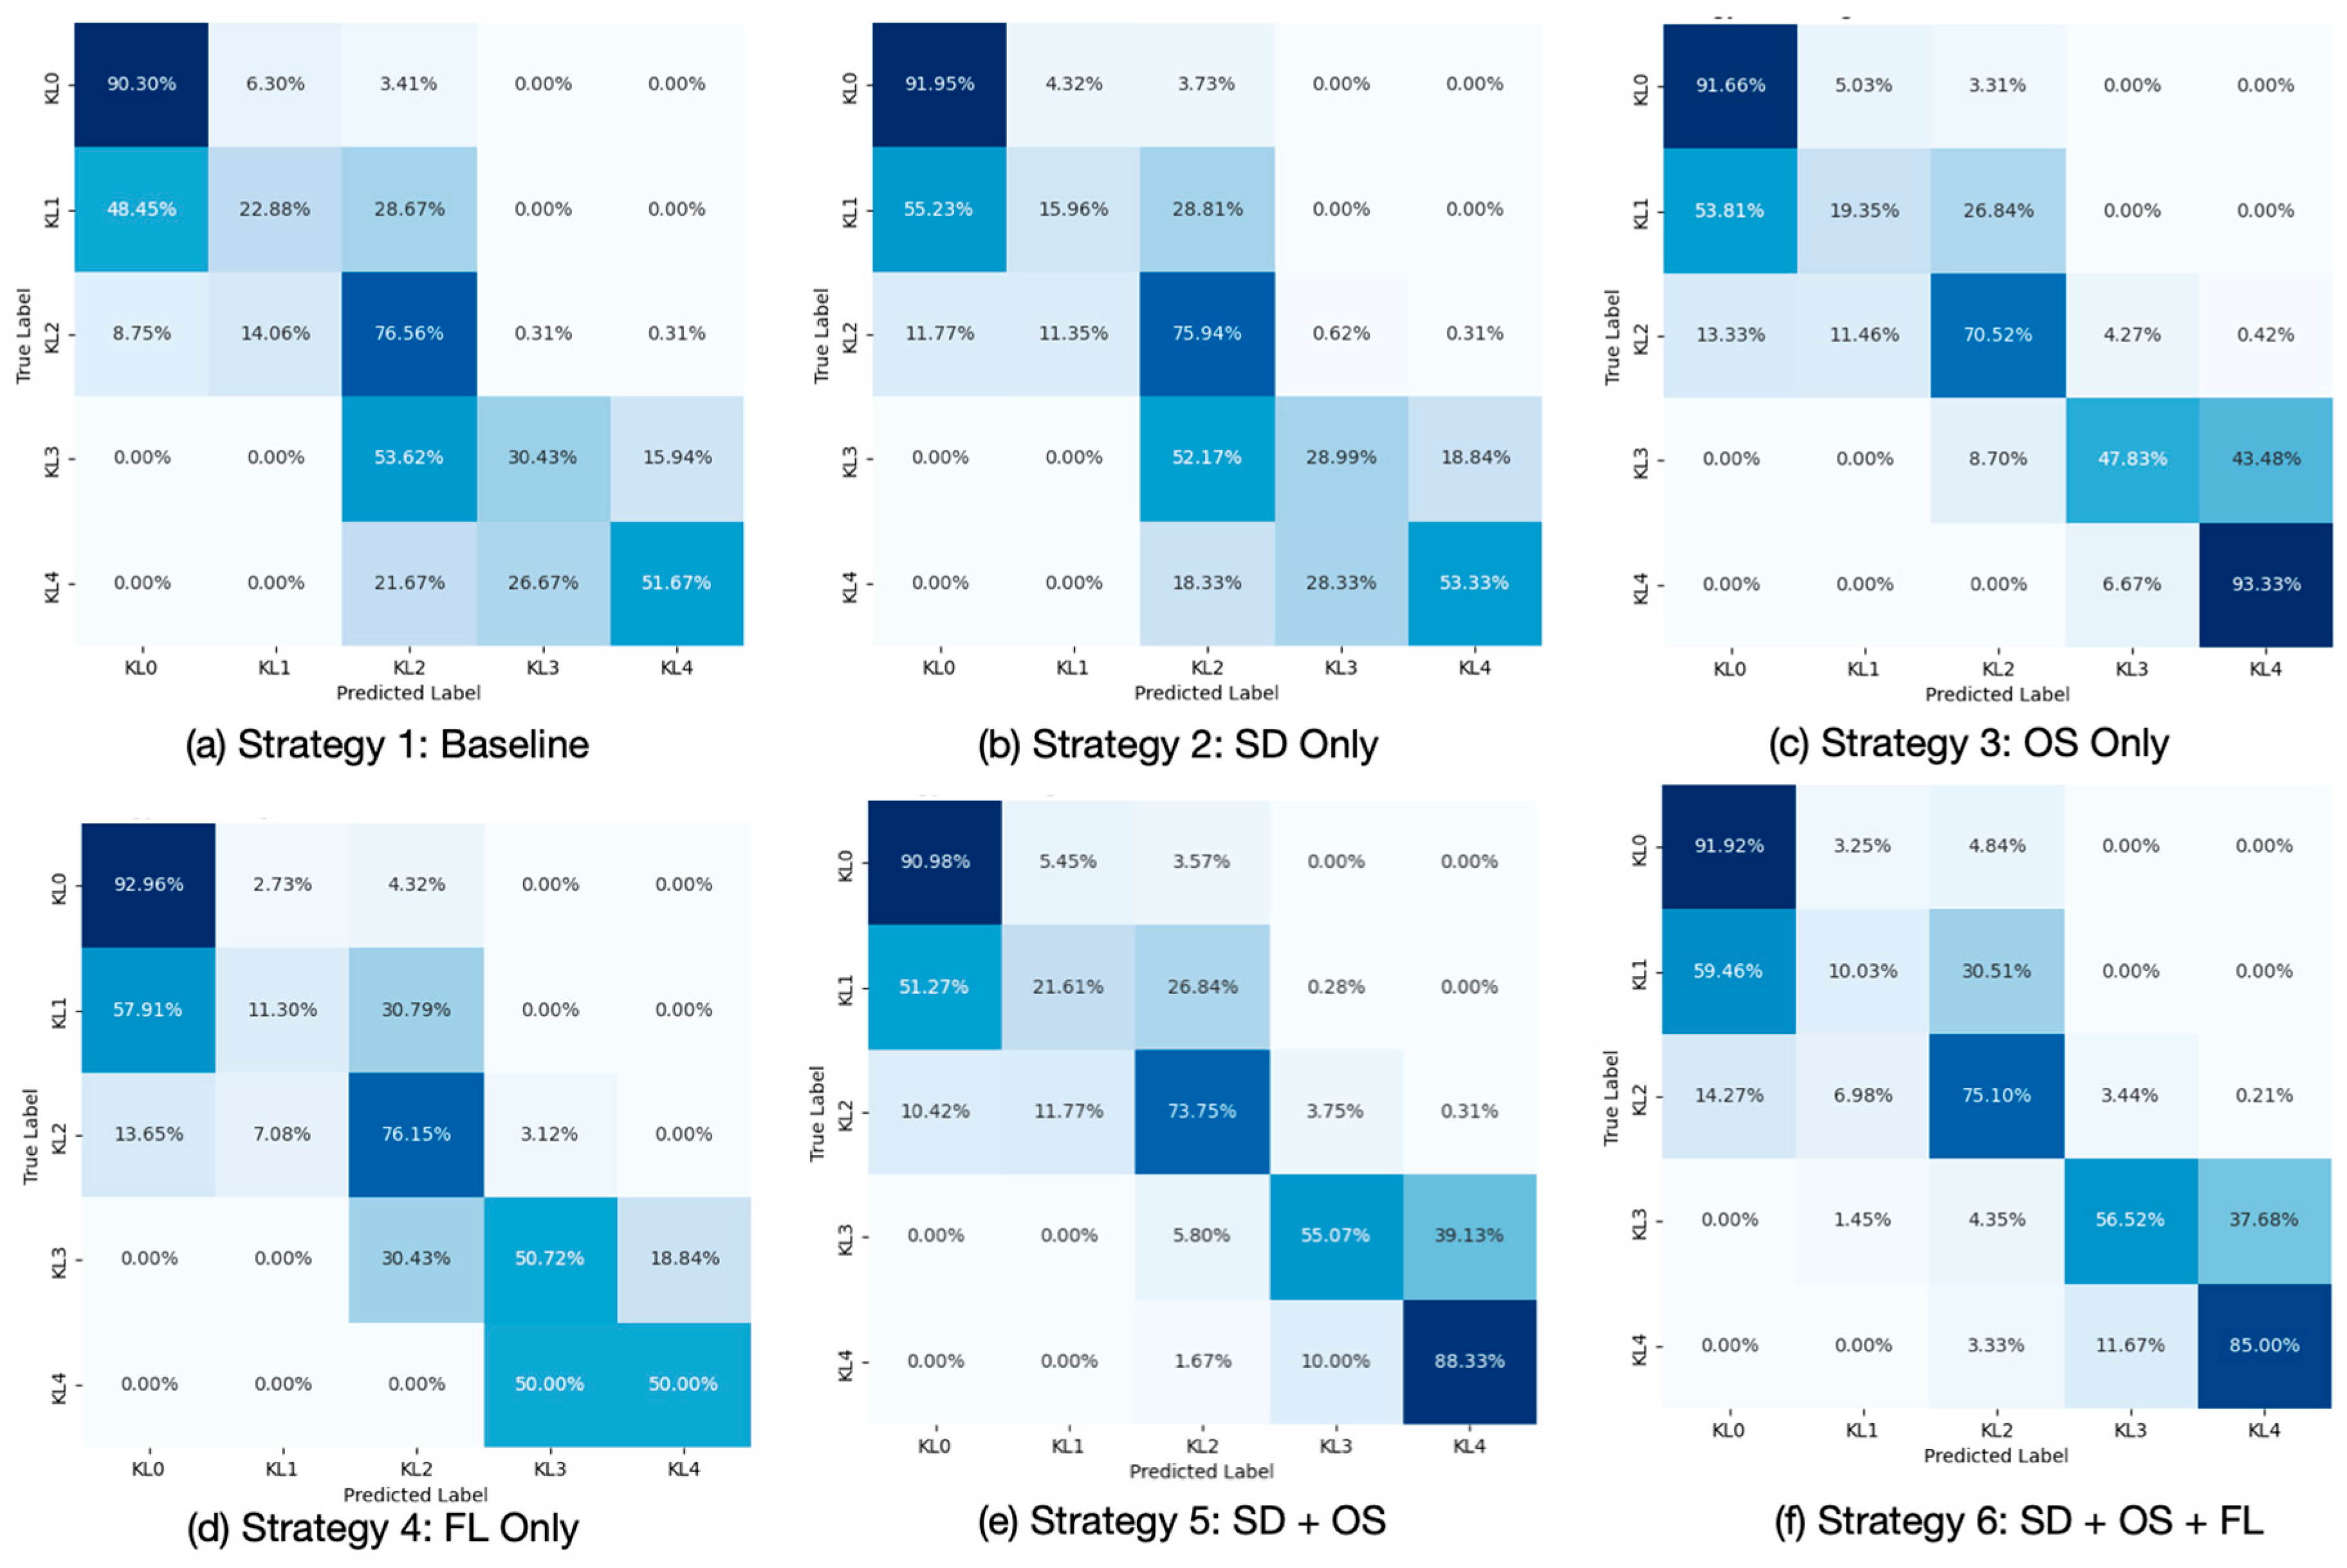
To complement per-class accuracy and F1-score metrics, averaged row-normalized confusion matrices were computed across 3 independent runs for each of the six training strategies, for both five-category KL-grade classification and binary OA vs. non-OA classification. Row normalization expresses each cell as the proportion of true samples of that grade predicted to each class, making misclassification patterns directly comparable across grades regardless of class size.
Figure 6 presents the five-class matrices and
Figure 7 presents the binary matrices.
Five-Category KL-Grade Analysis
Across all strategies, KL1 remained the most challenging grade, with diagonals ranging from 10.03% (Strategy 6) to 22.88% (baseline), with errors consistently absorbed by KL0 and KL2, reflecting its inherently transitional and radiographically ambiguous nature. KL0 and KL2 diagonals remained broadly stable across strategies (90–93% and 70–79%, respectively), confirming that minority-class interventions did not substantially disrupt majority-class learning.
The most diagnostically critical pattern was the KL3 → KL2 misclassification rate, which represents systematic under-staging of early severe OA. At baseline, 53.62% of KL3 samples were misclassified as KL2, with only 30.43% correctly identified. Strategies without oversampling (2, 4) reduced this error to varying degrees but did not eliminate it. In contrast, oversampling-inclusive strategies (3, 5, 6) dramatically suppressed this error, with Strategies 5 and 6 reducing KL3 → KL2 confusion to 5.80% and 4.35% respectively, redirecting residual errors toward KL4 (over-staging) rather than KL2 (under-staging)—a clinically preferable failure mode.
KL4 diagonals showed a similar pattern: baseline achieved 51.67%, oversampling-inclusive strategies produced the highest values (93.33%, 88.33%, 85.00% for Strategies 3, 5, 6, respectively), while focal-loss-only Strategy 4 showed a split 50%/50% between KL3 and KL4, indicating difficulty separating end-stage OA without frequency support. Strategy 6 achieved the highest KL3 diagonal overall at 56.52%, combining strong minority-class detection with stable majority-class performance.
Binary OA vs. Non-OA Analysis
The binary matrices reveal a clear stratification across strategies based on the presence or absence of oversampling. Strategies without oversampling (1, 2, 4) maintained high non-OA specificity (TN rates 99.37–99.87%) but produced elevated FN rates of 43.41%, 36.43%, 16.28%, and 31.78%, respectively, indicating a substantial proportion of true OA cases were missed.
Oversampling-inclusive strategies (3, 5, 6) consistently achieved FN rates at or below 4.65%, meaning at most 1 in 20 true OA cases was missed. Strategy 5 achieved the highest OA sensitivity at 96.12% (FN = 3.88%), while Strategy 6 matched Strategy 3’s sensitivity at 95.35% with a lower FP rate (0.73% vs. 0.95%) and higher precision, offering a better sensitivity-specificity balance for clinical use.
Overall, oversampling is the dominant driver of OA recall improvement, while focal loss offers a precision-specificity refinement when added on top. Strategy 6 represents the most clinically robust configuration, minimizing missed OA cases while keeping false positive burden low.
3.2.9. Statistical Significance Analysis
Paired two-sample
t-tests were conducted comparing KL3 and binary OA F1-scores between each strategy and the baseline across 3 independent runs (α = 0.05). Results are summarized in
Table 6 and
Table 7.
Table 6 reports mean ± SD, 95% confidence intervals (CI), and statistical significance for KL3 and KL4 individually, while
Table 7 presents the corresponding results for binary OA classification by grouping KL3 and KL4 together.
Five-class analysis: Majority-class grades (KL0, KL1, KL2) showed no statistically significant changes relative to baseline across any strategy (all
p > 0.10), confirming that minority-class interventions did not disrupt majority-class reliability (full per-grade statistics are provided in
Supplementary file). For KL3, significant improvements were observed in three strategies: Strategy 3 (OS Only; F1 = 0.447,
p = 0.015), Strategy 5 (SD + OS; F1 = 0.503,
p = 0.015), and Strategy 6 (SD + OS + FL; F1 = 0.527,
p = 0.048). Strategy 4 (FL Only) produced a borderline result (F1 = 0.427,
p = 0.062), while Strategy 2 did not reach significance (
p = 0.369 and
p = 0.778). No strategy reached significance for KL4 (all
p > 0.05), though Strategies 3 and 5 approached the threshold (
p = 0.071 and
p = 0.086, respectively).
Binary OA analysis: Non-OA F1 remained stable across all strategies (all p > 0.18), confirming that OA detection gains did not come at the expense of non-OA reliability. For OA (KL3–4), significant improvements over baseline (F1 = 0.416) were confirmed for Strategy 3 (F1 = 0.588, p = 0.031) and Strategy 5 (F1 = 0.613, p = 0.029)—the strongest statistically confirmed OA result. Strategy 6 approached but did not reach significance (F1 = 0.623, p = 0.055), likely due to limited statistical power at n = 3 runs.
Overall, statistically confirmed KL3 and OA improvements were exclusively observed in oversampling-inclusive strategies, while no strategy compromised majority-class performance. The borderline results for Strategies 4 and 6 suggest that increasing the number of runs would likely yield additional confirmed improvements.