1. Introduction
Driven by rapid socio-economic growth and the sustained development of power grids, transmission lines have become indispensable elements of modern power systems. These lines often traverse complex geographical environments and are exposed to natural climatic conditions over extended periods, making them highly susceptible to interference from external foreign objects [
1]. Common foreign objects include lightweight wind-blown debris such as plastic films, dust-proof nets, and kite strings entangled with conductors under strong wind conditions, foreign objects thrown due to mis-operation of construction machinery, and vegetation like trees and bamboo falling from extreme weather events [
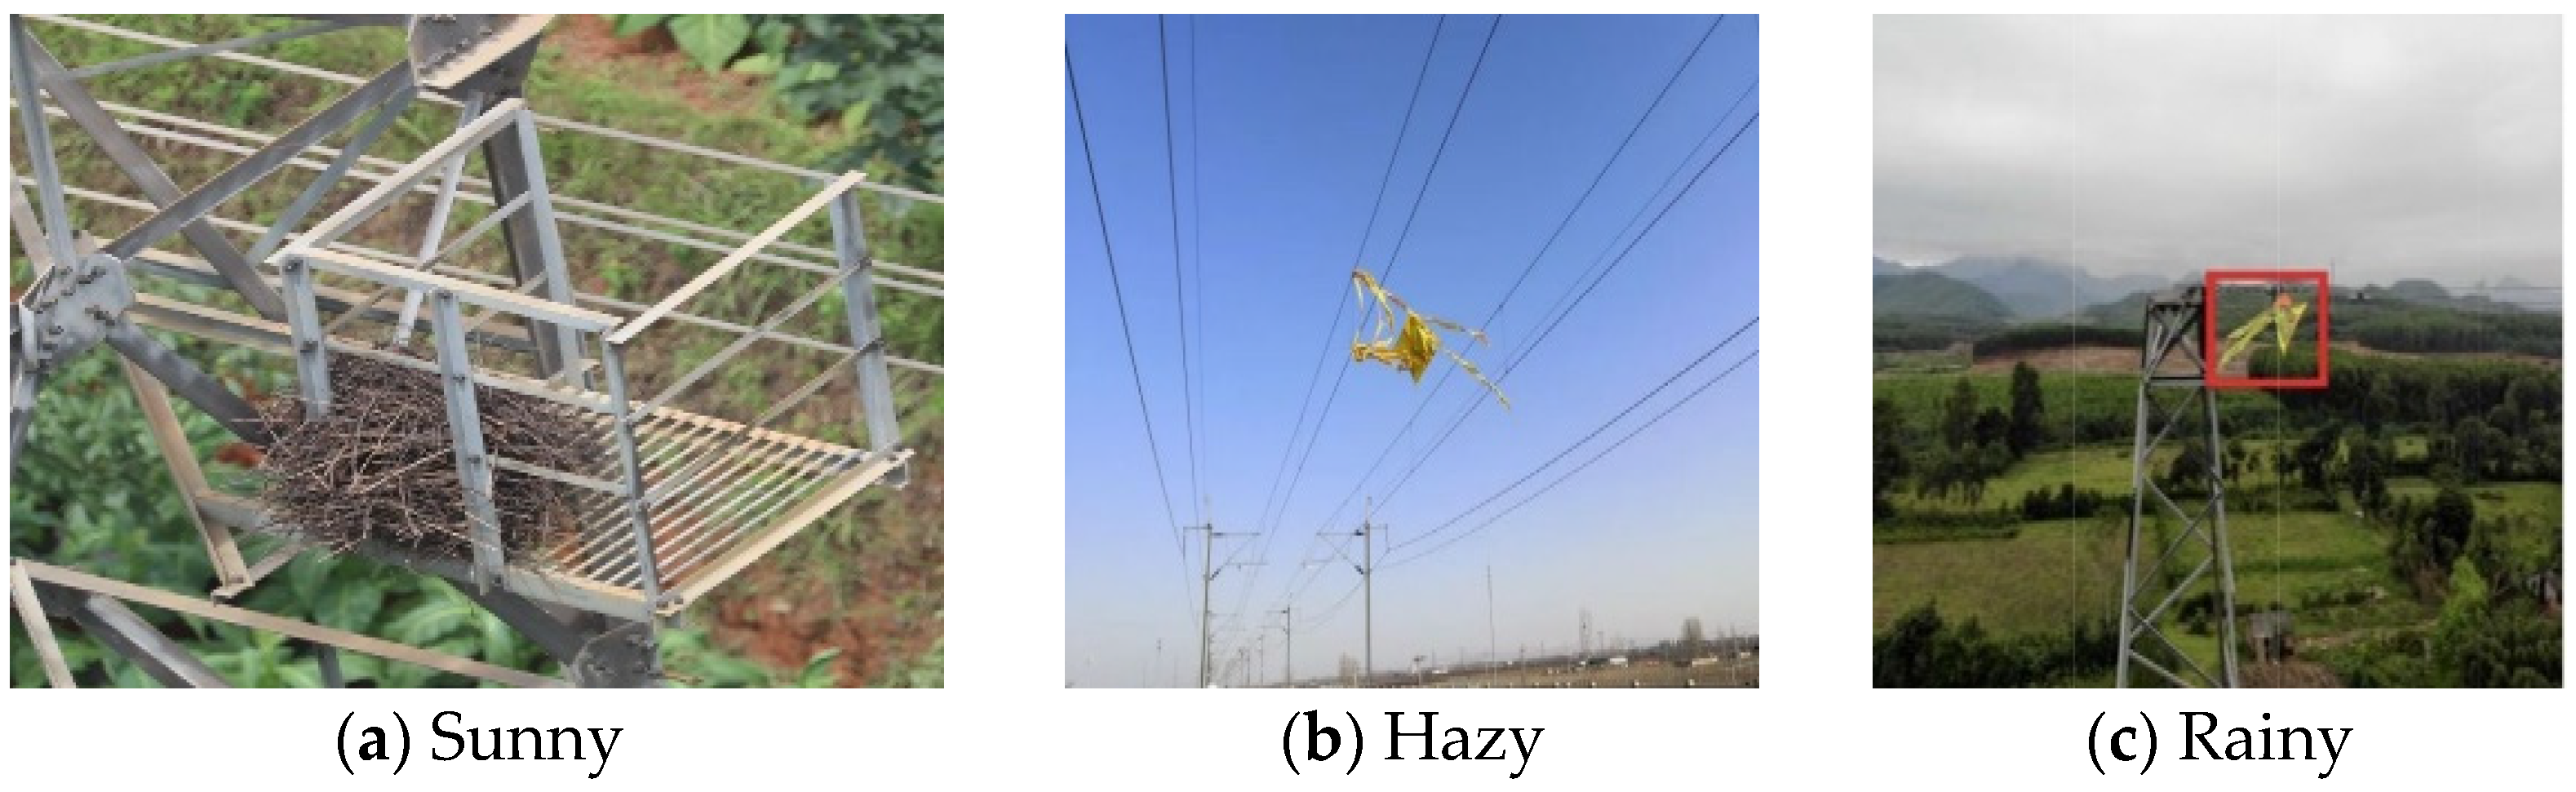
2]. In residential areas, entangled kites, balloons, other easily wind-blown household waste, and nests are the most prevalent occurrences. According to statistical analyses, foreign object debris (FOD) on transmission lines contributes to more than 30% of tripping incidents in distribution networks, resulting in widespread power interruptions and substantial economic losses, while seriously endangering the reliability and operational security of the power system [
3]. Accordingly, timely identification and removal of FOD on transmission lines are critical for ensuring power supply reliability.
In traditional transmission-line inspection practices, manual inspections, helicopter patrols, and fixed-position camera monitoring are the primary approaches. Among these, manual inspection is inefficient, highly hazardous, and constrained by terrain and weather conditions [
4,
5,
6]; helicopter-based inspection is costly and difficult to deploy frequently; and fixed monitoring systems often suffer from visual blind spots. These methods predominantly rely on the empirical judgment of inspection personnel, resulting in high missed detection rates for small or semi-transparent foreign objects, and they are incapable of achieving real-time alerts and precise localization.
With the growing maturity of drone technologies in recent years, inspection systems based on unmanned aerial vehicles have gradually gained wider application. However, their backend analysis still relies heavily on manual visual interpretation of images, resulting in insufficient intelligence. The growing volume of image data brings substantial processing pressure, which has become a key bottleneck and is no longer sufficient to satisfy the monitoring demands of contemporary smart power systems. The aforementioned challenges can be effectively addressed by deep learning approaches, among which convolutional neural network (CNN)-based object detection playing a central role. In CNN-based object detection, existing methods are commonly grouped into two paradigms, referred to as one-stage and two-stage approaches. Common one-stage object detection frameworks are single-shot multiBox detector (SSD) [
7] and YOLO [
8,
9]. These algorithms accomplish target localization and classification through a single forward network propagation, eliminating the need for candidate region generation, resulting in a fast detection speed and achieving end-to-end detection. Representative two-stage object detection frameworks are R-CNN and Faster R-CNN [
10]. They follow a two-step process of region proposal and classification-regression. The detection pipeline typically proceeds by first generating region proposals and then performing fine-grained classification and bounding box regression for each region. In recent years, algorithms represented by Faster R-CNN, YOLO, and SSD have achieved breakthrough progress in object detection scenarios. Specifically, Wang et al. [
11] utilized a real-world dataset to conduct a comparative analysis of the deformable part model, Faster R-CNN, and SSD methods, indicating the capability of deep learning techniques to support real-time foreign object on transmission lines. Satheeswari et al. [
12] combined VGG16 and EfficientNetB7 as feature extraction networks and employed an SSD to localize nests; however, due to the dataset containing only 500 images, the resulting model exhibited weak generalization capability and robustness.
Although existing detection models have achieved certain application results in object detection, directly applying general object detection models to foreign object detection on transmission lines faces some challenges: (1) inspection images have complex backgrounds, with strong confusion between foreign object targets and foreground objects such as conductors, insulators, and tower materials, as well as backgrounds such as mountains, trees, and buildings, resulting in significant environmental interference; (2) the targets to be detected exhibit diverse scales, ranging from large-sized hanging objects at close distances to small-scale floating objects at far distances, often displaying characteristics such as translucency and reflection, leading to weak and incomplete features; (3) there is a scarcity of positive sample data for foreign objects, while the background forms of normal line components as negative samples are extremely diverse, resulting in severe class imbalance and long-tail distribution problems. Given the practical requirements in transmission-line inspection tasks and the limitations of existing general detection models, the YOLO series algorithms demonstrate unique advantages due to their exceptional inference speed. Related research, oriented towards the scenario of foreign object detection on transmission lines, achieves more accurate detection of targets by innovating upon YOLO detection algorithms and their variants. For instance, Liu et al. [
13] developed a multi-level cross-domain detection framework by combining the YOLOv11 architecture with ConvNeXt. Simultaneously, they employed Bayesian Bayesian optimization for hyperparameter tuning of the model, which increased the convergence speed and ensured high detection precision, though it led to increased structural complexity of the model. Wang et al. [
14] proposed a YOLOv8-BiFPN method, which incorporates a weighted bidirectional cross-scale feature fusion structure into the YOLOv8 detection head. Although the two strategies enhance the approach’s adaptability to complex environments and diverse target shapes, its detection performance on small-scale targets remains inadequate. Liu et al. [
15] developed an enhanced YOLOv8n model that substitutes the conventional stepwise convolution with a spatial depthwise convolution module, thereby improving recognition efficiency for small and low-resolution targets. The large selective kernel attention mechanism is adopted to improve the feature extraction network, thereby strengthening effectiveness in feature representation. However, when applied to targets in complex environments, the model remains susceptible to missed detections and false positives. Li et al. [
16] introduced an enhanced object detection framework, termed KM-YOLO, developed on the basis of the improved YOLOv5s algorithm. By integrating the GC and C3 modules to construct a C3GC attention mechanism and embedding it within the backbone, the model achieves higher detection precision, though its detection speed requires further improvement. Liu et al. [
17] incorporated Swin Transformer and CBAM attention modules, along with an additional detection layer, to enhance the extraction of global context and salient visual features, which improves the recognition of tiny defects and distant objects in the scene. Gao et al. [
18] introduced an enhanced YOLOv11-SDI foreign object detection framework, integrating a hierarchical spatial-channel dynamic inference (SDI) and adopting an adaptive feature fusion strategy to strengthen multi-scale recognition capability.
However, despite the significant progress achieved in the aforementioned research, directly applying existing models to the scenario of UAV-based transmission-line inspection still faces severe tests posed by multiple coupled challenges: First, the computational power and endurance constraints of the inspection platform necessitate that the model must be extremely lightweight. Second, the vast scale variation of targets, ranging from large, close-range hanging objects to distant, pixel-sized floating debris, demands that the model possess exceptional multi-scale perception capabilities. Third, the background is extremely complex; targets are often highly confused with conductors, insulators, and mountainous backdrops, and frequently exhibit weak features such as semi-transparency and reflection. Existing improvement schemes predominantly focus on enhancing a single performance metric or involve simple module stacking, failing to construct a synergistic solution that simultaneously optimizes accuracy, speed, lightweight design, and robustness from a systems engineering perspective. This paper takes the most lightweight YOLOv8n as the baseline model and performs a systematic, modular, and synergistic improvement upon it. To address the three aforementioned major challenges, we introduce, respectively, EfficientNetV2, Slim-neck, the Efficient multi-scale attention (EMA), and the MPDIoU loss function, aiming to build an integrated lightweight detection model for transmission-line inspection that balances high accuracy and high efficiency.
Building on the above findings, this study is proposed. The specific research contributions include:
- (1)
The original YOLOv8 backbone network is substituted with EfficientNetV2 to better balance detection precision and model efficiency.
- (2)
Slim-neck is embedded into the YOLOv8 neck to facilitate cross-layer feature interaction and strengthen feature representation, resulting in better performance on small object detection.
- (3)
By introducing the EMA after the output of the Slim-neck module, the multi-scale object detection capability is enhanced, the computational cost is reduced, and the robustness of feature representation is strengthened.
- (4)
MPDIoU is adopted in place of the default loss function to further refine localization precision for target regions.
2. YOLOv8 Algorithm
The YOLO framework directly predicts bounding box coordinates and class probabilities through single-stage forward propagation, achieving efficient end-to-end object detection with distinct advantages over other algorithms. It utilizes a convolutional network to extract multi-scale features and employs a grid partitioning strategy to accomplish target localization. Since its initial release in 2015, the YOLO family of algorithms has been extensively used for single-stage object detection [
19]. Among them, YOLOv8, introduced by Ultralytics in 2023, offers faster detection speed and higher detection precision compared to earlier versions in the YOLO series such as v3, v5, and v7. YOLOv8 is available in multiple scales, including YOLOv8n, YOLOv8s, YOLOv8m, YOLOv8l, and YOLOv8x. The differences among these versions primarily lie in model complexity, specifically in terms of network depth and parameter count. As the number of residual modules increases progressively, the models gain stronger feature extraction and fusion capabilities, and detection precision improves accordingly, but at the cost of extended processing time [
20]. Among the five versions, YOLOv8n stands out as the most lightweight version with exceptional detection speed, yet its precision is relatively lower. In contrast, the series from YOLOv8s to YOLOv8x shows significant improvements in precision, but the excessive residual structures introduce additional computational burden, leading to prolonged detection cycles. In scenarios with real-time detection requirements, this time delay may pose disadvantages, affecting the response efficiency and practicality of the system. In light of this, this study targets YOLOv8n for specific optimization and proposes a detection algorithm that balances both speed and precision.
YOLOv8 employs a modular design, consisting of backbone network, neck network, and detection head modules.
YOLOv8’s backbone network enhances information processing capability by extracting features from input images and is constructed from convolutional block, C2f modules, and an SPPF module. The convolutional block includes standard convolution (SC), batch normalization (BN), and a SiLU activation function [
21]. Among them, SC is utilized to capture local image features, thereby improving the capability to handle small target objects; BN improves information processing capability through normalization, strengthening the stability of the network structure; and the SiLU activation function strengthens the system’s generalization performance in complex detection environments through nonlinear operations. In the C2f module, the input feature map first undergoes a 1 × 1 convolution to align the channel dimension and perform preliminary feature projection, aiming to compress computational dimensions. Subsequently, the processed feature map is partitioned into two equal channel-wise branches to construct a multi-path information flow. One part of the split feature map is directly transmitted as a shortcut branch to the end of the module, while the other part serves as the main branch and is fed into a series composed of several bottleneck units connected in sequence. Each bottleneck unit contains two 1 × 1 convolutional layers and one 3 × 3 depthwise convolutional layer, equipped with residual connections, while caching the input features of each unit in the bottleneck series. The deep features processed through all bottleneck units are concatenated along the channel dimension with the original shallow features from the shortcut branch and the intermediate layer features cached in the bottleneck series, achieving dense fusion of features from shallow to deep layers. Finally, the concatenated composite feature map undergoes channel integration and dimensionality reduction through a 1 × 1 convolutional layer to produce the output. Furthermore, SPPF employs three MaxPool layers for serial computation, replacing large pooling kernels with a series of small pooling kernels, followed by residual connections and a concatenated operation. Unlike the SPP module, which introduces parallel max-pooling kernels at the network tail, SPPF preserves the ability to capture multi-scale features while lowering computational cost and accelerating training [
22].
In YOLOv8, the neck network lies between the backbone and the detection head and adopts a hybrid architecture combining a feature pyramid network (FPN) with a path aggregation network (PANet). Its primary role is to perform multi-scale feature fusion. FPN up-samples deep feature maps and fuses them with shallow feature maps, enabling shallow features to also possess strong semantic information [
23]. Building upon FPN, PANet adds a bottom-up pathway to transmit shallow feature information to deep layers, enhancing the perception of location and details in deep features. By combining top-down and bottom-up information processing pathways, feature fusion is conducted for detection targets of different sizes, strengthening detection robustness across different object scales.
The detection head of YOLOv8 adopts a decoupled design and operates under an anchor-free paradigm. The decoupled head design independently handles classification and regression problems, using separate network branches to address each, which improves task-specific learning and mitigates feature interference when detecting different targets [
24]. The traditional anchor box mechanism used in the YOLO series is replaced with a method that directly predicts bounding boxes, simplifying the design, reducing redundant computations, and improving performance when handling dense small targets.
3. Enhanced YOLOv8 Algorithm
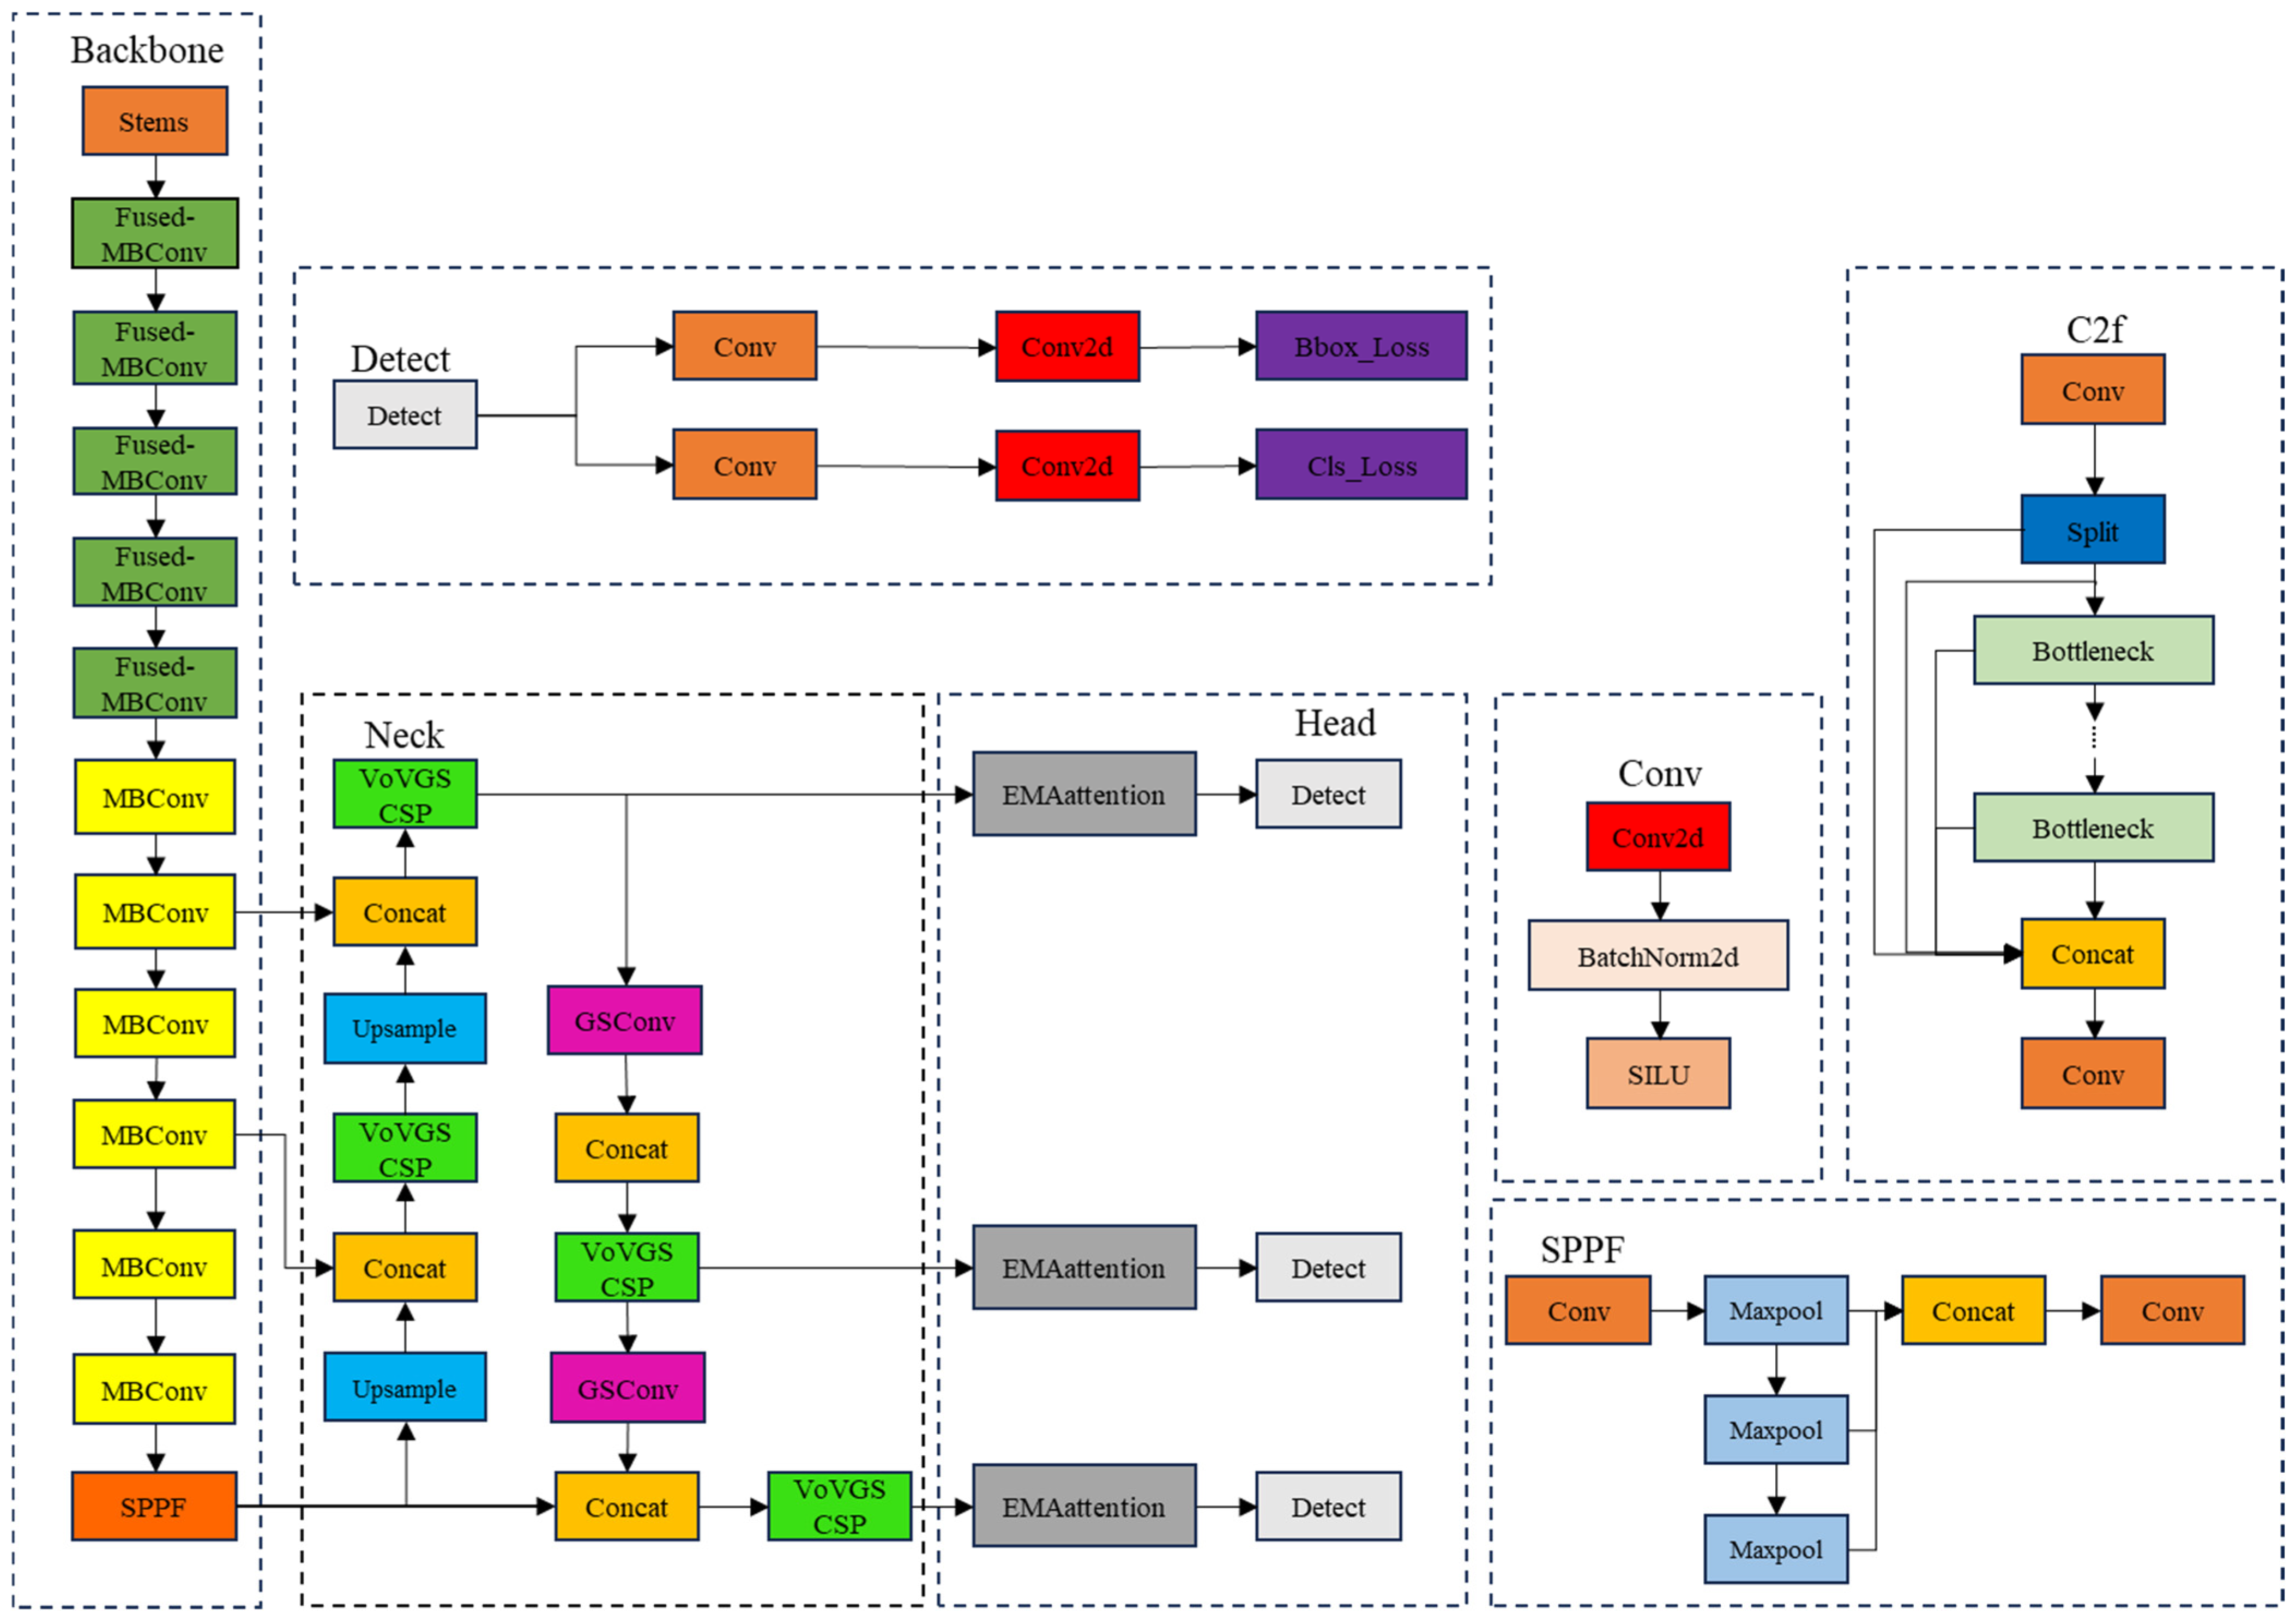
Aiming at practical foreign object detection on transmission lines, YOLOv8 is improved from multiple aspects to jointly boost precision and reduce complexity, including the adoption of EfficientNetV2, Slim-neck, EMA, and MPDIoU-based loss optimization. Firstly, the backbone network is replaced by EfficientNetV2 to achieve higher precision, accelerate model training speed, improve detection performance, and achieve model lightweighting [
25]. Secondly, the neck feature fusion network is restructured by introducing Slim-neck to strengthens feature extraction and fusion. Then, the EMA is introduced to enhance the detection performance on multi-scale targets. Furthermore, to ensure higher precision and stability in the bounding box regression task, MPDIoU loss is adopted in place of the original loss function. This loss directly minimizes the Euclidean distances between the corresponding top-left and bottom-right corners of the predicted and ground-truth boxes, and employs a normalized formulation, enabling more comprehensive and efficient optimization of the regression process.
Figure 1 illustrates the enhanced YOLOv8 architecture.
3.1. EfficientNetV2
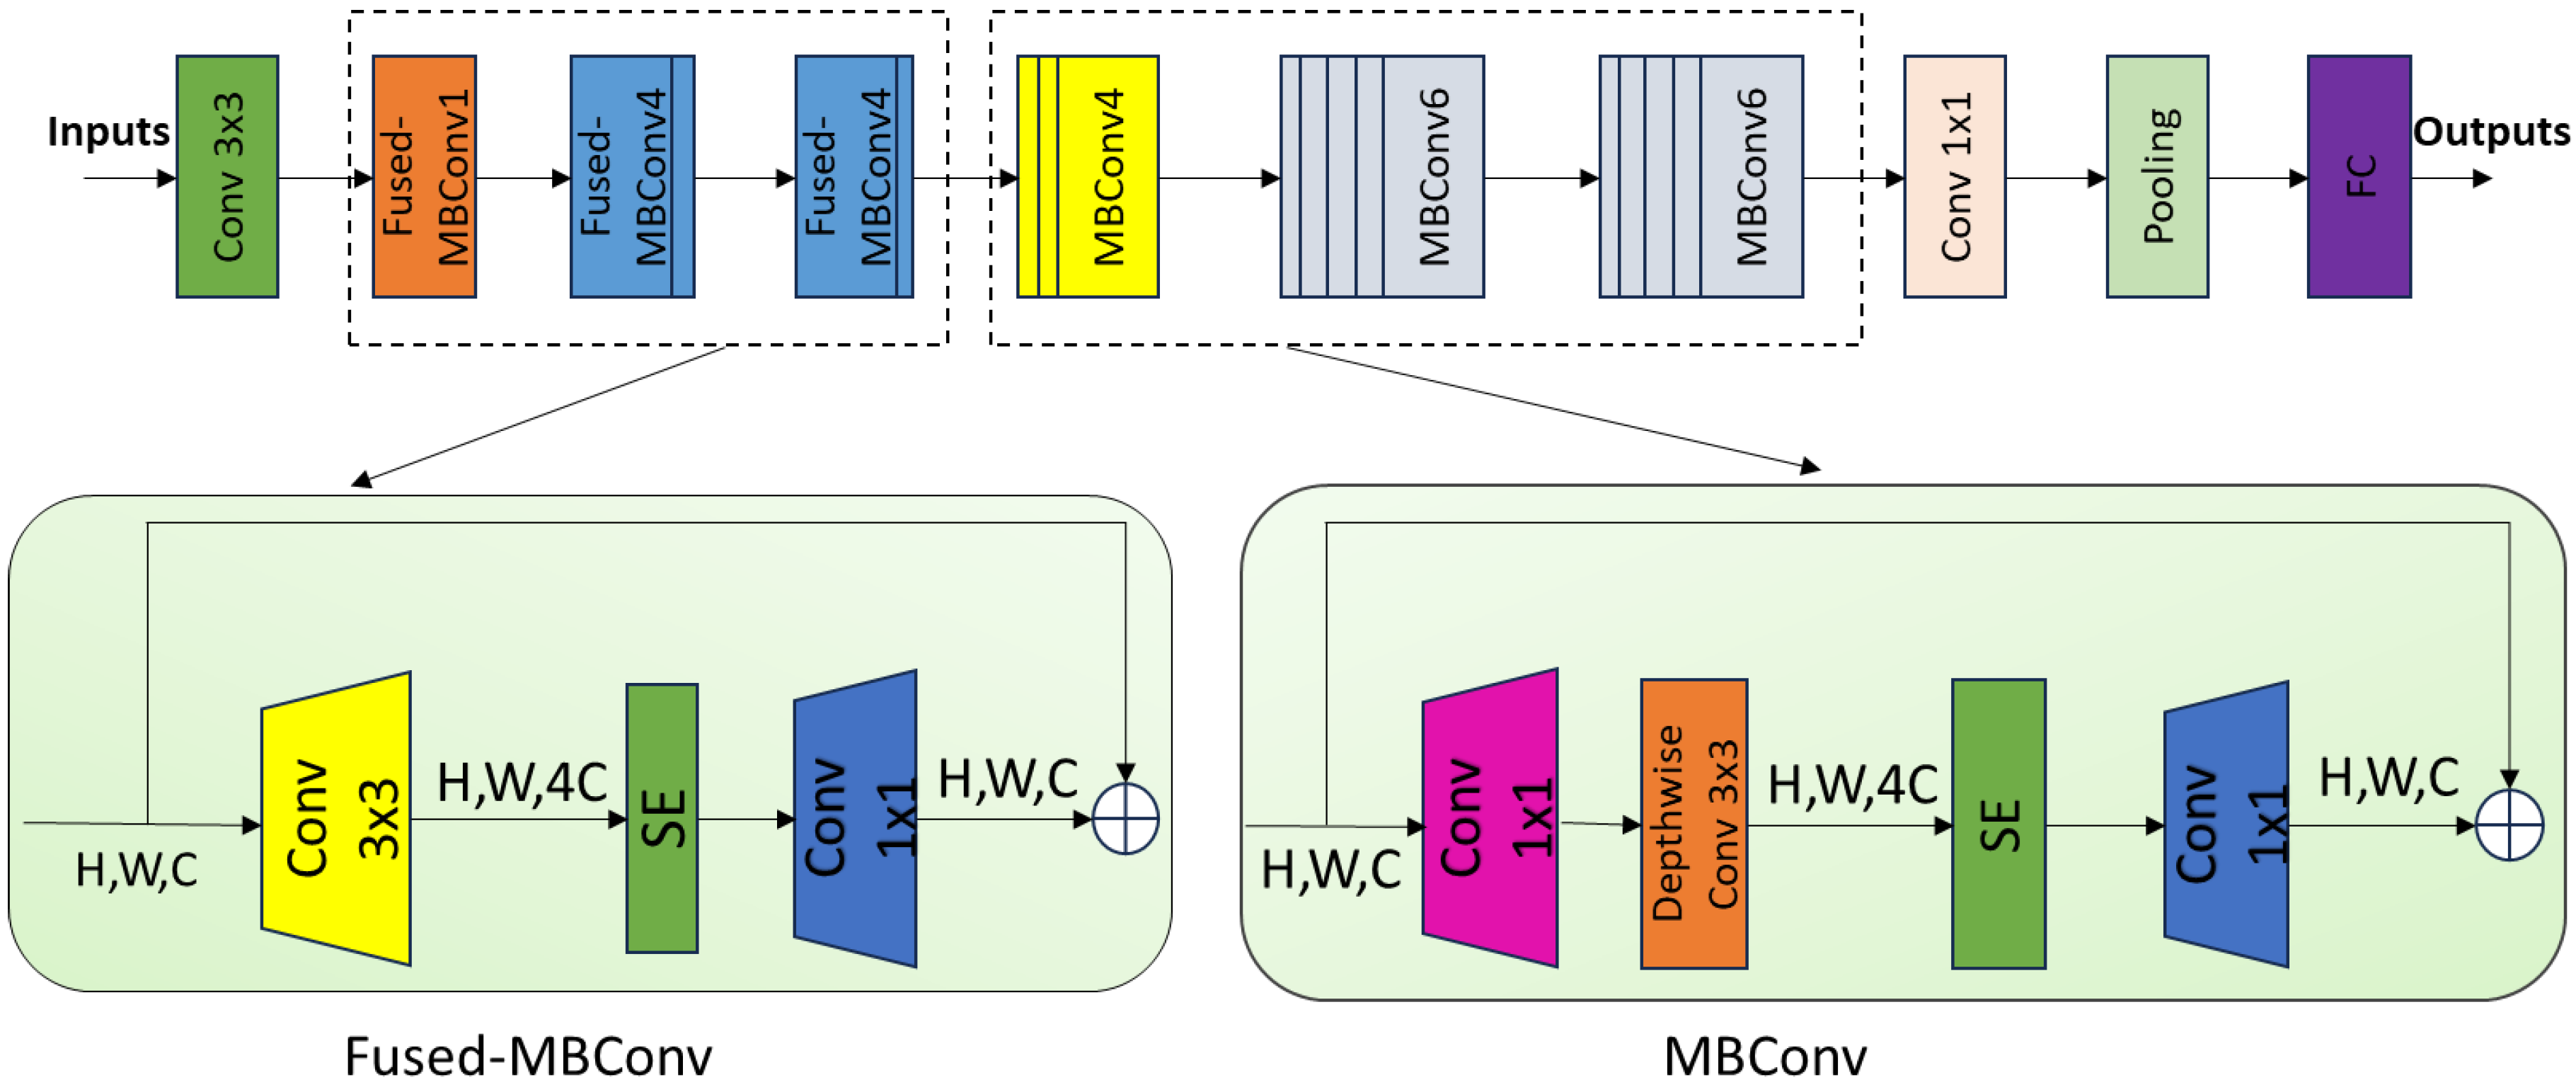
EfficientNetV2 is a significant upgrade by Google Brain in 2021 over EfficientNetV1. It introduces training-aware neural architecture search (NAS), Fused-MBConv modules, and employs an improved progressive learning method. The synergistic effect of these three enhancements leads to further performance improvement. EfficientNetV1 employs a uniform scaling rule, equally increasing network depth, parameter count, and input image size. However, research has found that uniformly scaling each stage is not an optimal strategy, as different stages contribute unequally to training speed and parameter efficiency, leading to resource wastage after uniform scaling. In contrast, EfficientNetV2 adopts a non-uniform scaling strategy. In the early training stages, it uses small images and weak regularization to enable the model to quickly learn simple features. Subsequently, it progressively increases the image size while simultaneously strengthening the regularization intensity. In the later stages of network training, more network layers are added, and the maximum input image size is constrained. This approach increases the model’s parameters while avoiding memory consumption and speed degradation caused by excessively large images [
26]. Such dynamic adjustments effectively accelerate training speed and reduce precision loss. EfficientNetV2 is illustrated in
Figure 2.
To decrease model complexity while improving detection precision, this study selects EfficientNetV2-B0 as the backbone network, which strikes a good balance between model performance, computational performance, and feasibility for engineering deployment. Its lightweight design meets accurate feature extraction of transmission lines foreign objects while maintaining stable and efficient long-term system operation.
3.2. Slim-Neck
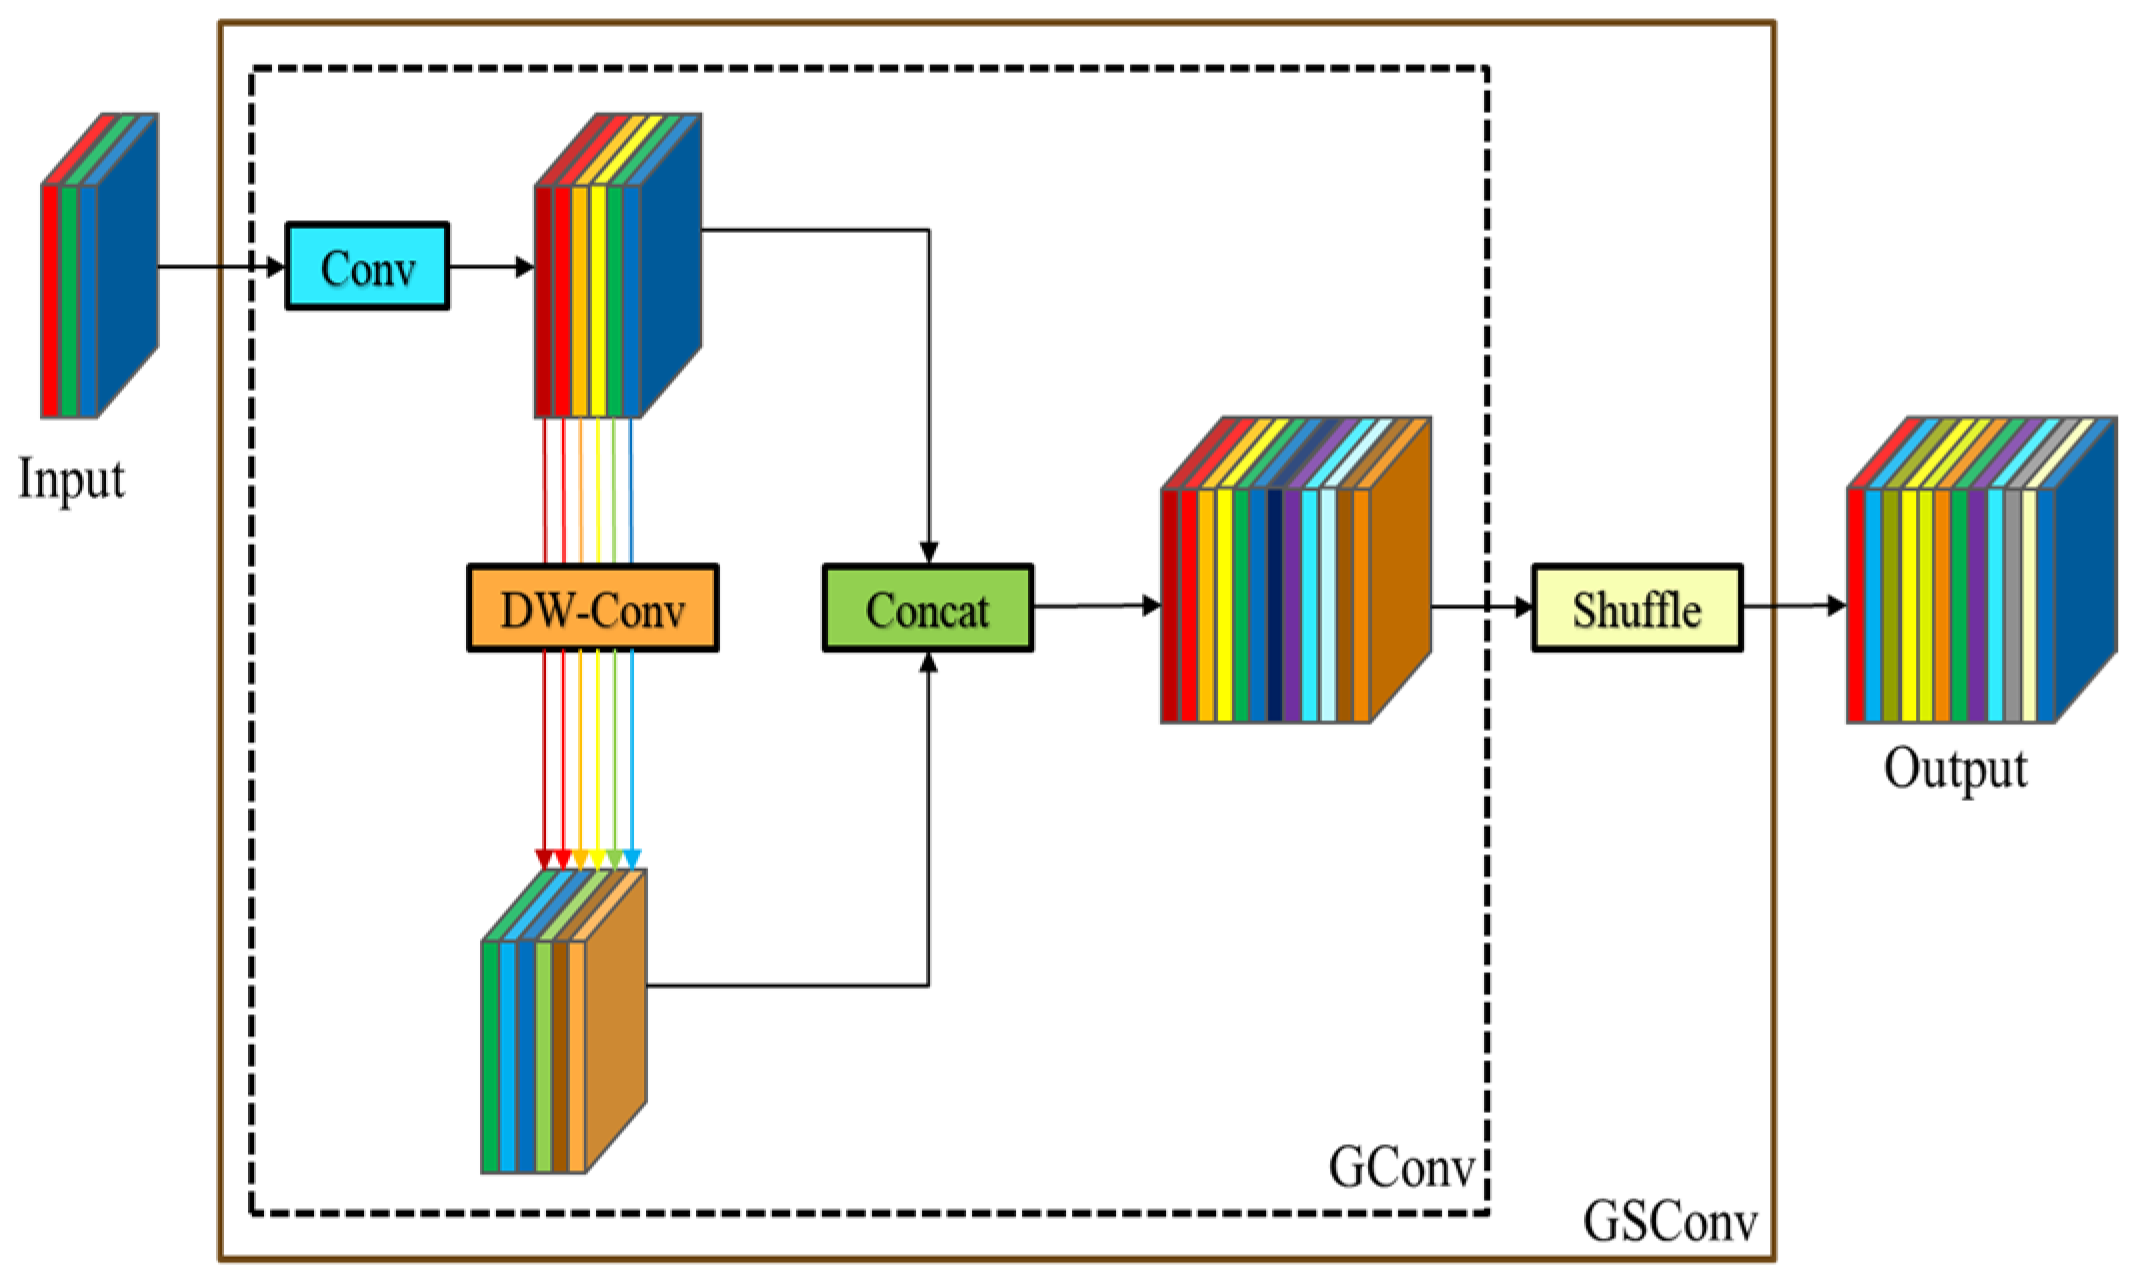
Although enhanced detection models improve the precision of foreign object detection on transmission lines, they also impose greater demands on computational resources. Although lightweight architectures built with extensive depthwise separable convolution (DSConv) layers can improve computational speed, their detection precision fails to meet the required standards. Accordingly, this study incorporates Slim-neck to redesign the YOLOv8 neck feature fusion network, reducing computational burden while enhancing detection precision. Slim-neck integrates GSConv with VoV-GSCSP modules. The GSConv module first applies standard convolutional downsampling to the input, reducing the output channels by half. The result is then processed through DSConv, further halving the output channels. The outputs from both steps are concatenated, followed by a channel shuffle operation [
27]. The architectures of GSConv is illustrated in
Figure 3.
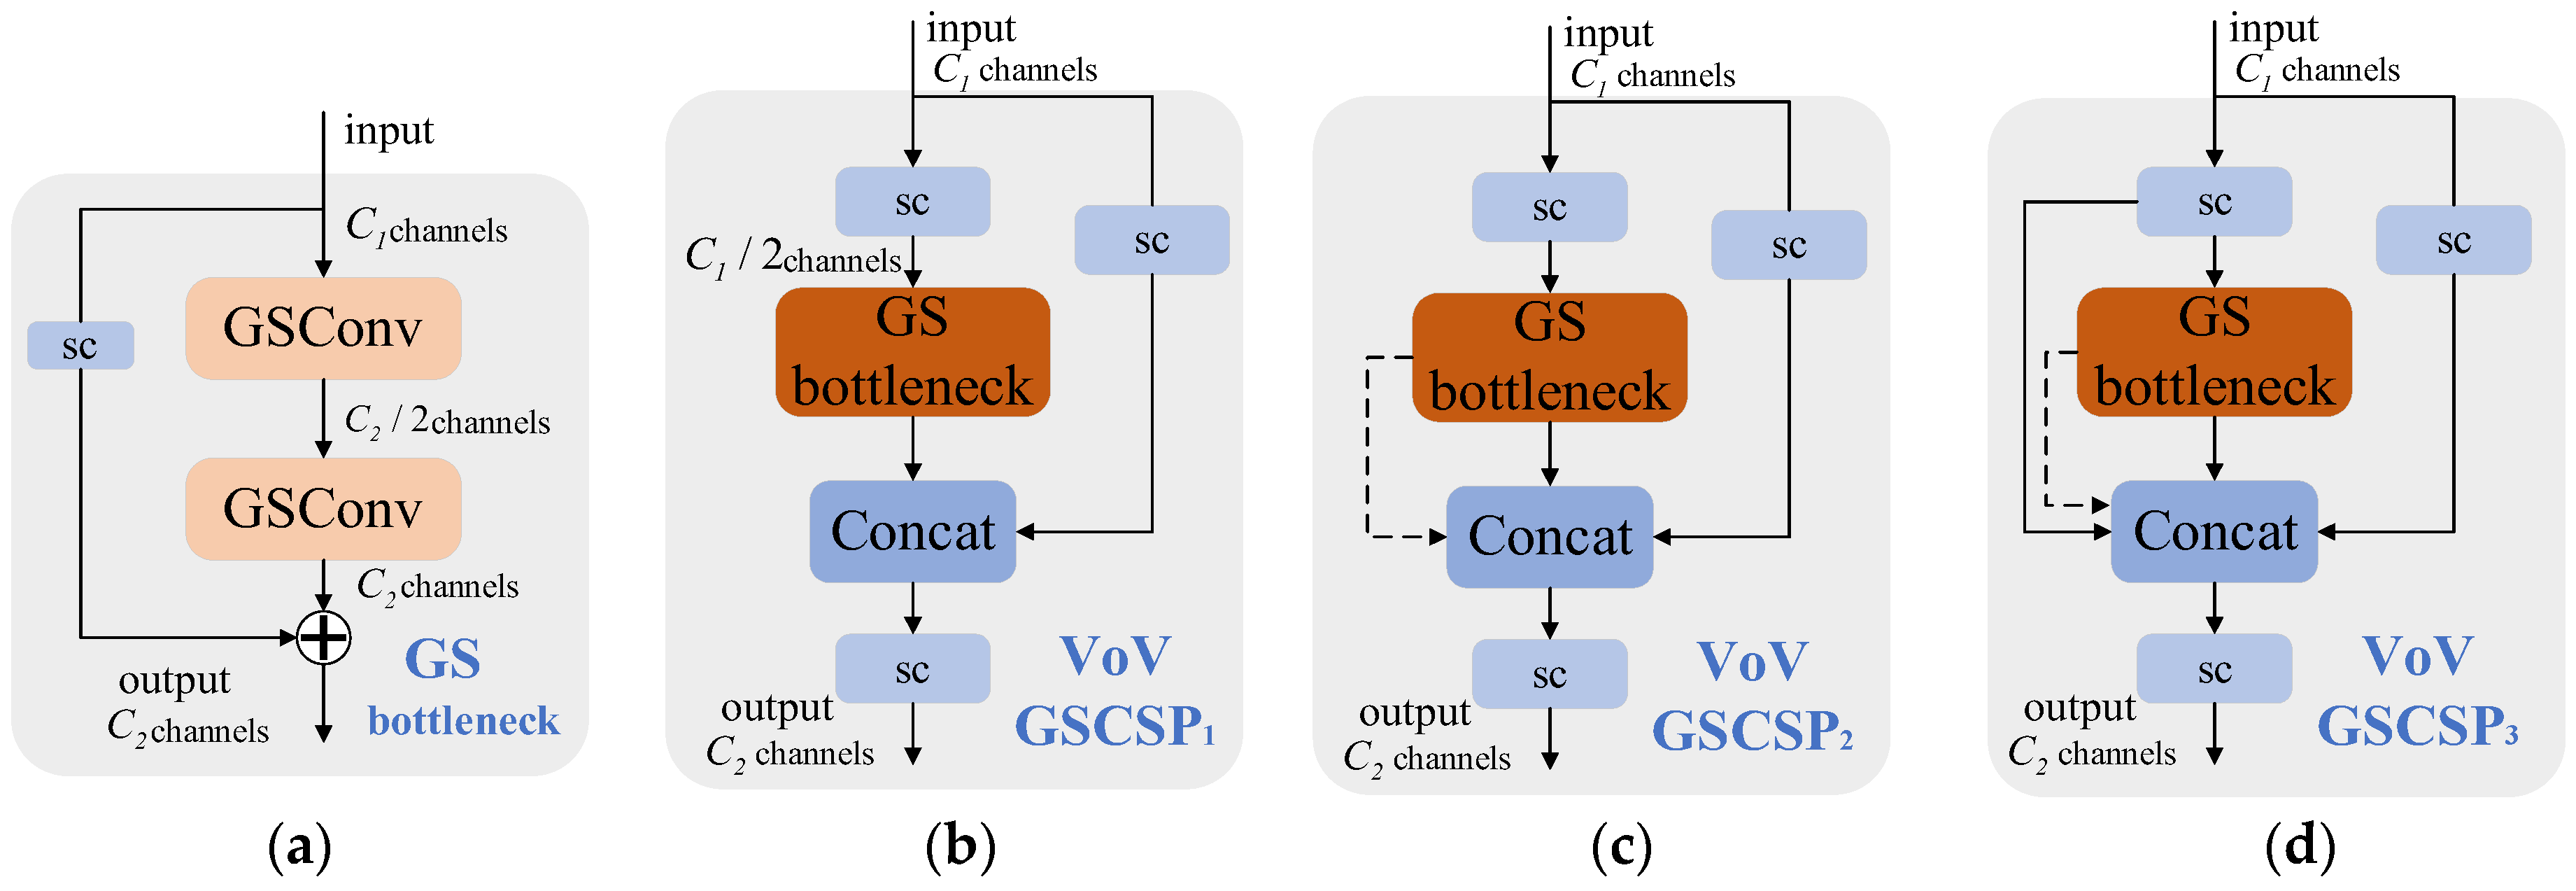
Figure 4b–d show the three design structures for VoV-GSCSP, respectively.
Figure 4b is simple and allows faster inference, while
Figure 4c,d have a higher feature reuse rate. Specifically, VoV-GSCSP1 employs the most straightforward single-path configuration. The input feature map is processed directly through a GS bottleneck (GSBottleneck) module constructed with GSConv, followed by feature fusion with the original input. VoV-GSCSP2 incorporates a deeper feature reuse mechanism. It adds extra convolutional layers or connections either within or around the GSBottleneck module, forming a more densely interactive feature pathway. Building upon VoV-GSCSP2, VoV-GSCSP3 adopts a multi-path aggregation strategy analogous to residual or dense connections. This constitutes the most complex structure, potentially involving multiple GSBottleneck branches arranged in parallel or series. In conclusion, VoV-GSCSP, as a one-shot cross-stage aggregator, employs a dual-path structure to process input features: one path processes features through the GSBottleneck module composed of GSConv, while the other path applies simple Conv-based processing or directly retains the input. Finally, features from both paths are fused, effectively reducing computational load and model depth while improving feature utilization and maintaining detection precision.
3.3. EMA
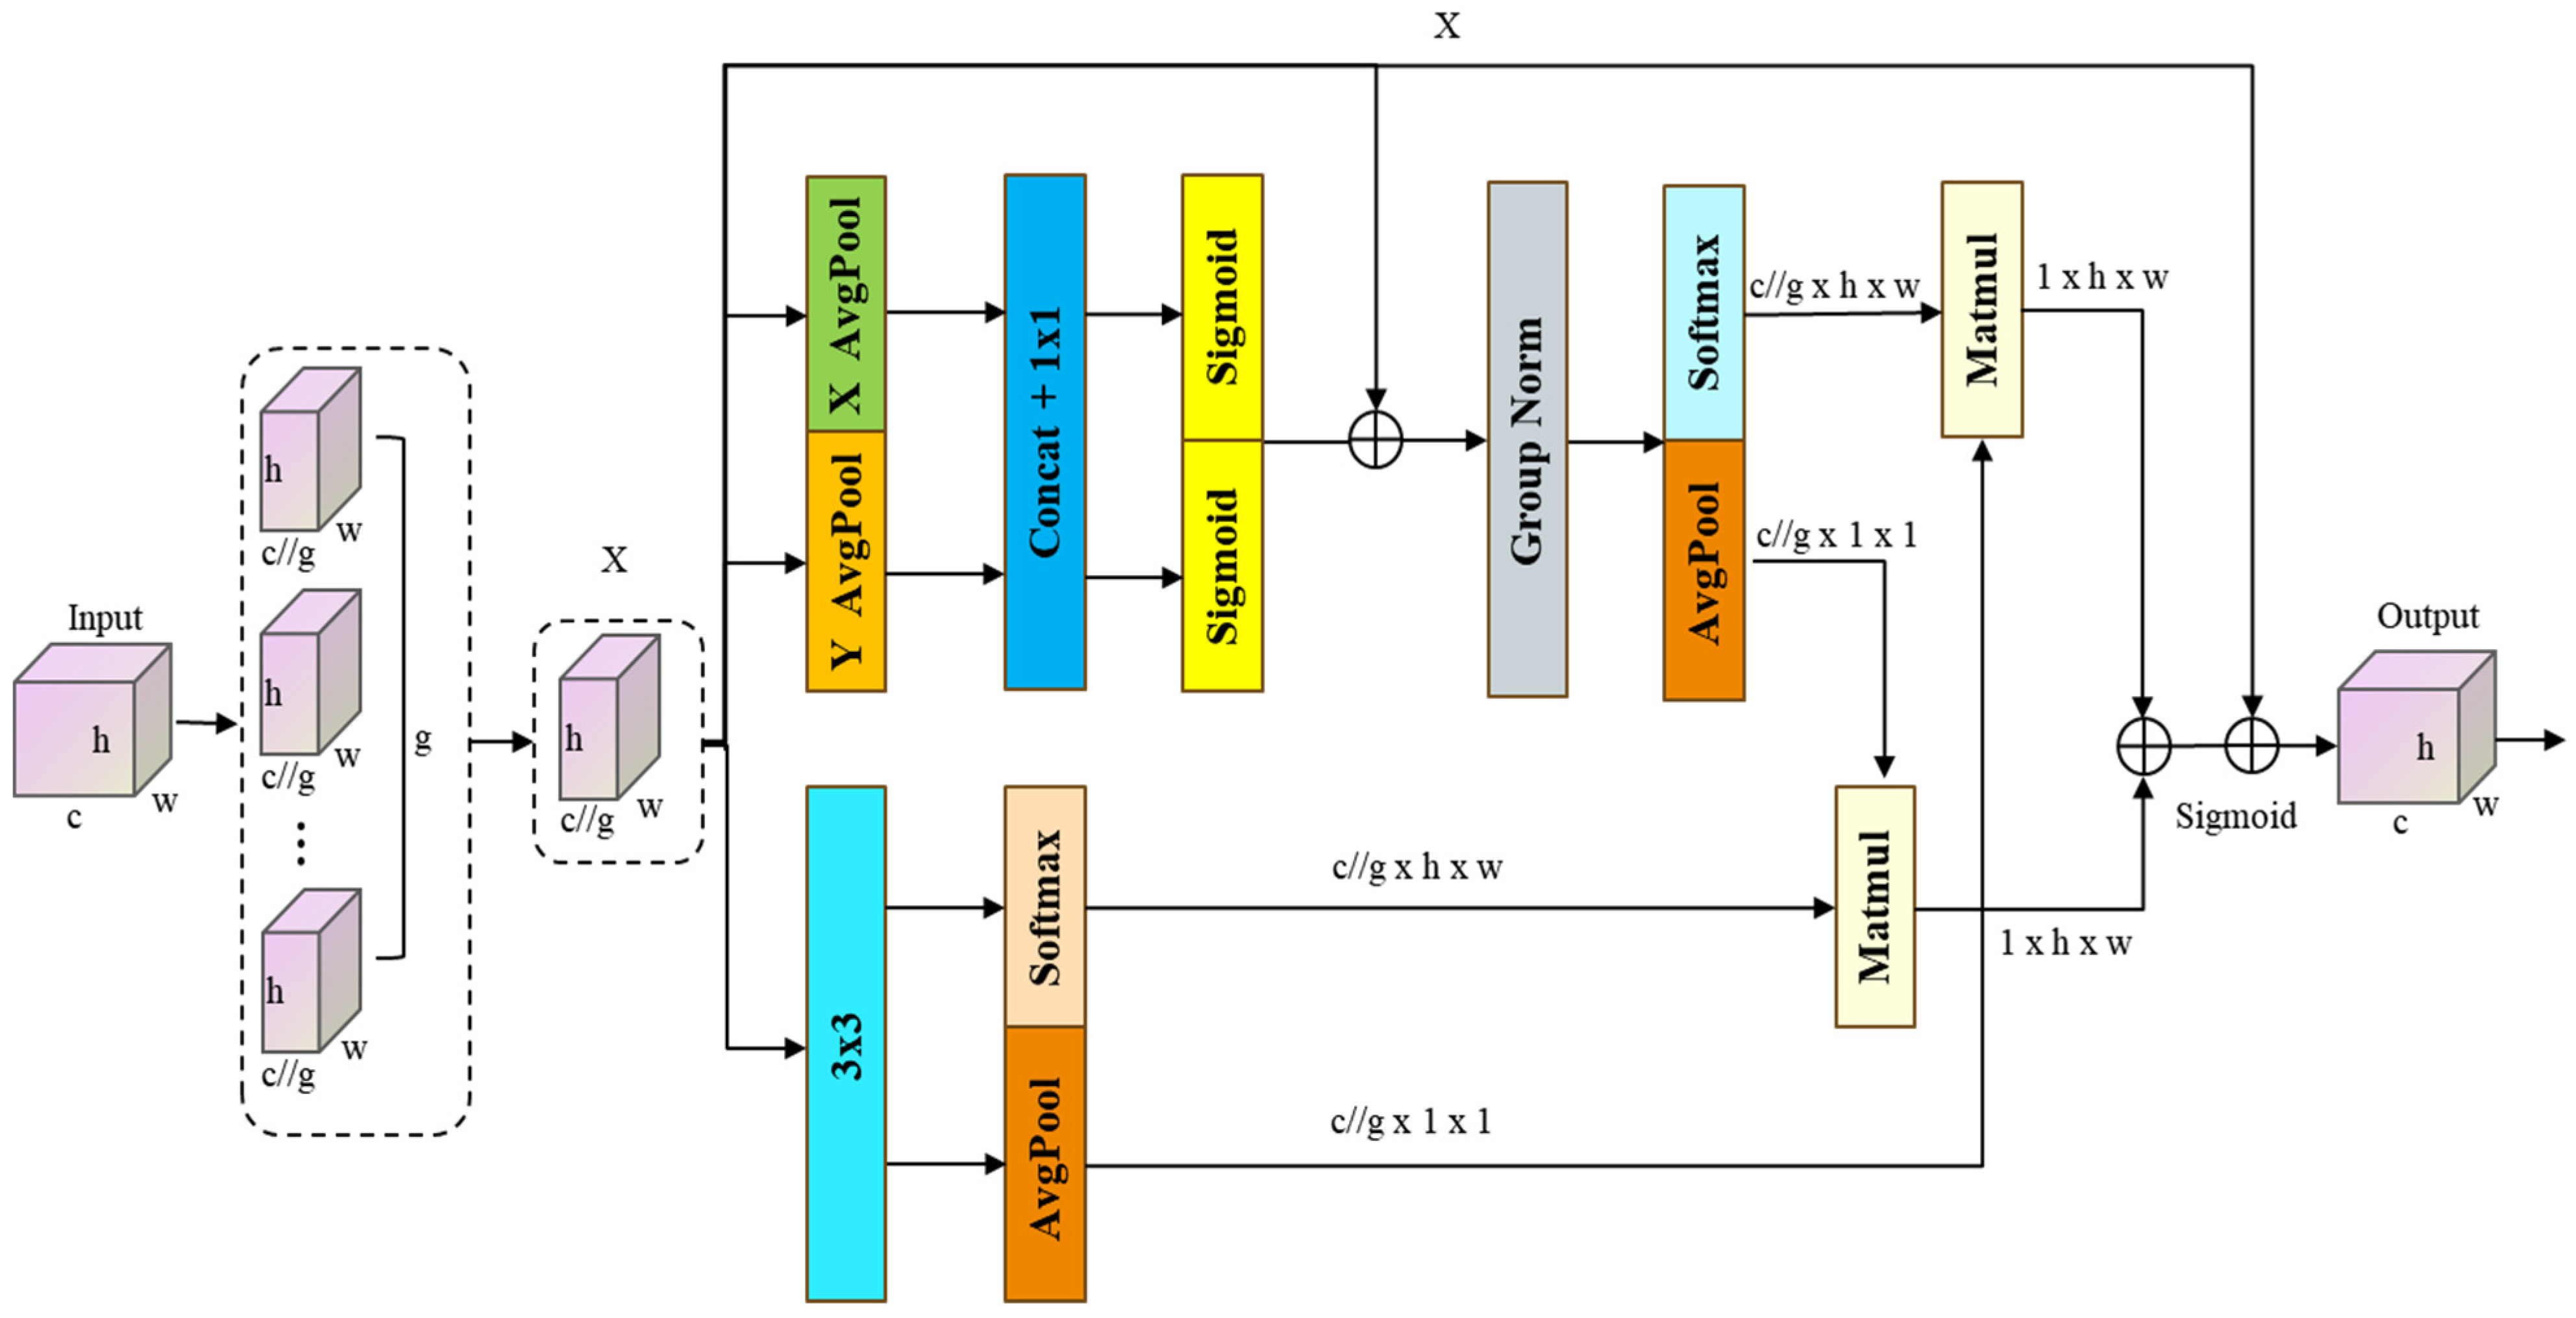
EMA is an efficient multi-scale attention mechanism that improves multi-scale feature awareness and strengthens its feature extraction capability through unique structural optimization, while reducing computational overhead. The core design of EMA includes multi-scale feature capture and cross-dimensional interaction. First, the input feature map is partitioned into multiple channel-wise subgroups, each maintaining spatial integrity to ensure feature diversity. This design prevents the information degradation typically caused by dimensionality reduction in conventional channel attention mechanisms, significantly improving feature utilization. Second, the grouped features are fed into two parallel branches. The global information branch extracts long-range dependencies through 1 × 1 convolutions and adaptive pooling to generate spatial attention weights that calibrate channel importance. The local detail branch captures local spatial features via 3 × 3 convolutions to enhance detail perception. The outputs of the two branches interact across dimensions through matrix multiplication, fusing global semantics with local details [
28]. Then, pixel-level pairwise relationships between features from different branches are computed using matrix dot products to generate an attention weight map. This step dynamically adjusts feature responses through Softmax normalization and Sigmoid activation, highlighting key regions and achieving cross-dimensional interaction and weight generation. Finally, the original features are reweighted through element-wise multiplication with the attention weights to obtain reconstructed representations. The entire process avoids pooling or dimensionality reduction operations, preserving spatial resolution to the greatest extent. EMA captures both global context and local details simultaneously through its parallel branch structure, effectively enhancing the model’s suitability to scenes with drastic scale variations. Compared to traditional attention mechanisms, EMA reduces the number of parameters through channel grouping, avoids information loss from dimensionality compression, and effectively suppresses complex background interference through its cross-dimensional interaction mechanism.
Figure 5 illustrates the architecture of EMA.
3.4. Loss Function Improvement
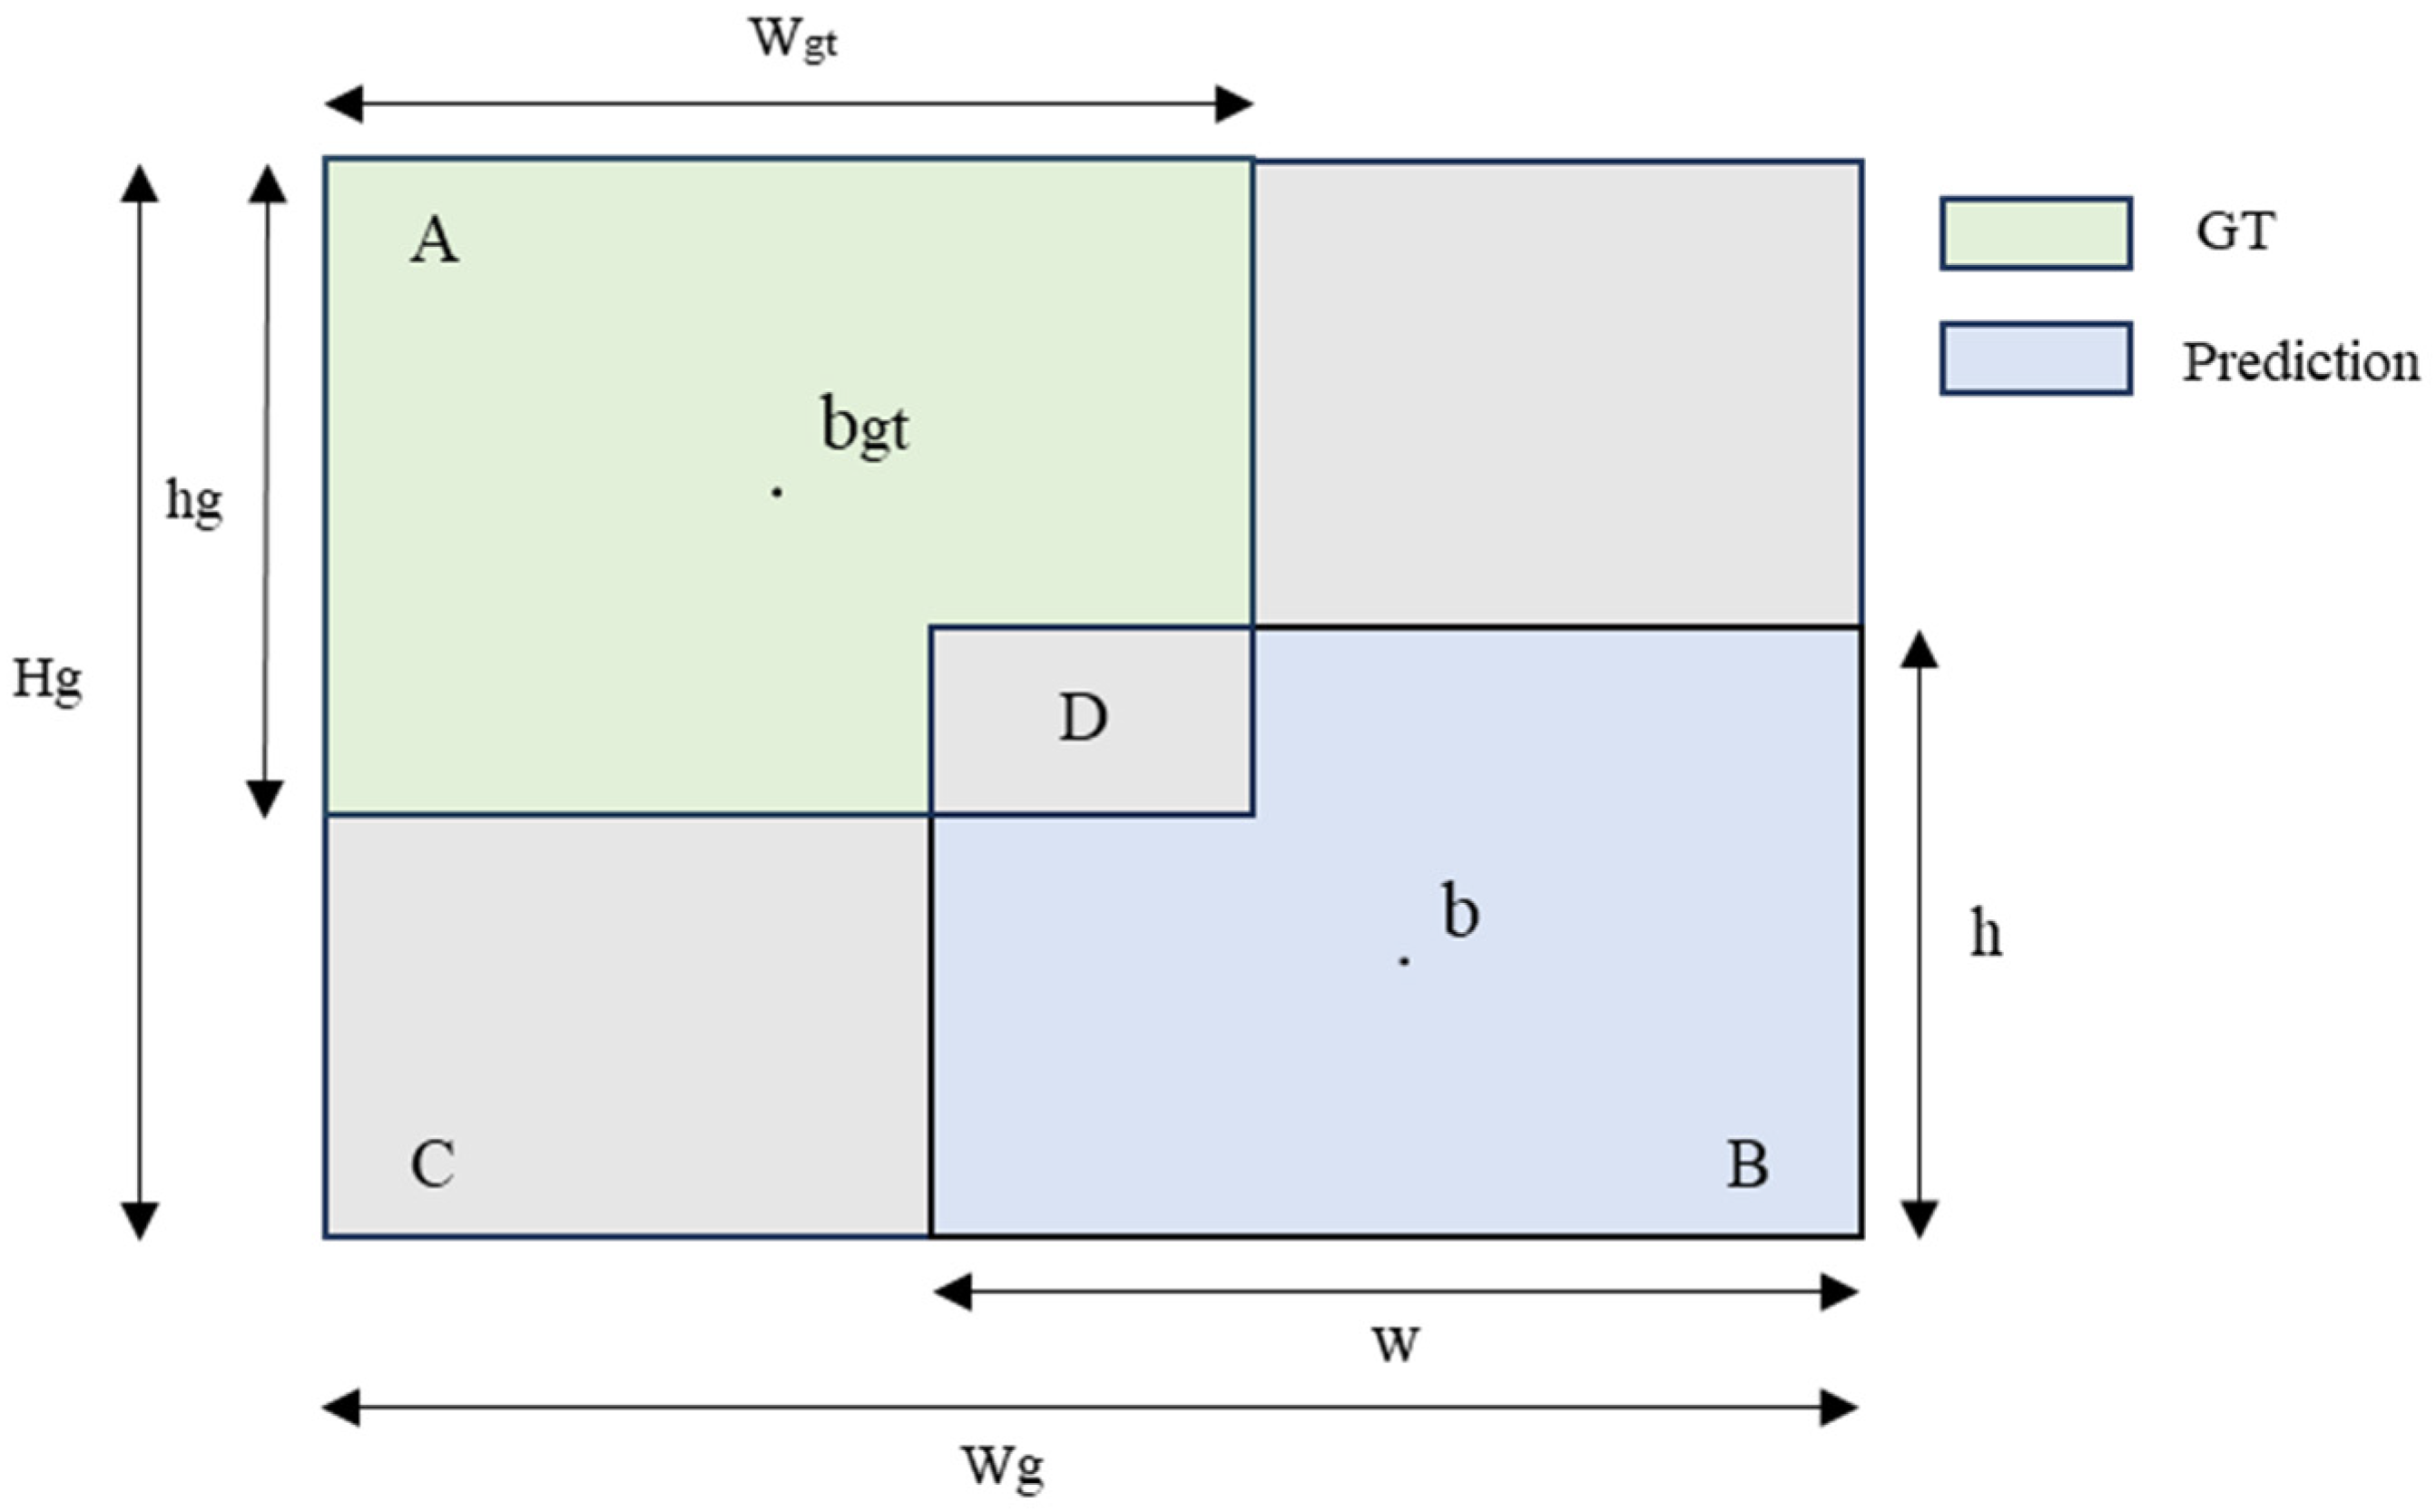
The loss function for object detection generally includes two components, namely, classification loss and bounding box regression loss. The classification loss aims to determine the category of the target, addressing class imbalance by using varifocal loss and focusing on high-quality samples. The bounding box regression loss combines CIoU with distribution focal loss (DFL) to predict the target’s location and size. Specifically, CIoU computes the regression penalty by jointly accounting for the overlap of the predicted and ground-truth bounding boxes, the distance between their center points, and the consistency of their aspect ratios. DFL focuses on the distribution near the label values to improve localization precision [
29]. The detailed formulation of CIoU is as follows:
where IoU quantifies the overlap between the predicted bounding box and the ground-truth bounding box.
denotes the squared Euclidean distance between the centers of the predicted bounding box and the ground-truth bounding box.
c represents the diagonal length of the smallest enclosing rectangle covering both boxes, which normalizes the center distance to make the loss function scale-invariant.
α is a dynamic weighting coefficient that balances the aspect ratio loss, and
v measures the aspect ratio consistency between the predicted and ground-truth bounding boxes. The calculations for
α and
v are given below:
where
wgt and
hgt denote the length and width of the ground-truth bounding box, respectively, whereas
w and
h correspond to the length and width of the predicted bounding box. The CIoU is depicted in
Figure 6.
In the CIoU loss function, the parameter
v, used to measure aspect ratio consistency, is not calculated by directly comparing the absolute differences in length and width values. Instead, it reflects their relative proportional differences by comparing the arctangent of the aspect ratios of the predicted and the ground-truth bounding box. When there is a significant discrepancy in length and width between the predicted and ground-truth bounding boxes, the value of
v is small. This can cause the model to prioritize similarity in aspect ratio during optimization, leading to larger errors in accurately regressing the actual dimensions [
30]. Furthermore, during the early training stages, when the length and width of the predicted bounding boxes are small, the computed gradients can become abnormally large, leading to gradient explosion. The fundamental reason is that the CIoU loss lacks a mechanism to distinguish the difficulty of samples, causing the model to be dominated by a large number of simple samples when calculating the loss. This makes it difficult for the model to compute the loss for complex samples, ultimately limiting the improvement of model performance. Additionally, if the center points of the predicted and ground-truth bounding boxes coincide exactly, the term
, representing the squared distance between the centers in the CIoU loss, equals zero. This causes the CIoU loss to lose its constraint on the center point distance, thereby affecting the model’s localization precision.
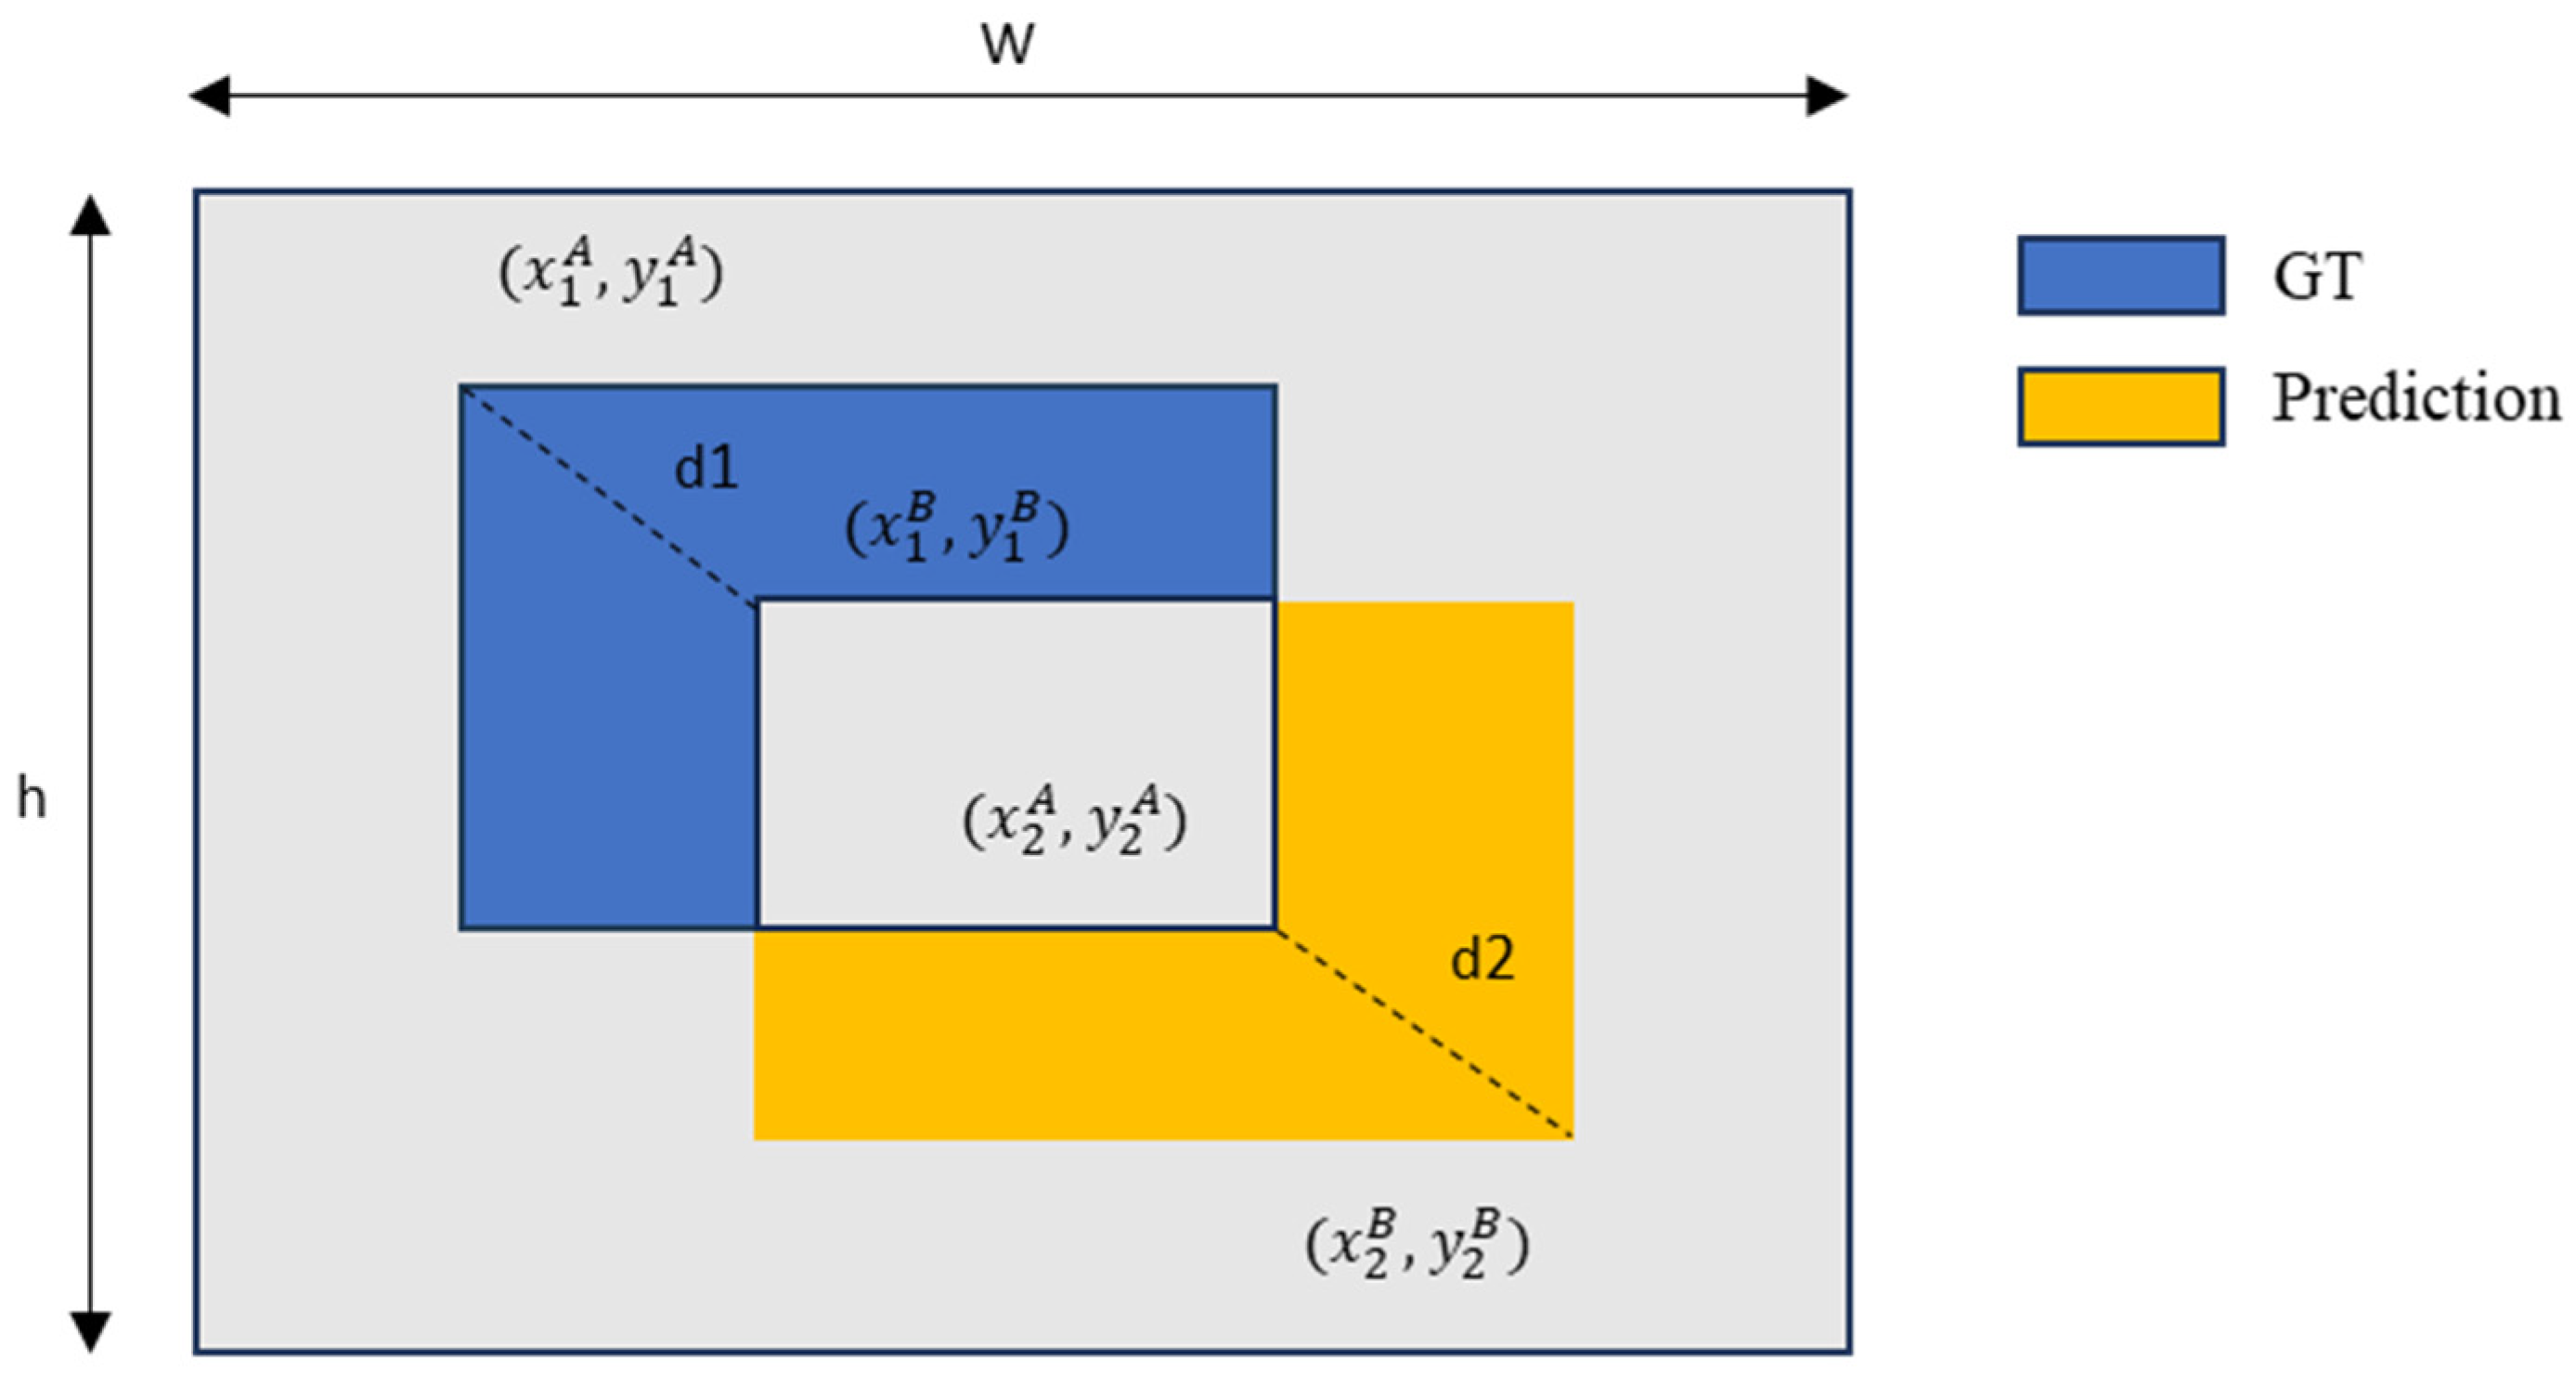
In bounding box regression, MPDIoU is employed to replace CIoU for localization loss computation, as CIoU has limited capability in differentiating predicted boxes that share the same aspect ratio but vary in scale. By directly minimizing the Euclidean distance between the corresponding top-left and bottom-right vertices of the predicted and ground-truth bounding boxes, MPDIoU effectively resolves optimization problems encountered by traditional loss functions in specific scenarios [
31]. Meanwhile, by combining its normalized form with IoU to construct the loss function, the bounding box regression process can be optimized more comprehensively and efficiently, improving the precision of target localization and shape characterization. MPDIoU is depicted in
Figure 7, and its computation can be expressed as follows:
Here, A and B correspond to the ground-truth bounding box and the predicted bounding box. Additionally, the coordinates of the top-left and bottom-right corners of box A are (x1A, y1A) and (x2A, y2A), while those of box are (x1B, y1B) and (x2B, y2B). Moreover, d1 and d2 are the distances between the top-left corners and the bottom-right corners of boxes A and B, respectively.