Article

A Feature Selection Method for Yarn Quality Prediction Based on SHAP Interpretation

1
School of Light Industry Technology and Engineering, Henan Vocational College of Light Industry, Zhengzhou 455002, China
2
School of Computer and Communication Engineering, Zhengzhou University of Light Industry, Zhengzhou 455002, China
*
Authors to whom correspondence should be addressed.
Algorithms 2026, 19(4), 266; https://doi.org/10.3390/a19040266
Submission received: 24 January 2026 / Revised: 24 March 2026 / Accepted: 24 March 2026 / Published: 1 April 2026

Abstract

This study developed an interpretable framework, RFE-SHAP, designed for yarn quality prediction. It integrates Recursive Feature Elimination (RFE) with SHapley Additive exPlanations (SHAP) theory to refine feature selection and mitigate data redundancy in small-sample environments. With Support Vector Regression (SVR) serving as the foundational evaluator, the RFE process iteratively identifies critical variables. Distinct from conventional methods, our approach employs SHAP values to quantify both the primary effects of individual features and the complex synergistic interactions among variables. This yields a transparent and intuitive strategy for identifying optimal feature subsets for two key quality indicators: yarn strength and hairiness H-value. To assess performance, a comparative analysis was performed between the traditional SVR-RFE method and the proposed RFE-SHAP method, using both as inputs for a Back-Propagation Artificial Neural Network (BP-ANN). The experimental results based on authentic production data demonstrate that the RFE-SHAP-BP model significantly enhances prediction reliability. Notably, compared to the baseline SVR-RFE-BP model, the proposed approach reduced the Mean Absolute Percentage Error (MAPE) by 0.73 and 1.01 percentage points for yarn strength and hairiness H-value, respectively. The final MAPE values reached 2.10% and 2.78%, confirming the model’s superior precision. These findings indicate that the RFE-SHAP method is highly feasible and effectively elevates prediction performance in data-limited industrial scenarios.

1. Introduction

Yarn quality prediction empowers textile manufacturers to forecast finished yarn attributes by analyzing raw material properties, intermediate product parameters, and equipment settings. By effectively eliminating the need for conventional trial-spinning, this approach minimizes raw cotton waste and labor expenditures while optimizing overall production efficiency [1,2]. Crucially, in the absence of an accurate prediction model, textile plants must rely on costly “trial and error” methods. Improper evaluation of yarn quality beforehand often leads to mismatched cotton blending schemes and suboptimal machine settings, which can result in substantial material waste, high rejection rates, and severe economic losses for the enterprise. Extensive research both domestically and internationally has sought to refine yarn quality forecasting [3,4,5,6,7], yet a consensus on the fundamental barriers to practical model application remains elusive. Existing literature largely focuses on hybrid frameworks to bolster predictive precision. For instance, the integration of artificial neural networks with fuzzy expert systems has demonstrated high precision in ring spinning quality assessment [8]. To address small-sample constraints, researchers have successfully utilized particle swarm optimization to fine-tune hyperparameters within Support Vector Regression (SVR) models, yielding robust adaptability [9]. Further comparative studies have scrutinized the performance of Random Forests and Multilayer Perceptrons in data-limited environments [10]. Additionally, Generalized Regression Neural Networks have been identified as superior alternatives to standard multilayer architectures in terms of both training velocity and precision for predicting yarn unevenness [11]. However, it is important to note that while these modern machine learning approaches offer significant improvements, traditional yarn quality prediction in many industrial settings still heavily relies on the subjective experience of technicians or simple linear statistical correlations. These traditional methods often fail to capture the complex, non-linear, and multi-dimensional interactions inherent in the textile production process, leading to inconsistent results. Given the inherent complexity of the yarn production process, high-dimensional data—while expanding the model’s search space—often introduces redundant features that contribute marginally to predictive power. In scenarios with limited training samples, such excessive dimensionality can manifest as noise, interfering with the learning process and compromising overall performance. Consequently, feature selection has emerged as a critical stage for filtering irrelevant variables and enhancing model robustness. To address this, an attention-based cotton yarn quality model was developed in [12], directing the predictive engine toward inputs with the most substantial impact on final quality. This mechanism not only assists personnel in optimizing cotton blending and processing parameters but also significantly bolsters industrial efficiency. Furthermore, the hybrid SVR-RFE method, which integrates Recursive Feature Elimination with Support Vector Regression, has been successfully employed to refine data inputs for predictive modeling [13]. Comparative studies have demonstrated that SVR-RFE outperforms Grey Relation Analysis in identifying optimal feature subsets for yarn strength, unevenness, and strength CV [14]. In a related context, reference [15] utilized grey correlation analysis to establish that fiber properties, system stability, and equipment condition remain the three primary factors correlated with fluctuations in spinning quality.
However, for these advanced methods to be successfully adopted in industrial jurisdictions, model interpretability is just as critical as prediction precision. Production engineers require a transparent understanding of how specific raw material properties or machine parameters influence the final product to make informed adjustments on the factory floor. Although some progress has been made in the research on feature selection algorithms, there are still some limitations. This is because the synergistic effect between multiple features is not considered, which may lead to the inability to effectively remove weakly correlated features and identify valuable features.
To further refine the feature selection process, this study introduces SHapley Additive exPlanations (SHAP) [16] into the SVR-RFE framework, proposing an interpretable feature selection method specifically tailored for yarn quality prediction. By accounting for all possible feature permutations and their synergistic effects, our approach quantifies both the main effects of individual features and their mutual interactions. This provides a more transparent selection strategy, enabling the identification of optimal feature subsets that most significantly influence yarn strength and the hairiness H-value. Finally, these optimized subsets are integrated with a neural network to establish robust prediction models, achieving high-precision yarn quality forecasting even within small-sample industrial environments.

2. Algorithm Description

2.1. Recursive Feature Elimination Algorithm

There are three common forms of feature selection: filtering, wrapping, and embedding methods. Filters select features based on the degree of correlation between the original features and dependent variables [17]. The embedding rules determine the importance of features during model training. Among them, recursive feature elimination is a wrapper. The specific implementation of wrappers can be divided into sequential selection and heuristic searches. The feature recursive elimination algorithm belongs to the backward search of the sequential selection. This is a greedy algorithm for finding the optimal feature subset. Its core idea is to repeatedly build a susceptibility model, eliminate one or several of the most irrelevant features from the results of each run according to the objective function, and then repeat the above process for the remaining features to achieve a method for ranking feature importance [18].

2.2. SVR-RFE

RFE requires the selection of a model as its basis. This model is called the “base model” or “evaluator”. It is used to evaluate the importance of the features. In this study, SVR is used as the evaluator of RFE to construct a feature selection method based on SVR-RFE. SVR-RFE uses the influence of each feature in the feature space on the objective function as the ranking coefficient; that is, it is sorted according to the size of the weight vector ω of each feature on the hyperplane. The larger the weight of the feature, the greater its influence on the objective function and discriminant information, that is, the greater its importance to the hyperplane. In this manner, all features are sorted. SVR-RFE takes all features as the recursive starting point. By setting the step size and the minimum number of retained features, one or several features with the smallest ranking coefficients are eliminated each time to reduce the feature’s dimension. The algorithm then iterates to recursively screen the feature set until the number of features reaches the preset value. For the objective function S d , the change in S d when the ith feature is eliminated is calculated as shown in (1).
Δ S d ( i ) = S d ω i Δ ω i + 2 S d ω i 2 ( Δ ω i ) 2 ,
where ω i is the weight of feature i. According to the change in the objective function, the ranking coefficient of the feature is obtained as shown in (2).
R a n k ( i ) = ( ω i ) 2 ω = i = 1 l σ i y i x i ,

2.3. SHAP

SHAP (SHapley Additive exPlanations) is a game-theoretic approach that assigns each feature an importance value for a particular prediction by calculating its marginal contribution across all possible feature combinations [19]. This ensures a “fair” distribution of the model output among input features through an additive explanation model, as shown in Equation (3)
f ( x ) = ϕ 0 + i = 1 N ϕ i + i < j ϕ i , j ,
where: f ( x ) is the predicted value of the machine learning model for the input sample x, and ϕ 0 is the baseline prediction, usually the average prediction value of the dataset. In practical applications, calculating the exact marginal contributions for all possible feature permutations entails prohibitive computational complexity. To address this, the KernelSHAP algorithm is adopted in this study. Given that the foundational evaluator of our framework is Support Vector Regression (SVR)—a non-tree-based model—KernelSHAP is selected for its superior model-agnostic capabilities. This algorithm transforms the estimation of SHAP values into a weighted linear regression problem by introducing a specialized ‘SHAP Kernel.’ By assigning weights to different feature subsets, KernelSHAP effectively measures the marginal changes in model output when specific features are included or excluded within a linear attribution framework. Consequently, this approach ensures theoretical fairness while enabling rapid and accurate estimation of the contribution degrees of complex spinning process parameters.
Then, the SHAP value of the ith feature of sample x is calculated as shown in (4).
ϕ ( x i ) = ϕ i + x j N x i ϕ i , j ,
where ϕ i is the main effect value of the ith feature of sample x, which indicates the contribution of this feature to the final prediction value when it acts alone. The average marginal contribution of feature x i depends on the weighted average of the marginal contributions of all feature combinations. ϕ i , j is the interaction effect value of the ith feature and the jth feature of sample x, which indicates the pure interactive contribution of the synergy between the features to the model prediction result, which does not include the part of the feature acting independently. The calculation of ϕ i is shown in (5).
ϕ i = S N { x i } | S | ! ( | N | | S | 1 ) ! | N | ! ( f ( S { x i } ) f ( S ) ) ,
where: N is the set of all features, S is the feature subset excluding feature x i , | S | ! ( | N | | S | 1 ) ! | N | ! is the weight coefficient of feature subset S, f ( S ) is the predicted value of the sample obtained using only feature subset S, f ( S { x i } ) is the predicted value of the model after subset S is added with feature x i , and f ( S { x i } ) f ( S ) represents the marginal contribution of the feature in feature subset S. The above formula describes the average marginal contribution of feature x i to all possible combinations, ensuring that the contribution of each feature is fairly well distributed.
The calculation of ϕ i , j is shown in (6).
ϕ i , j = S N { x i , x j } | S | ! ( N | S | 2 ) ! 2 ( N 1 ) ! δ i , j ( S ) δ i , j ( S ) = f ( S { x i , x j } ) f ( S x i ) f ( S x j ) + f ( S ) ,
The above equation reflects the gain or loss of synergy between features x i and x j .

2.4. RFE-SHAP Algorithm

RFE-SHAP differs from the recursive feature elimination method. It no longer directly relies on the feature-importance ranking of the model. Instead, it introduces SHAP theory to explore the marginal contributions and interaction effects of features. By generating importance rankings based on global SHAP values, the method provides a more intuitive, transparent, and interpretable feature selection strategy. The specific logic of the RFE-SHAP Algorithm 1 is structured as follows:
Algorithm 1: RFE-SHAP Feature Selection
Input: Full feature set F = {f1, f2, …, fn}, Training data X, SVR Model M
Output: Optimal feature subset Sopt
1: Train M on X with all features F
2: Calculate SHAP values for all samples using Equations (4)(6)
3: Compute global importance I(fi) as the mean absolute SHAP value for each feature
4: Rank F in descending order based on I(fi)
5: Initialize Sopt = ∅, Best_Score = ∞
6: For k = 1 to n do
7:   Select top k features to form subset Sk
8:   Retrain M on Sk using cross-validation
9:   Calculate evaluation metric (e.g., RMSE)
10:   If RMSE < Best_Score then
11:    Best_Score = RMSE
12:    Sopt = Sk
13: Return Sopt
In this study, the inclusion of SHAP interaction values is pivotal for identifying features that might appear insignificant in isolation but exert substantial influence through synergistic effects. While interaction effects generally enhance the model’s ability to capture complex non-linear relationships in spinning processes, they can occasionally introduce noise if the feature set is overly redundant. To mitigate this, our RFE-SHAP framework employs the Recursive Feature Elimination (RFE) process as a secondary filter. By iteratively evaluating model performance, the RFE component ensures that only those interactions that provide genuine predictive gain are retained, while noisy or spurious interactions are pruned, along with their parent features. This dual strategy allows the model to leverage beneficial synergies—such as the relationship between roving twist and drafting multiples—while maintaining a high signal-to-noise ratio in small-sample industrial datasets.
To further clarify the methodological advancements of the proposed framework, Table 1 summarizes the key theoretical differences between standard RFE, SVR-RFE, and our RFE-SHAP method. Unlike previous approaches that rely on internal model weights, RFE-SHAP leverages game-theoretic contributions, allowing for the explicit consideration of feature interactions—a crucial factor in complex spinning processes.

3. Model Evaluation Indicators and Dataset

3.1. Model Evaluation Indicators

Yarn quality prediction is a regression problem. The evaluation indicators of regression models generally include the mean squared error (MSE), root mean squared error (RMSE), mean absolute error (MAE), and mean absolute percentage error (MAPE). Considering that MSE is used to evaluate the performance of yarn quality prediction models, it is easily affected by yarn outliers because it amplifies the dimension, resulting in a significant increase in MSE. It cannot effectively reflect the size of the actual error, which, in turn, affects the evaluation effect of the model. Therefore, it is not suitable as an evaluation indicator for the model in this study. To comprehensively evaluate the model’s predictive performance, RMSE, MAE, and MAPE are selected as evaluation indicators. Although RMSE is sensitive to outliers, it is retained to ensure the error scale remains consistent with the yarn quality indicators. To mitigate the potential impact of extreme values, MAE and MAPE are simultaneously employed as robust metrics, providing a more balanced and reliable assessment of the model’s overall performance. The calculations for these three evaluation indicators are shown in (7), (8), and (9), respectively.
R M S E = 1 N i = 1 N a c t u a l i p r e d i c t i 2 ,
M A E = 1 N i = 1 N a c t u a l i p r e d i c t i ,
M A P E = 1 N i = 1 N a c t u a l i p r e d i c t i a c t u a l i ,
where: N represents the total number of test samples, a c t u a l i represents the label value of the sample, and p r e d i c t i represents the predicted value of the sample.

3.2. Dataset

The experimental dataset utilized in this study was obtained from the authentic production records of a large-scale textile enterprise located in China, ensuring that this research is grounded in real-world industrial complexities. The original data input features are divided into three categories, totaling 30: namely raw cotton quality parameters, semi-finished product quality parameters, and process parameters during the operation of the production equipment. Raw cotton quality parameters refer to the quality indicators of raw materials used for yarn production before production, including raw cotton maturity, raw cotton impurity rate/%, raw cotton length uniformity/%, average length of the right half of raw cotton/mm, raw cotton strength/(cN/tex), raw cotton micronaire value, raw cotton neps/(Neps/g), and raw cotton short fiber rate/%. Semi-finished product quality parameters refer to the quality indicators of semi-finished yarn detected during the textile production process, including carded AFIS neps/(Neps/g), carded AFIS short fiber rate/(Neps/g), carded noil rate/%, combed AFIS cotton neps/(Neps/g), combed AFIS short fiber rate/(Neps/g), combed noil rate/%, and yarn number. Process parameters during the operation of production equipment include carded cotton line speed/(m/min), pre-drawing line speed/(m/min), combed cylinder speed, combed nipper times/(nips/min), drawing line speed, roving spindle speed, roving twist shrinkage/%, roving drafting multiple, spun yarn twist shrinkage/%, average spindle speed/(r/min), and drafting multiple. In this study, yarn strength and hairiness H-value are defined as the target response variables (outputs), which represent the overall yarn quality. The prediction is based on 30 input features derived from raw materials and processing stages.
Regarding the data structure, the primary challenges involved the relatively large number of input features (30 features) compared to the limited sample size, which increases the risk of feature redundancy and model overfitting, alongside the disparate physical scales of the parameters. To resolve these issues, standard Min–Max normalization was employed to map all features into a [0, 1] range, ensuring numerical stability during model training and convergence.
To ensure the stability and generalization of the feature selection process, a 5-fold cross-validation strategy was employed during the recursive evaluation phase. Specifically, the training dataset was randomly partitioned into five equal-sized subsamples; four subsamples were used for model training, while the remaining one was used for validation. This process was repeated five times to yield a reliable average performance metric (RMSE).
Although the small data size typically poses a high risk of overfitting, our RFE-SHAP framework mitigates this by iteratively eliminating redundant variables and noise, thereby ensuring that the solution quality remains robust even in data-limited industrial scenarios. Furthermore, the proposed method is designed as an automated end-to-end pipeline. Once the structured production data is digitized, the framework requires minimal manual intervention—limited only to initial target definition and basic data cleaning—allowing for efficient generalization to various yarn quality prediction tasks regardless of geographical factors.

4. Experiments and Results Analysis

4.1. Analysis Results of the SVR-RFE Algorithm

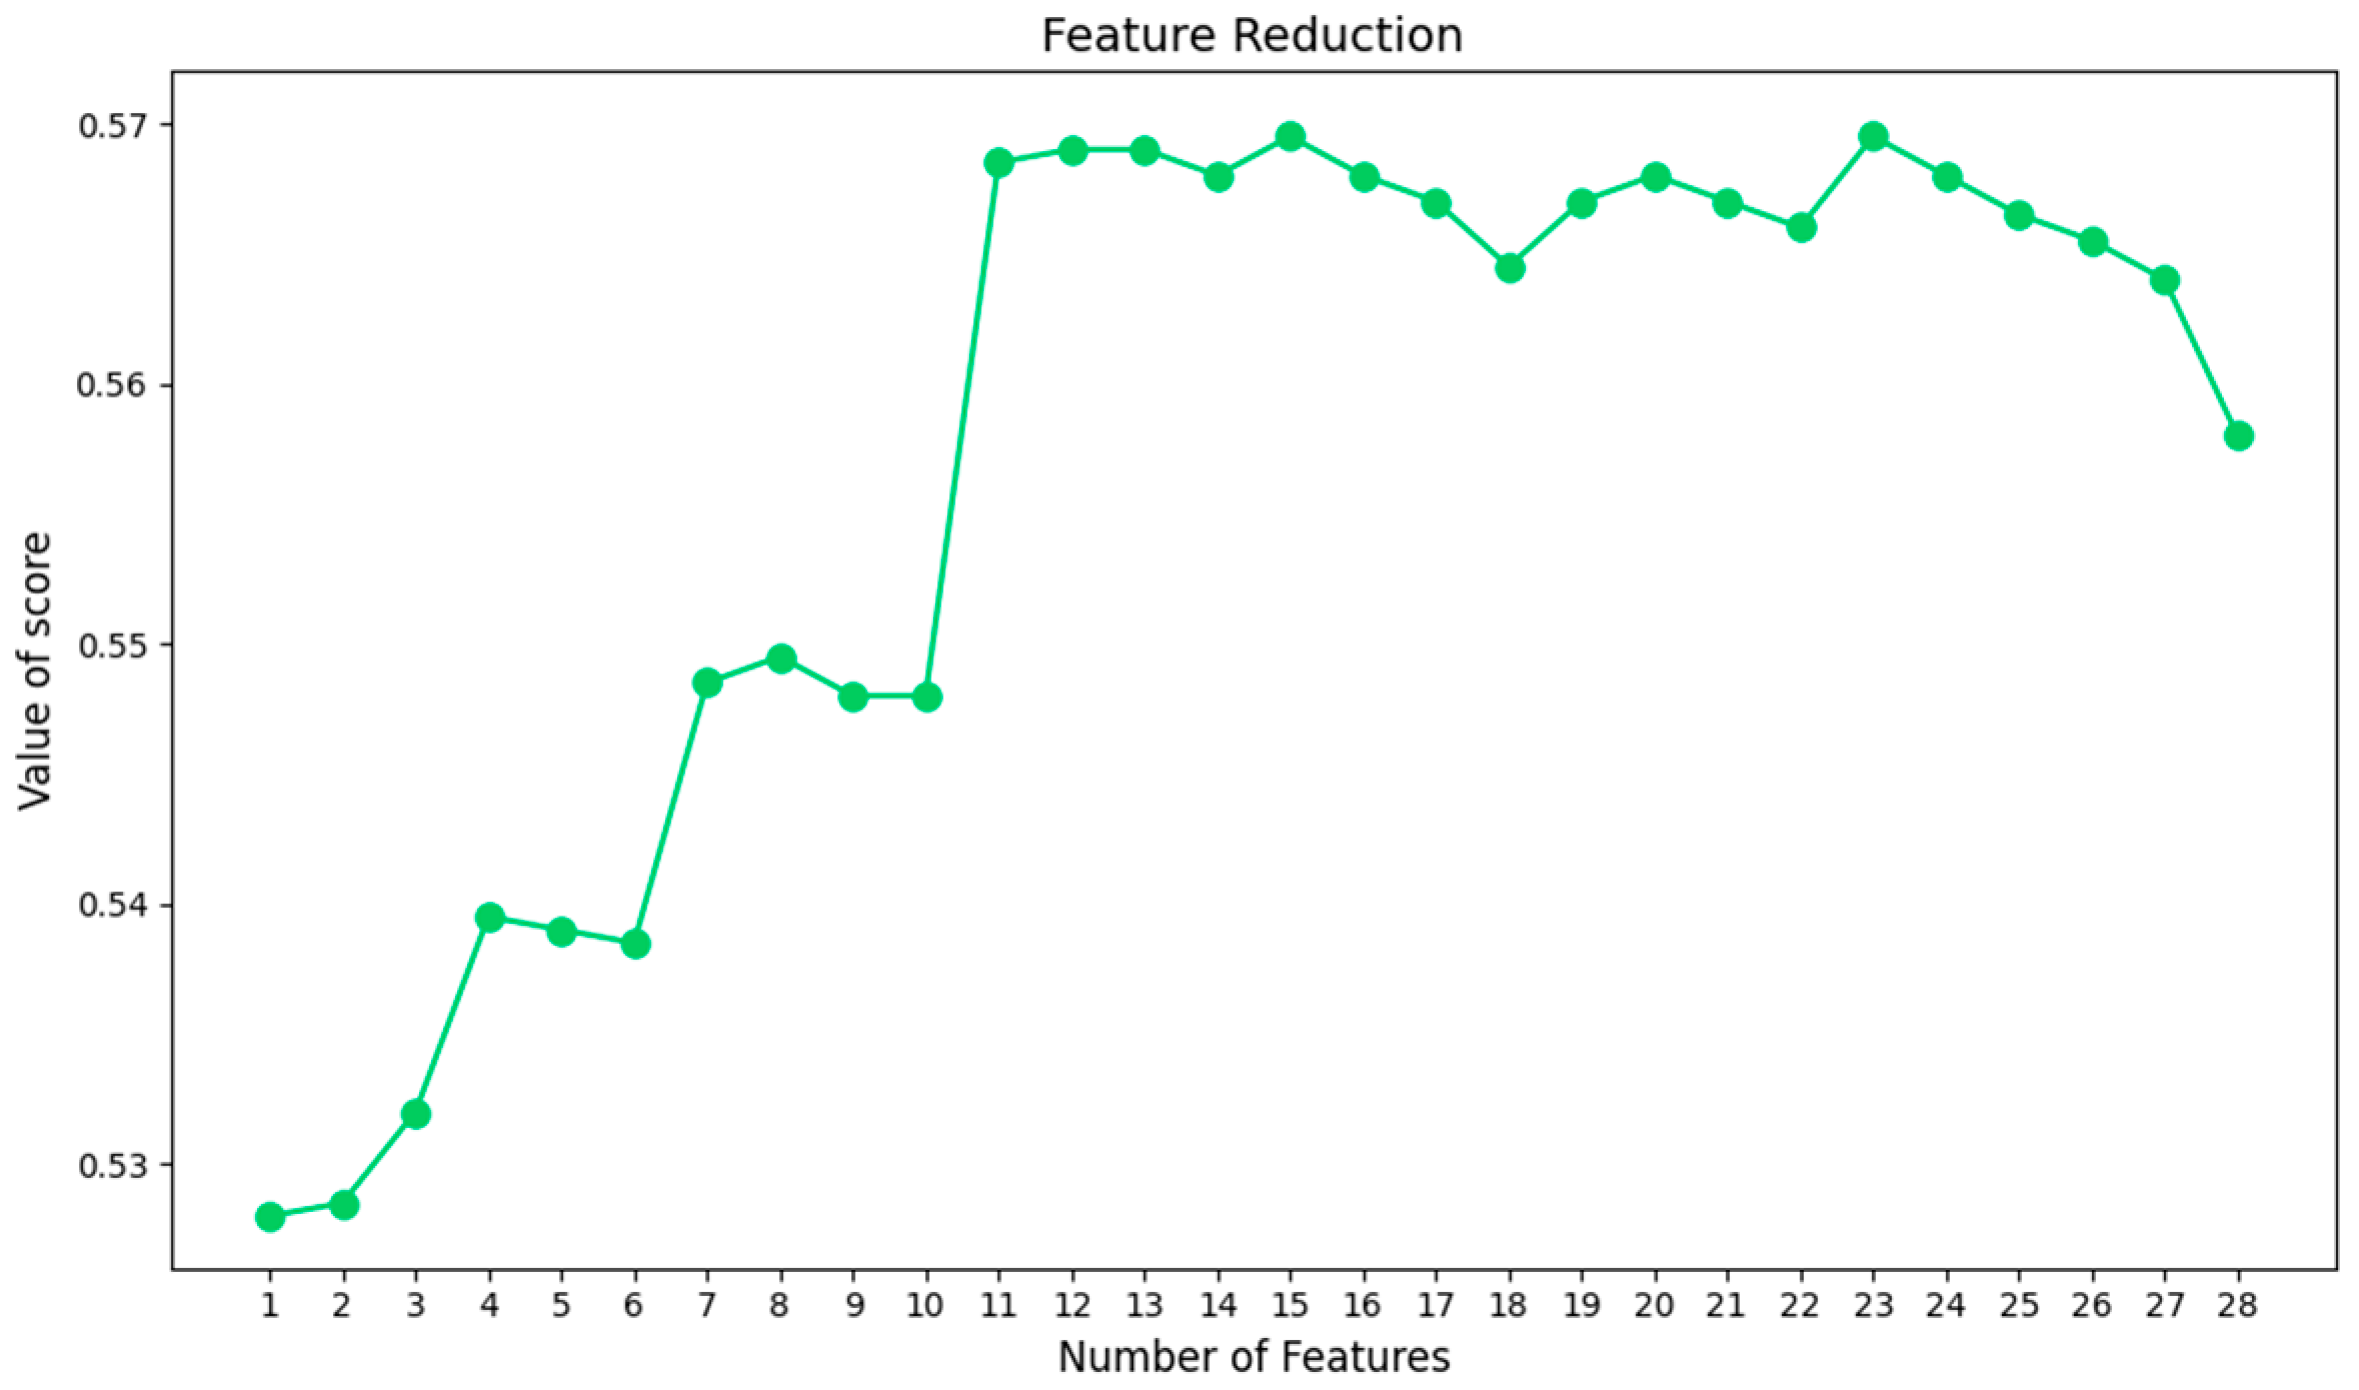
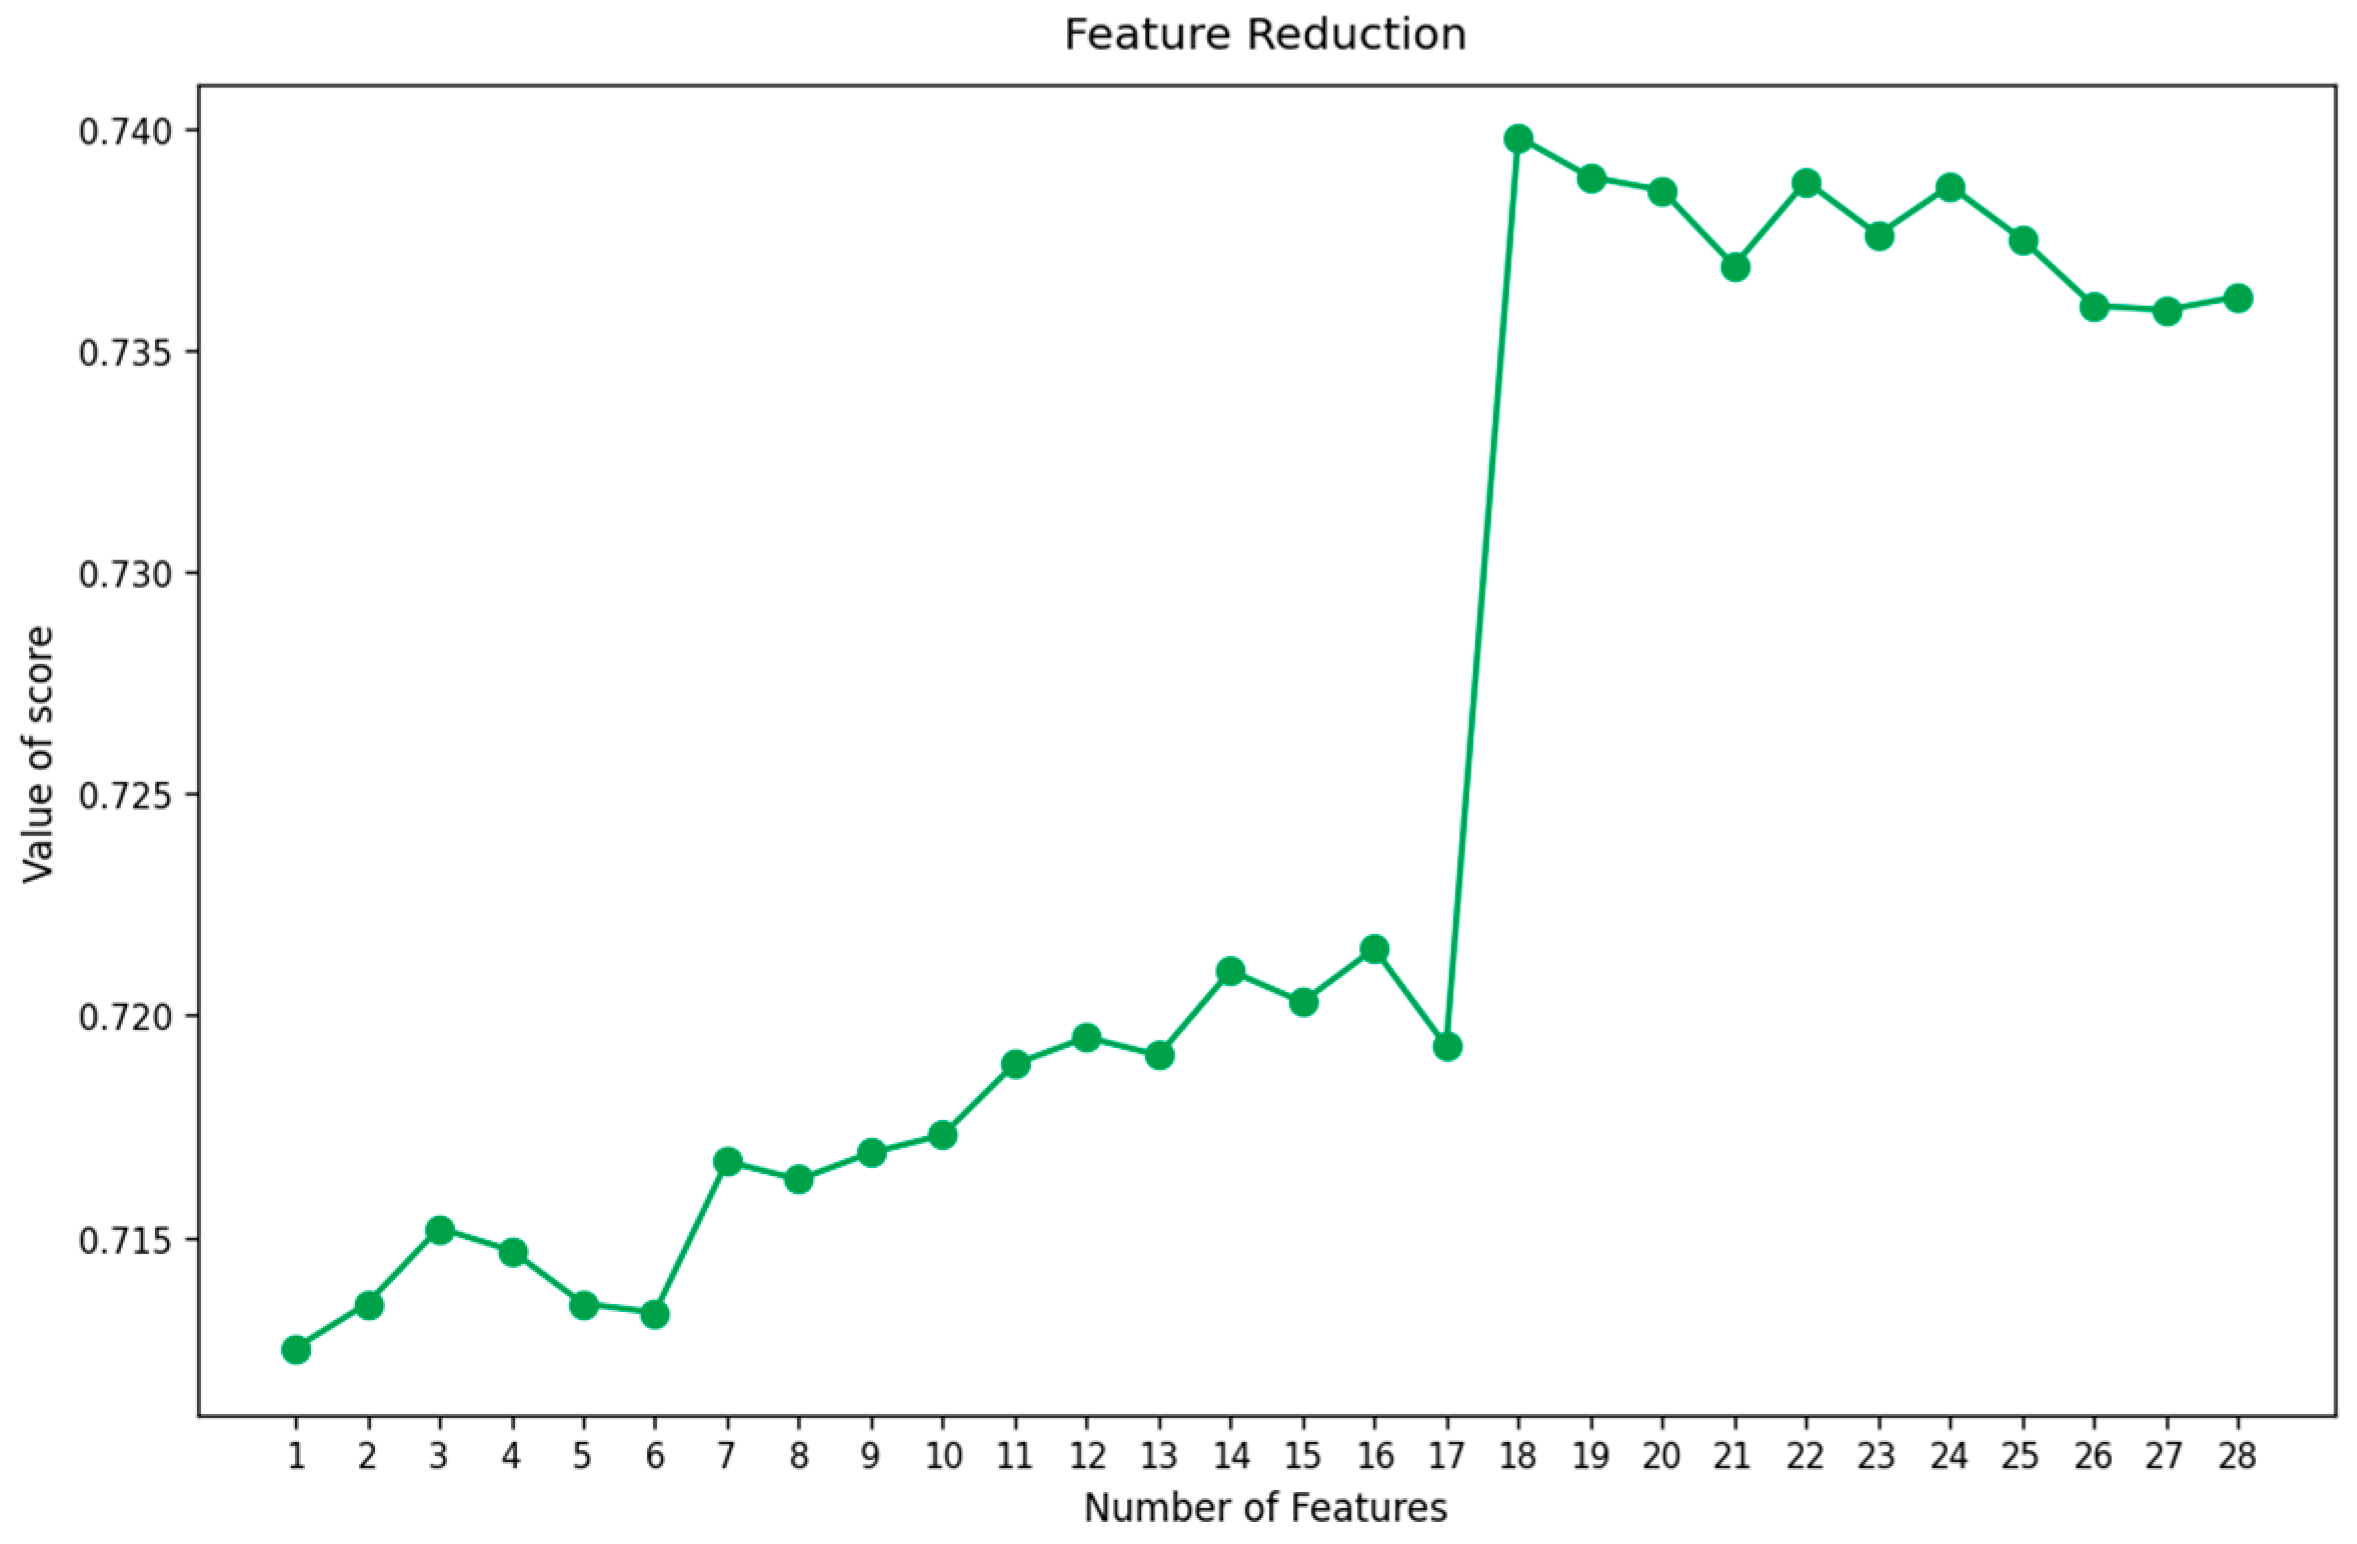
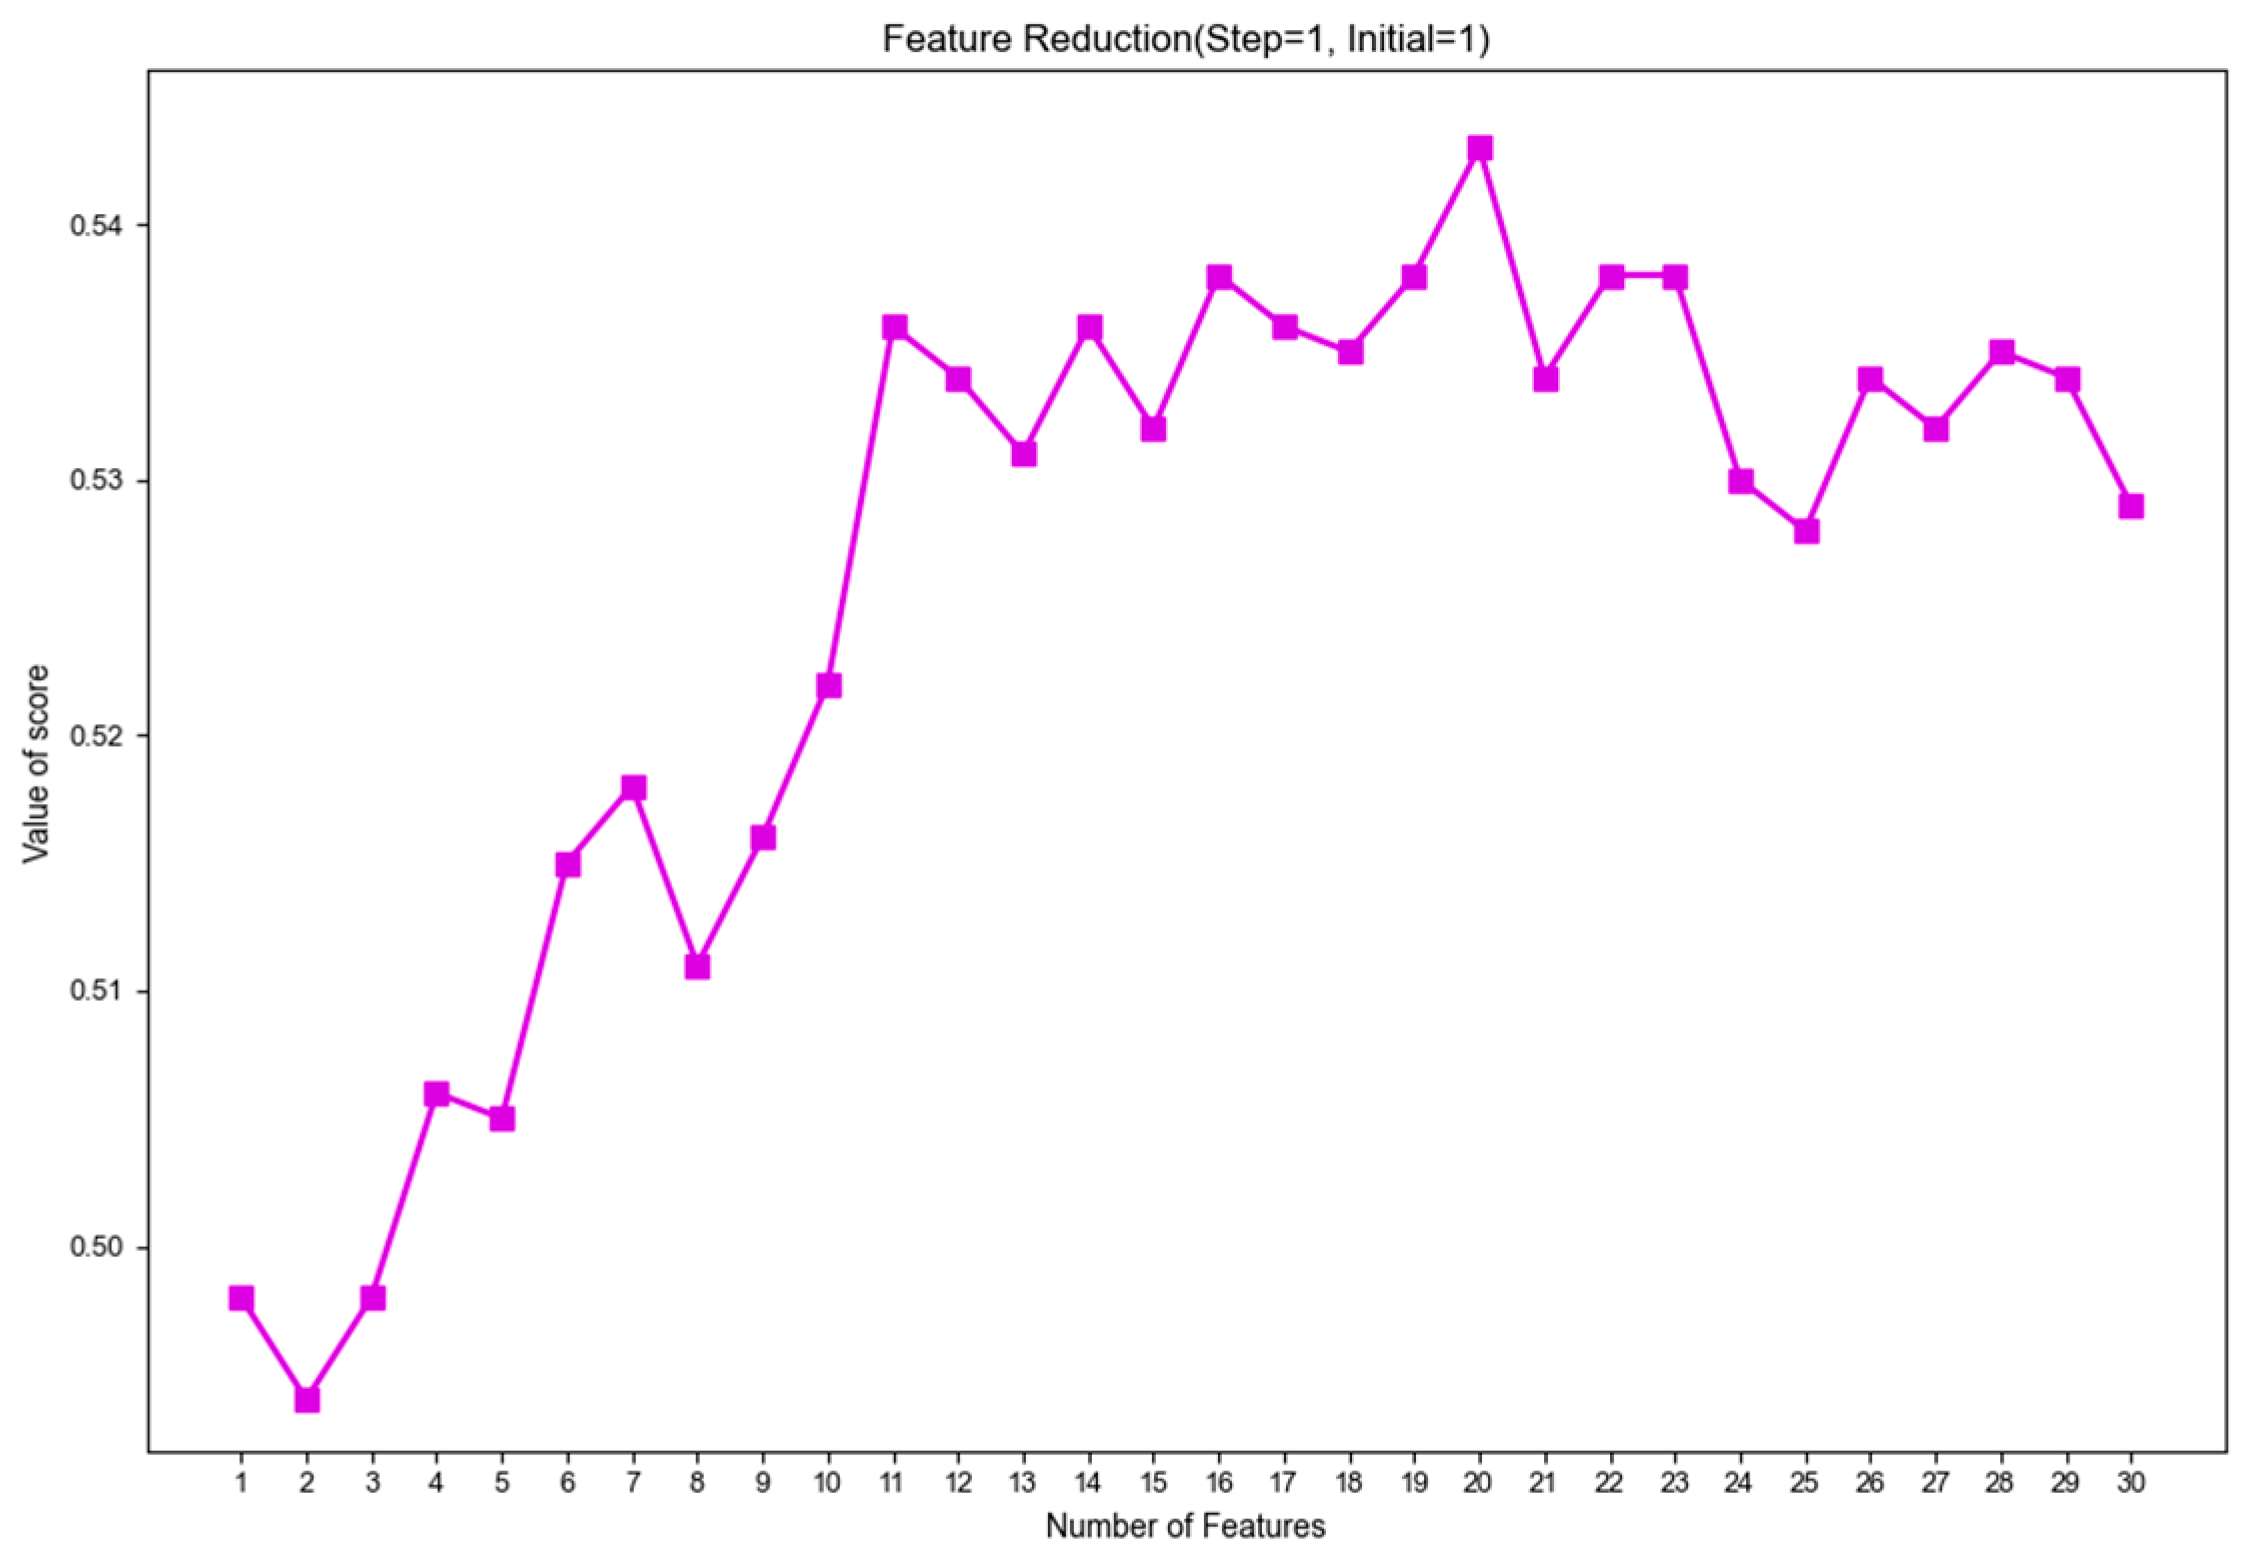
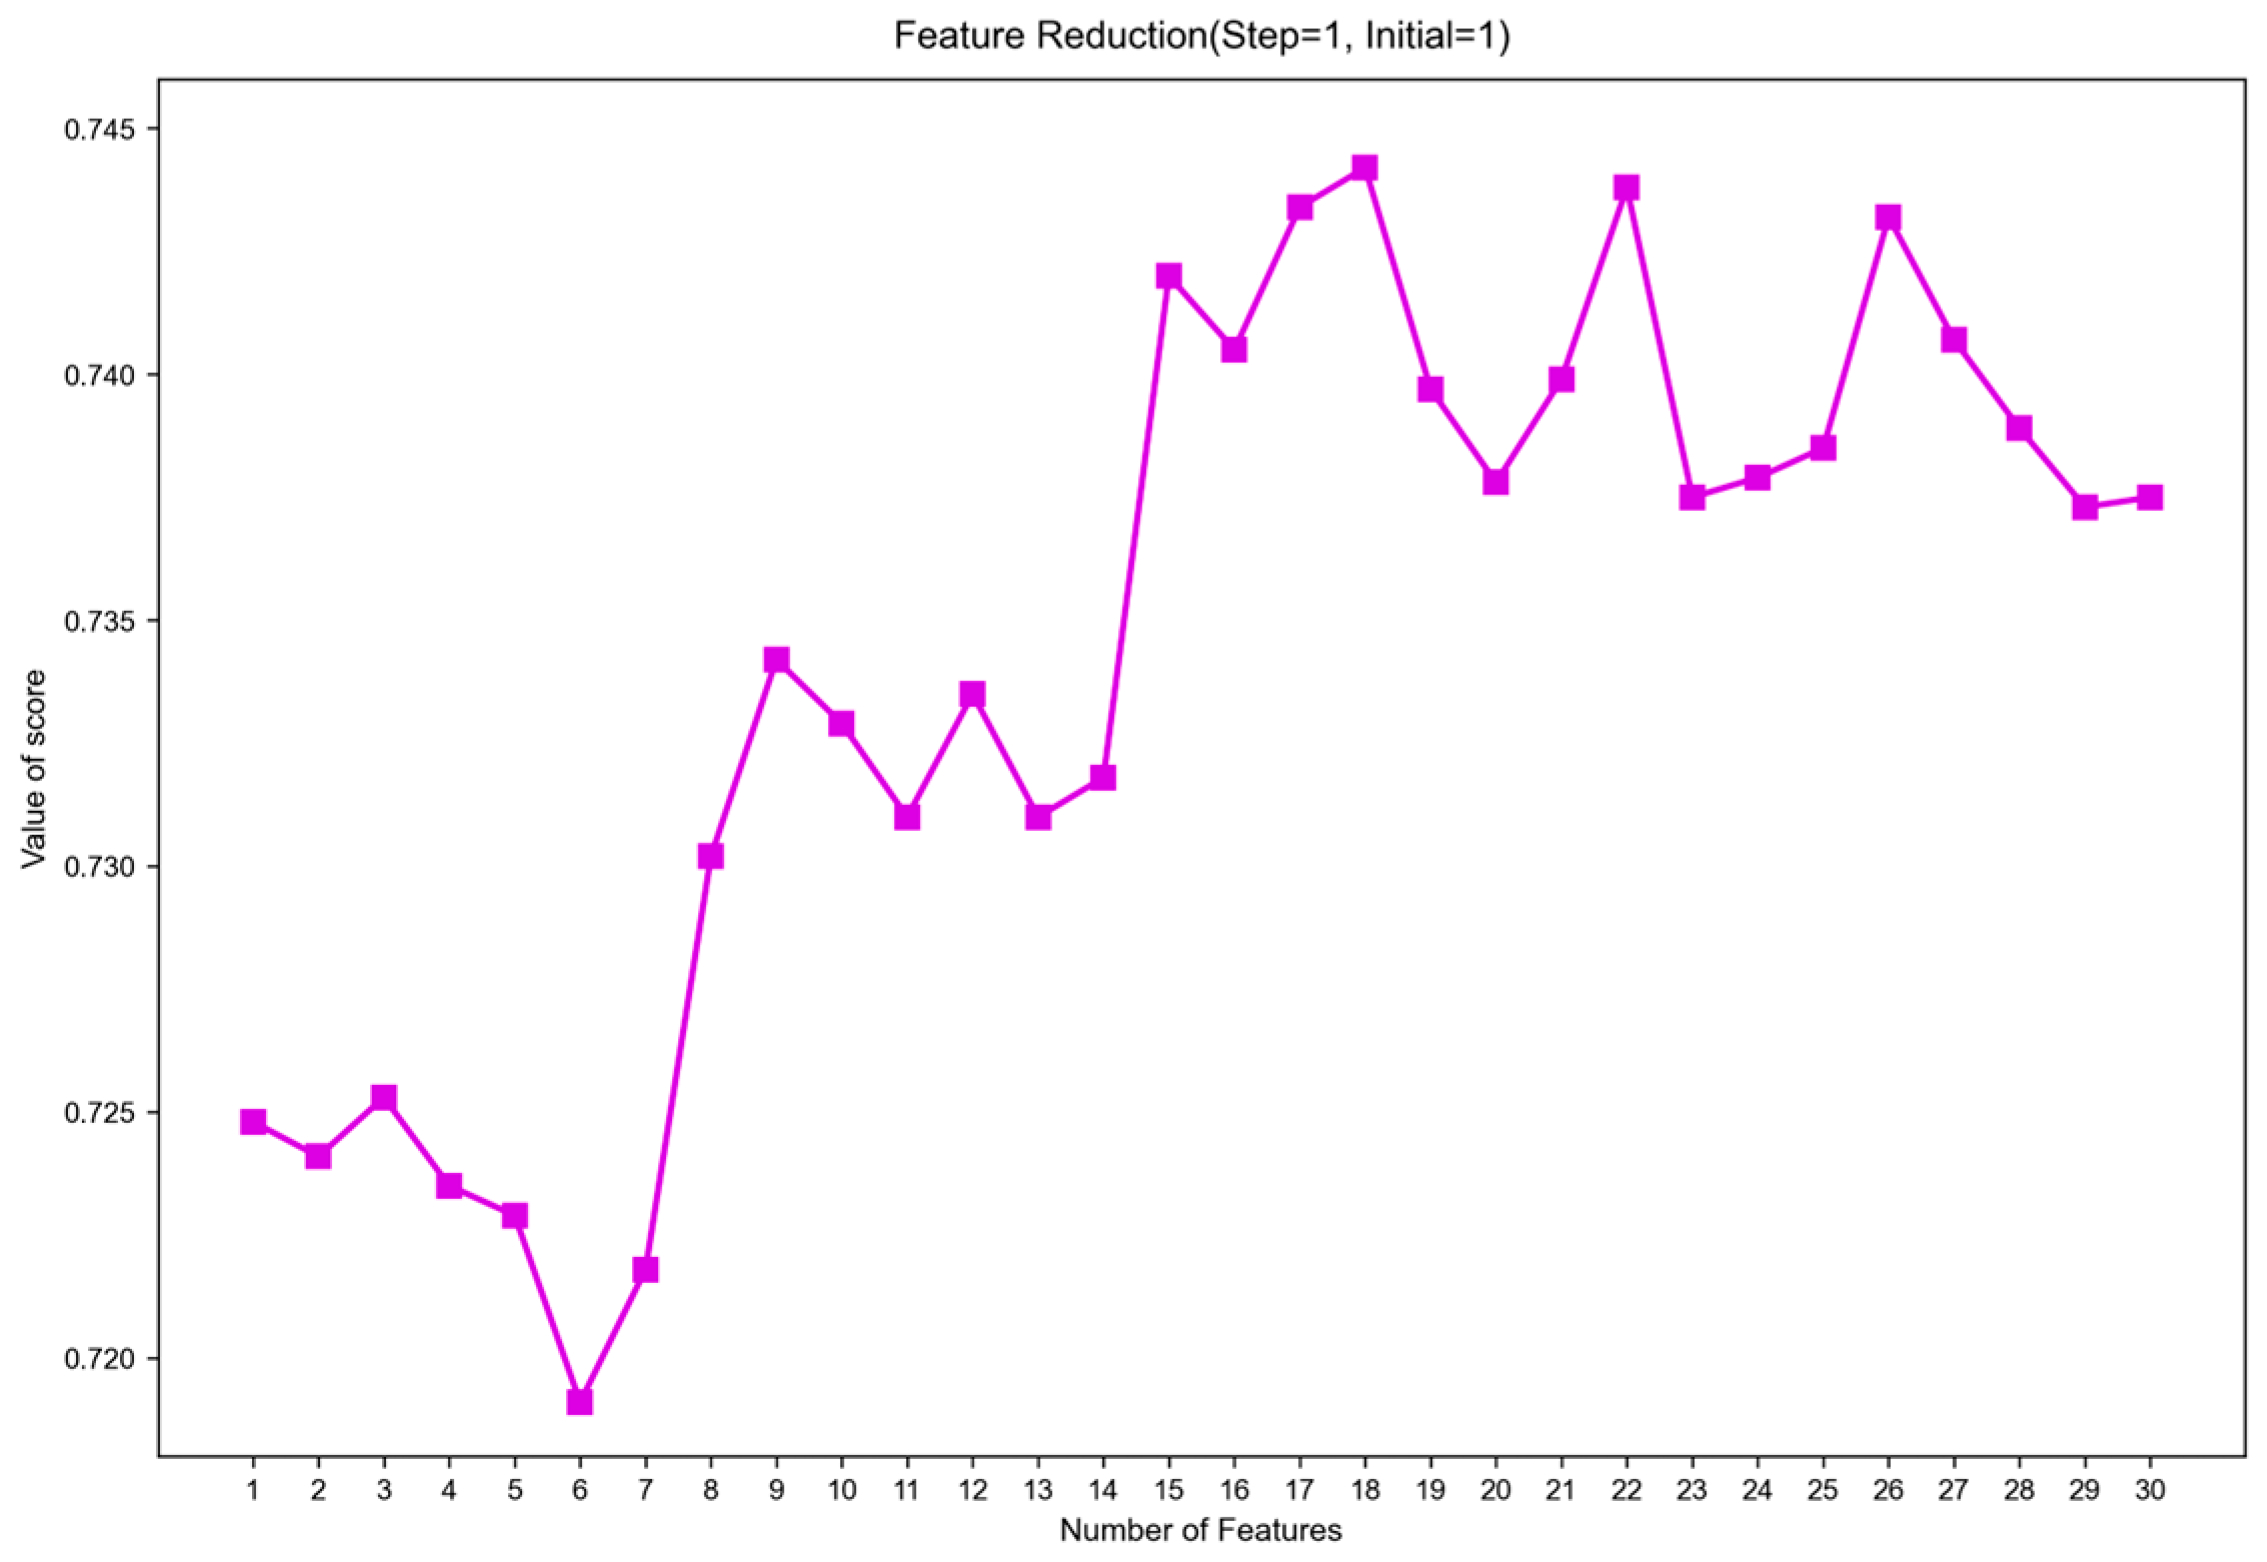
The ranking coefficient of each feature subset based on the yarn strength and hairiness H-value analyzed by the SVR-RFE algorithm are shown in Figure 1 and Figure 2, respectively.
As shown in Figure 1 and Figure 2, when the number of features in the feature subsets affecting the yarn strength and hairiness H-value indicators is 15 and 18, respectively, the model reaches its optimal predictive performance. The corresponding optimal feature subsets of the yarn strength and hairiness H-value indicators are listed in Table 2.

4.2. Analysis Results of the RFE-SHAP Algorithm

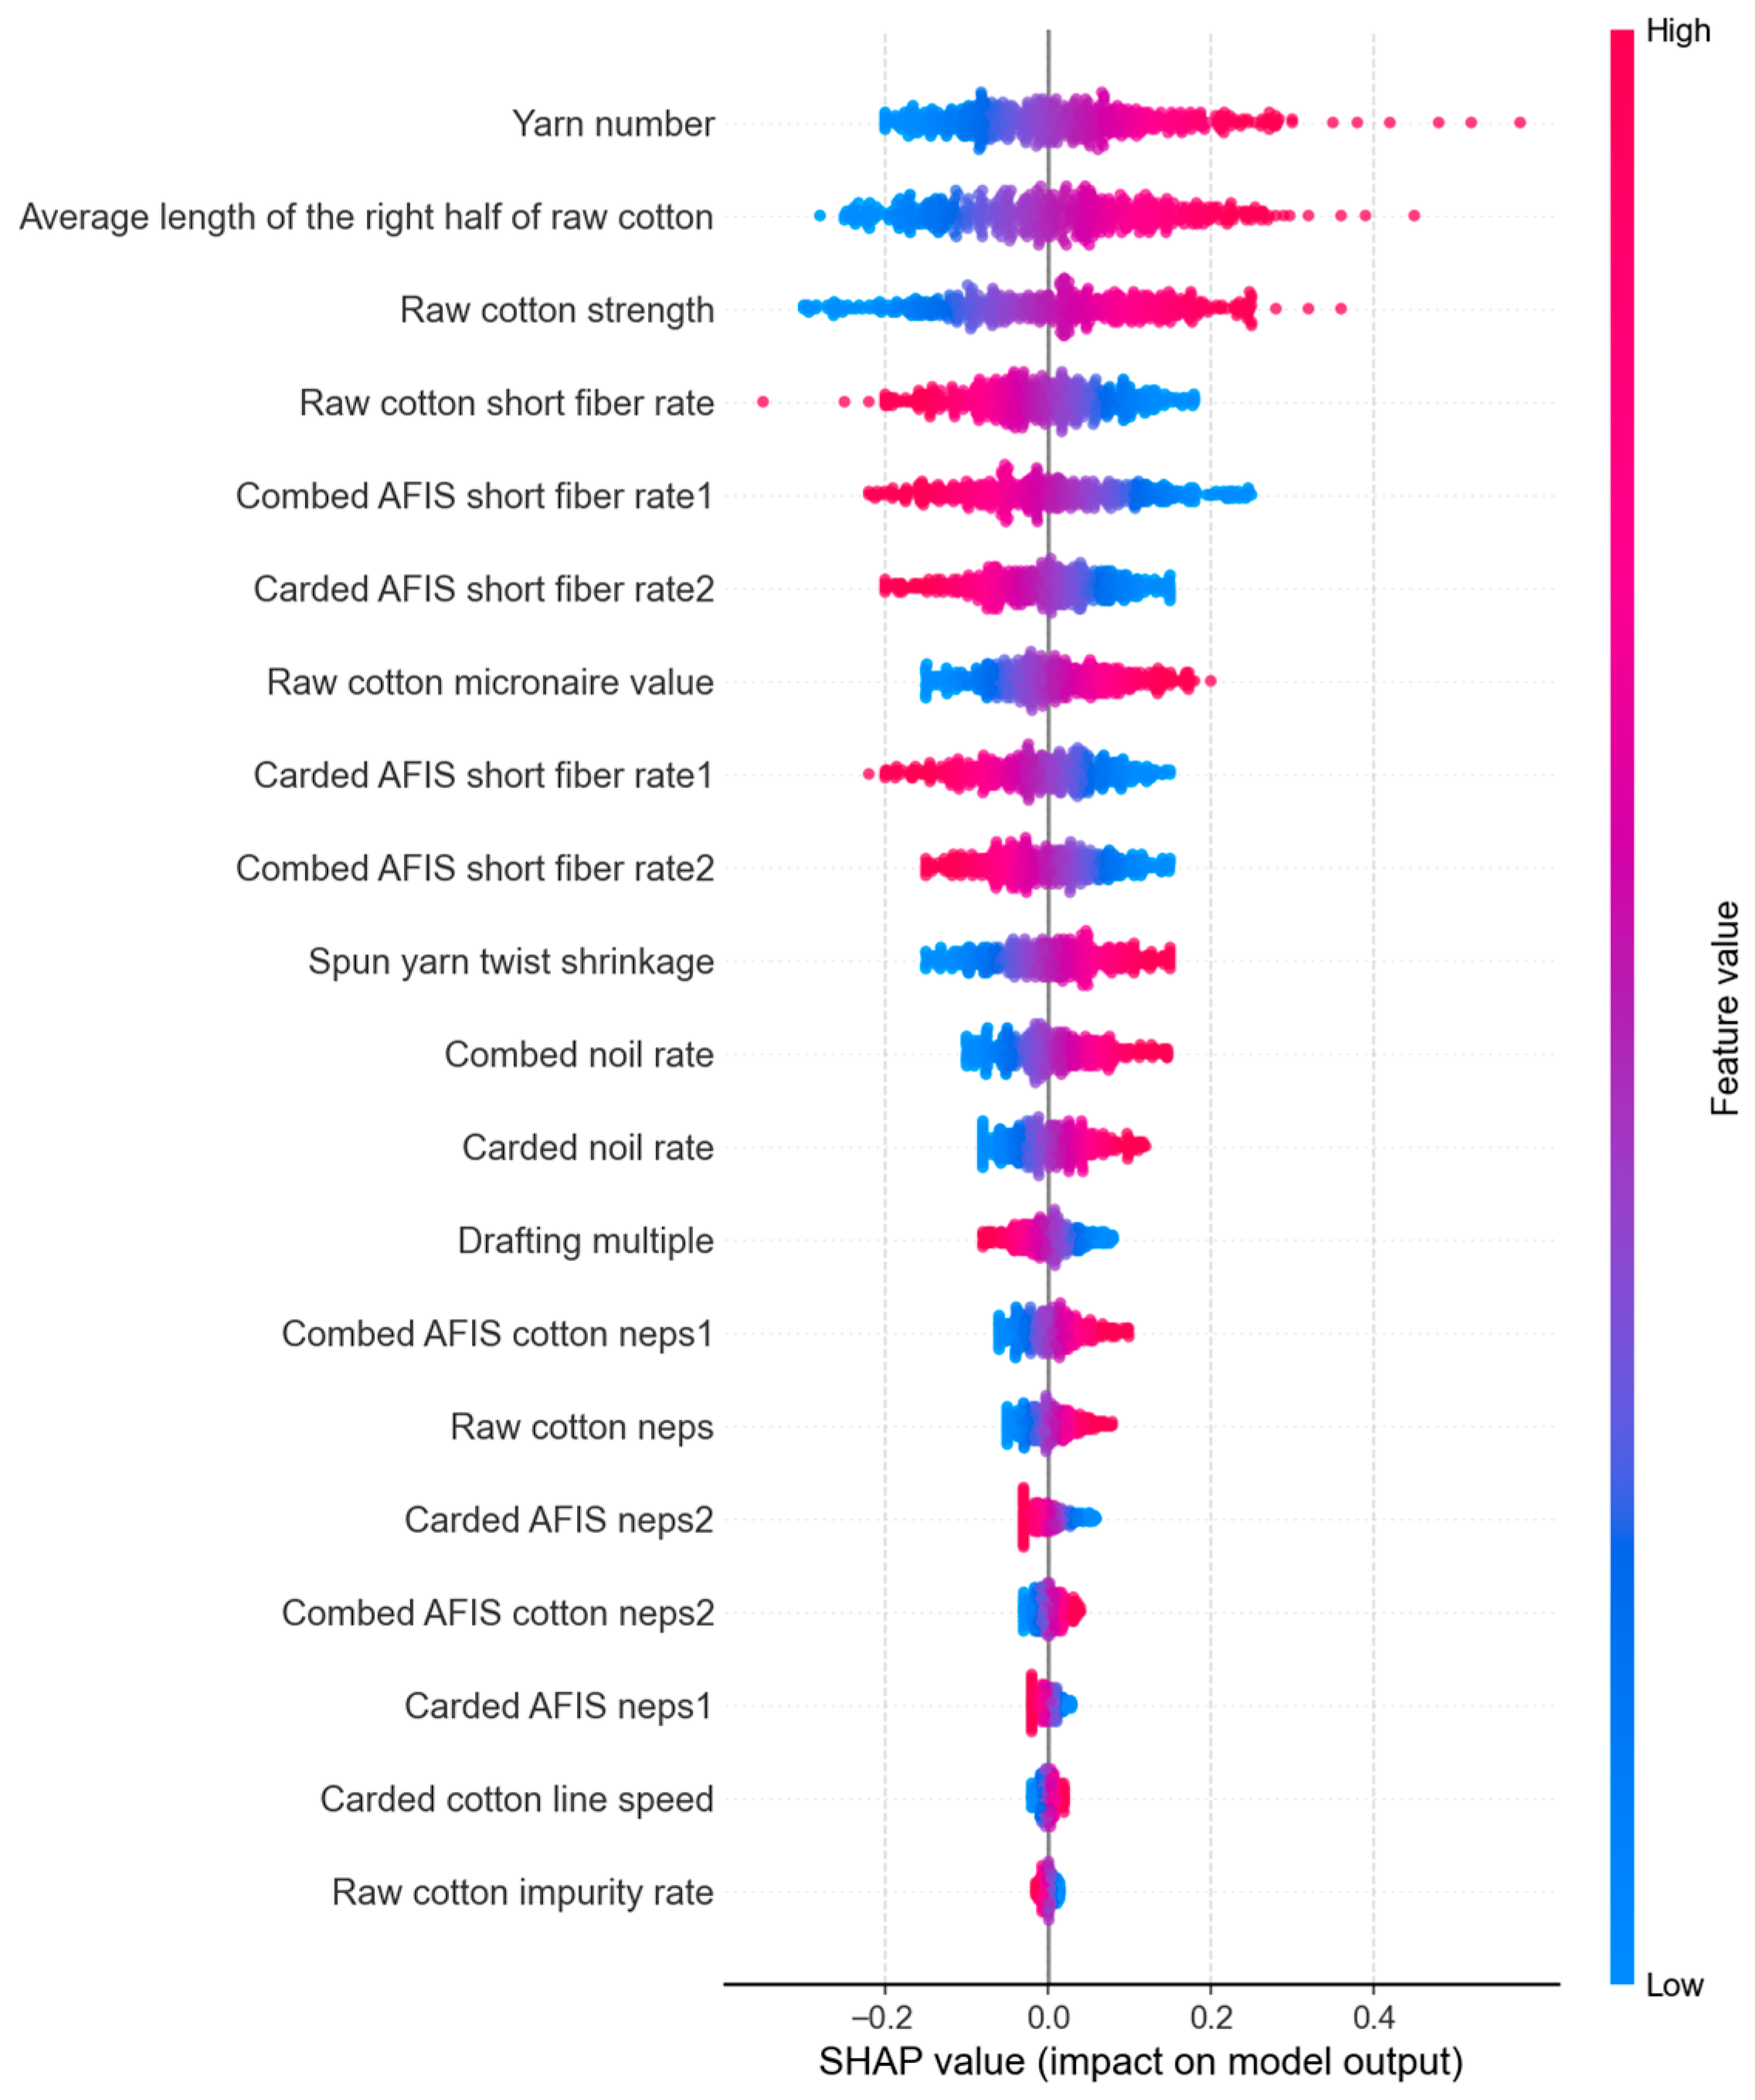
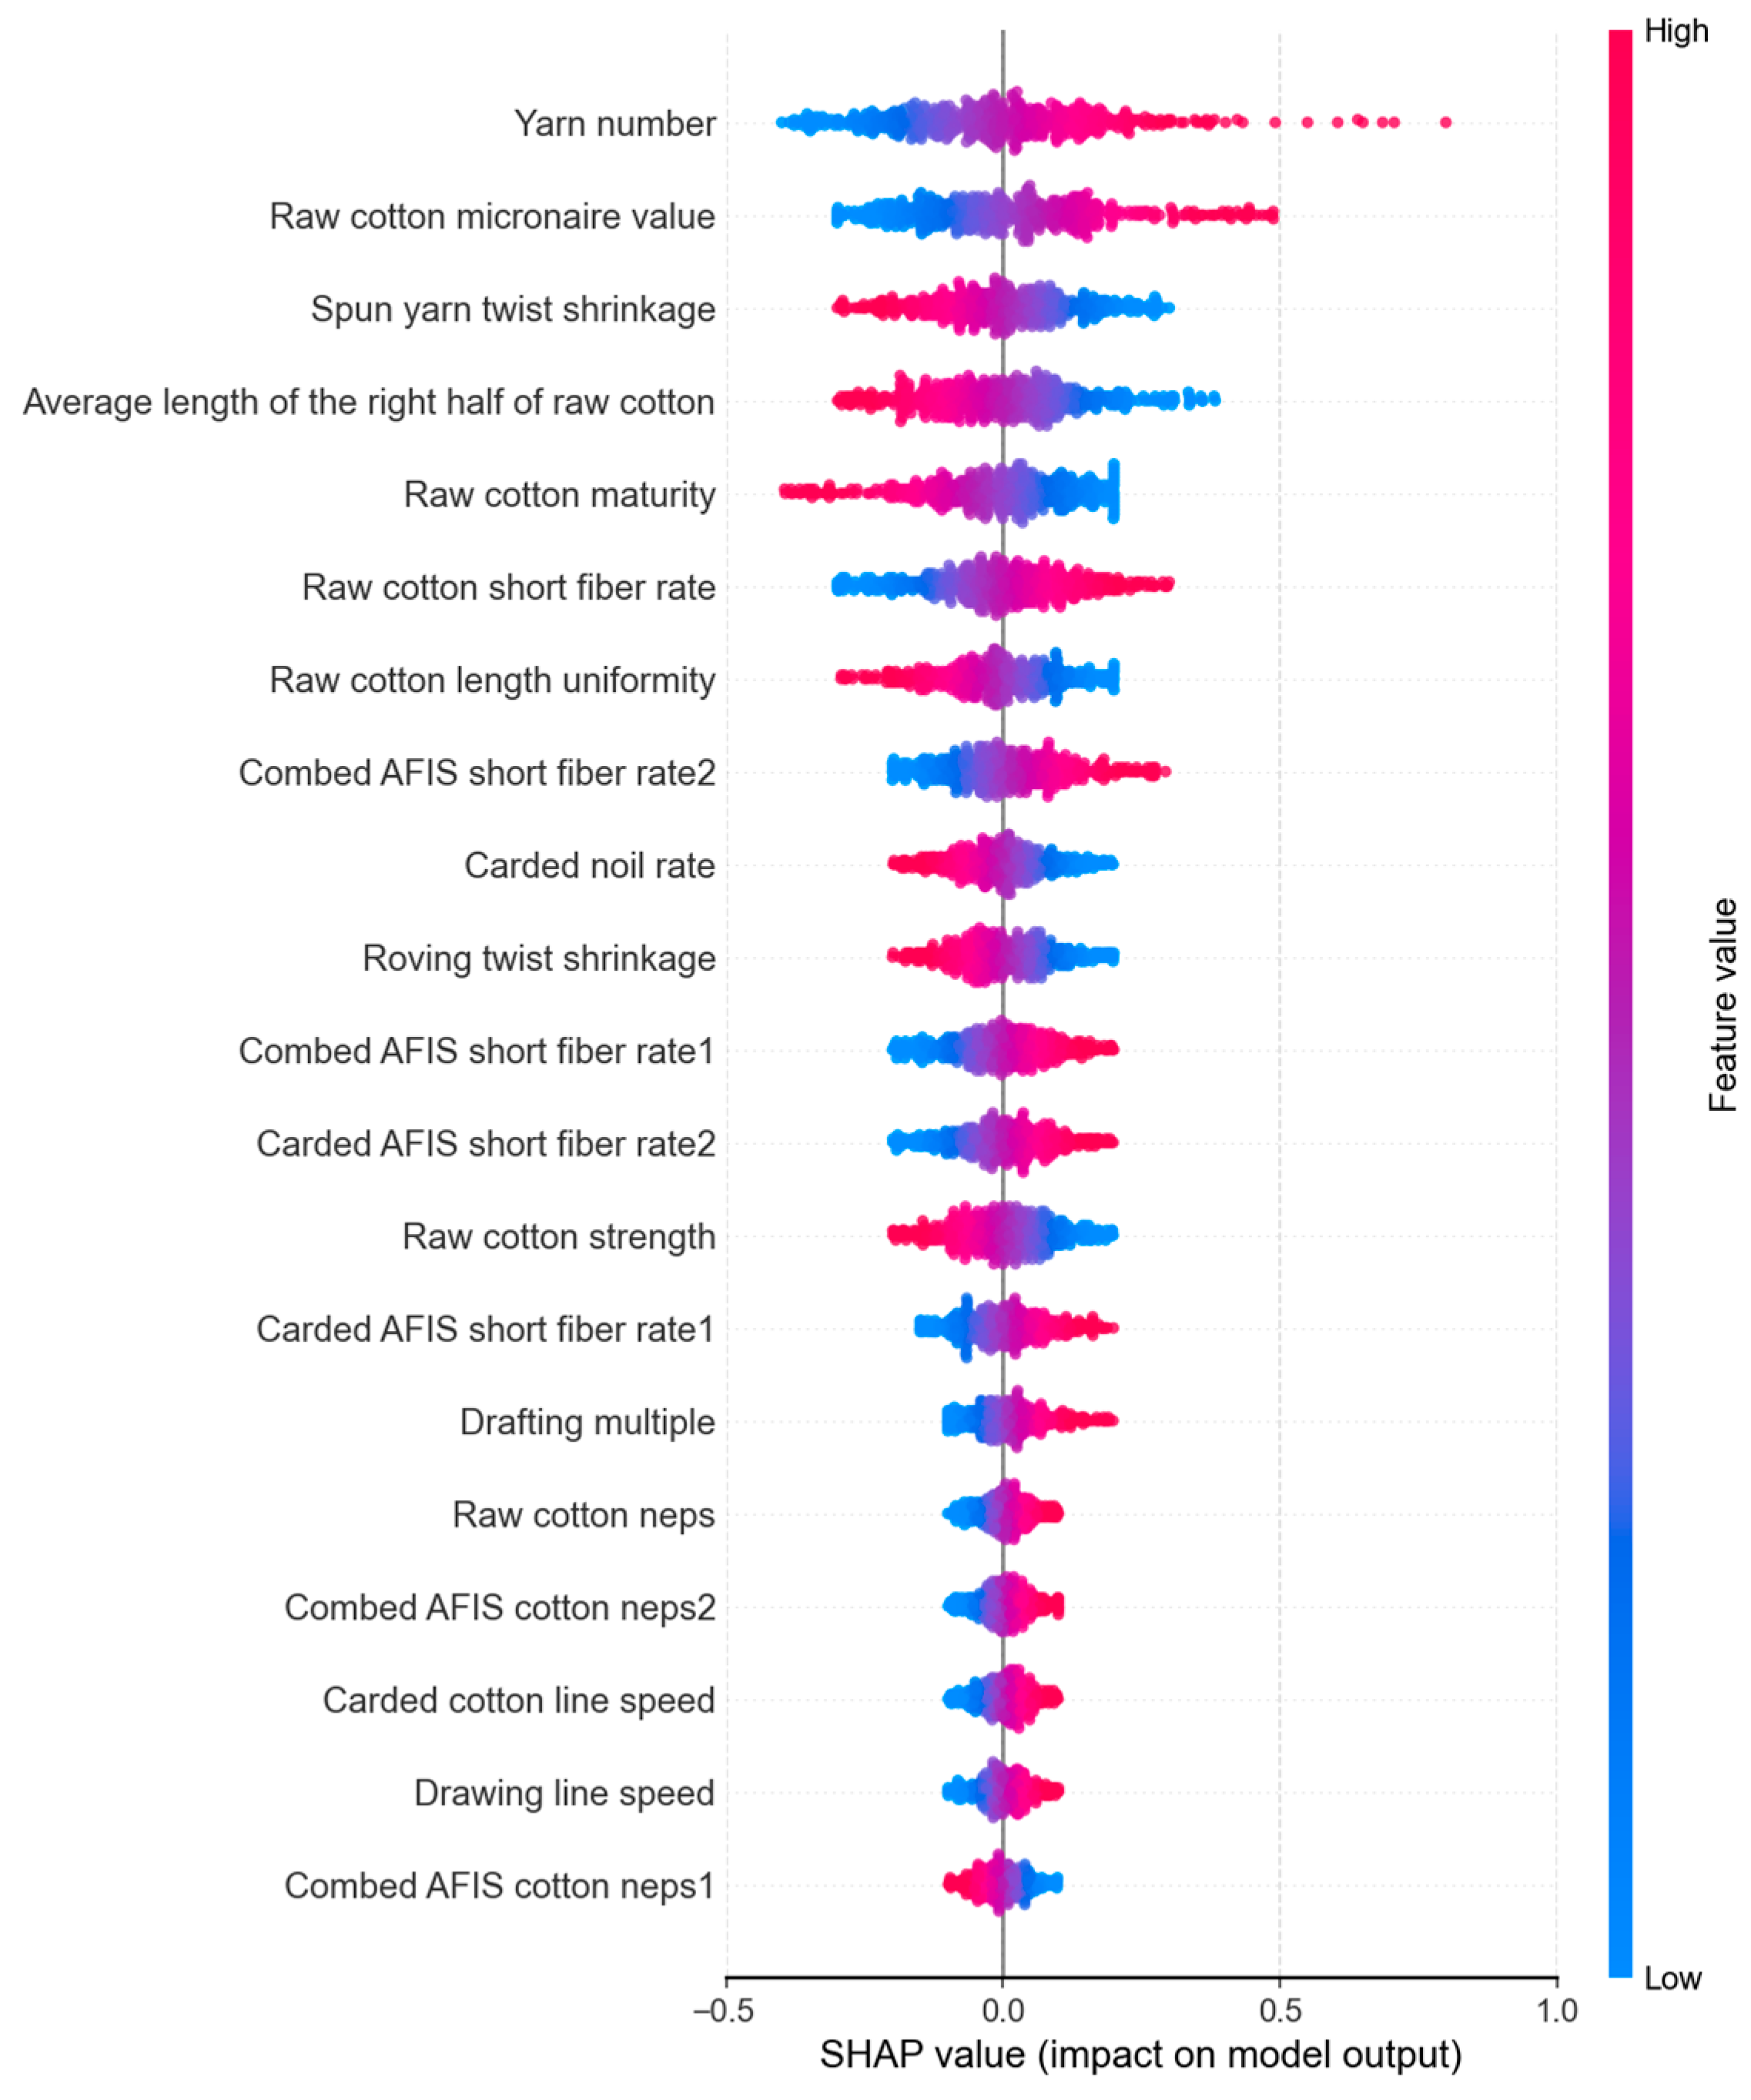
The top 20 features of the contribution value of yarn strength and hairiness H-value analyzed by SHAP are shown in Figure 3 and Figure 4, respectively. The features in the figure are arranged from top to bottom according to their contribution because the figure represents the global properties, that is, the properties of all features and all samples. The contribution ranking of each feature is based on the average contribution of all samples.
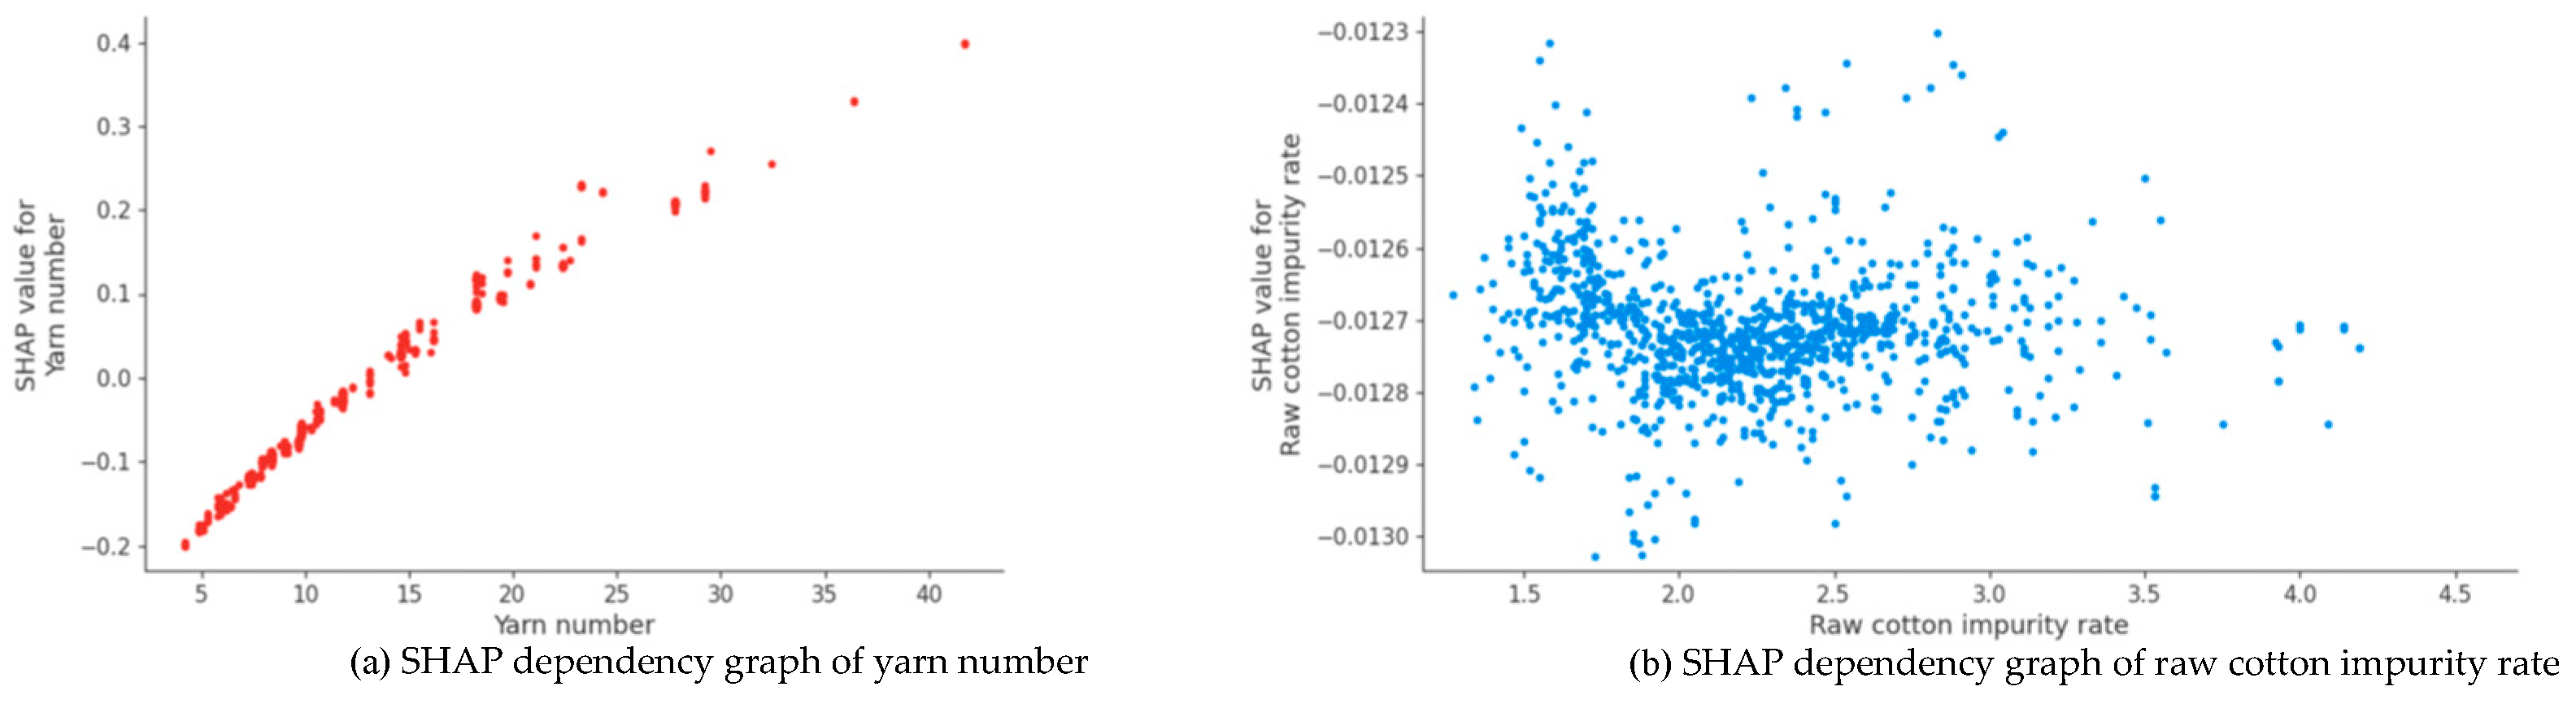
For the top 20 features ranked by the importance of yarn strength, the yarn number and raw cotton impurity rate are the features with the greatest and smallest impacts on the yarn strength, respectively. These two features are used as examples to analyze their impact on yarn strength, and their SHAP dependence is shown in Figure 5. As illustrated in Figure 5, the SHAP dependency plots reveal critical thresholds for process control. For instance, the drafting multiple shows a distinct non-linear relationship with yarn strength. When the drafting multiple exceeds a specific value, its SHAP value drops sharply, indicating a transition from a stable spinning state to one prone to fiber slippage. For industrial process control, this implies that operators should maintain the drafting multiple within the ‘safe plateau’ identified by the SHAP values to ensure consistent strength. Furthermore, the vertical dispersion of points at similar input values suggests that the impact of one parameter is moderated by others (e.g., roving twist), necessitating a multi-variable synergistic control strategy rather than isolated parameter adjustments.
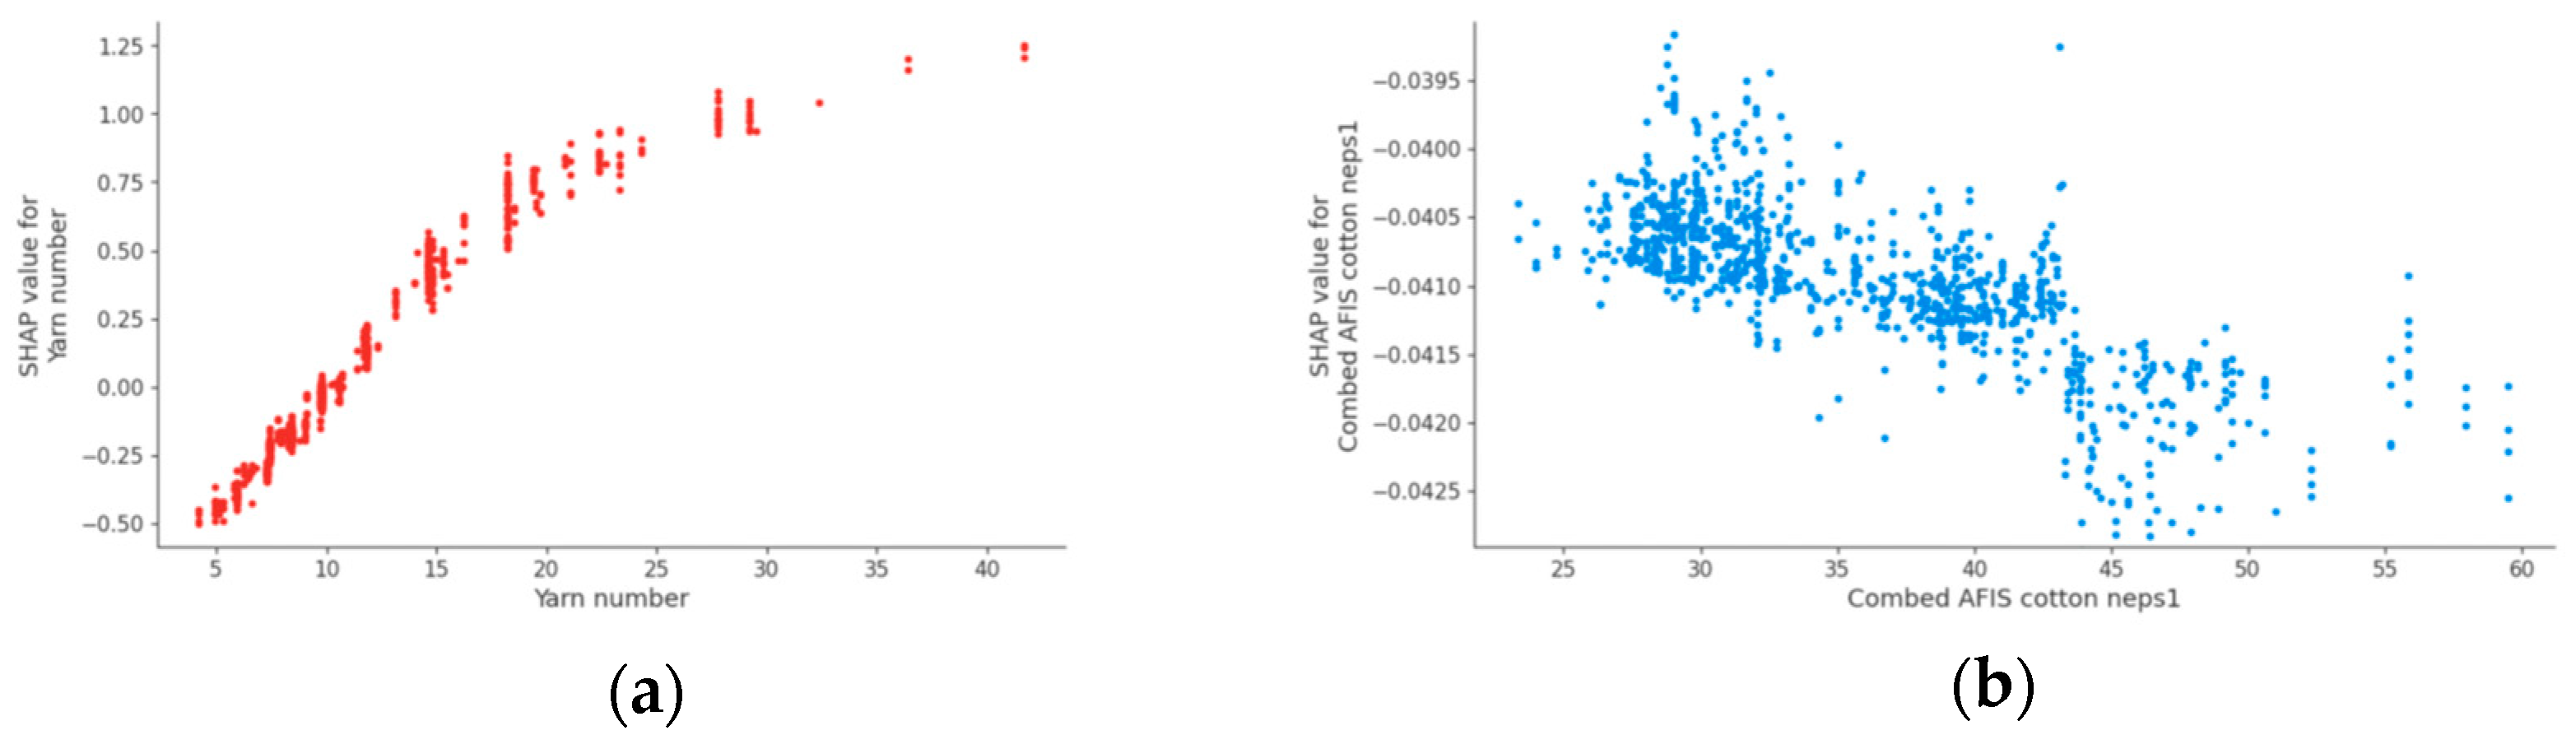
For the top 20 features ranked by the importance of hairiness H-value, the yarn number and combed AFIS short fiber rate1 are the features with the greatest and smallest impacts on the hairiness H-value, respectively. These two features are used as examples to analyze their impact on hairiness H-value, and their SHAP dependence is shown in Figure 6. The trends in Figure 6 suggest that certain semi-finished product parameters, such as the combed AFIS neps, have a marginal effect on hairiness until they reach a high-density threshold. Beyond this inflection point, the H-value increases significantly. This provides a ‘warning buffer’ for production engineers: as long as nep levels are managed below this threshold, hairiness remains relatively stable. In terms of process control, this allows for more flexible raw material blending strategies, prioritizing cost efficiency provided the key quality ‘inflection points’ identified by the RFE-SHAP model are not breached.
As shown in Figure 5a and Figure 6a, as the yarn number increases, the corresponding SHAP value also continues to change significantly, indicating that the contribution of the yarn number to the prediction results of yarn strength and hairiness H-value is more significant. As shown in Figure 5b, as the raw cotton impurity rate increases, the corresponding SHAP value has an overall downward trend, but it is not obvious, indicating that the raw cotton trash content has a certain degree of weak influence on the prediction of yarn strength. As shown in Figure 6b, as the percentage of combed AFIS short fiber rate1 increases, the corresponding SHAP value generally shows a downward trend but also involves a certain degree of irregular shaking, indicating that the combed AFIS short fiber rate1 has no significant effect on the prediction of hairiness H-value.
From the analysis of Figure 3, we can see that under the features of yarn number, average length of the right half of raw cotton, and raw cotton strength, the distribution in the beeswarm plot is obvious along the color gradient of the horizontal axis, and the SHAP values of these features are widely distributed, indicating that the changes in their values have a significant impact on the prediction of yarn strength. Similarly, from the analysis of Figure 4, we can see that the SHAP values of features such as yarn number, raw cotton micronaire value, and yarn twist shrinkage rate are widely distributed, indicating that the changes in their values have a significant impact on the prediction of the hairiness H-value.
The SHAP value of each feature subset based on yarn strength and the hairiness H-value analyzed by the RFE-SHAP algorithm are shown in Figure 7 and Figure 8, respectively.
As shown in Figure 7 and Figure 8, when the number of features in the feature subsets affecting the yarn strength and hairiness H-value indicators is 20 and 18, respectively, the model’s average absolute SHAP value is the highest. The corresponding optimal feature subsets of the yarn strength and hairiness H-value indicators are listed in Table 3.

4.3. Model Construction and Result Comparison

Because the core of the yarn quality prediction system used by some domestic textile enterprises in production practice is mostly based on neural networks, it is widely used in yarn quality prediction and reliable, and prediction performance can essentially meet the actual application needs of textile factories. Therefore, a four-layer BP-ANN network (comprising one input layer, two hidden layers, and one output layer) is used as the prediction model in this study. According to Dai et al. [12], a single-hidden-layer structure often struggles with the high-dimensional non-linear complexities of textile production data. In their research on cotton yarn quality, a dual-hidden-layer structure was employed to enhance the model’s feature extraction capabilities, which is consistent with our selection of a four-layer architecture. The optimal number of nodes in the hidden layer of the network is determined using the grid search method.
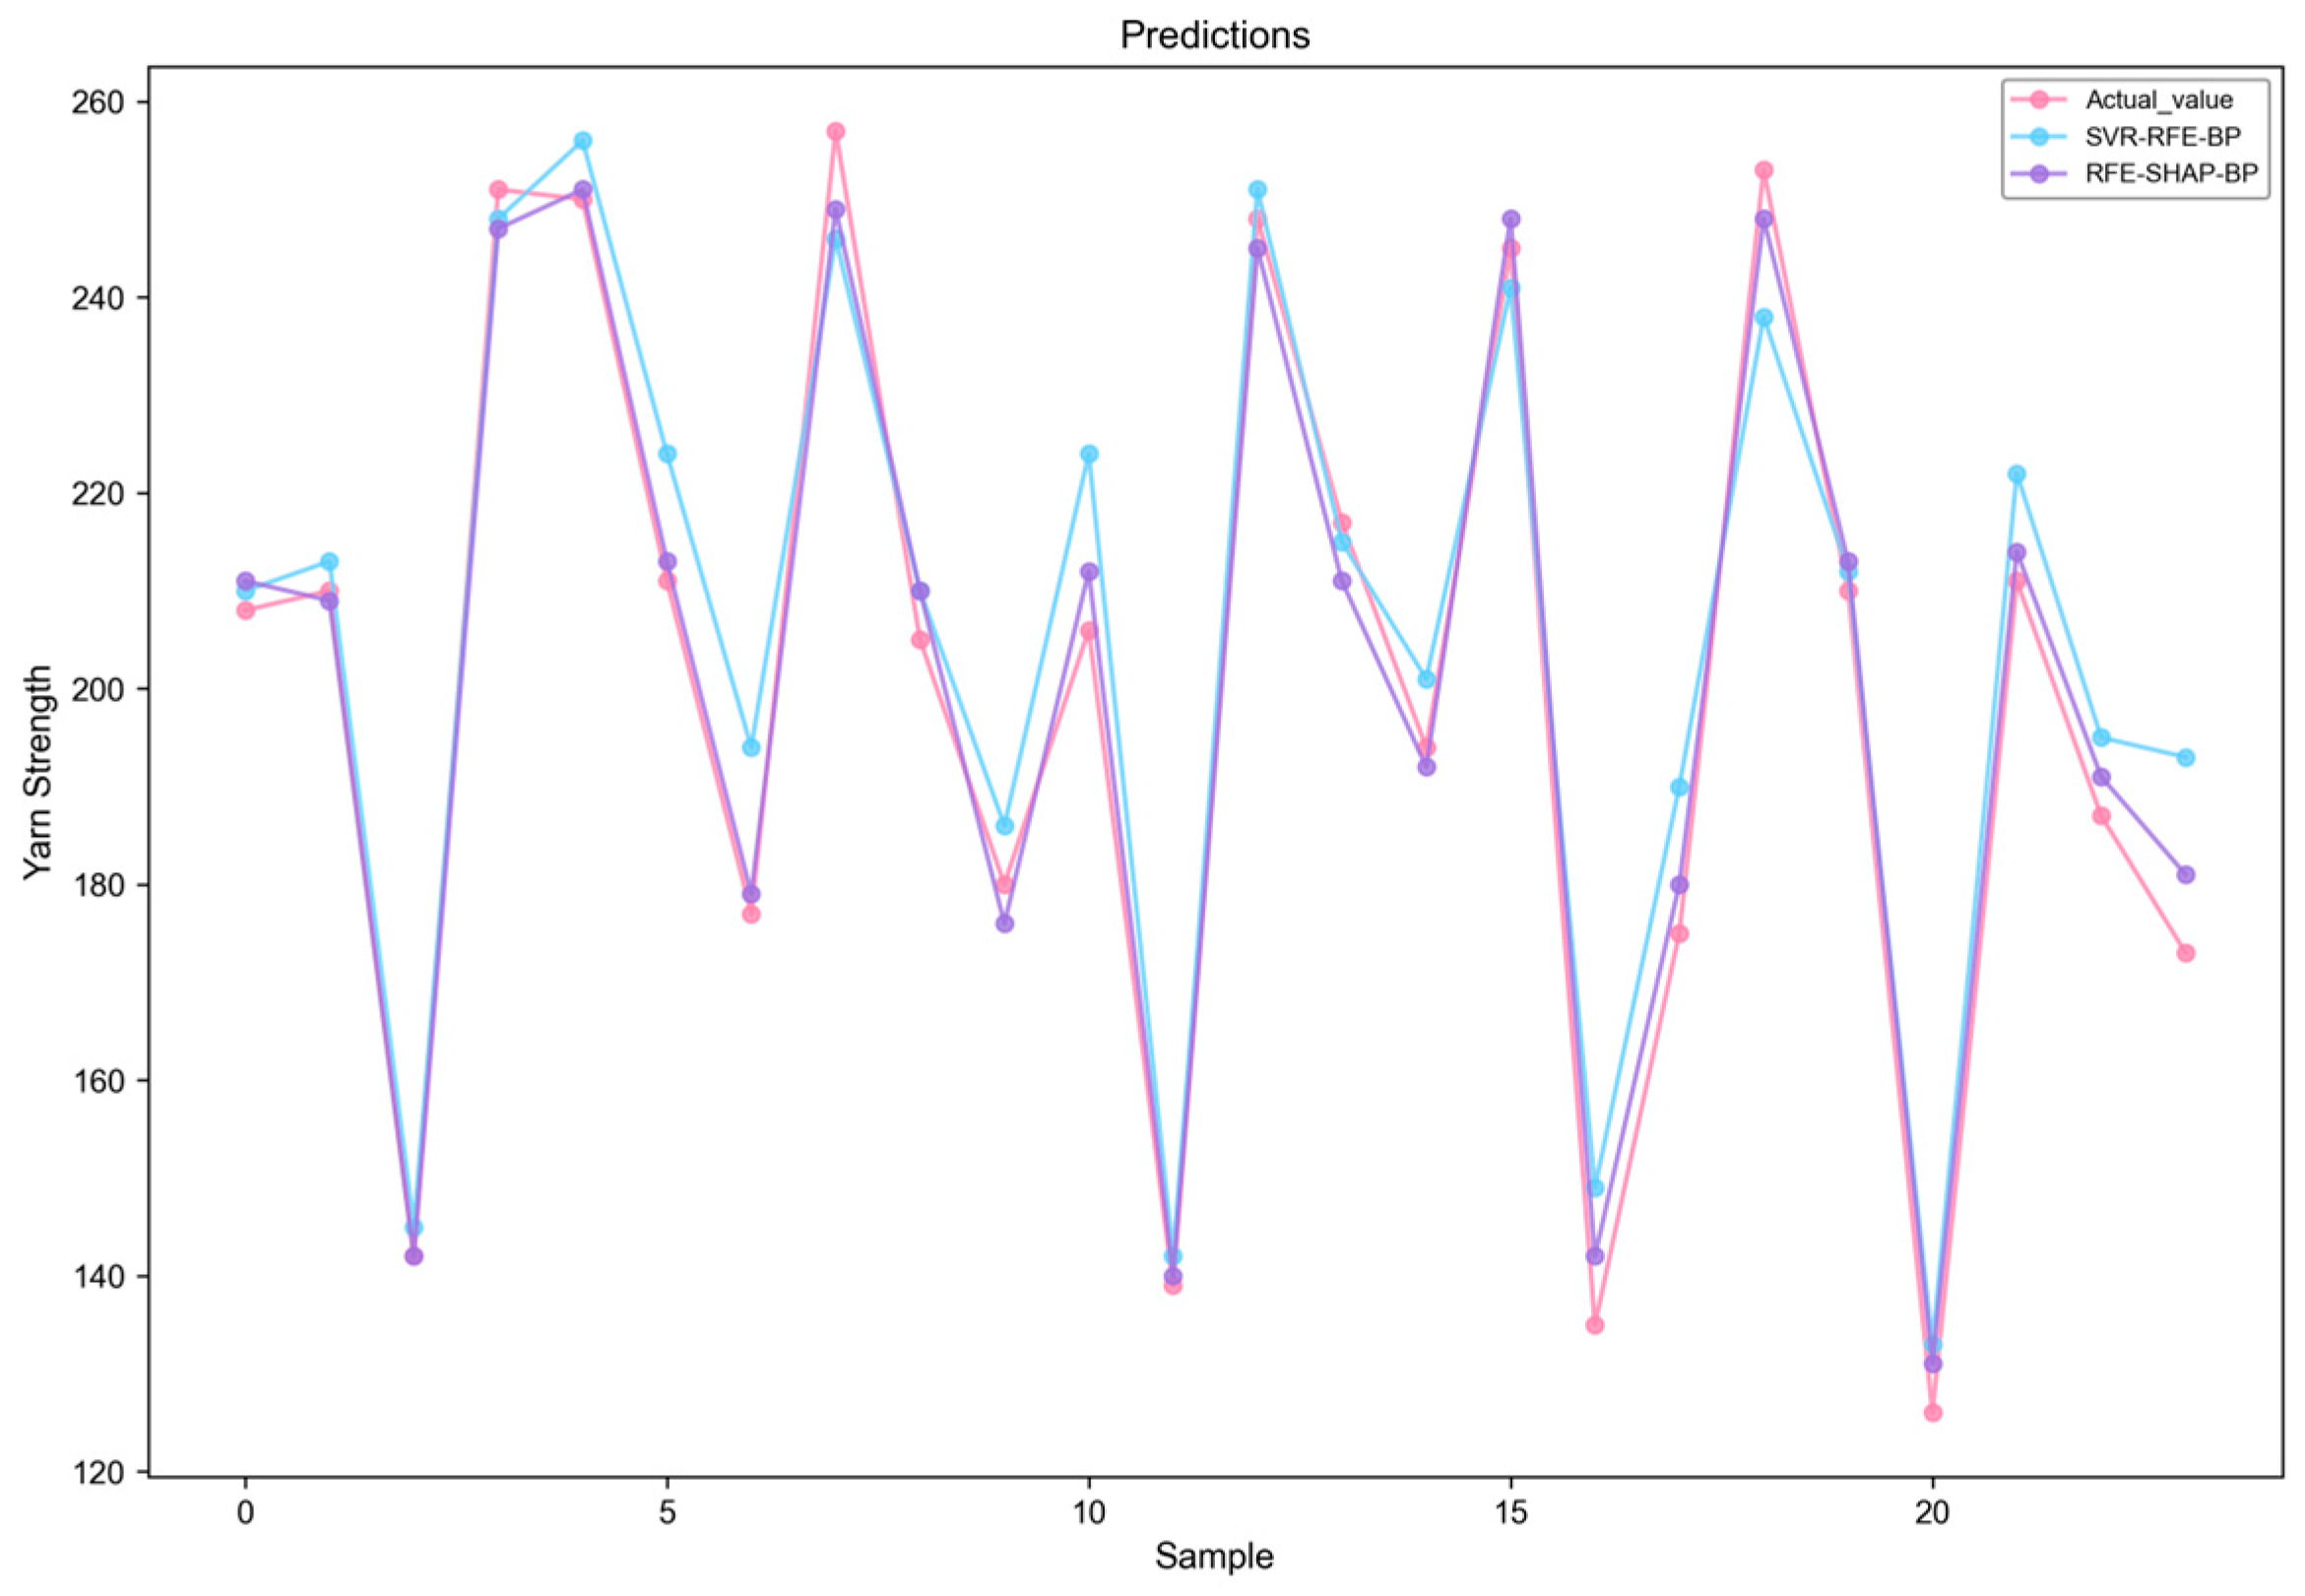
To facilitate the distinction of the experimental results, the four-layer BP neural network established based on the optimal feature subset obtained by SVR-RFE processing is represented by SVR-RFE-BP, and the four-layer BP neural network established based on the optimal feature subset obtained by RFE-SHAP processing is represented by RFE-SHAP-BP. In this experiment, the prediction models constructed using the optimal feature subsets obtained by different algorithms are used to predict the two yarn quality indicators, namely, yarn strength and hairiness H-value, and the results are compared. A comparison of the predicted and true values of the yarn strength prediction model based on SVR-RFE-BP and the yarn strength prediction model based on RFE-SHAP-BP is shown in Figure 9.
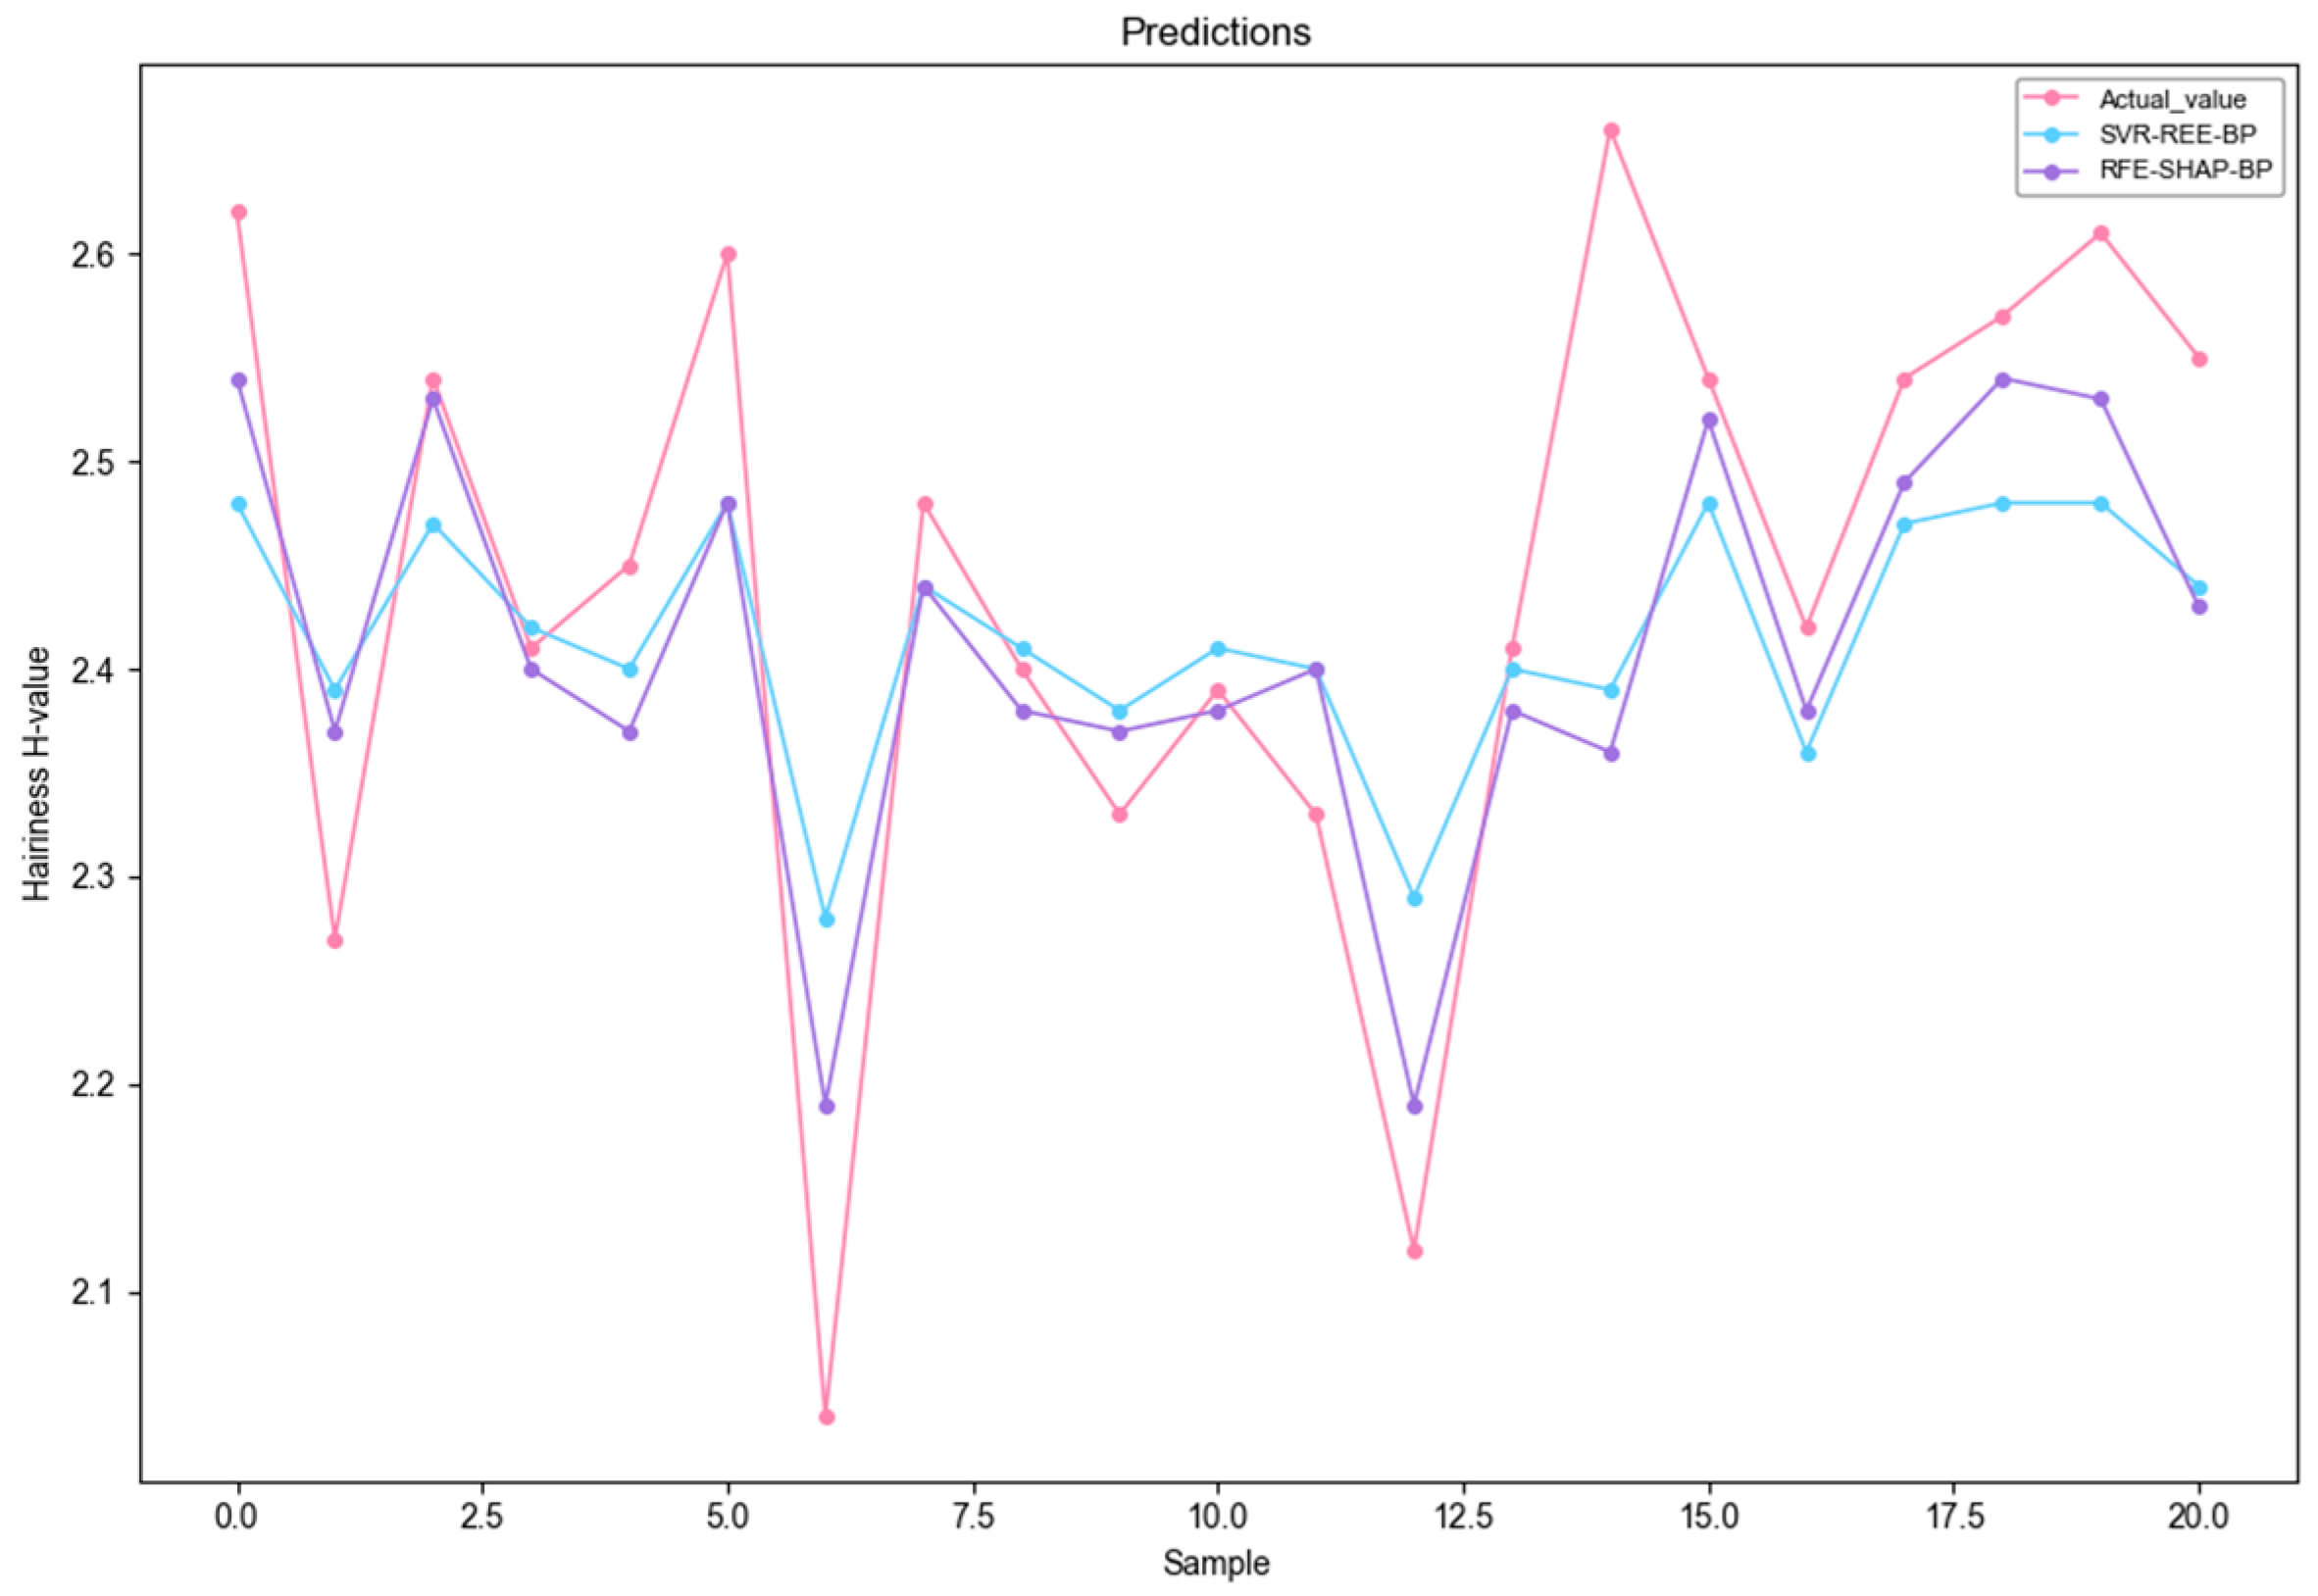
A comparison of the predicted and true values of the hairiness H-value prediction model based on SVR-RFE-BP and the hairiness H-value prediction model based on RFE-SHAP-BP is shown in Figure 10.
The detailed prediction data corresponding to Figure 9 and Figure 10 is listed in Table 4.
To evaluate the improvement effect of the new method more accurately, the average RMSE, MAE, and MAPE of the test set under multiple groups of random seeds when predicting yarn strength and hairiness H-value based on two feature selection algorithms are shown in Table 5.
As shown in Figure 9 and Table 4, when RFE-SHAP-BP is used to predict yarn strength, its prediction value curve is generally closer to the true value, and only for individual samples is the prediction result of SVR-RFE-BP more accurate. As shown in Figure 10 and Table 4, when predicting the hairiness H-value, the prediction value of RFE-SHAP-BP for the test sample is also closer to the true value than SVR-RFE-BP. According to Table 5, when predicting yarn strength and hairiness H-value, the RMSE and MAE evaluation effects of RFE-SHAP-BP are better than those of SVR-RFE-BP; for the MAPE, the value of RFE-SHAP-BP RFE-SHAP-BP achieves 2.100% and 2.778% for the two quality metrics, respectively, both below 3%. When predicting strength, the evaluation effect is improved by 0.73 percentage points compared with SVR-RFE-BP, and when predicting the hairiness H-value, the evaluation effect is improved by 1.01 percentage points compared with SVR-RFE-BP.
To further validate the proposed framework, two additional feature selection methods—LASSO (a regularization-based linear method) and Mutual Information (MI) (a filter-based non-linear method)—were integrated into the BP-ANN for comparison. As shown in Table 5, LASSO yields the highest error, suggesting that simple linear feature elimination cannot adequately represent the complex spinning process. While MI captures non-linear dependencies, its performance remains inferior to that of the RFE-SHAP-BP model. This is attributed to the fact that RFE-SHAP explicitly evaluates feature interactions, which are critical for accurate yarn quality prediction but are overlooked by MI.
To rigorously validate the superiority of the RFE-SHAP-BP model, a paired t-test was performed on the absolute prediction errors between SVR-RFE-BP and RFE-SHAP-BP across the test samples. The statistical analysis yielded a p-value of 0.039 (assuming p < 0.05 as the threshold), indicating that the reduction in prediction error achieved by the proposed RFE-SHAP framework is statistically significant and not due to random fluctuations. This further confirms the robustness of the SHAP-based feature selection in capturing essential spinning dynamics.

5. Conclusions

This study proposes an improved SVR-RFE feature selection algorithm for yarn quality prediction. With the help of SHapley value theory, it considers the permutations and combinations of all features and the synergistic effects between features, and “fairly” distributes the marginal contribution of each feature to the prediction result, thereby providing a more explanatory yarn data feature selection strategy, optimizing the feature screening process and further overcoming the input feature redundancy of the yarn quality prediction model under a small-sample environment. In addition, a yarn strength and hairiness H-value prediction model is established in combination with a four-layer neural network. On the test dataset, the average absolute percentage errors of the yarn strength and hairiness H-value predictions reached approximately 2.1% and 2.78%, respectively, and the prediction performance was improved. This study has certain theoretical value and can guide the production process of textile enterprises to a certain extent. However, some limitations should be acknowledged. The current model was validated on a specific dataset from a single enterprise; therefore, its scalability to larger, multi-source industrial datasets remains to be further explored. Additionally, while this study focused on yarn strength and hairiness, future research will extend the RFE-SHAP framework to other key quality indicators, such as yarn evenness and elongation, to further enhance its universal applicability in diverse spinning scenarios.

Author Contributions

Methodology, C.W., B.Z. and X.W.; Software, T.L.; Validation, B.Z. and X.W.; Writing—original draft, T.L.; Writing—review & editing, C.W., T.L., B.Z. and X.W.; Visualization, T.L.; Project administration, C.W. All authors have read and agreed to the published version of the manuscript.

Funding

This research received no external funding.

Institutional Review Board Statement

Not applicable.

Informed Consent Statement

Not applicable.

Data Availability Statement

The data presented in this study are openly available in yarn_quality_dataset at https://github.com/wanfengandxingguang-commits/yarn_quality_dataset.git (accessed on 23 March 2026).

Conflicts of Interest

The authors declare no conflict of interest.

References

  1. Liang, Q.; Zhang, L. Inversion of yarn production process parameters based on particle swarm genetic algorithm. Cotton Text. Technol. 2024, 52, 1–7. [Google Scholar] [CrossRef]
  2. Zhang, B.; Song, J.; Zhao, S. Prediction of yarn strength based on an expert weighted neural network optimized by particle swarm optimization. Text. Res. J. 2021, 91, 2911–2924. [Google Scholar] [CrossRef] [Scilit]
  3. Elkateb, S.N. Prediction of mechanical properties of woven fabrics by ANN. Fibres Text. East. Eur. 2022, 30, 54–59. [Google Scholar] [CrossRef] [Scilit]
  4. Balci, O.; Oğulata, S.N.; Şahin, C.; Oğulata, R.T. An artificial neural network approach to prediction of the colorimetric values of the stripped cotton fabrics. Fibers Polym. 2008, 9, 604–614. [Google Scholar] [CrossRef] [Scilit]
  5. Gharehaghaji, A.A.; Shanbeh, M.; Palhang, M. Analysis of two modeling methodologies for predicting the tensile properties of cotton-covered nylon core yarns. Text. Res. J. 2007, 77, 565–571. [Google Scholar] [CrossRef] [Scilit]
  6. Dai, N.; Li, L.; Xu, K.; Lu, Z.; Hu, X.; Yuan, Y. Development of a standardized data collection and intelligent fabric quality prediction system for the weaving department. J. Eng. Fibers Fabr. 2025, 20, 15589250241312778. [Google Scholar] [CrossRef] [Scilit]
  7. Liu, Z.; Chen, N.; Wang, J. A two-layer stacking regression model for predicting yarn quality of small samples. Text. Res. J. 2024, 94, 1096–1110. [Google Scholar] [CrossRef] [Scilit]
  8. Ghanmi, H.; Ghith, A.; Benameur, T. Ring spun yarn quality prediction using hybrid neural networks. J. Text. Inst. 2023, 114, 66–74. [Google Scholar] [CrossRef] [Scilit]
  9. Zhang, J.; Chen, M.; Guo, X.; Fu, Z.; Wang, J. Yarn quality prediction based on particle swarm optimization support vector machine. Cotton Text. Technol. 2024, 52, 16–22. Available online: https://link.cnki.net/urlid/61.1132.TS.20231207.1133.002 (accessed on 23 March 2026).
  10. Liu, Z.; Li, X.; Li, L.; Chen, N.; Wang, J. Applicability analysis of machine learning algorithms for small-sample yarn quality prediction. Cotton Text. Technol. 2024, 52, 27–34. [Google Scholar] [CrossRef]
  11. Zhang, B.; Xu, L.; Wang, Y. Yarn unevenness prediction using generalized regression neural network. J. Internet Technol. 2023, 24, 775–781. [Google Scholar] [CrossRef] [Scilit]
  12. Dai, N.; Jin, H.; Xu, K. Prediction of cotton yarn quality based on attention-GRU. Appl. Sci. 2023, 13, 10003. [Google Scholar] [CrossRef] [Scilit]
  13. Ma, Y. Displacement Prediction of Step-Type Landslides Using PSO-SVR Based on RFE Feature Selection; Chongqing Jiaotong University: Chongqing, China, 2023. [Google Scholar]
  14. Liang, W.; Tian, S.; Yang, X.; Xie, M. Research on the integrated development of port, industry, and city based on grey correlation analysis method—Taking Beibu Gulf Port as an example. China J. Commer. 2025, 34, 142–146. [Google Scholar] [CrossRef]
  15. Zhang, J.; Xu, Y.; Shao, J. Correlation analysis of factors affecting cotton-spinning quality. Cotton Text. Technol. 2023, 51, 22–27. [Google Scholar] [CrossRef]
  16. Lundberg, S.M.; Lee, S.I. A unified approach to interpreting model predictions. Adv. Neural Inf. Process. Syst. 2017, 30, 7874. [Google Scholar] [CrossRef] [Scilit]
  17. Yang, Y.; Li, R. Feature selection for high-dimensional data classification based on machine learning. J. Hunan Univ. Arts Sci. (Nat. Sci. Ed.) 2025, 37, 23–31. [Google Scholar]
  18. Du, Q.; Zhu, Y. Selecting multimodal group features to improve social media rumor detection performance. Comput. Appl. Softw. 2023, 40, 195–201. [Google Scholar] [CrossRef]
  19. Hu, X.; Li, D. Research progress on the Shapley value of multi-choice cooperative games. Syst. Eng.-Theory Pract. 2025, 45, 3925–3938. [Google Scholar] [CrossRef]
Figure 1. Ranking coefficient of the target responses subset of yarn strength analyzed by SVR-RFE.
Algorithms 19 00266 g001
Figure 2. Ranking coefficient of the target responses subset of hairiness H-value analyzed by SVR-RFE.
Algorithms 19 00266 g002
Figure 3. Beeswarm plot of the contribution ranking of the features of yarn strength.
Algorithms 19 00266 g003
Figure 4. Beeswarm plot of the contribution ranking of the features of hairiness H-value.
Algorithms 19 00266 g004
Figure 5. SHAP dependency graph of the features of yarn strength. (a) SHAP dependency graph of yarn number. (b) SHAP dependency graph of raw cotton impurity rate.
Algorithms 19 00266 g005
Figure 6. SHAP dependency graph of the features of hairiness H-value. (a) SHAP dependency graph of yarn number. (b) SHAP dependency graph of combed AFIS short fiber rate1.
Algorithms 19 00266 g006
Figure 7. SHAP value of the feature subset of yarn strength analyzed by RFE-SHAP.
Algorithms 19 00266 g007
Figure 8. SHAP value of the feature subset of hairiness H-value analyzed by RFE-SHAP.
Algorithms 19 00266 g008
Figure 9. Comparison of yarn strength prediction results based on SVR-RFE-BP and RFE-SHAP-BP models.
Algorithms 19 00266 g009
Figure 10. Comparison of hairiness H-value prediction results based on SVR-RFE-BP and RFE-SHAP-BP models.
Algorithms 19 00266 g010
Table 1. Theoretical comparison of different feature selection methods.
Method FeaturesStandard RFESVR-RFERFE-SHAP (Ours)
Evaluator DependencyLinear or tree-based models onlySVR onlyModel-agnostic
Ranking CriterionModel coefficients (w)SVR weight vectorsSHAP marginal contributions
Synergistic InteractionsNot consideredNot consideredExplicitly quantified
InterpretabilityLow (Black-box)Medium (weights only)High (local & global)
Selection MechanismSimple eliminationWeight-based recursionGame-theoretic recursion
Table 2. Optimal feature subsets of two yarn quality indicators analyzed by SVR-RFE.
Yarn StrengthHairiness H-Value
yarn numberyarn number
raw cotton strength/(cN/tex)drafting multiple
raw cotton short fiber rate/%combed AFIS short fiber rate2/(Neps/g)
spun yarn twist shrinkage/%spun yarn twist shrinkage/%
combed AFIS short fiber rate2/(Neps/g)combed noil rate/%
combed AFIS short fiber rate1/(Neps/g)combed AFIS short fiber rate1/(Neps/g)
carded AFIS neps2/(Neps/g)raw cotton short fiber rate/%
carded AFIS short fiber rate2/(Neps/g)raw cotton micronaire value
carded AFIS short fiber rate1/(Neps/g)carded AFIS short fiber rate2/(Neps/g)
drafting multiplecarded noil rate/%
combed AFIS cotton neps2/(Neps/g)carded AFIS short fiber rate1/(Neps/g)
raw cotton micronaire valuecombed AFIS cotton neps1/(Neps/g)
combed AFIS cotton neps1/(Neps/g)combed AFIS cotton neps2/(Neps/g)
average length of the right half of raw cotton/mmaverage length of the right half of raw cotton/mm
raw cotton impurity rate/%raw cotton neps/(Neps/g)
carded AFIS neps1/(Neps/g)
carded AFIS neps2/(Neps/g)
raw cotton impurity rate/%
Table 3. Optimal feature subsets of two yarn quality indicators analyzed by RFE-SHAP.
Yarn StrengthHairiness H-Value
yarn numberyarn number
average length of the right half of raw cotton/mmraw cotton micronaire value
raw cotton strength/(cN/tex)spun yarn twist shrinkage/%
raw cotton short fiber rate/%average length of the right half of raw cotton/mm
combed AFIS short fiber rate1/(Neps/g)raw cotton maturity
carded AFIS short fiber rate2/(Neps/g)raw cotton short fiber rate/%
raw cotton micronaire valueraw cotton length uniformity/%
carded AFIS short fiber rate1/(Neps/g)combed AFIS short fiber rate2/(Neps/g)
combed AFIS short fiber rate2/(Neps/g)carded noil rate/%
spun yarn twist shrinkage/%roving twist shrinkage/%
combed noil rate/%combed AFIS short fiber rate1/(Neps/g)
carded noil rate/%carded AFIS short fiber rate2/(Neps/g)
drafting multipleraw cotton strength/(cN/tex)
combed AFIS cotton neps1/(Neps/g)carded AFIS short fiber rate1/(Neps/g)
raw cotton neps/(Neps/g)drafting multiple
carded AFIS cotton neps2/(Neps/g)raw cotton neps/(Neps/g)
combed AFIS cotton neps2/(Neps/g)combed AFIS cotton neps2/(Neps/g)
carded AFIS cotton neps1/(Neps/g)carded cotton line speed/(m/min)
carded cotton line speed/(m/min)
raw cotton impurity rate/%
Table 4. Detailed prediction data for both models.
SamplesYarn StrengthHairiness H-Value
ActualSVR-RFE-BPRFE-SHAP-BPActualSVR-RFE-BPRFE-SHAP-BP
1207.5208.201210.8452.622.4932.540
2209.6213.380209.4462.272.3982.368
3142.9149.496141.5932.542.4512.531
4251.1247.255247.8512.412.4152.397
5249.7256.090251.0122.452.3702.407
6211224.207212.8152.62.4872.486
7176.5193.570178.9322.042.2612.189
8257.4249.500248.8652.482.4432.446
9203.4204.767210.2342.42.4082.376
10178.7185.625175.7132.3352.3972.367
11205.6223.720211.7372.392.3892.378
12138.9141.248139.9762.332.3972.382
13242.4250.935247.3792.122.2802.184
14216.7212.790210.6512.382.4142.376
15191.9200.495191.4502.662.3502.460
16245.1237.598248.5402.5452.4752.520
17134.8144.415142.1962.422.4912.380
18174.8190.261179.9382.542.4642.491
19253.2238.551247.9932.572.5072.540
20208.4210.221213.1022.612.4962.528
21125.8130.367130.5162.552.4252.430
Table 5. The two models are compared using multiple evaluation indicators.
ModelYarn StrengthHairiness H-Value
RMSEMAEMAPE
(%)
RMSEMAEMAPE
(%)
LASSO-BP6.8455.2103.5200.1380.1054.412
MI-BP6.1244.6523.0150.1220.0984.020
SVR-RFE-BP5.8204.3192.8300.1140.0913.785
RFE-SHAP-BP3.6683.0492.1000.0940.0682.778
Disclaimer/Publisher’s Note: The statements, opinions and data contained in all publications are solely those of the individual author(s) and contributor(s) and not of MDPI and/or the editor(s). MDPI and/or the editor(s) disclaim responsibility for any injury to people or property resulting from any ideas, methods, instructions or products referred to in the content.