Article

Series Arc Fault Detection Method Based on Time Domain Imaging and Long Short-Term Memory Network for Residential Applications

by
Ruobo Chu
1,2,
Schweitzer Patrick
3 and
Kai Yang
4,*
1
College of Engineering, Quanzhou Vocational, Technical University, Quanzhou 362000, China
2
College of Physics and Information Engineering, Quanzhou Normal University, Quanzhou 362000, China
3
Institute Jean Lamour, University of Lorraine, F-54000 Nancy, France
4
College of Mechanical Engineering and Automation, Huaqiao University, Xiamen 361021, China
*
Author to whom correspondence should be addressed.
Algorithms 2025, 18(8), 497; https://doi.org/10.3390/a18080497
Submission received: 18 June 2025 / Revised: 4 August 2025 / Accepted: 6 August 2025 / Published: 11 August 2025
(This article belongs to the Special Issue AI and Computational Methods in Engineering and Science)

Abstract

This article presents a novel method for detecting series arc faults (SAFs) in residential applications using time-domain imaging (TDI) and Long Short-Term Memory (LSTM) networks. The proposed method transforms current signals into grayscale images by filtering out the fundamental frequency, allowing key arc fault characteristics—such as high-frequency noise and waveform distortions—to become visually apparent. The use of Ensemble Empirical Mode Decomposition (EEMD) helped isolate meaningful signal components, although it was computationally intensive. To address real-time requirements, a simpler yet effective TDI method was developed for generating 2D images from current data. These images were then used as inputs to an LSTM network, which captures temporal dependencies and classifies both arc faults and appliance types. The proposed TDI-LSTM model was trained and tested on 7000 labeled datasets across five common household appliances. The experimental results show an average detection accuracy of 98.1%, with reduced accuracy for loads using thyristors (e.g., dimmers). The method is robust across different appliance types and conditions; comparisons with prior methods indicate that the proposed TDI-LSTM approach offers superior accuracy and broader applicability. Trade-offs in sampling rates and hardware implementation were discussed to balance accuracy and system cost. Overall, the TDI-LSTM approach offers a highly accurate, efficient, and scalable solution for series arc fault detection in smart home systems.

1. Introduction

Home fires resulting from electrical faults or malfunctions primarily involve some type of arcing, which occurs due to the unintended discharge of electrical current between conductors. Data from the National Fire and Rescue Administration of China, released in 2023 [1], indicates that 42.9% of fires in self-built residential buildings are attributed to electrical problems. The main causes include electrical overloading, improper wiring, unauthorized charging practices, and incidents related to arc faults. The fire protection department of the United States provides more detailed statistics on the specific causes of electrical fires. According to the latest statistics from the National Fire Protection Association (NFPA), arcing was identified as the heat source in over three out of five fires (63%) involving electrical failure or malfunction in homes from 2015 to 2019 [2].
According to statistical reports and disaster analysis by the National Fire Protection Association, the discharge phenomenon associated with arc faults can generate sufficient heat to ignite fires, making it one of the primary causes of electrical fires [3]. The National Electrical Code (NEC) in the United States mandates the installation of Arc-Fault Circuit Interrupters (AFCIs) on indoor low-voltage power lines [4]. Similarly, in 2014, China issued two national standards [5,6] that recommend the installation of Arc-Fault Detection Devices (AFDDs).
According to the American Standard UL1699 [7], arc faults are classified into four types, as illustrated in Figure 1. Parallel arc faults and grounding arc faults typically occur due to short circuits caused by damage to the insulation material between transmission lines. This damage results in a noticeable current amplitude between two conductors, sufficient to ignite an arc but not significant enough to trigger a short-circuit breaker. Series arcs, on the other hand, are caused by damaged conductors or loose connections, leading to localized hot spots and carbonization of the insulation material near the conductor. The current in a series arc is slightly lower than that in a normal operating state. Generally, complex arc faults are also considered to be a type of SAF. In summary, the traditional protection technologies, such as those for short circuits, overcurrent, overload, and leakage, are ineffective in detecting arc faults in circuits, particularly SAFs.
To further investigate the mechanisms of arc generation, researchers aim to use mathematical formulae to describe the relationships between various arc parameters. Research on arc mathematical models dates back to the 1940s, primarily focusing on stable arcs or high-current arcs to reveal the fundamental characteristics of arcing. However, due to the complexity of arcs and the limitations of model applicability, research on arc mathematical models has largely remained at the simulation stage [8,9].
Arc faults are typically accompanied by arc sounds (including ultrasound noise), arc light, high temperatures, and electromagnetic radiation, all of which can serve as indicators for arc fault detection. However, these methods have limitations, primarily because they often require precise knowledge of the fault’s location. As a result, they are most commonly used in switch cabinets [10,11,12,13]. Due to the relative ease of measuring current and voltage at high frequencies in power lines, these electrical parameters are ideal for detecting arc faults. Under normal operating conditions, although electrical loads may produce current signals at specific frequencies, the signal amplitudes remain largely stable. When an arc fault occurs, however, an unstable high-frequency component emerges in the current signal [14]. Wang et al. proposed a SAF detection method based on voltage’s characteristic energy magnitude and the mapping distance of phase distribution. Their experimental results demonstrate that this method effectively detects faults across various load types and line parameters [15]. Li et al. introduced a feature selection method that combines the Euclidean distance, classifier criterion, maximum relevance, minimum redundancy, and clustering indices. This approach filters out weakly correlated features and redundant features across the time, frequency, and time–frequency domains. It enables accurate and rapid arc-fault detection, with detection accuracy consistently exceeding 98.2%, showing strong robustness and stability [16].
With the rapid advancement of artificial intelligence (AI) technology, data-driven methods based on machine learning are increasingly being applied to arc-fault diagnosis, making it a key area of research in arc detection. In Refs. [17,18], current signals from various appliances were sampled at 25 kHz, and five typical loads were analyzed. These loads were grouped into three classes based on their linear harmonic characteristics. For each category, a dedicated fully connected neural network was developed to identify series arc faults. The approach yielded promising results, achieving real-time data acquisition on a 32-bit embedded device. However, the relatively low sampling rate posed a significant limitation, potentially leading to errors in detecting arc faults across other types of electrical loads.
Convincing results have also been achieved in arc-fault detection by combining discrete wavelet transform (DWT) with artificial neural networks [19,20,21,22,23] or least-squares support vector machines [24,25]. In Ref. [23], a novel method was proposed that integrates DWT with a deep neural network to detect SAFs, achieving an accuracy of approximately 97.75% across four different load types. In Ref. [24], a learning vector quantization neural network was employed to classify appliance types, followed by a support vector machine—optimized using particle swarm optimization (PSO)—to detect arc faults. Additionally, Ref. [26] applied ensemble machine learning methods for detecting DC SAFs and provided a detailed analysis of how different ensemble methods affect diagnostic performance.
The issue is that while resistive and inductive loads can be identified with good accuracy, the same is not true for loads with internal thyristors, such as dimmers. The accuracy is insufficient because the method relies on analyzing an arc half-wave to diagnose the object. In an arc half-wave, the high-frequency characteristics of the arc appear randomly. If these characteristics manifest during the thyristor’s closure, the arc’s characteristic signal will be very weak, potentially confusing it with a normal state and leading to misjudgment.
Another challenge is that the convolution operation involves a large number of floating-point multiplications, which can be difficult to implement efficiently on an embedded system. The compression and quantization are necessary for hardware implementation. Typically, such operations can only be deployed on FPGA devices, which significantly increases costs [27,28].
To address these issues, a preprocessing method based on two-dimensional (2D) imaging is proposed. This approach converts the current signal—after filtering out the fundamental frequency in the time domain—into 2D grayscale images. Building on this, a novel method called time-domain imaging Long Short-Term Memory (TDI-LSTM) is introduced to enhance the accuracy and reliability of the SAF detector. This innovative approach enables the simultaneous detection of both load type and arc fault, and its effectiveness has been validated across five typical household appliances.

2. Signal Acquisition and Analysis

2.1. Experimental Platform Construction

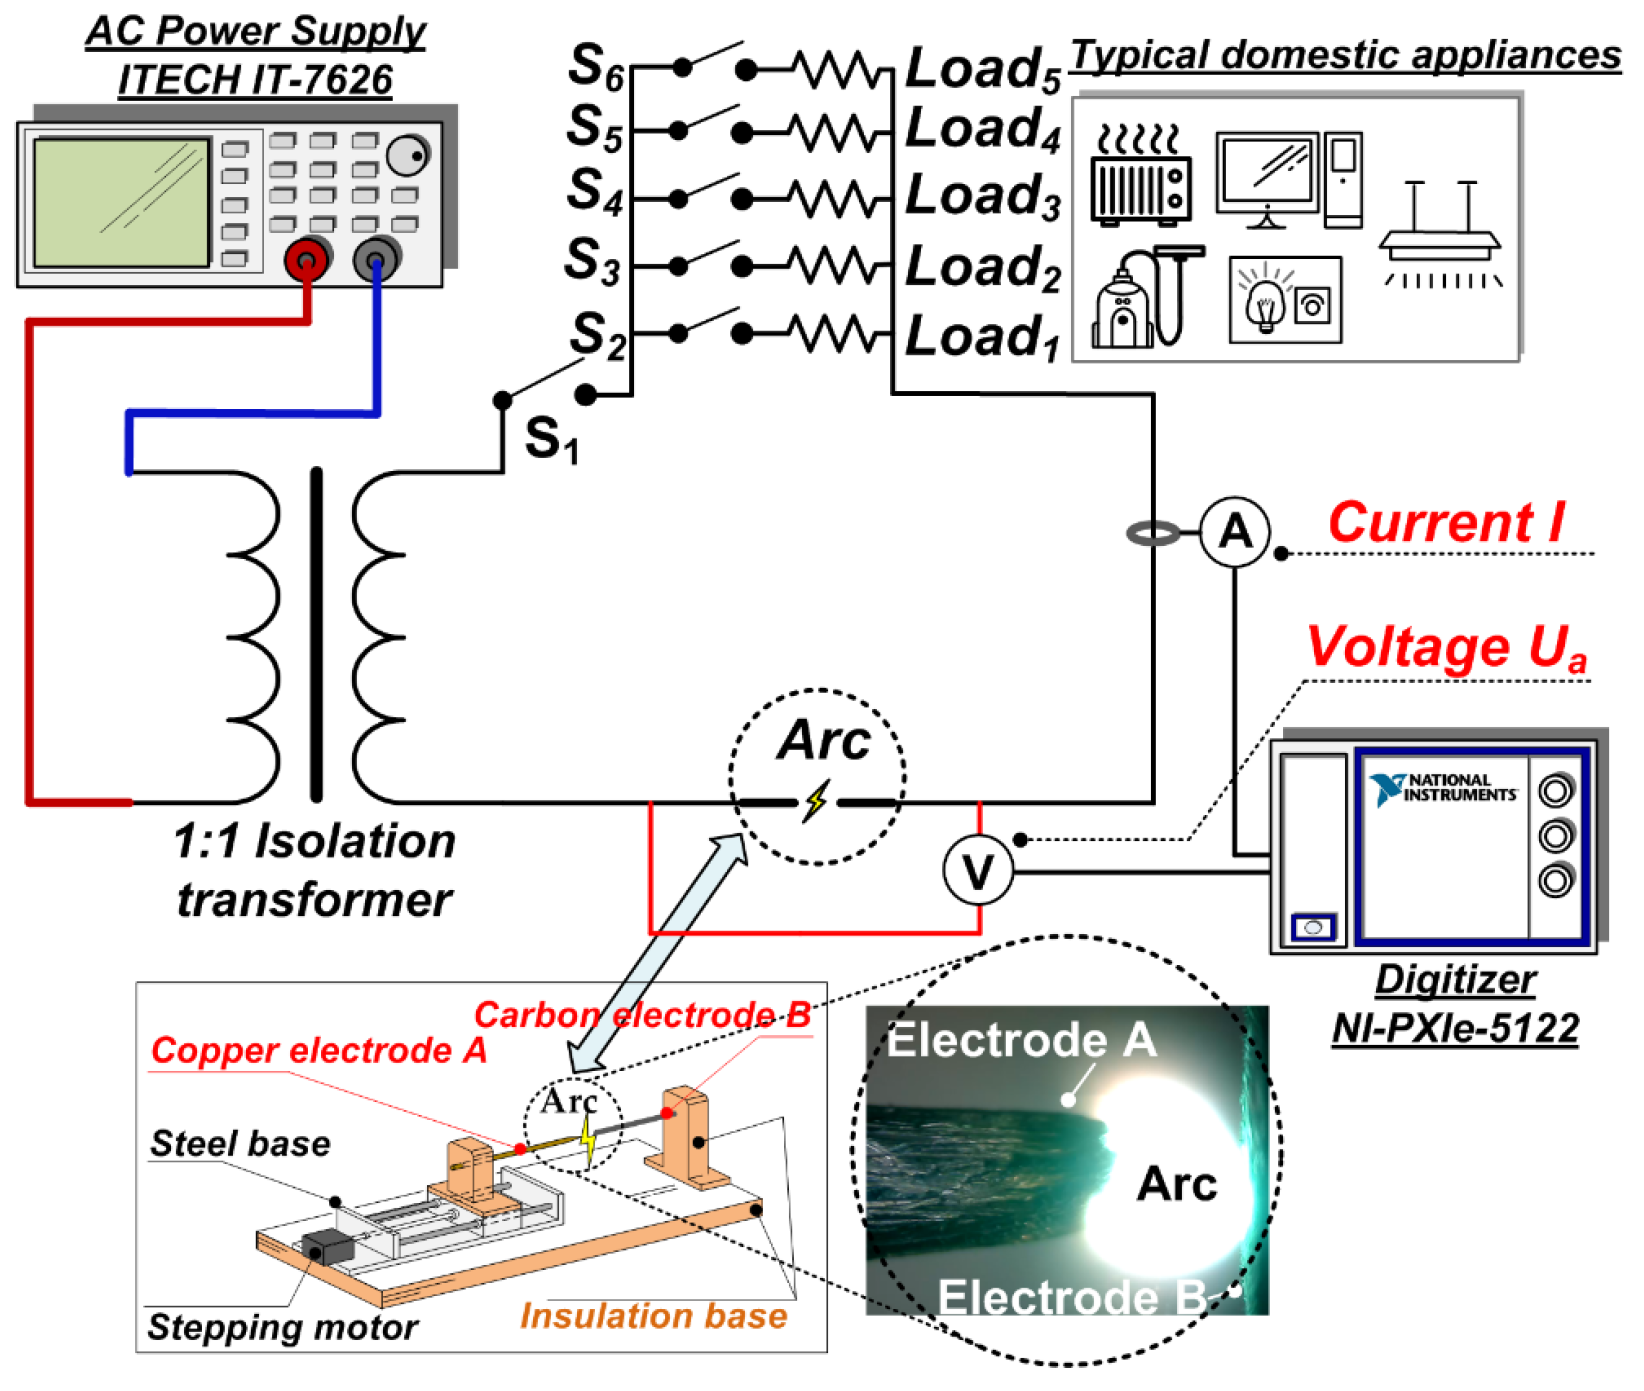
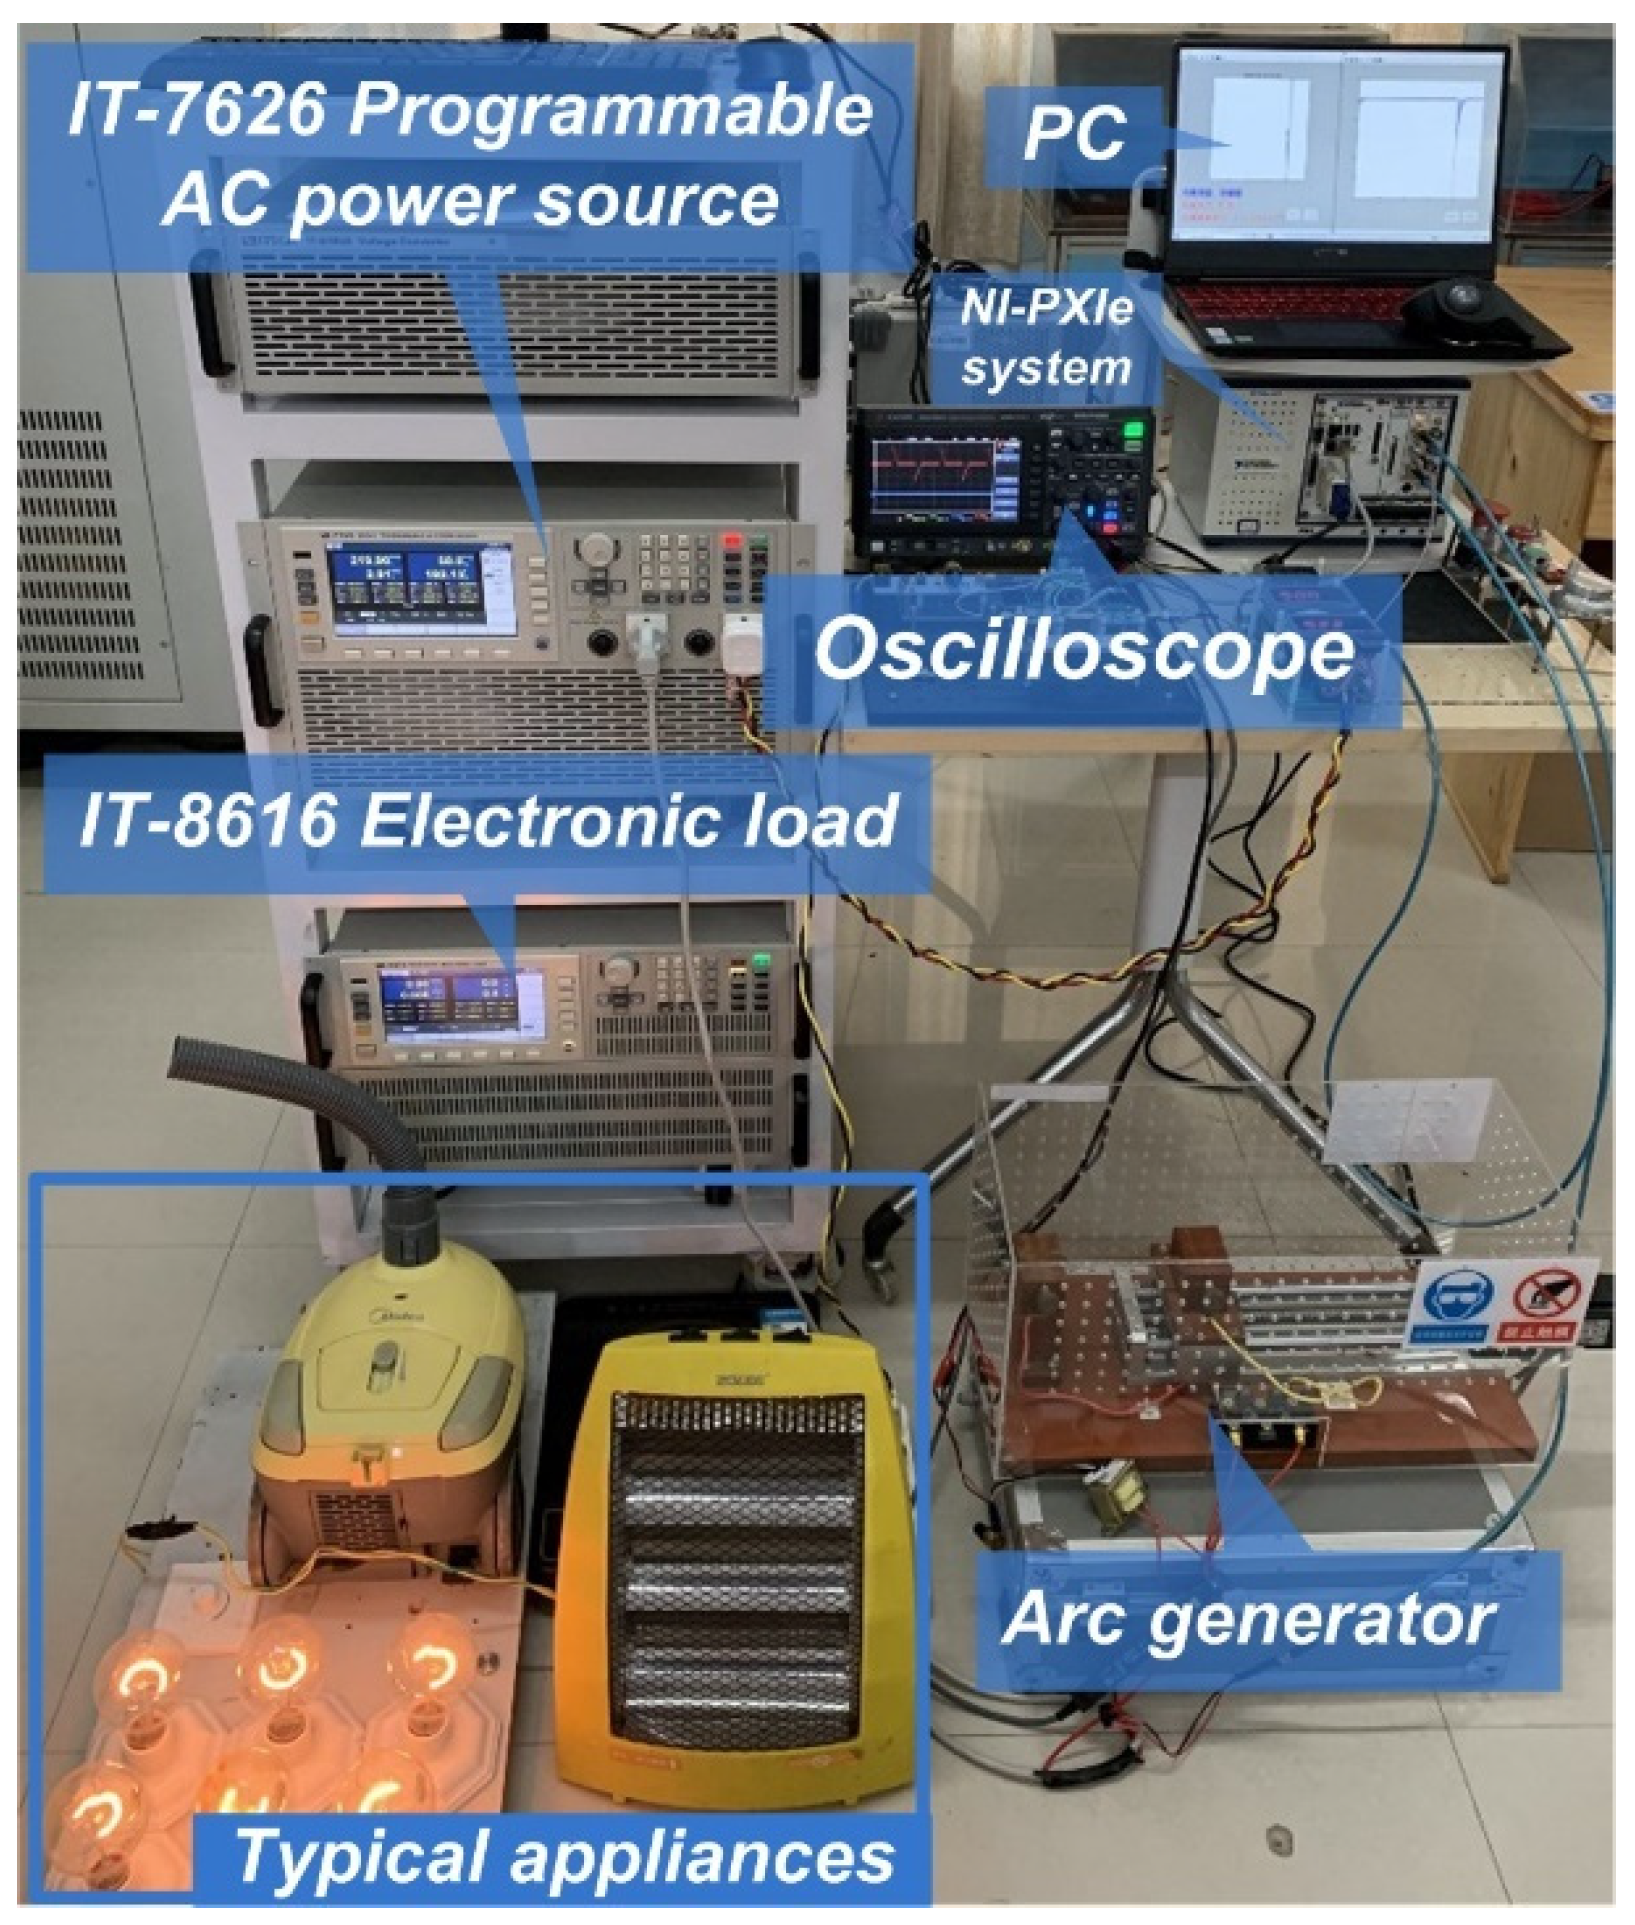
An arc fault acquisition experimental platform was constructed in accordance with the UL1699 standard [7]. The experimental schematic and experimental bench are shown in Figure 2 and Figure 3, respectively. The primary equipment includes an adjustable arc generator, which uses carbon and copper rods as electrodes, along with relevant instrumentation. The parameters of the equipment are detailed in Table 1. The five typical household appliances tested were a vacuum cleaner (800 W), fluorescent lamps (80 W), a dimmer (800 W), an electric heater (1.2 kW), and a desktop computer (450 W).
The AC power, rated at 220 V and 50 Hz, was supplied by the IT-7626 power supply and electrically isolated from hazardous voltages using a 1:1 isolation transformer. The transformer does not affect the arc characteristics. The current signal from the circuit and the voltage signals across the arc were collected. The sensitivity of the sensor current sensor is important, because the noise produced by the arc fault must be present in the signatures. The selected current sensor features a flat frequency response, and with the system’s sampling rate of 1 MS/s, aliasing issues are effectively prevented. Measuring the inter-arc voltage helps verify whether an arc has occurred. The isolation transformer ensures safety by preventing potential arcing hazards from affecting the power source.
The raw data collected from this experimental setup is publicly available as Open Access (OA) on Zenodo.com [3].

2.2. Analysis of Typical Appliance Current Waveform

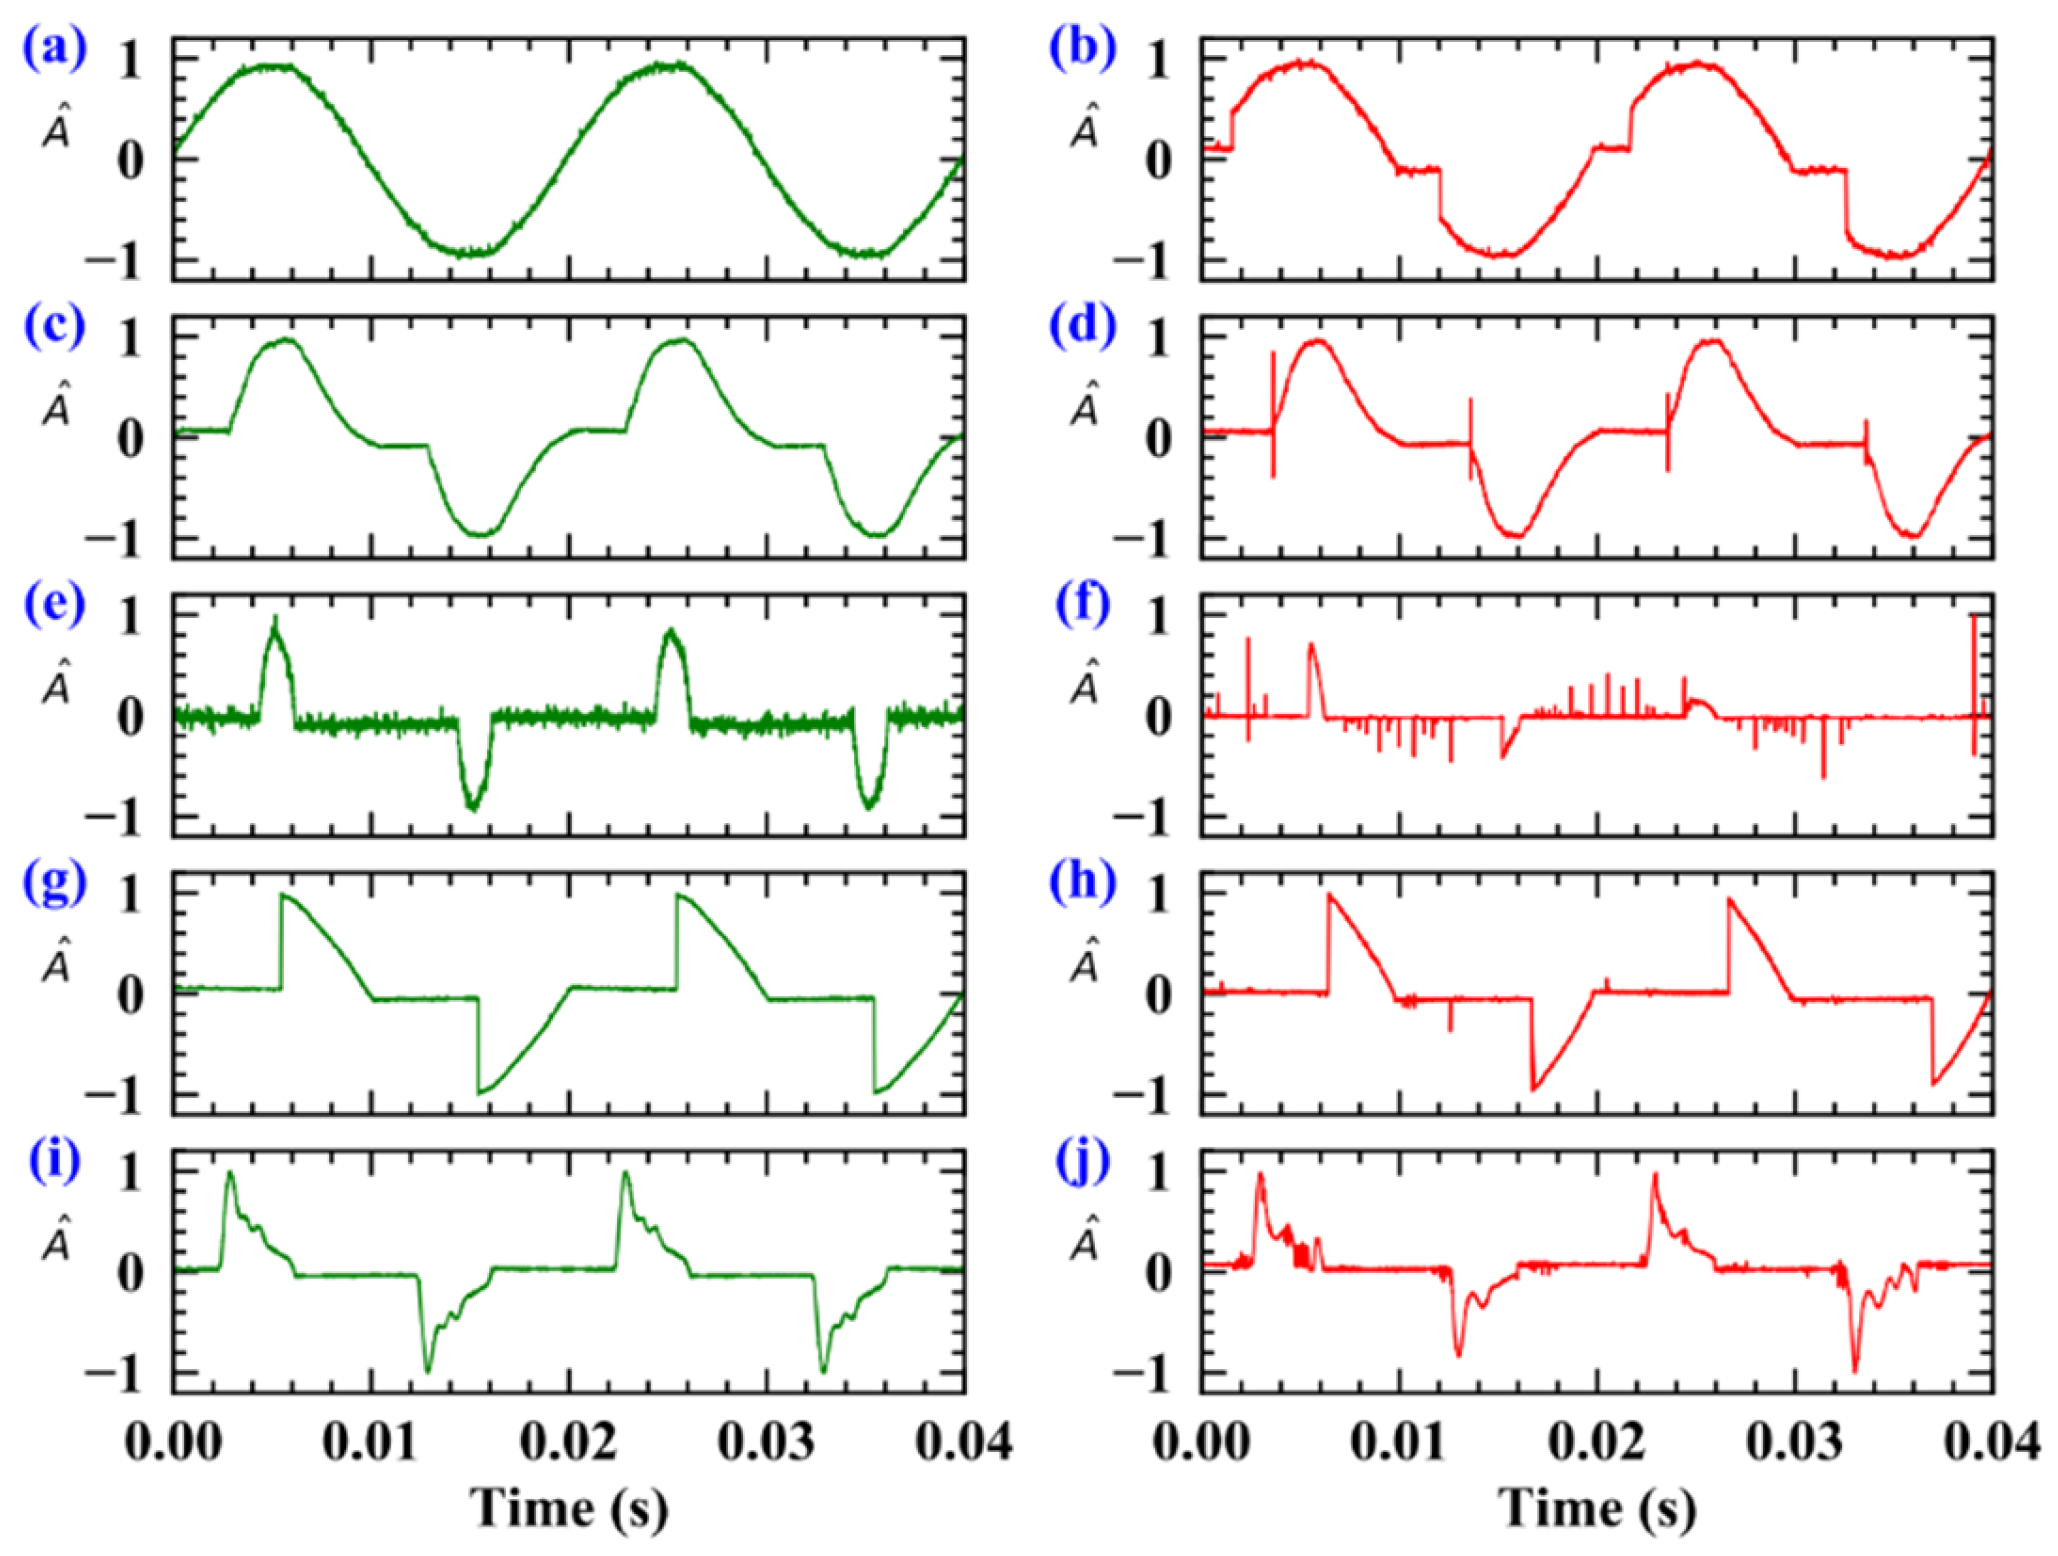
The sub-graphs in Figure 4 illustrate the current waveforms of five typical loads (after normalization). The left column displays current measurements during steady-state operation, while the right column shows measurements with the arc faults. By comparing these columns, it is evident that the current waveforms vary significantly for each type of load. When an arc fault ignites, the current waveform exhibits numerous anomalies, such as increased high-frequency harmonic component, waveform distortion, or amplitude reduction, along with pulse or peak shapes. The resistive load also exhibits a “flat shoulder” characteristic of current at zero crossings, as shown in Figure 4b. Due to the random nature of arc fault characteristics, the current signal loses its strict periodicity.
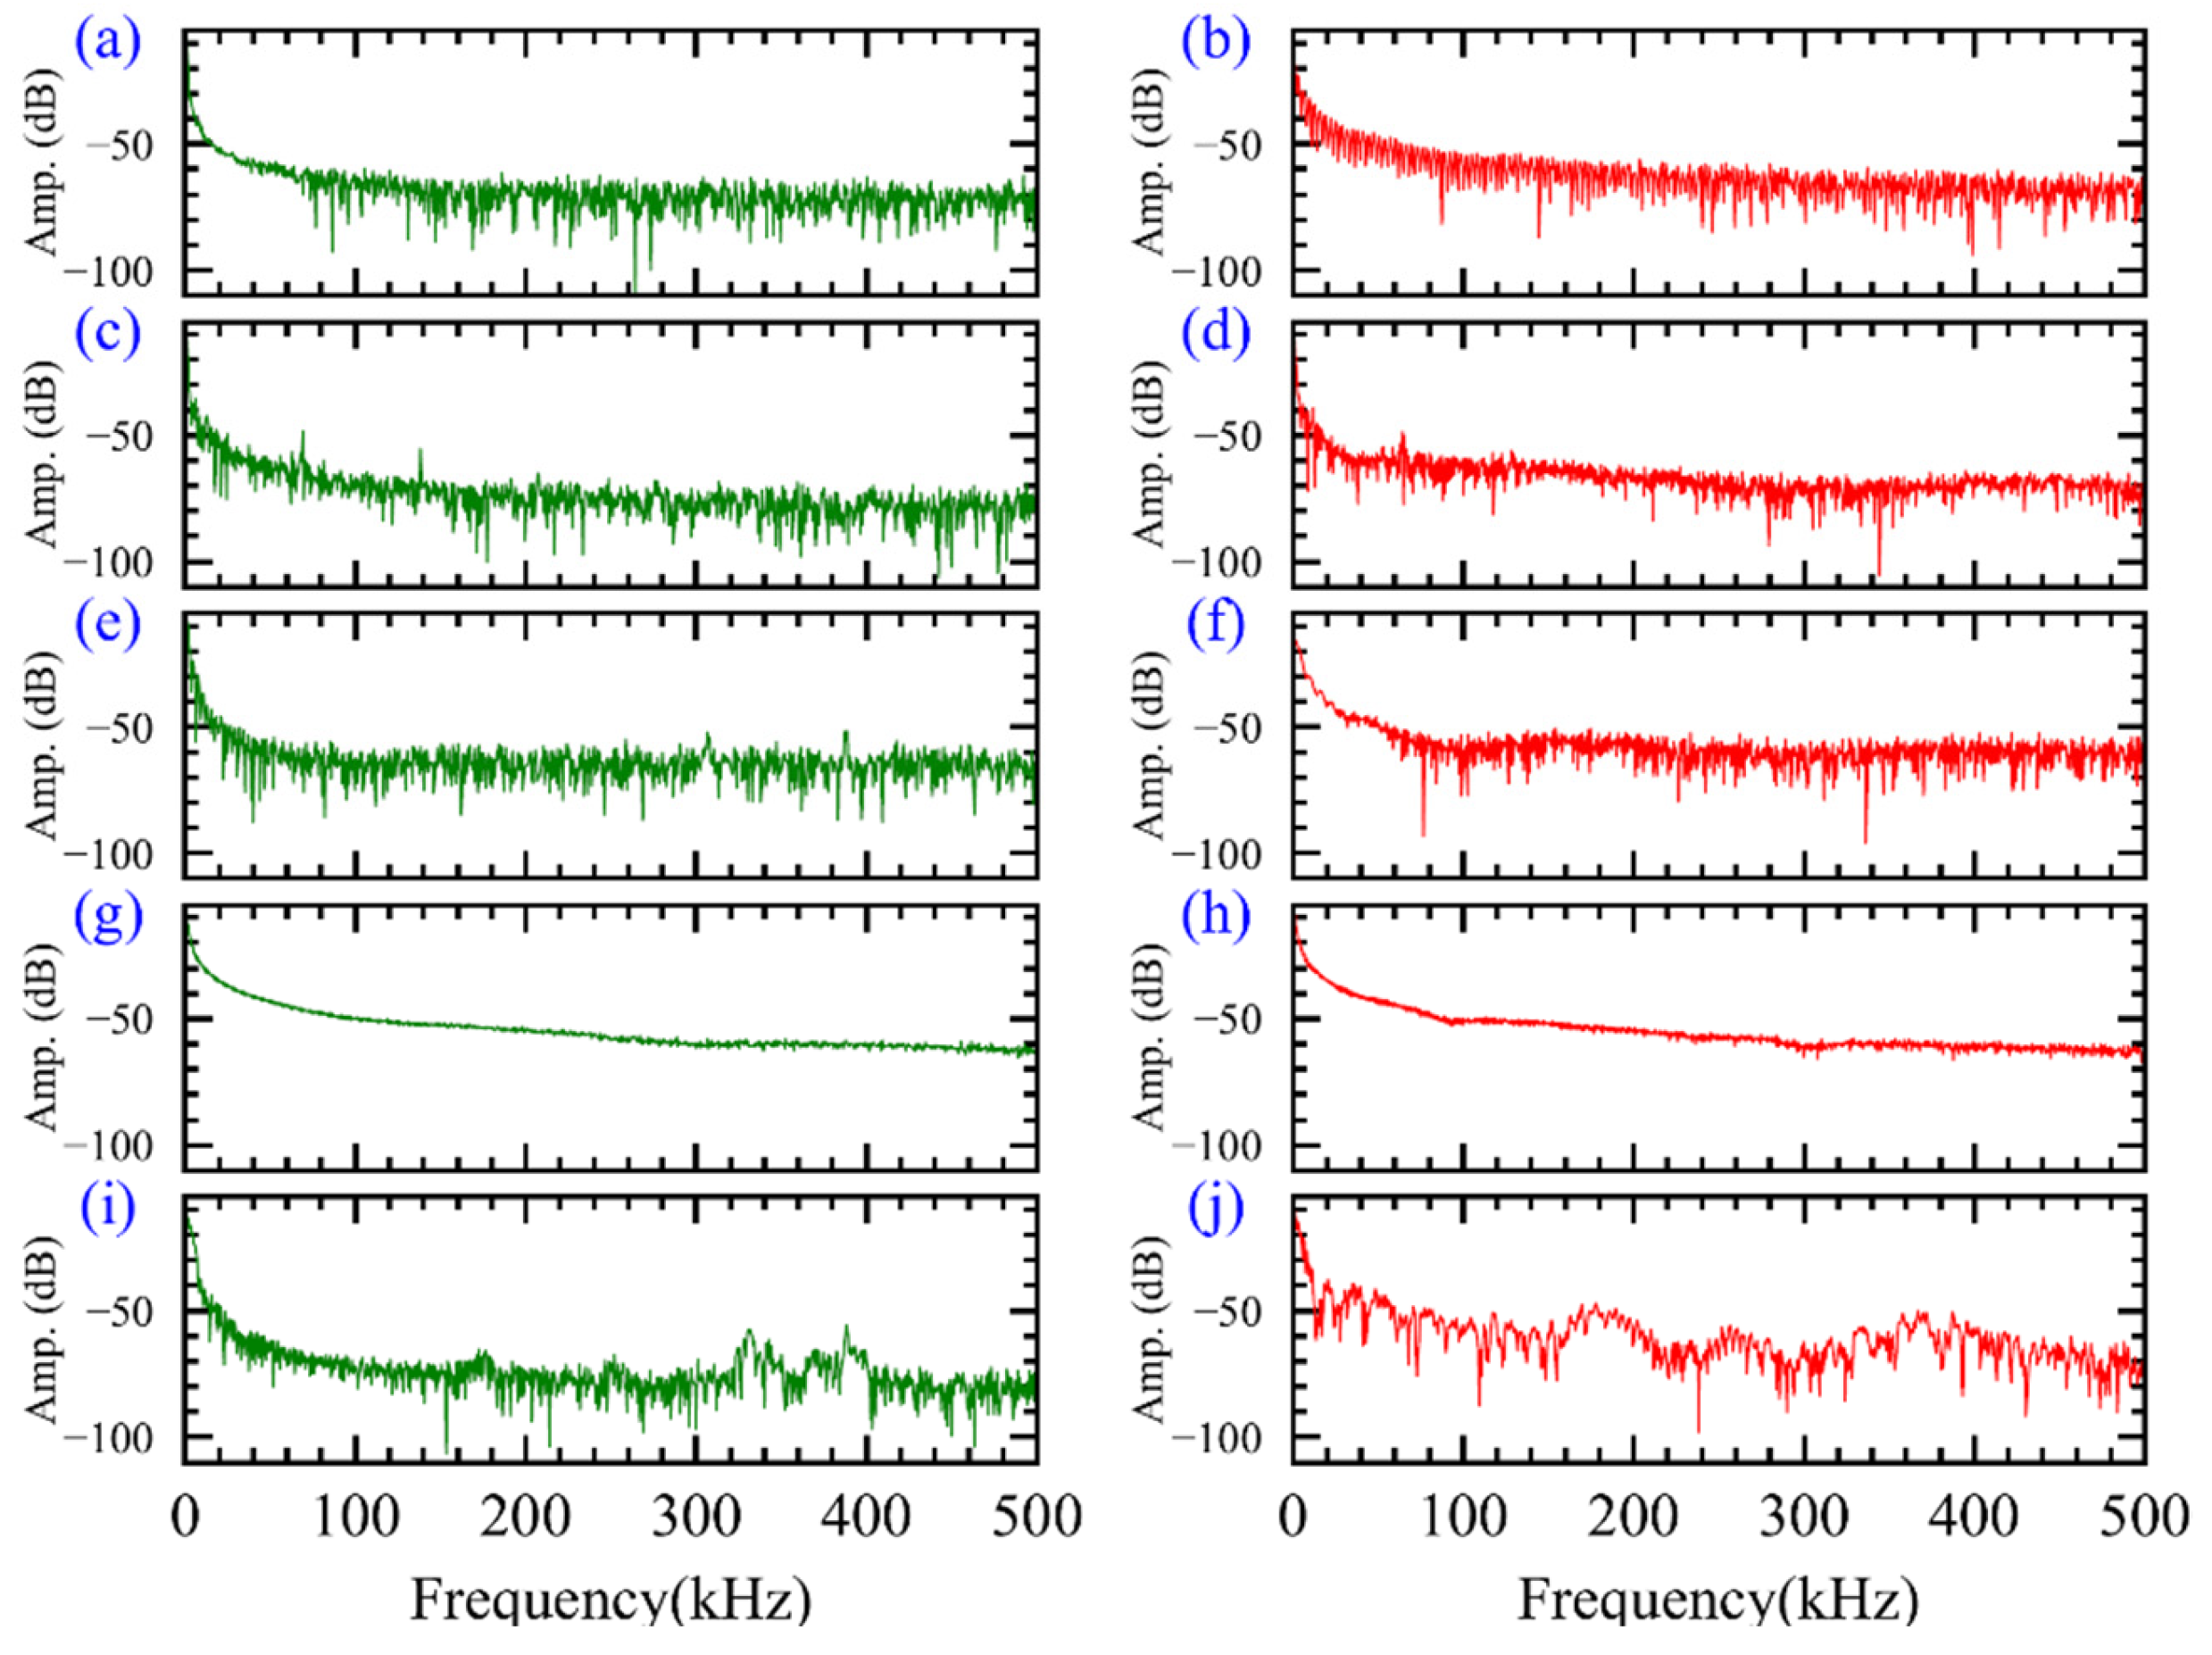
To eliminate the effects of instrumentation bias and the power among different types of loads, the current signal was normalized to its maximum and minimum values before undergoing frequency-domain transformation. As illustrated in Figure 5, the different load types exhibit distinct spectra under both nominal and arc fault conditions. In particular, the characteristic signals of the arc during fault conditions are significantly higher than during nominal operation, and the stochastic characteristics are more pronounced. However, diagnosing arc faults based solely on changes in frequency is often unreliable.

2.3. The Ensemble Empirical Mode Decomposition Method

The Empirical Mode Decomposition (EMD) method is particularly well suited for analyzing and processing nonlinear and non-stationary signals. Unlike methods that rely on predefined basis functions, EMD can decompose these signals into the sum of multiple intrinsic mode functions (IMFs) [29]. This approach reflects the local characteristics of the signal sequence based on its time scale, functioning similarly to an adaptive filter that separates different spectral signals to produce a series of IMFs. As illustrated in Equation (1), the source signal x(t) is decomposed by EMD to obtain N IMF components and one residual:
x t = n = 1 N C n t + r N t
where C n t represents the N th IMF component, N is the total number of IMFs obtained after decomposition, and r N t is the residual signal. To address the modal mixing problem of EMD, an improved method called Ensemble Empirical Mode decomposition (Ensemble EMD, EEMD) was introduced [30]. EEMD works by adding white noise to the original signal, and then applying EMD to the noisy signal multiple times. The resulting IMFs are averaged to obtain the final decomposition. The addition of white noise ensures that the signal is uniformly mapped across time intervals and helps mitigate distortions caused by transient pulses, thereby improving the decomposition stability and accuracy.

2.4. Empirical Mode Decomposition and Visual Representation of Arc Fault Signal

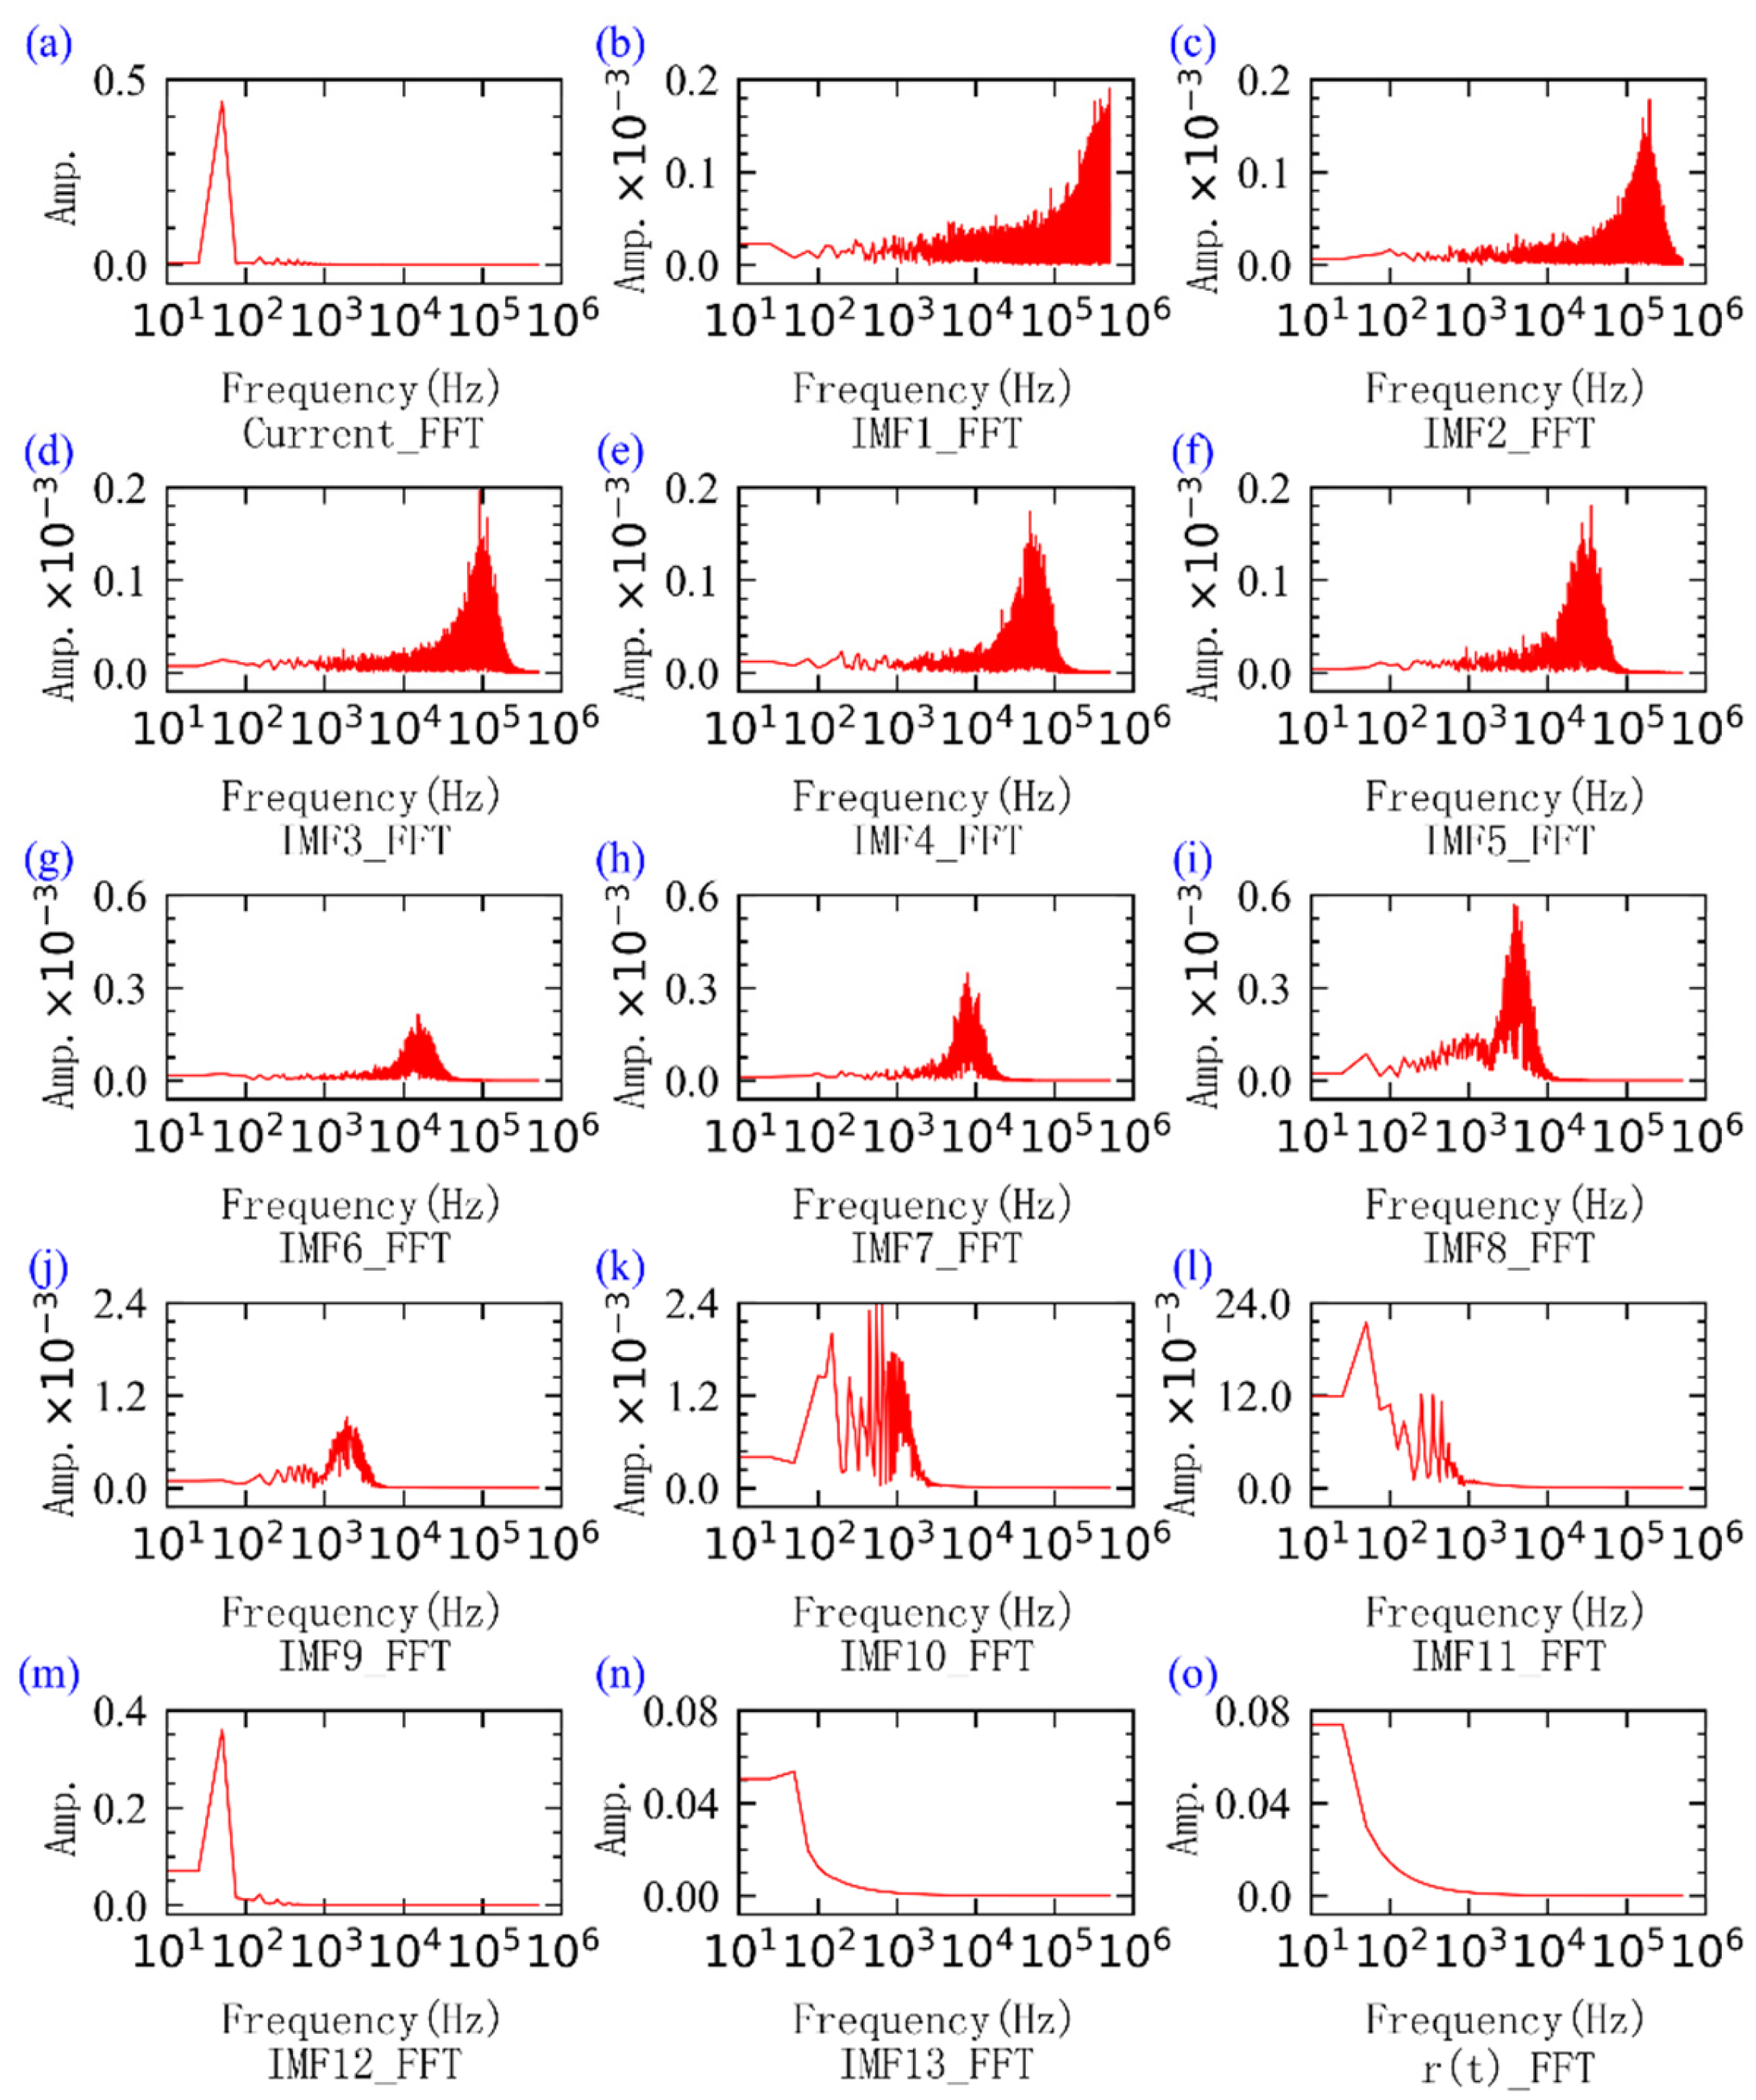
Separating the arcing current from the overall current signal represents an extreme case of underdetermined blind source separation, where a single-channel signal collected by one sensor must be decomposed into multiple components. The EEMD method is applied to decompose the sampled current signal. Unlike traditional methods, EEMD does not require predefined basis functions and can effectively break down nonlinear signals into a sum of IMFs. Using EEMD, the arcing current signal is decomposed into 13 IMF components and 1 residual component r ( t ) . A Fast Fourier Transform (FFT) is then performed on each component, as illustrated in Figure 6.
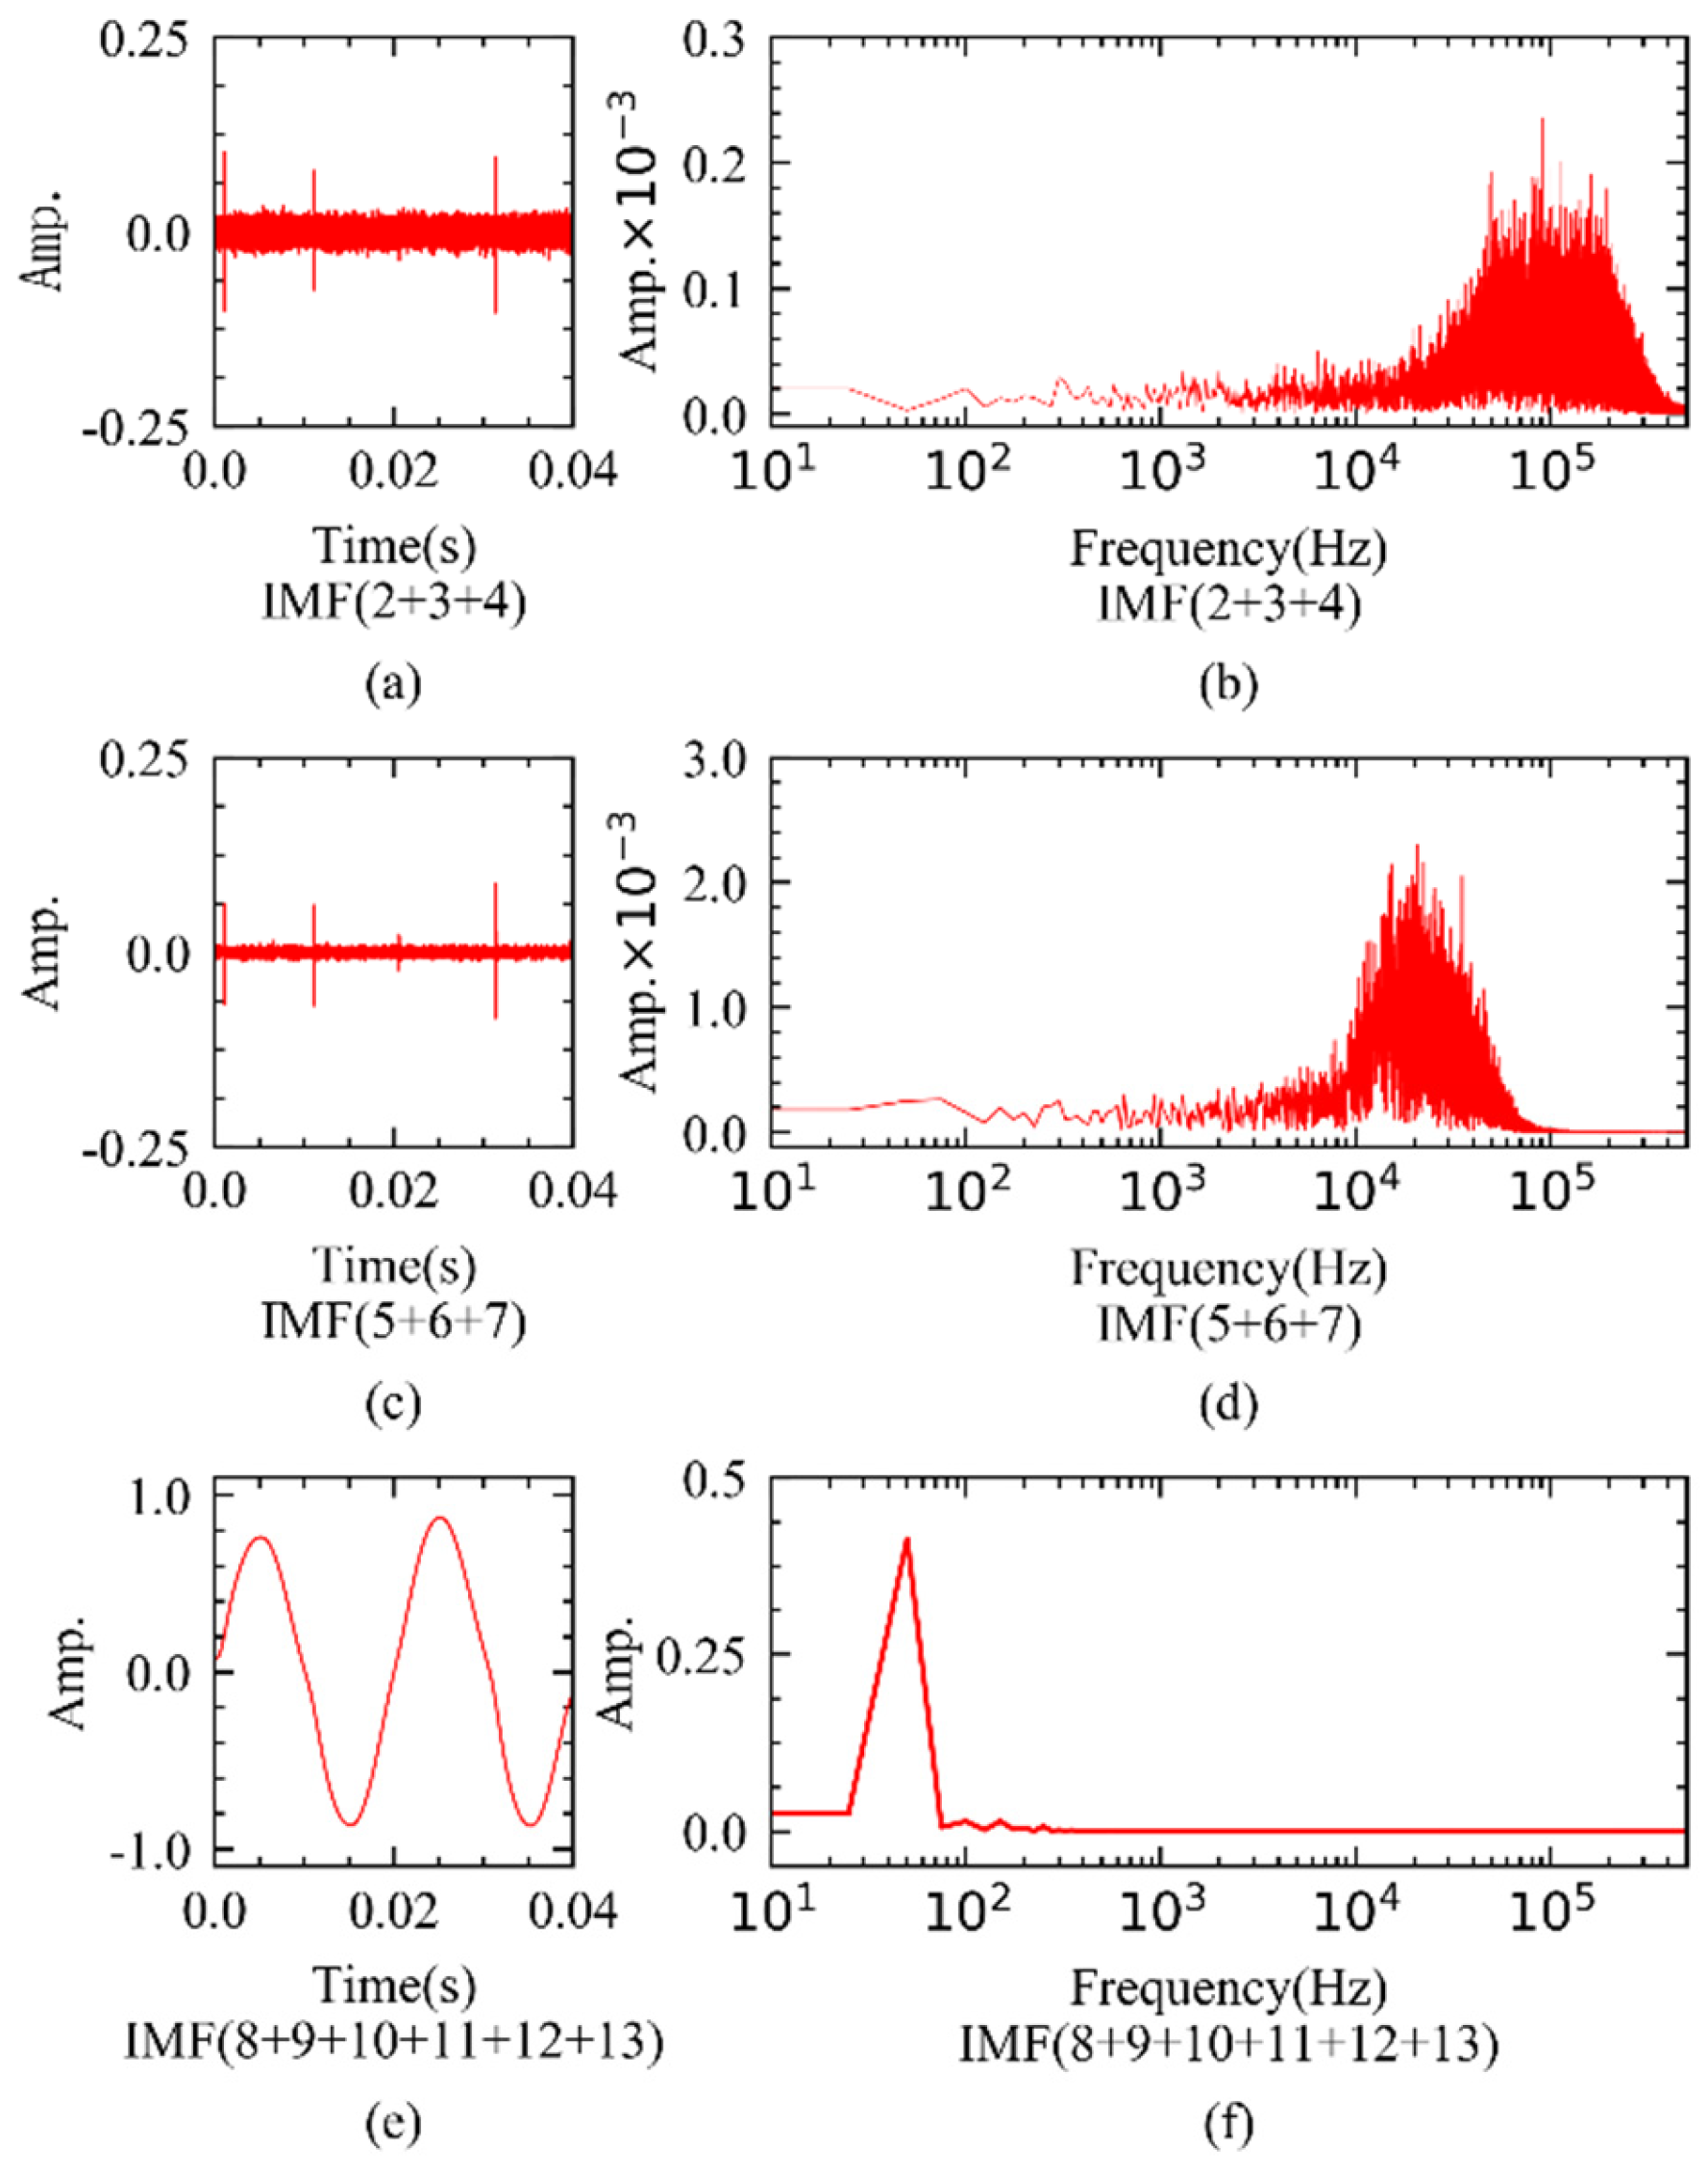
By selectively superimposing 13 IMF components, the sampling current can be decomposed into three primary components, as illustrated in Figure 7. Among these, the superimposition of IMF2 to IMF4 forms the high-frequency current component during arc ignition, as shown in Figure 7a. The superimposition of IMF5 to IMF7 results in the abrupt change in the feature signal due to the flat shoulder characteristic of the arc fault, as depicted in Figure 7b. Finally, the superimposition of IMF8 to IMF13 represents the fundamental operating frequency and harmonics of the load, as shown in Figure 7c.
As shown in the FFT results of the three signals in Figure 7, the EEMD-based decomposition and reconstruction of the arc fault current successfully identify a high-frequency characteristic band in the range of 10~200 kHz. Within this band, all three fundamental features of arc faults are fully captured. However, a major limitation of the EEMD method is its high computational cost, requiring hundreds of iterative cycles on average, which makes it unsuitable for real-time signal decomposition and detection. To address this limitation, a visual-based image generation method is proposed to represent arc fault features. In the resulting images, vertical stripes, broken/interrupted lines, and random noise speckles are used to represent the three key characteristics of arc faults: flat shoulder, flat shoulder variation rate, and high-frequency component signal, respectively.

2.5. Utilize the Proposed Method of Generating Grayscale Images to Observe Arc-Fault Characteristics

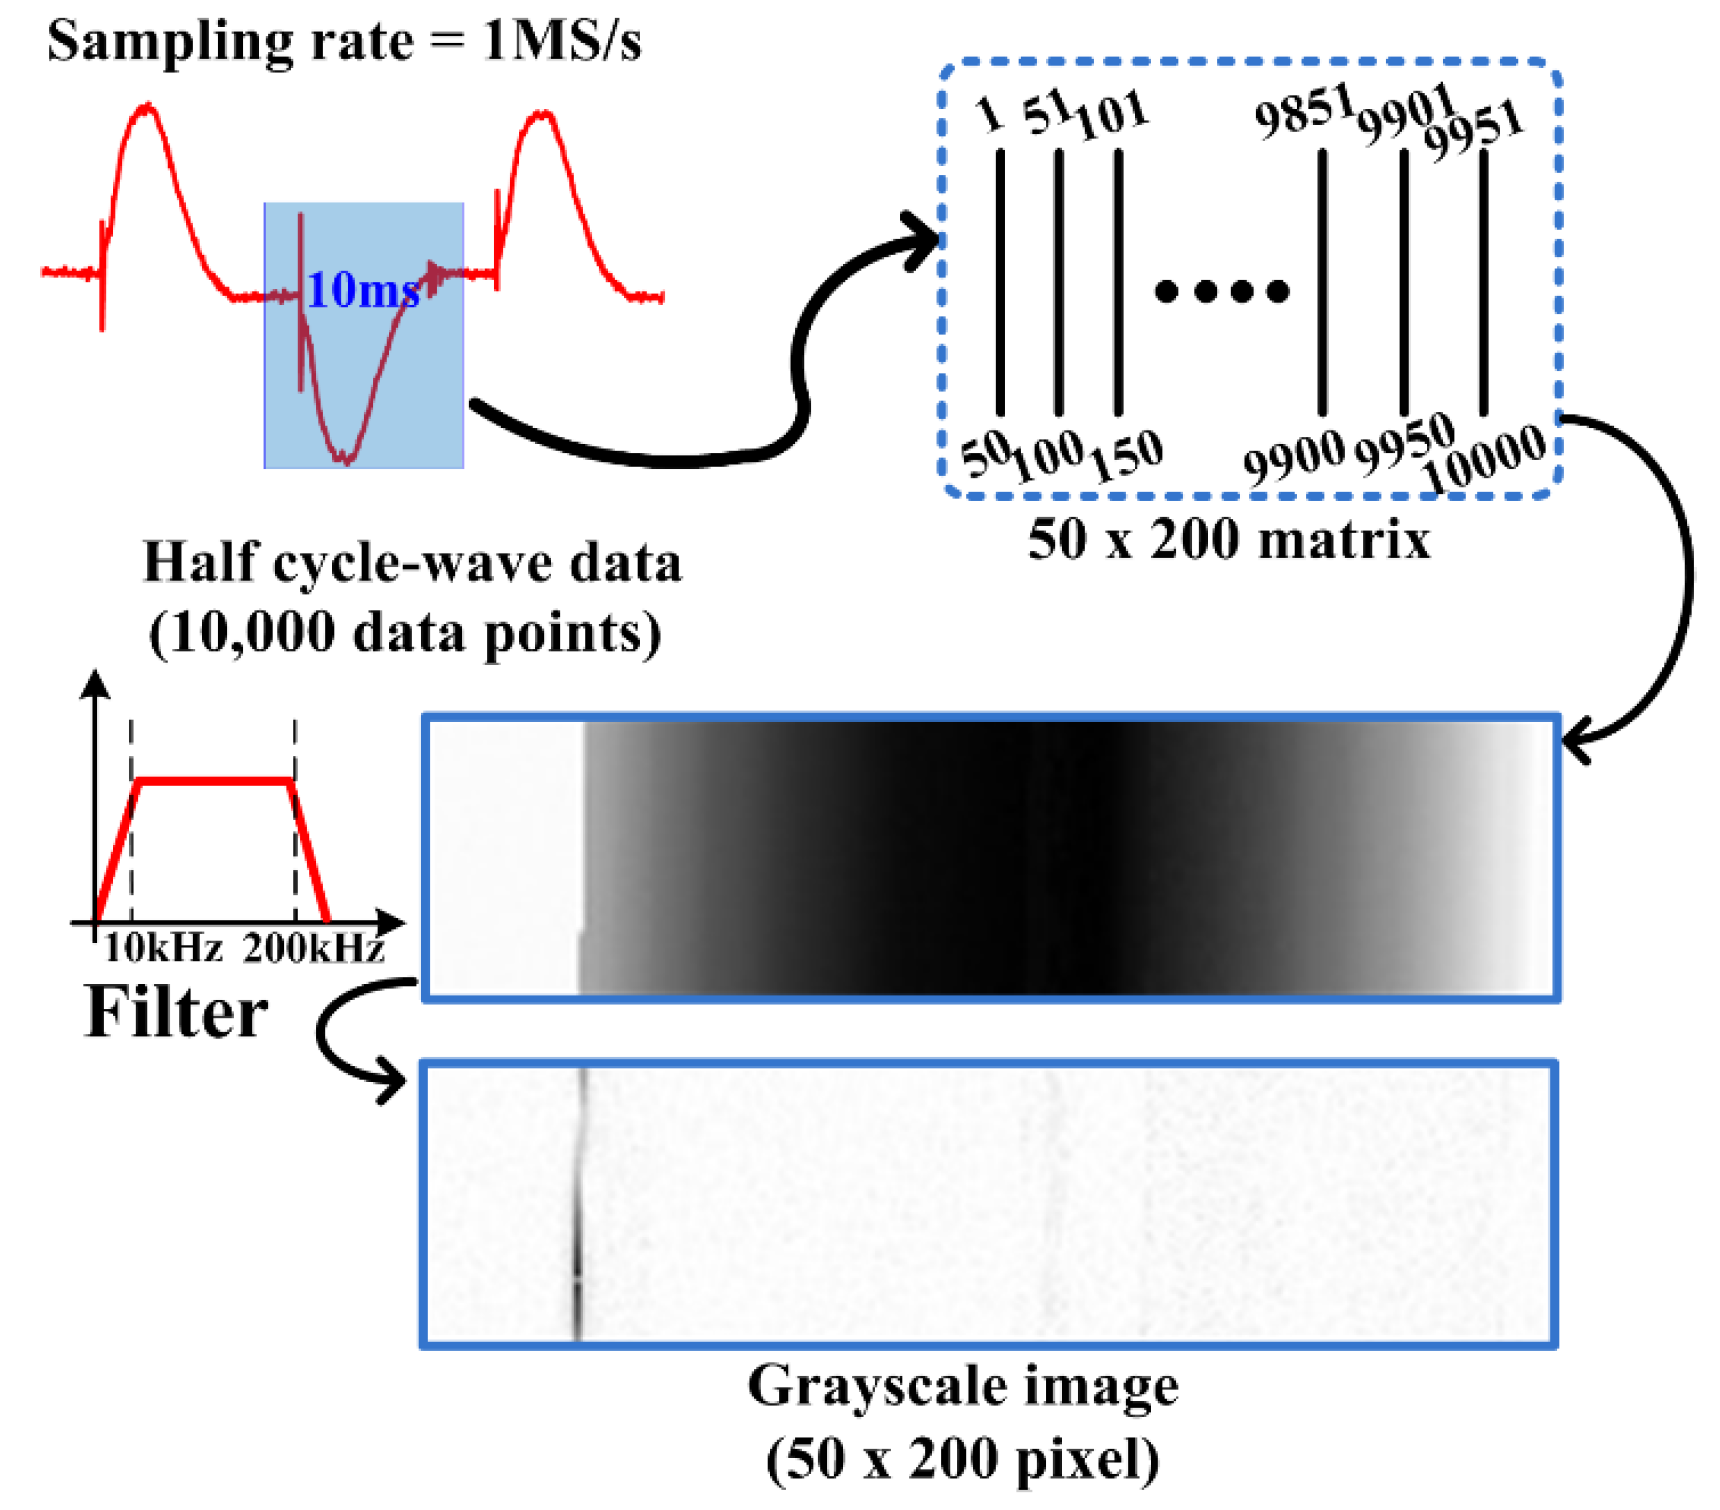
Figure 8 shows the procedure for generating an image from the sampled current data. The analysis is conducted on each half-cycle, which consists of 10,000 points (sampled at a frequency of 1 MS/s). Initially, the sampled quantities are organized into a matrix over time, following left-to-right and top-to-bottom operation mode. The matrix is then mapped to a range from 0 to 255 according to Equation (2), normalizing it to an 8-bit color space. Finally, a Butterworth band-pass digital filter with cutoff frequencies of 10 kHz and 200 kHz is applied to remove fundamental frequency components from the grayscale image.
x ( i , j ) = x r a w [ 50 · ( j 1 ) + i ] M i n ( x r a w ) M a x ( x r a w ) M i n ( x r a w )
where the M a x ( x r a w ) is the maximum value in the original data x r a w , while M i n ( x r a w ) is the minimum value; i and j are the indices of the rows and columns of the grayscale image, respectively; and x ( i , j ) is the pixel composition of the generated grayscale image.
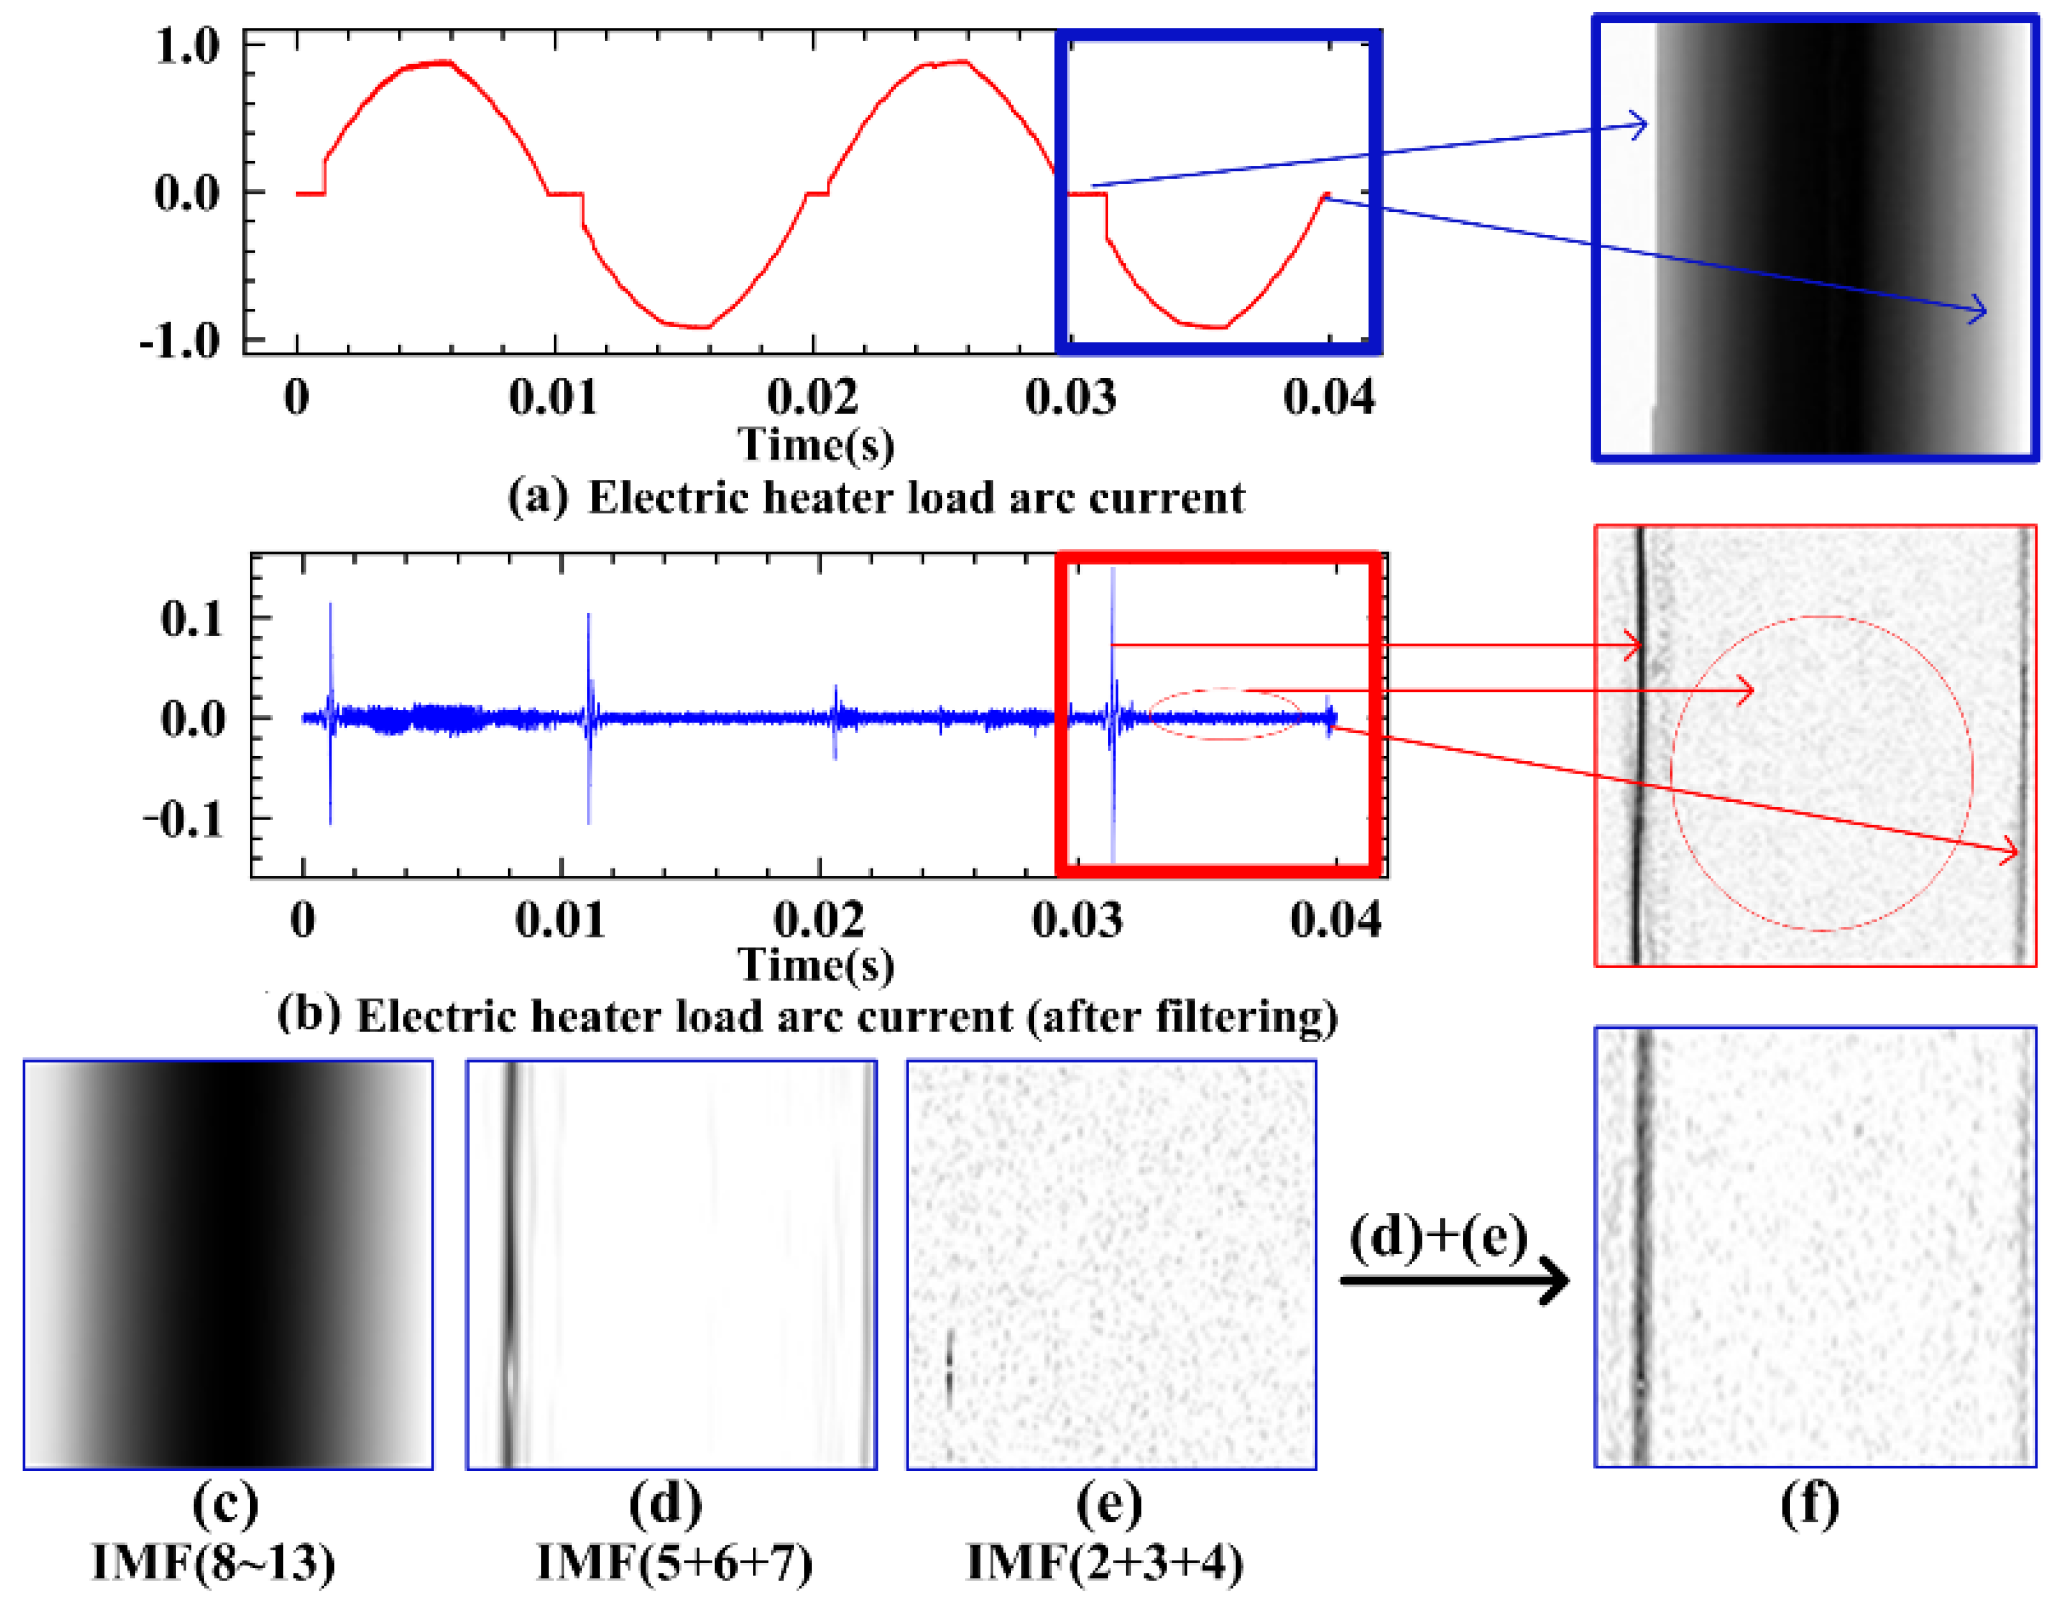
Figure 9 compares the three grayscale images generated from the three main component signals, superimposed using the EEMD method, with the grayscale images generated directly through the filtering method. Specifically, Figure 9a,b display the arc current and filtered current waveforms of the electric heater load, respectively. Figure 9c–e illustrate the grayscale images of the three main component signals obtained from the electric heater load current using the EEMD method.
The grayscale images of Figure 9d,e were superimposed to obtain Figure 9f. In this composite image, the noise generated by the high-frequency characteristic component of the arc current, as well as the uninterrupted streak feature produced by the signal impulse before and after the flat shoulder, can be observed. The grayscale image of the filtered arc current, as shown in Figure 9b, exhibits similar characteristics to those in Figure 9f. The filtered grayscale image also displays arcing features comparable to those identified using the EEMD method. Therefore, this straightforward visual representation, referred to as TDI, can be effectively utilized for arc fault diagnosis and is approximately equivalent to the EEMD method.
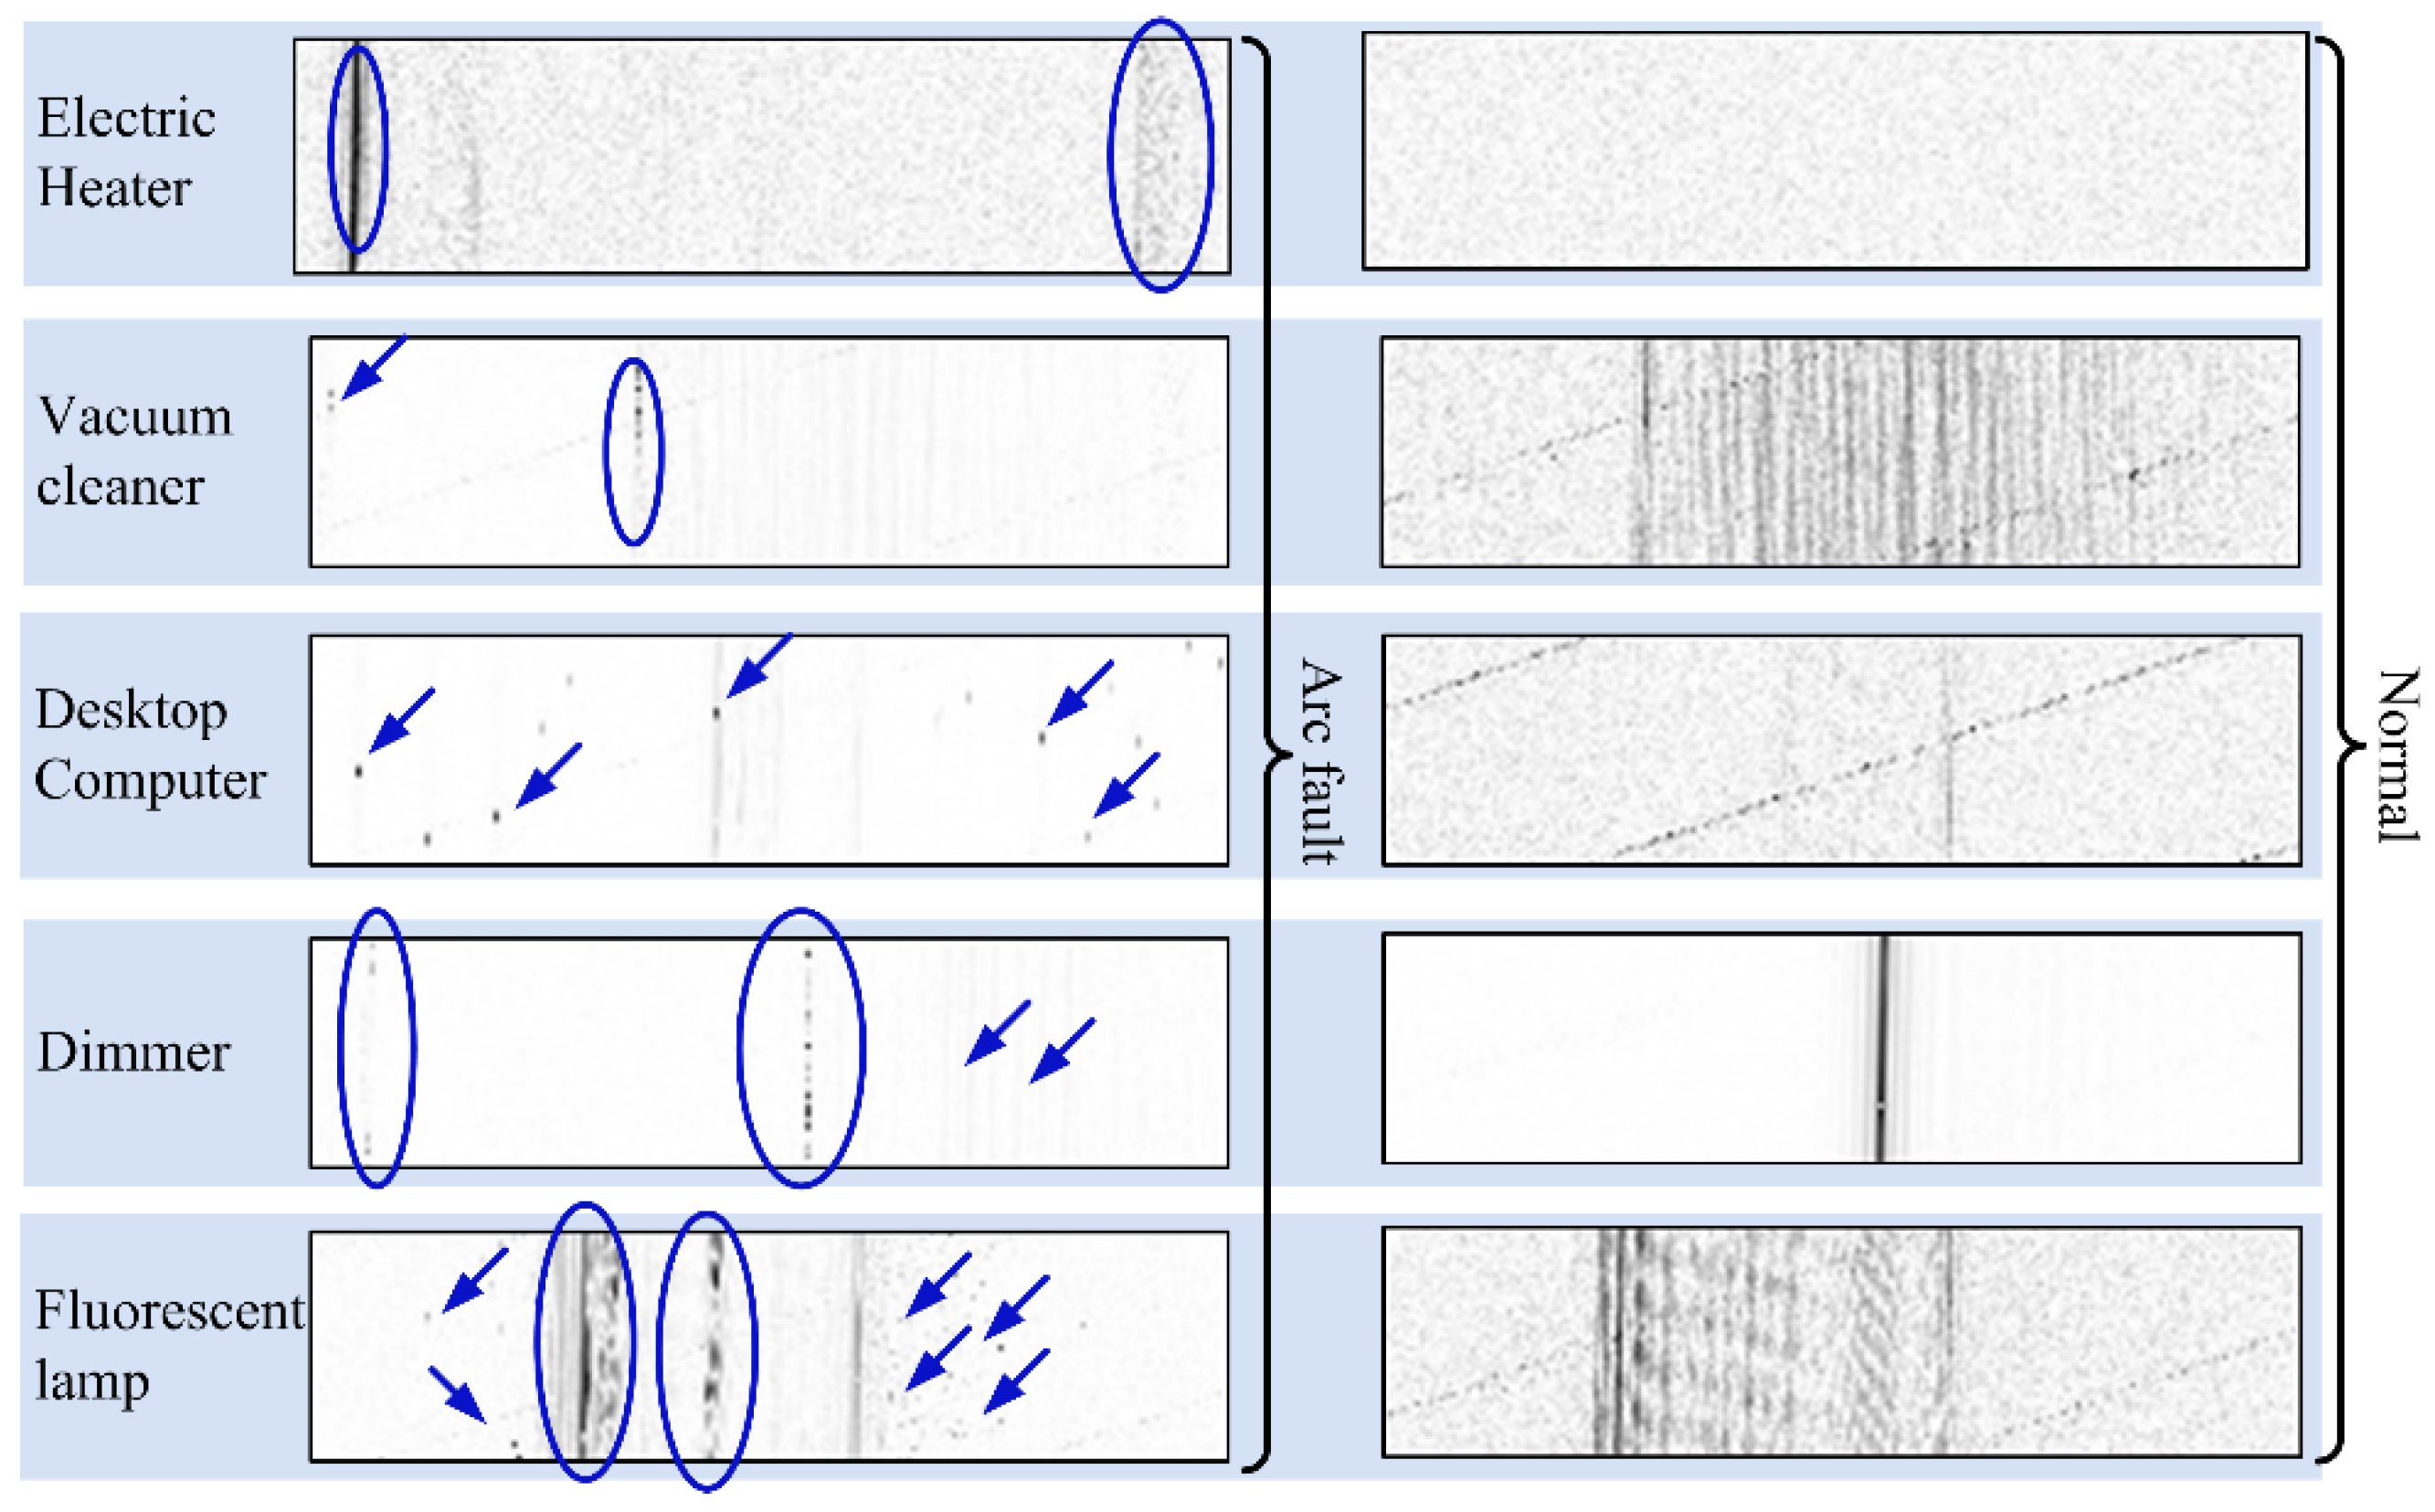
This paper examines five typical household appliances. Figure 10 displays images constructed for each appliance under normal operating conditions (sub-graphs on the right side) and then in the presence of an arc fault (sub-graphs on the left side). Each subplot in Figure 10 represents one half-wave of data for a single load, with a resolution of 50 by 200. By comparing the different states of the same load (arc and nominal), it is evident that the pure resistive load (electronic heater) exhibits an obvious “flat shoulder” stripe in the left region of the image. In contrast, other loads show apparent mutation points and shallow strips, consistent with the random properties of the arc fault.
The blue arrows refer to the arc current’s high-frequency characteristic component in the grayscale image of the noise, corresponding to Figure 6a and the arc ignition high-frequency current component. The blue oval markers highlight pulses occurring near the zero-crossing points of the current, where sudden changes or intense high-frequency components appear. These features manifest as vertical stripes in the image and correspond to Figure 6d. Figure 6f illustrates the 50 Hz fundamental frequency component of the load current. However, since this component was filtered out during preprocessing, it does not appear in the grayscale image.
The proposed TDI method offers two main advantages: First, it enables visualization of arc fault characteristics such as sudden pulses and signal randomness within a fixed time interval. Second, it assists in selecting an appropriate sampling frequency by analyzing variations in image brightness and contrast. This approach is more intuitive and convenient than traditional methods like the EEMD method or time-domain waveform analysis. The visual representation of arc-fault “feature signals” offers a clear and effective means of detection.

3. Detection Method of SAFs

3.1. LSTM Background

The LSTM network is specially designed to address the issue of gradient loss in sequence data. This network has a unique memory and gating mechanism that enables it to more effectively learn the relevant features contained in time-series data, making it widely used for time-series forecasting. The LSTM network is composed of a series of LSTM units. The structure of a single LSTM unit is illustrated in Figure 11. Compared to traditional RNNs, an LSTM unit includes has one memory unit and three gates: a forget gate, an input gate, and an output gate. The hidden state is calculated through the interaction of these four components, giving the network the ability to remember or forget specific information.
As shown in Figure 11, the forget gate F t , as shown in Equation (3), which is obtained from the input (output of the previous time node of the hidden layer) and the new input information x t , is utilized to control the forgetting procedure of the information of C t 1 (output of the memory nominal of the previous time node). It is set by the activation function δ to a weight between 0 and 1, where 0 represents complete forgetting and 1 represents complete memory.
F t = δ ( W f · [ h t 1 , x t ] + b f )
Similar to the computation of the forget gate F t , we can obtain the formulae for the input gates I n t , output gates O t , memory unit state C t ~ , nominal information C t , and implicit layer output h t , as shown in Equations (4)–(8), respectively:
I n t = δ ( W i · [ h t 1 , x t ] + b i )
O t = δ ( W o · [ h t 1 , x t ] + b o )
C t ~ = t a n h ( W c · [ h t 1 , x t ] + b c )
C t = F t · C t 1 + I n t · C t ~
h t = O t · t a n h ( C t )

3.2. Sampling Frequency Selection

Figure 12 shows the grayscale images of the electric heater applying high-pass filters with cutoff frequencies of 1 kHz, 2 kHz, 5 kHz, 10 kHz, 25 kHz, 50 kHz, 100 kHz, and 200 kHz. These images include both nominal and SAF states. As the cutoff frequency increases, the “flat shoulder” stripes associated with the SAF generated by the electric heater gradually disappear. This occurs because the characteristic high-frequency signals of the arcing are filtered out. A similar phenomenon can also be observed in the grayscale images of fluorescent lamps, although in these images the SAF features manifest as obvious mutation points and shallow stripes.
Therefore, a general conclusion can be drawn: although the feature spectrum generated by SAFs is very broad, the richest features are primarily concentrated in the 0–200 kHz range. According to Shannon’s sampling theorem, the sampling rate can be set to 400 kS/s. To ensure a certain level of redundancy and to consider the cost and performance of hardware implementation, it was decided to set the sampling frequency to 1 MS/s, which can effectively prevent the problem of aliasing.

3.3. Dataset Construction

A total of 7000 labeled datasets were collected. Of these, 5000 were used for the training process, 1000 for testing, and the remaining 1000 for validating the TDI-LSTM network. To minimize the influence of varying current magnitudes on waveform characteristics, each raw data x r a w was normalized using min–max scaling and then converted into a 50 × 200 grayscale image, as defined by Equation (2), prior to training the TDI-LSTM network.

3.4. Model Structure and Training

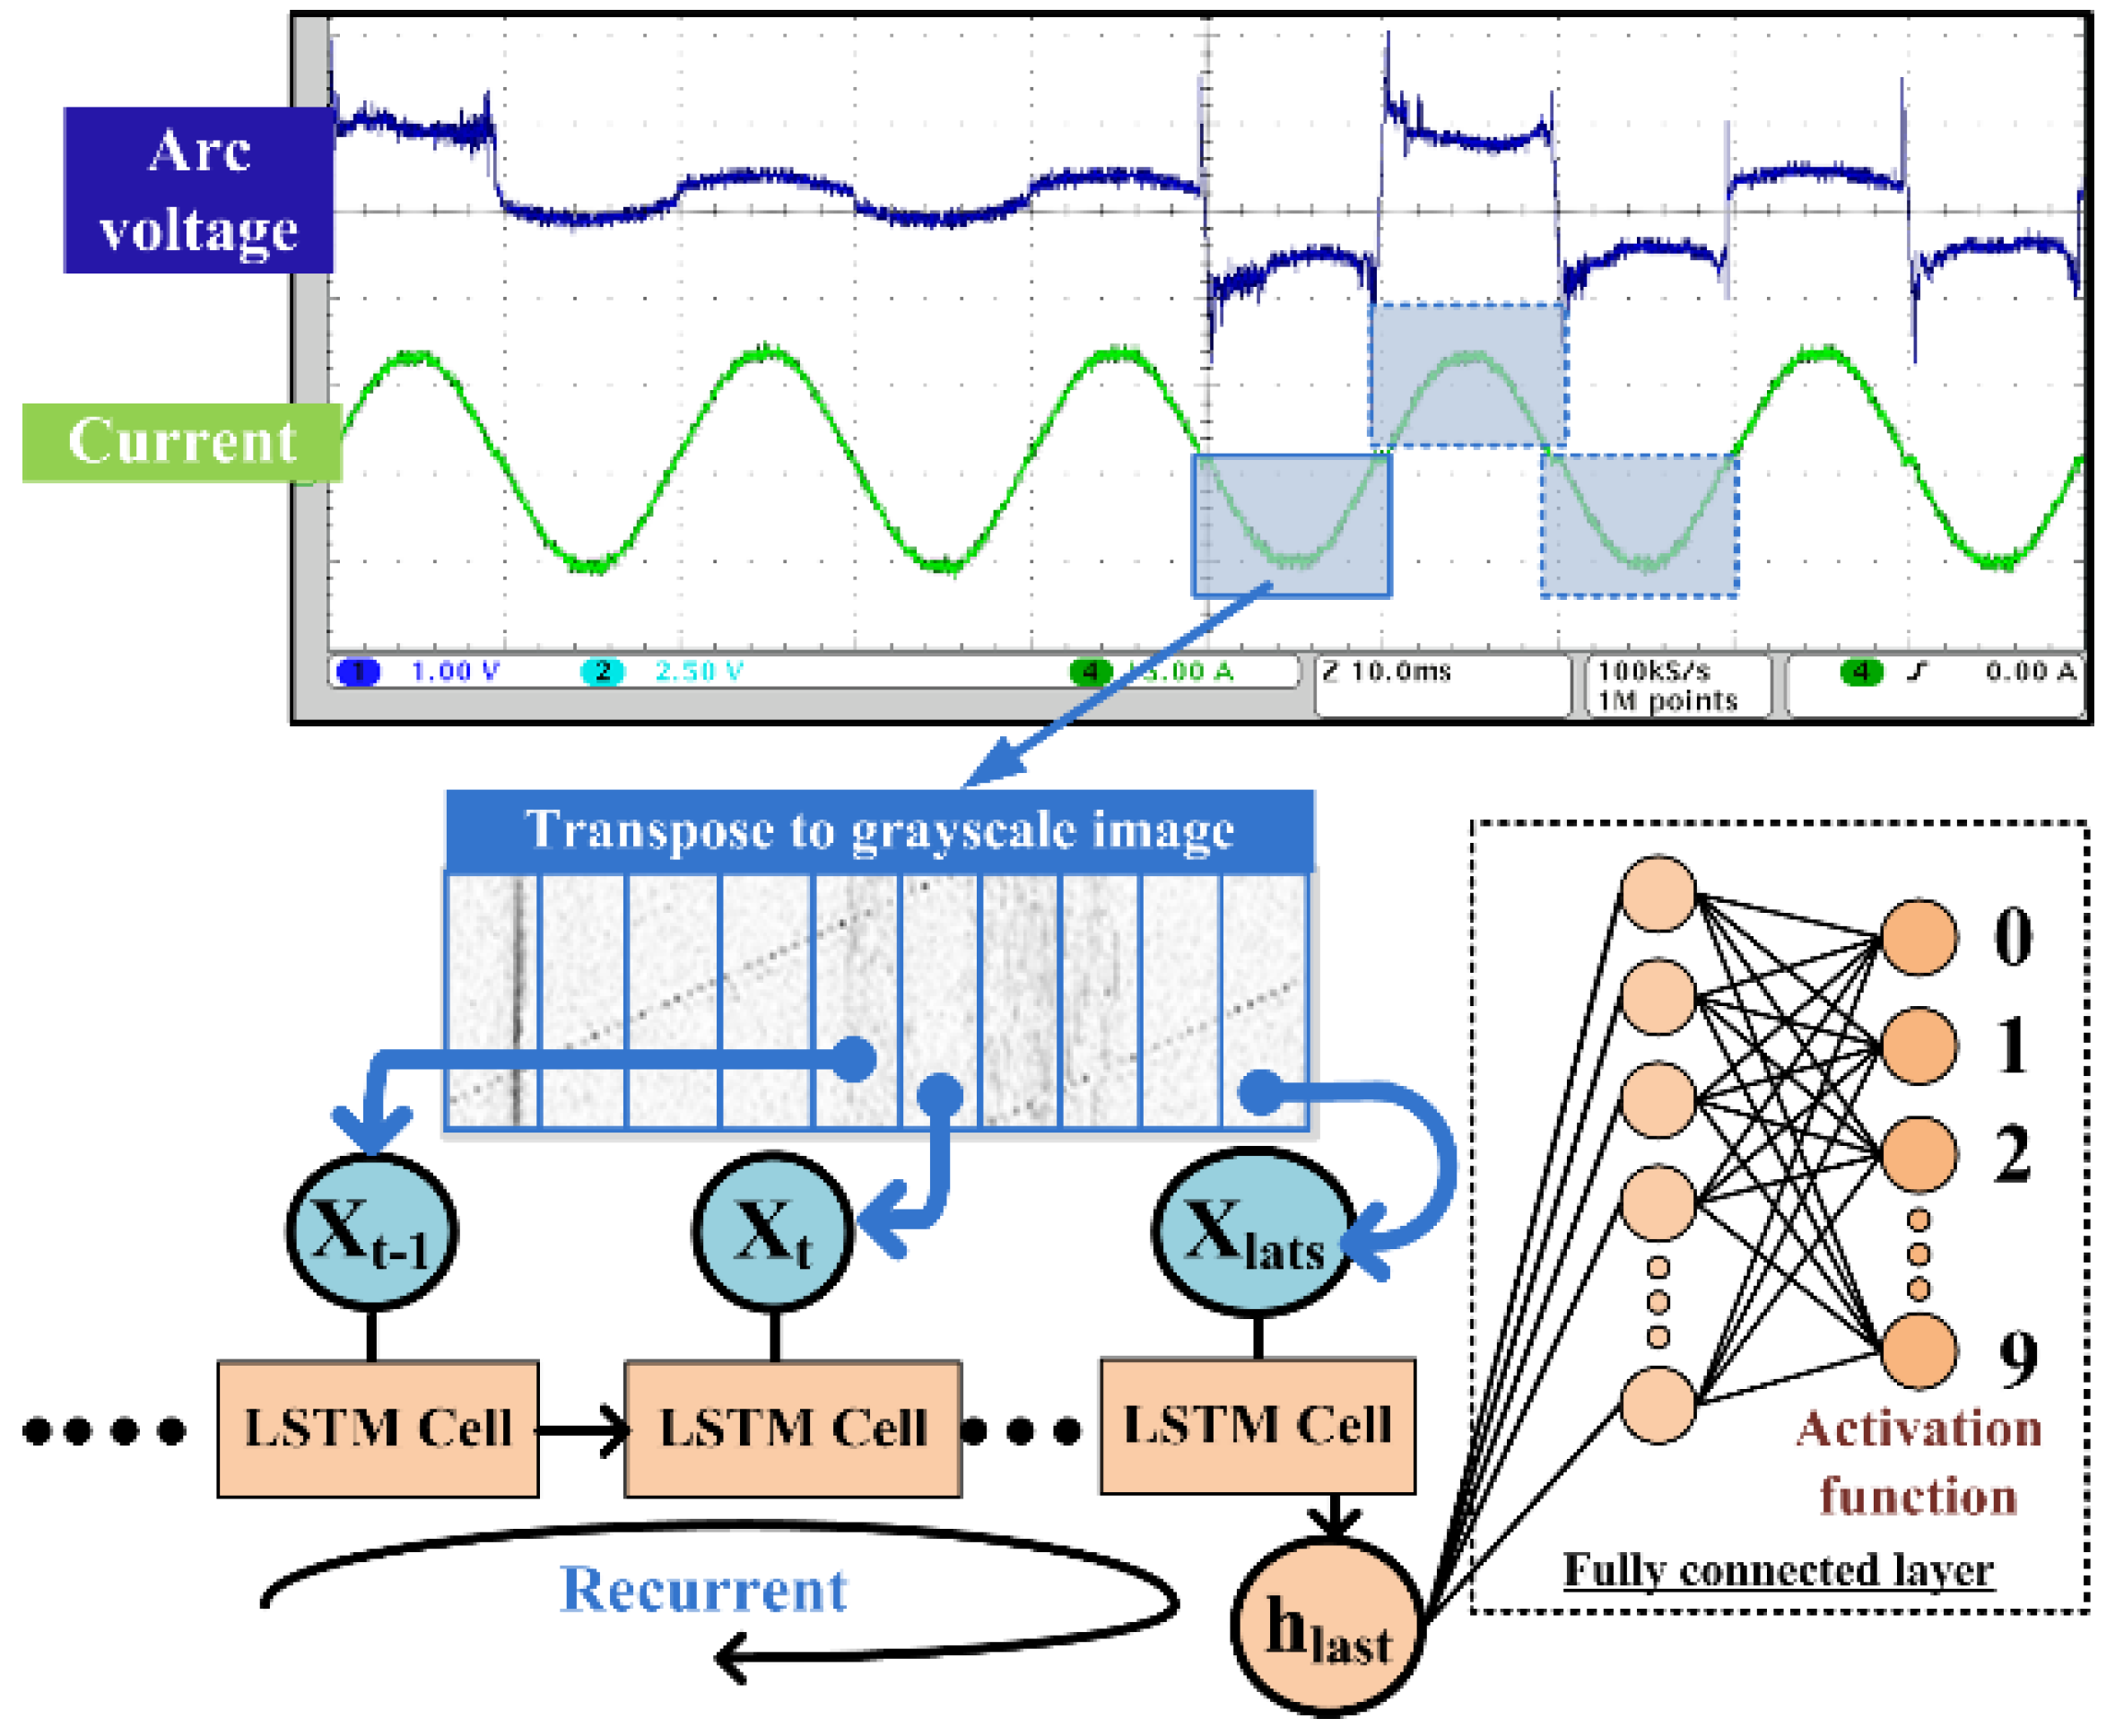
The LSTM network, with its memory structure, effectively captures the temporal correlations of load currents. Key challenges in applying the deep LSTM network to arc fault detection include data preprocessing, determination of hyperparameters, and addressing the training difficulties associated with the deep networks. The structure and workflow of the proposed deep TDI-LSTM for series arc fault detection are illustrated in Figure 13.
Each half-cycle of the waveform data is mapped into a grayscale image according to the TDI method. The grayscale image is then divided into ten parts, each corresponding to one millisecond of acquired data. Thus, there are a total of ten LSTM recurrent units in the hidden layer, and the size of the variable x t in the input hidden layer is 1000. The output h l a s t of the tenth (i.e., the last) hidden layer will be fed into a fully connected (FC) layer network with ten output neurons corresponding to each of the five load states. The expression of the FC layer is shown in Equation (9), where h l a s t and y are the input and output of the FC layer, respectively, and a c t v . is an abbreviation of activation function. Since arc fault detection is a classification problem, a rectified linear unit (ReLU), as shown in Equation (10), is utilized as the activation function of the FC layer. W h and b h are the weights and biases that need to be trained.
y = a c t v . ( W h · h l a s t + b h )
f R e L U ( x ) = 0 ,       x 0 , x ,       x > 0 .
The computer used for training the TDI-LSTM network was equipped with four GPUs (NVIDIA GeForce GTX 1080Ti), dual CPUs (Intel Xeon E5-2678 v3), and 128 GB of RAM. The model was trained and tested using the PyTorch (2.5.0) framework, with the training process taking approximately 2980 s to complete. The online detection time was approximately 56 ms. Once trained, tested, and validated, the model can be deployed on embedded hardware platforms for fast and real-time arc fault detection, including load type identification. The overall process is outlined below:
(1)
Data Preparation: Define the model’s input and output variables. Preprocess the input dataset and divide it into three subsets: training, validation, and testing.
(2)
Model Construction and Training: Build a deep LSTM model for series arc-fault detection. Train the model using the training set, while the validation set is used to assess and optimize the model’s generalization performance during training.
(3)
Model Evaluation: Evaluate the trained model using the test dataset to determine its prediction accuracy on unseen data.
(4)
Hyperparameter Tuning: Adjust hyperparameters iteratively to minimize the prediction error on the test dataset.

4. TDI-LSTM Performance and Evaluation

To validate the accuracy and reliability of TDI-LSTM for SAF detection, the proposed network model requires fine-tuning. Additionally, trade-offs must be considered to minimize various constraints, including computational time, hyperparameters, model classification error, and the number of required labeled datasets.
In this paper, the focus is on evaluating the number of layers of the fully connected layer network, the output neurons in the recurrent hidden layer, and the size of the datasets. The fully connected network is configured with one or two layers, while the output neurons of the recurrent hidden layer are set to 128 or 256. This setup results in the formation of four configurations:
(1)
Single layer and 128 output neurons (S-128);
(2)
Single layer and 256 output neurons (S-256);
(3)
Two layers and 128 output neurons (T-128);
(4)
Two layers and 256 output neurons (T-256).
Figure 14 displays the accuracy and loss function trend charts for training the four models mentioned, with S-256 demonstrating the best performance. This indicates that increasing the dimensions of information output by the recurrent hidden layer (i.e., using more neurons) leads to a higher accuracy rate. Additionally, it shows that there is no need to employ a deeper fully connected (FC) network. In fact, using a two-layer FC network could make the model unstable.
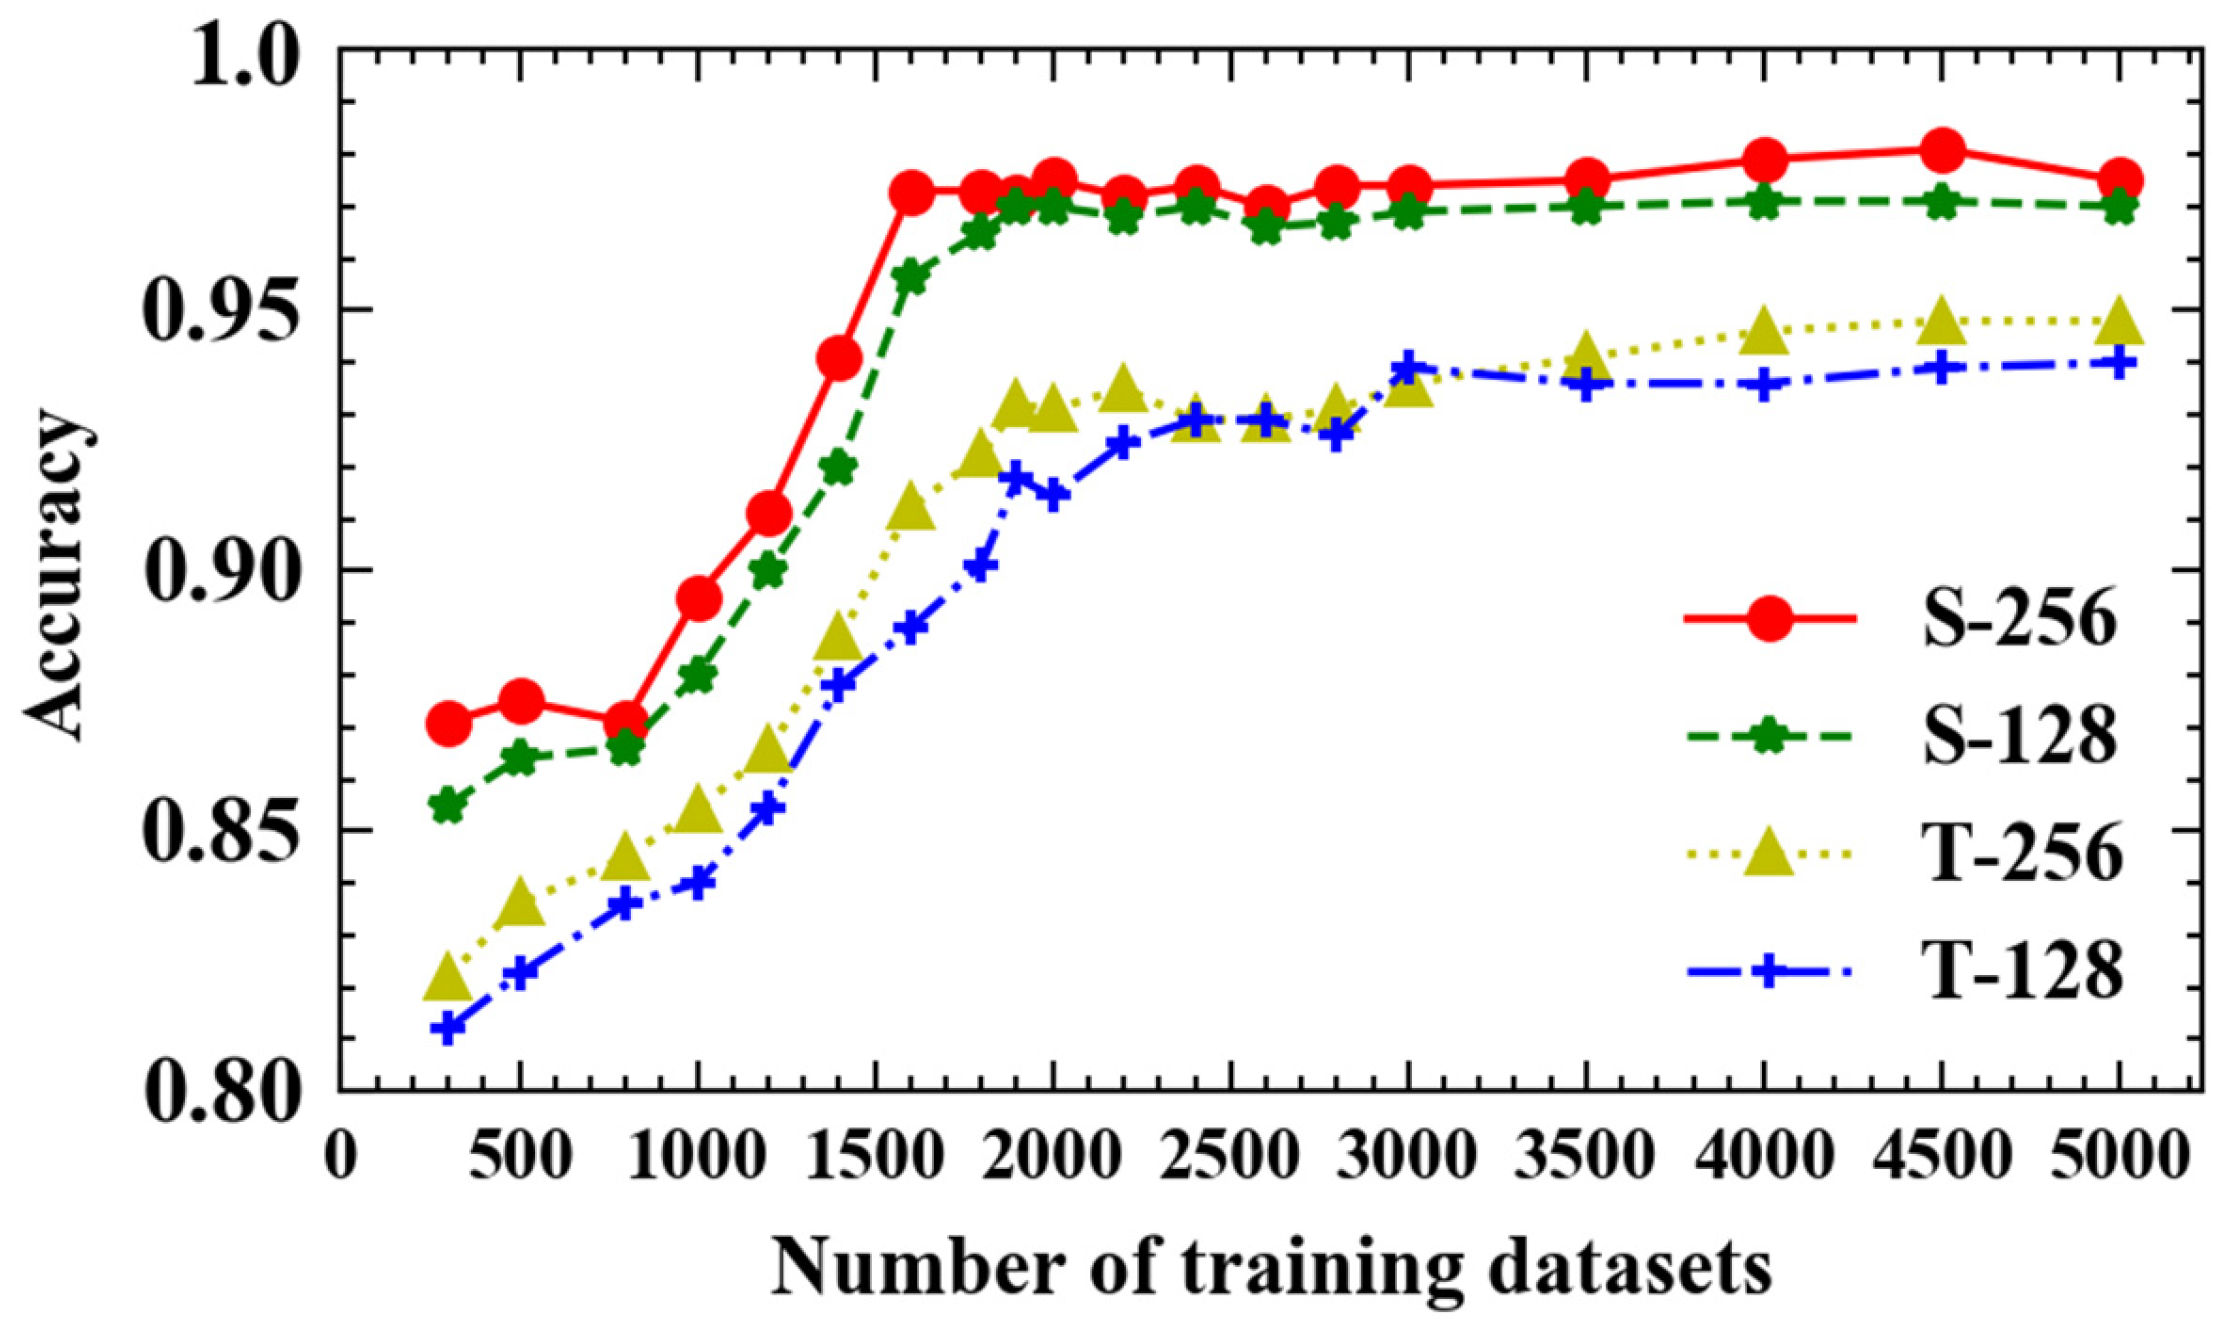
The accuracy scores of the four configuration models are given in Figure 15. It can be seen that the T-128 model has the lowest accuracy score. The T-128 and T-256 models only achieved 94.8% and 94.0% accuracy at 4500 training datasets, respectively, whereas the single-FC-layer models outperformed the two-FC-layer models even with the lower number of training datasets. The S-256 and S-128 models achieved up to 97.3% and 95.6% with 1600 training datasets, respectively. Finally, the S-256 model achieved the highest accuracy score, at approximately 98.0%.

4.1. Dimension Reduction Analysis

T-Distribution Stochastic Neighbor Embedding (t-SNE) is an unsupervised machine learning technique for dimensionality reduction. It transforms data points into probability distributions using an affine transformation and projects high-dimensional data into a two- or three-dimensional space suitable for visual interpretation [31].
In this study, t-SNE was used to project the 256-dimensional feature vectors obtained from the hidden layer of the S-256 model onto the 2D space, as illustrated in Figure 16. This visualization clearly demonstrates the model’s ability to distinguish between arc faults and load types. In Figure 16, each colored dot represents a specific appliance under a particular operating condition. The corresponding appliance labels of typical appliances are illustrated in the caption of Figure 16, where even-numbered labels indicate the nominal operating condition, and the odd-numbered labels represent arc fault conditions.
By analyzing the images of the three phases (initial, mid, and late stages), it is evident that most of the points are blended together at the beginning. As the number of iterations increases, the dots of different colors begin to separate. Eventually, dots of the same color cluster together, while those of different colors become distinctly separated, indicating improved classification ability as the model converges.
However, a small number of dots appear in areas of incorrect classes because the characteristics of the loads that they represent are very similar to those of the current forecast classes of loads. For example, several points labeled as 7 appear around those labeled as 6, both of which belong to dimmer loads. This demonstrates that the network struggles with detecting arc faults in dimmer loads, consistent with the analysis results of typical loads in Section 2.2. Overall, aside from a few misclassified loads, the TDI-LSTM network is highly capable of extracting the arc fault features and can more accurately distinguish between different types of appliances.

4.2. Experimental Results

The test results are presented in Table 2, with the corresponding appliance types referenced from Figure 16. Out of 1000 test samples, the TDI-LSTM model achieved an average accuracy of 98.1%. Since the test samples differed from those of the training set, this indicates that the TDI-LSTM model demonstrates strong generalization ability. Among the appliances, the dimmer load showed the lowest arc fault detection accuracy, at 93%. Apart from the dimmer, all appliances operating under normal conditions were correctly identified with 100% accuracy, and the detection rate for SAFs exceeded 95%. The lower accuracy for the dimmer load is due to two main factors: First, its internal thyristor introduces an off-time during half-wave operation, reducing the presence of SAF feature signals during that interval. Second, the waveform characteristics of the dimmer under normal operation closely resemble those during an arc fault, making it difficult to distinguish between the two states, and leading to a higher false positive rate. With further tuning of the model’s hyperparameters, it is expected that the detection accuracy could be improved to meet more stringent diagnostic requirements.
While accuracy scores offer an overall view of the TDI-LSTM model’s performance, precision and recall scores provide deeper insights into how the algorithm makes errors. Ideally, higher accuracy and recall scores indicate better performance. The precision and recall scores, whose mathematical formulae can be referenced from Ref. [26], can be derived from a confusion matrix, as illustrated in Figure 17.
If the focus is solely on whether the arc fault is correctly detected(as shown in the Figure 17, the green box is considered correct while the red box is considered incorrect.), the precision and recall scores are 99.8% and 98.0%, respectively, with a detection accuracy as high as 98.9%. When considering the type of load recognized as well, the precision remains at 99.8%, while the recall score is 96.4%.

5. Comparison and Discussion

The TDI-LSTM method was evaluated by comparing it with several recent approaches in terms of method principle, detection accuracy, type identification, and sampling frequency. The attributes of these methods are summarized in Table 3. The types and power of appliances used in the previously reported methods are the same as or similar to those used in this study.
The TDI-LSTM approach utilizes a grayscale image generation method to preprocess load current signals, followed by a carefully designed LSTM and fully connected network to detect SAFSAFs. This method effectively addresses the challenges of arc fault detection in complex loads such as switching power supplies and dimmers.
Regarding the sampling rate, TDI-LSTM operates at a higher rate, which enables the capture of more detailed frequency information. However, this comes at the cost of increased hardware complexity and implementation expense. Therefore, a balance must be struck between detection performance and hardware feasibility.
In terms of load type classification, Refs. [3,18,24] were able to identify the general category to which a load belongs. In contrast, Ref. [32] and this study aimed to classify the specific type of load. While arc-fault detection standards do not explicitly require load type identification, this capability can help approximate the location of an arc fault. Additionally, this technology can be integrated with non-intrusive hybrid appliance monitoring systems. Such integration enables utility companies to better understand customers’ appliance usage patterns, monitor electricity consumption behavior, and provide guidance for optimizing energy use and promoting energy-saving practices.
Regarding its scope of application, the TDI-LSTM method supports a broader range of load types—including switched, inductive, resistive, and capacitive loads—compared to the approaches in Refs. [32,33,34].
In terms of detection accuracy, all methods aim to reliably identify arc faults. The TDI-LSTM approach ranks among the most accurate methods, with the potential for even higher performance through careful tuning of hyperparameters. It is worth noting that, in Reference [32], an ozone generator was used to simulate a SAF instead of using an actual arc fault generator. As a result, the reported accuracy may not accurately reflect the method’s effectiveness in real-world conditions.
The reduced detection accuracy for dimmer loads arises from the strikingly similar current waveforms exhibited by arcing faults and thyristor-based nonlinear loads during switching events. While this limitation is acknowledged herein, our future work will incorporate time-domain slicing analysis and attention-enhanced LSTM architectures to amplify discriminative features, specifically targeting nonlinear load interference mitigation.
The TDI-LSTM hardware implementation was based on the Zynq-7020 SoC (xc7z020clg400-2, Xilinx, San Jose, CA, USA), a system-on-a-chip integrating a dual-core ARM Cortex-A9 processor with FPGA. Concurrently, a high-speed ADC (AD9280, Analog Devices, Norwood, MA, USA) was employed for data acquisition—an 8-bit, 32 MSPS (million samples per second) analog-to-digital converter. The current sensor used was the N2783B (Keysight Technologies, Santa Rosa, CA, USA). Future work will explore more cost-effective alternatives for sensor optimization.

6. Conclusions

In this article, we propose a significant advancement in the detection of SAFs and propose an original method based on the TDI-LSTM framework, which combines time-domain imaging and deep learning to enhance arc fault detection accuracy. This approach effectively transforms complex current signals into interpretable grayscale images, facilitating the identification of arc fault characteristics. This approach eliminates the need for manually crafted features, offering a fully data-driven pipeline adaptable to various load types. However, a key limitation is the high computational cost associated with the required sampling rate (1 MS/s), which may pose challenges for deployment in resource-limited environments. Additionally, the method’s effectiveness is somewhat diminished when dealing with nonlinear loads such as dimmers, due to their internal switching characteristics. The reliance on supervised learning also necessitates extensive labeled datasets, which may not always be readily available in real-world environments.
In this paper, the current waveforms of five typical household loads in nominal operation and arc-fault state were collected by building the arc-fault detection platform. By decomposing and reconstructing the intrinsic mode functions of the arc-fault current, the characteristic frequency band of the high-frequency signal was determined to be within the range of 10 to 200 kHz. All information regarding the three fundamental features of the arc-fault current is fully reproduced within this frequency band. The grayscale image generation method is proposed to visualize the arc-fault features, using the vertical stripes, interrupted stripes, and random noise speckles to characterize the flat shoulder, flat shoulder rate of change, and high-frequency component signal of the arc fault, respectively, providing a theoretical basis for the intelligent arc fault diagnosis algorithm. For the results tested on 7000 measured labeled data, the TDI-LSTM method was adopted to classify and identify arc faults by using half-waves as the detection object, achieving efficient SAF identification with an accuracy of 98.9%.
Looking ahead, future research could focus on optimizing the computational efficiency of the algorithm to enable real-time processing on low-cost hardware platforms. Future work could explore lightweight model architectures and model compression for edge deployment. Unsupervised or semi-supervised learning techniques could reduce dependence on labeled data. Incorporating domain adaptation techniques may further improve generalization to unseen appliances or operating conditions. In conclusion, the TDI-LSTM method presents a promising solution for series arc-fault detection and holds strong potential for integration into smart home monitoring systems and non-intrusive load diagnostics.

Author Contributions

Writing—original draft preparation, R.C.; writing—review and editing, K.Y.; supervision, S.P.; funding acquisition, K.Y. All authors have read and agreed to the published version of the manuscript.

Funding

This work was supported in part by the National Natural Science Foundation of China, under Grant 52175508, and in part by the Intelligent Manufacturing Fujian University Applied Technology Engineering Center 2024 Open Subject Project, under Grant QUZN24-A03-09.

Institutional Review Board Statement

Not applicable.

Data Availability Statement

All data mentioned in this paper can be obtained from the corresponding author.

Acknowledgments

We extend our sincere gratitude to Jiajing Hong at the Quanzhou Jinjiang Hi-Tech Industrial Park Postdoctoral Research Station for providing an excellent research resources. We are also deeply thankful to Yuli Dong from the College of Civil Engineering, Huaqiao University, for his invaluable experimental guidance and expertise. Their support was essential to this work.

Conflicts of Interest

The authors declare no conflicts of interest.

References

  1. Fire and Rescue Department Ministry of Emergency Management. “Over 3000 Daily Fires Nationwide in First Half of 2023”. Available online: https://www.119.gov.cn/qmxfgk/sjtj/2023/38420.shtml (accessed on 26 January 2025).
  2. National Fire Protection Association. “Home Electrical Fires”. Available online: https://www.nfpa.org/education-and-research/research/nfpa-research/fire-statistical-reports (accessed on 6 April 2025).
  3. Chu, R.; Schweitzer, P.; Zhang, R. Series ac arc fault detection method based on high-frequency coupling sensor and convolution neural network. Sensors 2020, 20, 4910. [Google Scholar] [CrossRef] [PubMed]
  4. National Fire Protection Association. National Electrical Code; National Fire Protection Association: Quincy, MA, USA, 2014. [Google Scholar]
  5. GB/T31143-2014; General Requirements for Arc Fault Protection Appliances (AFDD). General Administration of Quality Supervision, Inspection and Quarantine of the People’s Republic of China: Beijing, China, 2014.
  6. GB14287.4-2014; Electrical Fire Monitoring System-Part 4: Arcing Fault Detectors 2014. General Administration of Quality Supervision. Inspection and Quarantine of the People’s Republic of China: Beijing, China, 2014.
  7. Underwriters Laboratories Inc. Standard for Safety Arc-Fault Circuit Interrupters, 2nd ed.; UL standard 1699; Underwriters Laboratories Inc.: Northbrook, IL, USA, 2011. [Google Scholar]
  8. Qu, N.; Wang, J.; Liu, J.; Wu, F. A series arc fault detection method based on Cassie model and L3/4 norm. Dianwang Jishu/Power Syst. Technol. 2018, 42, 3992–3997. [Google Scholar]
  9. Liu, Y.; Guo, F.; Li, L.; Wang, Z.; Wang, X. A kind of series fault arc mathematical model. Diangong Jishu Xuebao/Trans. China Electrotech. Soc. 2019, 34, 2901–2912. [Google Scholar]
  10. Kim, J.C. Electromagnetic radiation behavior of low-voltage arcing fault. IEEE Trans. Power Deliv. 2009, 24, 416–423. [Google Scholar] [CrossRef]
  11. Zhou, N.; Zhou, C.; Wang, Q.; Zhang, J.; Li, T. Improved laplacian score based fault feature selection of switchgear cabinet and its diagnosis. Dianwang Jishu/Power Syst. Technol. 2015, 39, 850–855. [Google Scholar]
  12. Cudina, M.; Prezelj, J. Evaluation of the sound signal based on the welding current in the gas-metal arc welding process. Proc. Inst. Mech. Eng. Part C J. Mech. Eng. Sci. 2003, 217, 483–494. [Google Scholar] [CrossRef]
  13. Cai, B.; Chen, D.; Wu, R.; Wang, X.; Gao, D.; Chen, W. Online detecting and protection system for internal faults arc in switchgear. Diangong Jishu Xuebao/Trans. China Electrotech. Soc. 2005, 20, 83–87. [Google Scholar]
  14. Yang, K.; Chu, R.; Zhang, R.; Xiao, J.; Tu, R. A novel methodology for series arc fault detection by time domain visualization and convolutional neural network. Sensors 2020, 20, 162. [Google Scholar] [CrossRef]
  15. Wang, W.; Xu, B.; Zou, G.; Liang, D. Arc fault detection method based on voltage characteristic energy amplitude and phase mapping distribution distances. Electr. Power Syst. Res. 2023, 225, 109866. [Google Scholar] [CrossRef]
  16. Li, J.; Zou, G.; Wang, W.; Shao, N.; Han, B.; Wei, L. Low-voltage series arc fault detection based on ECMC and VB-SCN. Electr. Power Syst. Res. 2023, 218, 109–222. [Google Scholar] [CrossRef]
  17. Wang, Y.; Zhang, F.; Zhang, X.; Zhang, S. Series ac arc fault detection method based on hybrid time and frequency analysis and fully connected neural network. IEEE Trans. Ind. Inform. 2018, 15, 6210–6219. [Google Scholar] [CrossRef]
  18. Wang, Y.; Zhang, F.; Zhang, S. A new methodology for identifying arc fault by sparse representation and neural network. IEEE Trans. Instrum. Meas. 2018, 67, 2526–2537. [Google Scholar] [CrossRef]
  19. Liu, X.; Zhao, Y.; Cao, Y.; Hou, C. Multi-feature fusion based diagnosis of series arc faults in ac system. Dianwang Jishu/Power Syst. Technol. 2014, 38, 795–801. [Google Scholar]
  20. Liu, X.; Zhao, Y.; Cao, Y.; Hou, C.; Wang, L. Series arc fault diagnosis based on wavelet transform in ac system. Diangong Jishu Xuebao/Trans. China Electrotech. Soc. 2014, 29, 10–17. [Google Scholar]
  21. Zhang, S.; Zhang, F.; Wang, Z.; Gu, H.; Ning, Q. Series arc fault identification method based on energy produced by wavelet transformation and neural network. Diangong Jishu Xuebao/Trans. China Electrotech. Soc. 2014, 29, 290–295. [Google Scholar]
  22. Han, X.; Li, D.; Huang, L.; Huang, H.; Yang, J.; Zhang, Y.; Wu, X.; Lu, Q. Series Arc Fault Detection Method Based on Category Recognition and Artificial Neural Network. Electronics 2020, 9, 1367. [Google Scholar] [CrossRef]
  23. Yu, Q.; Hu, Y.; Yang, Y. Identification Method for Series Arc Faults Based on Wavelet Transform and Deep Neural Network. Energies 2020, 13, 142. [Google Scholar] [CrossRef]
  24. Qu, N.; Zuo, J.; Chen, J.; Li, Z. Series arc fault detection of indoor power distribution system based on lvq-NN and PSO-SVM. IEEE Access 2019, 7, 184020–184028. [Google Scholar] [CrossRef]
  25. Yang, K.; Zhang, R.; Yang, J.; Du, J.; Chen, S.; Tu, R. Series arc fault diagnostic method based on fractal dimension and support vector machine. Diangong Jishu Xuebao/Trans. China Electrotech. Soc. 2016, 31, 70–77. [Google Scholar]
  26. Le, V.; Yao, X.; Miller, C.; Tsao, B.-H. Series DC Arc Fault Detection Based on Ensemble Machine Learning. IEEE Trans. Power Electron. 2020, 35, 7826–7839. [Google Scholar] [CrossRef]
  27. Chu, R.; Zhang, R.; Yang, K.; Jinchao, X. A series arc fault detection method based on multi-layer convolutional neural network. Dianwang Jishu/Power Syst. Technol. 2020, 44, 4792–4798. [Google Scholar]
  28. Chu, R.; Zhang, R.; Huang, Q.; Yang, K. TDI-LSTM: A new methodology for series arc fault detection in low power ac systems. In Proceedings of the 2020 IEEE Sustainable Power and Energy Conference (iSPEC), Chengdu, China, 25 November 2020; pp. 2319–2324. [Google Scholar]
  29. Huang, N.E.; Shen, Z.; Long, S.R.; Wu, M.C.; Shih, H.H.; Zheng, Q.; Yen, N.C.; Tung, C.C.; Liu, H.H. The empirical mode decomposition and the Hilbert spectrum for nonlinear and non-stationary time series analysis. Proc. Math. Phys. Eng. Sci. 1998, 454, 903–995. [Google Scholar] [CrossRef]
  30. Wu, Z.; Huang, N. Ensemble empirical mode decomposition: A noise-assisted data analysis method. Adv. Adapt. Data Anal. 2009, 1, 1–41. [Google Scholar] [CrossRef]
  31. Maaten, L.V.D.; Hinton, G. Visualizing data using t-SNE. J. Mach. Learn. Res. 2008, 9, 2579–2605. [Google Scholar]
  32. Siege, J.E.; Pratt, S.; Sun, Y.; Sarma, S.E. Real-time Deep Neural Networks for internet-enabled arc-fault detection. Eng. Appl. Artif. Intell. 2018, 74, 35–42. [Google Scholar] [CrossRef]
  33. Kim, J.C.; Neacsu, D.O.; Ball, R.; Lehman, B. Clearing Series AC Arc Faults and Avoiding False Alarms Using Only Voltage Waveforms. IEEE Trans. Power Deliv. 2020, 35, 946–956. [Google Scholar] [CrossRef]
  34. Tisserand, E.; Lezama, J.; Schweitzer, P.; Berviller, Y. Series arcing detection by algebraic derivative of the current. Electr. Power Syst. Res. 2015, 119, 91–99. [Google Scholar] [CrossRef]
Figure 1. (a) SAF; (b) parallel arc fault; (c) grounding arc fault; (d) complex arc fault.
Algorithms 18 00497 g001
Figure 2. Experimental schematic.
Algorithms 18 00497 g002
Figure 3. Experimental bench.
Algorithms 18 00497 g003
Figure 4. The current waveforms of five loads in nominal and arcing conditions. Sub-graphs in the left column (green curve) show the current waveform in nominal conditions, while the right (red curve) column shows that in arcing conditions. (a,b) Heater; (c,d) vacuum cleaner; (e,f) desktop computer; (g,h) dimmer; (i,j) fluorescent lamp.
Algorithms 18 00497 g004
Figure 5. The frequency spectrum distribution of current in nominal and arcing conditions. (a,b) Heater; (c,d) vacuum cleaner; (e,f) desktop computer; (g,h) dimmer; (i,j) fluorescent lamp.
Algorithms 18 00497 g005
Figure 6. (a) FFT of sampling current signal; (bn) FFT of each IMF component; (o) FFT of residual component.
Algorithms 18 00497 g006
Figure 7. Superposition of IMFs and corresponding FFTs: (a) High frequency signal during arc ignition; (b) FFT of arc ignition; (c) impulse signal due to “flat shoulder” feature; (d) FFT of impulse signal; (e) the operating current’s fundamental frequency and harmonic component; (f) FFT of operating current signal.
Algorithms 18 00497 g007
Figure 8. Flowchart of grayscale image generation.
Algorithms 18 00497 g008
Figure 9. Generated grayscale images: (a) electric heater arc current signal, (b) filtered current signal, (c) superposition of IMF8~IMF13, (d) superposition of IMF5~IMF7, (e) superposition of IMF2~IMF4, and (f) superposition of IMF2~IMF7.
Algorithms 18 00497 g009
Figure 10. The grayscale images of the five loads.
Algorithms 18 00497 g010
Figure 11. The internal structure of a single LSTM unit.
Algorithms 18 00497 g011
Figure 12. Grayscale images of electric heater after high-pass filtering of 1 kHz, 2 kHz, 5 kHz, 10 kHz, 50 kHz, 100 kHz, and 200 kHz.
Algorithms 18 00497 g012
Figure 13. The workflow of TDI-LSTM.
Algorithms 18 00497 g013
Figure 14. The (a) test accuracy and (b) loss function.
Algorithms 18 00497 g014
Figure 15. The accuracy scores of four configuration models.
Algorithms 18 00497 g015
Figure 16. Visualization of the hidden layer’s output with t-SNE (labels 0 and 1: heater; labels 2 and 3: vacuum cleaner; labels 4 and 5: computer; labels 6 and 7: dimmer; labels 8 and 9: fluorescent lamp.).
Algorithms 18 00497 g016
Figure 17. Confusion matrix.
Algorithms 18 00497 g017
Table 1. Model and manufacturer of the relevant instruments.
Main EquipmentModeCharacteristicManufacturer
Digitizer ModulePXIe-5122Bandwidth: 100 MHz

Maximum sampling rate: 100 MS/s

Analog input voltage: −10 V to 10 V

Analog input resolution: 14 bits
National Instruments

https://www.ni.com/zh-cn.html?srsltid=AfmBOopYU2sJmReat4pDG3KgCF7JxGRmgKKjM1dkenRGpU5pNb67zFzR (accessed on 5 August 2025)
Programmable AC Power SupplyIT-7626Output frequency: 10~5000 Hz,

Output mode: AC, DC, AC+DC,

Maximum power: 54 kVA,

Voltage: 0~300 V
ITECH https://www.itechate.com/en/ (accessed on 5 August 2025)
Adjustable Electronic LoadIT-8616Frequency range: 45~450 Hz,

Power range: 0–14.4 kVA,

Voltage range: 15~260 Vrms, 50~420 Vrms,

Current range: 0–160 Arms
ITECH
Current SensorN2783BBandwidth: DC to 100 MHz,

Maximum current: 30 Arms,

Accuracy: 1%
Keysight Technologies Santa Rosa, CA, USA https://www.keysight.com/us/en/home.html (accessed on 5 August 2025)
Table 2. TDI-LSTM recognition results.
Label01234
Accuracy100%99%100%96%100%
Label56789
Accuracy96%99%93%100%99%
Average detection accuracy: 98.1%
Table 3. Comparison with attributes of previous methods.
Ref.PrincipleSampling FrequencyApplication RangeClassify Load TypeDetection Accuracy
[3]High-frequency coupling sensor and convolutional neural network.1 MHzResistive, inductive, capacitive, and switching loads.99.2%
[18]Apply the sparse coefficients to a single fully connected NN for load type and working state identification.25 kHzResistive, inductive, capacitive, and switching loads.Above 94.3%
[24]Using the designed LVQ-NN and PSOSVM to detect the load type and arc fault, respectively.5 kHzResistive, inductive, capacitive, and switching loads.95.5%
[32]Deep neural networks (DNNs) taking Fourier coefficients, mel-frequency cepstrum data, and wavelet features as inputs.48 kHzResistive, capacitive, and switching loads, but no capacitive loads.99.95%

(the ozone generator represents a continuous series fault.
[33]Method based only on the voltage waveform measured at the power source.500 kHzResistive, inductive, capacitive, and switching loads.Not introduced in the paper.
[34]Compare the level of baseline and the output of the derivative estimation filter.1 MHzResistive and reactive loads, but no switching loads.Not introduced in the paper.
This workTDI-LSTM1 MHzResistive, inductive, capacitive, and switching loads.98.9%
Disclaimer/Publisher’s Note: The statements, opinions and data contained in all publications are solely those of the individual author(s) and contributor(s) and not of MDPI and/or the editor(s). MDPI and/or the editor(s) disclaim responsibility for any injury to people or property resulting from any ideas, methods, instructions or products referred to in the content.