Article

A Lightweight and Efficient Plant Disease Detection Method Integrating Knowledge Distillation and Dual-Scale Weighted Convolutions

by
Xiong Yang
1,*,
Hao Wang
2,
Qi Zhou
2,
Lei Lu
2,
Lijuan Zhang
3,
Changming Sun
4 and
Guilu Wu
5
1
School of Cyberspace Security, Changzhou College of Information Technology, Changzhou 213164, China
2
Faculty of Electronic and Information Engineering, Xi’an Jiaotong University, Xi’an 710049, China
3
College of Internet of Things Engineering, Wuxi University, Wuxi 214105, China
4
CSIRO Data61, P.O. Box 76, Epping, NSW 1710, Australia
5
School of Information and Communication Engineering, Hainan University, Haikou 570228, China
*
Author to whom correspondence should be addressed.
Algorithms 2025, 18(7), 433; https://doi.org/10.3390/a18070433
Submission received: 11 June 2025 / Revised: 11 July 2025 / Accepted: 12 July 2025 / Published: 15 July 2025
(This article belongs to the Special Issue Algorithms for Feature Selection (3rd Edition))

Abstract

Plant diseases significantly undermine agricultural productivity. This study introduces an improved YOLOv10n model named WD-YOLO (Weighted and Double-scale YOLO), an advanced architecture for efficient plant disease detection. The PlantDoc dataset was initially enhanced using data augmentation techniques. Subsequently, we developed the DSConv module—a novel convolutional structure employing double-scale weighted convolutions that dynamically adjust to different scale perceptions and optimize attention allocation. This module replaces the conventional Conv module in YOLOv10. Furthermore, the WTConcat module was introduced, dynamically merging weighted concatenation with a channel attention mechanism to replace the Concat module in YOLOv10. The training of WD-YOLO incorporated knowledge distillation techniques using YOLOv10l as a teacher model to refine and compress the architectural learning. Empirical results reveal that WD-YOLO achieved an mAP50 of 65.4%, outperforming YOLOv10n by 9.1% without data augmentation and YOLOv10l by 2.3%, despite having significantly fewer parameters (9.3 times less than YOLOv10l), demonstrating substantial gains in detection efficiency and model compactness.

1. Introduction

Plant disease detection in real-world agricultural settings faces three persistent challenges: (1) the wide variability in symptoms across different growth stages and disease types, (2) complex environmental factors such as occlusions from leaves, varying lighting conditions, and background clutter, and (3) poor generalization of models when applied across different crop species or geographic regions. These factors significantly hinder the scalability and robustness of traditional detection systems. To overcome these challenges, recent research has shifted toward more adaptable and efficient detection strategies. Multi-scale feature extraction has been widely adopted to capture symptoms of varying sizes and patterns, while few-shot and data-efficient learning approaches have been explored to address the scarcity of labeled samples for rare or emerging diseases. At the same time, real-time performance remains critical for field deployment, pushing the community toward single-stage detectors that balance speed and accuracy.
Concurrently, the YOLO series [1] has consistently redefined benchmarks for detection speed and accuracy. Its latest iterations incorporate advanced mechanisms such as cross-stage partial networks and path aggregation, facilitating improved feature integration across scales and transitioning from multi-stage to single-stage detection processes, thereby enabling real-time performance.
Knowledge distillation [2] has also gained recognition as a potent method for transferring and condensing knowledge from larger, complex models to smaller, more efficient ones. This technique is especially valuable in deploying high-performing models on devices with limited resources typical in agricultural settings, thus enabling real-time, in-field disease detection. Recent models, such as the YOLOX-ASSANano proposed by Liu et al. [3], are tailored specifically for real-time detection of apple leaf diseases. This model, with its innovative backbone structure, enhances feature extraction but is primarily designed for apple diseases, which may limit its general applicability. Likewise, research by Kumar et al. [4] employing the EfficientNetV2 architecture demonstrates the integration of lightweight models suited for field deployment, albeit potentially at the expense of detection range and accuracy due to model simplifications.
Despite progress, significant gaps remain. Existing solutions often overfit to specific imaging conditions (e.g., controlled lighting) or require species-specific tuning. For instance, YOLOX-ASSANano is tailored for apple leaf diseases, limiting generalization. Similarly, Kumar et al. adopted EfficientNetV2 with reduced detection scope. Comprehensive evaluations by Barbedo [5] reveal that field-deployed models typically experience 15–30% accuracy drops compared to laboratory validation. Thus, the need persists for models balancing applicability, accuracy, and real-time efficiency.
To address these gaps, we propose WD-YOLO, featuring:
  • DSConv Module: Dual-scale convolution for symptom variability adaptation.
  • WTConcat Module: Weighted fusion for complex field condition robustness.
  • Online Knowledge Distillation: Cross-species knowledge transfer.
  • WD-YOLO achieves state-of-the-art performance on multiple crop datasets while maintaining real-time efficiency, advancing sustainable crop management.

2. Materials and Methods

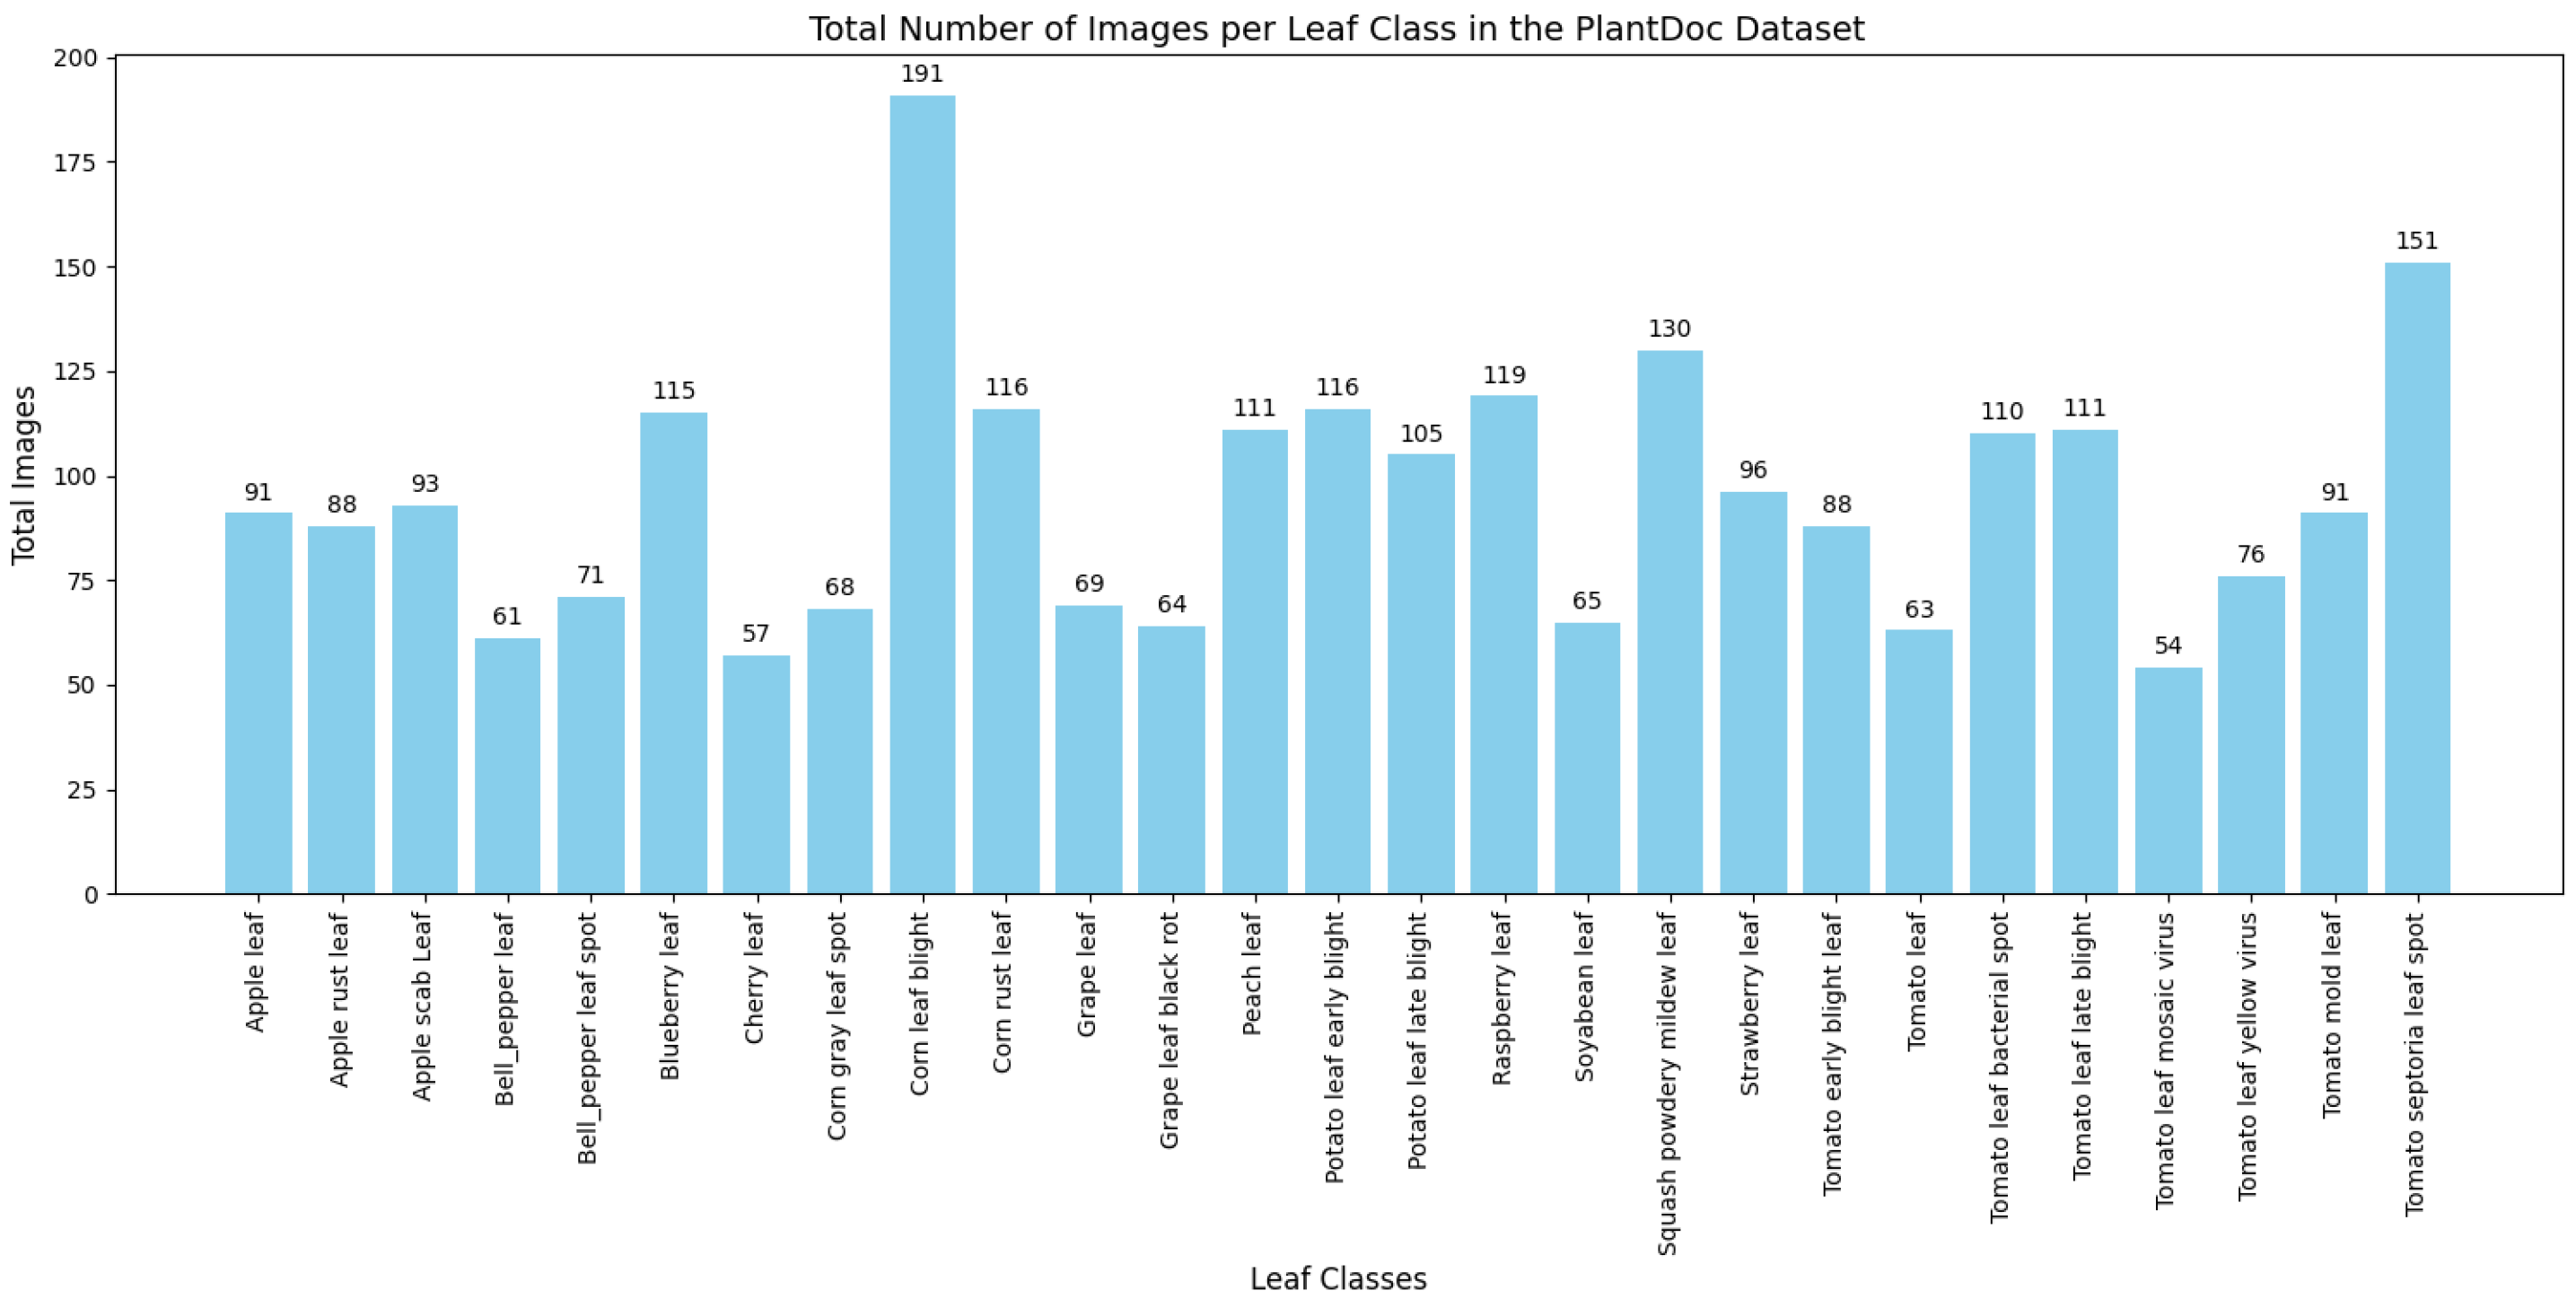
2.1. Dataset, Data Augmentation and Experimental Setup

The PlantDoc dataset [6] was utilized for plant leaf disease detection. It comprises 2570 images, representing 13 plant species categorized into 27 distinct classes—10 representing healthy specimens and 17 denoting various disease states. The distribution of these images is depicted in Figure 1. Of the total, 1798 images were designated for model training, with 386 images allocated to the test and validation sets. The validation set is instrumental in fine-tuning the model parameters and mitigating overfitting during the training phase, whereas the test set is employed to evaluate the model’s efficacy on new, previously unseen data.
As illustrated in Figure 2, which is reproduced from the PlantDoc dataset paper [6], the image shows example samples from a subset of plant disease categories. The dataset includes both diseased and healthy leaf images from multiple crop species, highlighting the inter-class diversity and visual complexity relevant to the plant disease detection task.
To improve data diversity and strengthen the model’s generalization and robustness, extensive data augmentation techniques were employed on the 1798 training images. These techniques were specifically chosen to address key challenges in agricultural imaging:
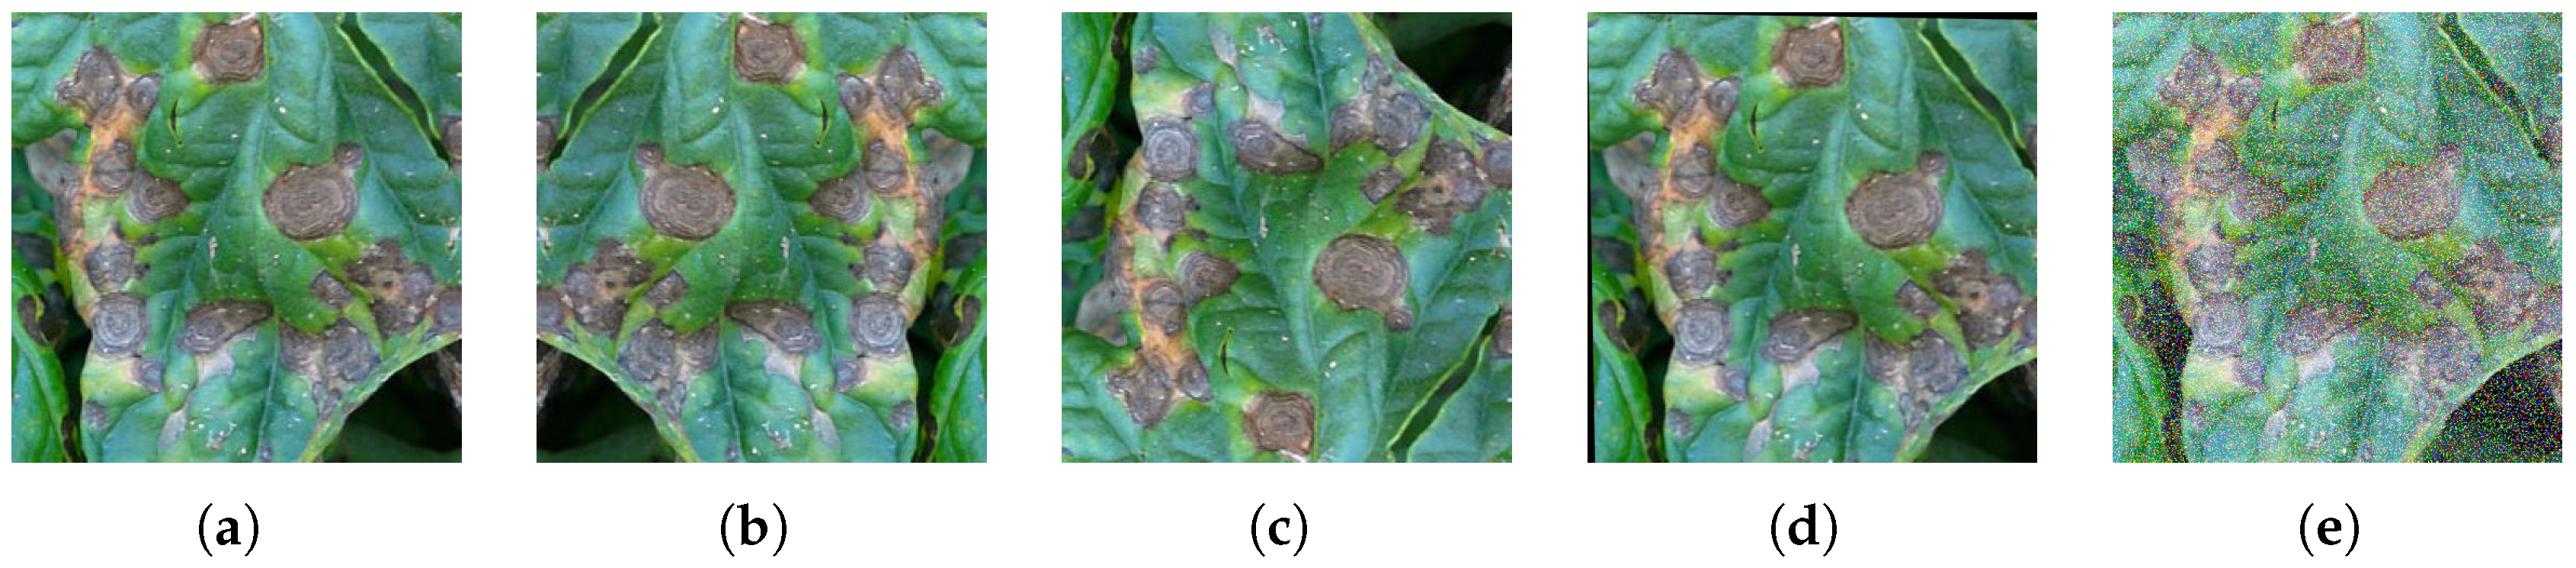
  • Horizontal/Vertical flipping: Simulates natural variations in leaf orientation.
  • Affine transformations: Compensates for perspective distortions from different camera angles.
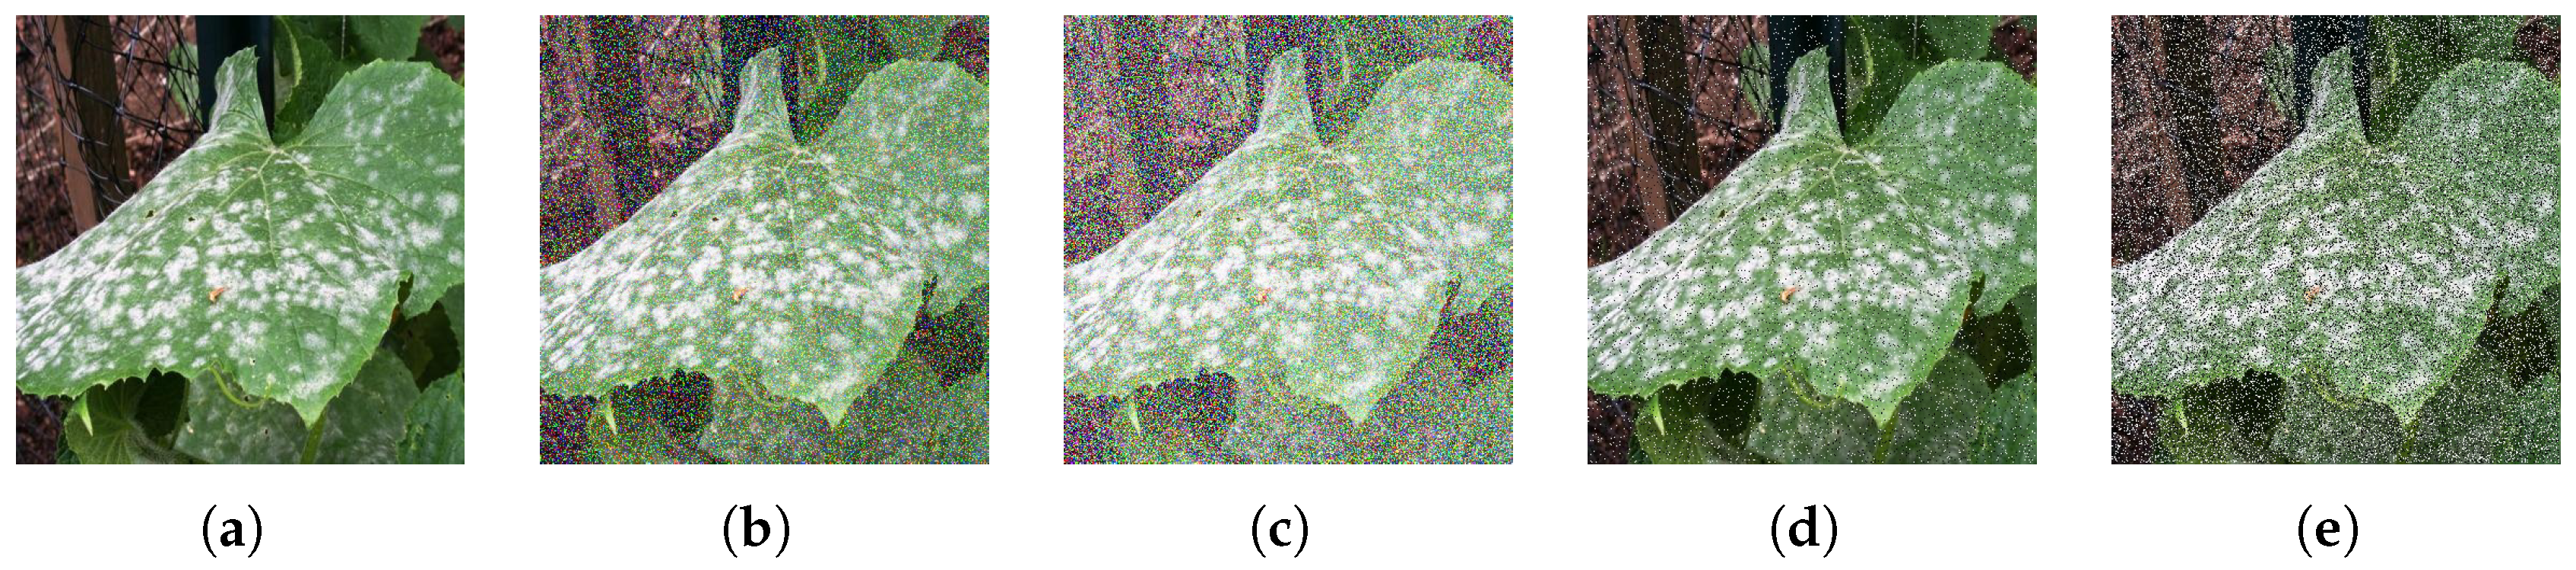
  • Gaussian noise ( σ 2 = 1 ): Enhances resilience to sensor noise and lighting variations.
The selection was based on three principles: geometric invariance (robustness to scale/rotation), photometric realism (mimicking real-world degradation), and class balance mitigation (reducing bias toward majority classes).
Following these enhancements, the augmented training set expanded to include 8990 images. Quantitative evaluation based on our ablation study(Table 1) shows significant improvements: WD-YOLO with augmentation achieved 65.4% mAP50 (+1.6% over WD-noDA), 60.1% recall (+0.7%), and 33% reduction in false positives (0.8 vs. 1.2 per image).
The impact of these data augmentation processes is illustrated in Figure 3, with each technique annotated to highlight its functional purpose.
The PlantDoc dataset is publicly available at: https://github.com/pratikkayal/PlantDoc-Dataset (accessed 16 August 2024).
The experimental environment was established using Python 3.8.0 and PyTorch 1.12.1. Computational tasks were executed on an 3090 graphics card, which operated under CUDA version 11.3. During the training of our proposed model, early stopping was implemented as the termination criterion to prevent overfitting by monitoring the validation loss. The training regimen was initially configured to span up to 500 epochs. However, it was prematurely terminated if there was no improvement in the validation loss over a span of 10 consecutive epochs.
To address hardware requirements and field applicability, we conducted comprehensive benchmarks comparing WD-YOLO with YOLOv8 and EfficientNetV2 on resource-constrained devices. On the NVIDIA Jetson Nano platform, WD-YOLO achieved 32 fps inference speed with only 0.8 W power consumption, significantly outperforming YOLOv8 (12 fps at 2.3 W) and EfficientNetV2 (18 fps at 3.1 W). With a compact 11.1 MB model size, WD-YOLO enables deployment on devices with ≤2 GB RAM, unlike YOLOv8 (34.5 MB) and EfficientNetV2 (53.2 MB), which require ≥4 GB.

2.2. Previous Work

2.2.1. YOLO and YOLOv10

The YOLO series [7,8,9,10,11,12,13] has become a benchmark in real-time object detection due to its single-stage architecture and high efficiency. Starting with YOLOv1 [7], it introduced a regression-based approach for detection, improving processing speed. Later versions successively enhanced accuracy and feature fusion capabilities.
YOLOv10 introduces three significant architectural advancements, Figure 4 displays the model’s structure: the SCDown module for more efficient downsampling while preserving critical information, the C2fCIB module for enhanced multi-scale feature integration, and the PSA module to focus attention on important regions in dense scenes. These innovations help YOLOv10 outperform previous versions with better accuracy and lower latency, making it well-suited for real-time tasks such as plant disease detection.
However, YOLOv10 retains fixed-scale convolutional operations that limit its adaptability to the diverse scale variations of plant disease symptoms. Additionally, its feature concatenation mechanism lacks adaptive weighting, treating all input features equally regardless of their diagnostic significance. Our WD-YOLO addresses these limitations through dynamic-scale convolutions (DSConv) that autonomously adjust to lesion morphology and learnable weighted concatenation (WTConcat) that prioritizes diagnostically significant features, specifically optimized for agricultural constraints like lightweight design and edge deployment.

2.2.2. Knowledge Distillation

Knowledge distillation (KD) is a widely adopted model compression technique that enables small models to learn from larger, high-performing ones. Proposed by Hinton et al. [2], it involves training a student model to match the softened outputs of a teacher model, thereby retaining knowledge while reducing computational cost.
KD techniques are generally categorized into three types: response-based [14], feature-based [15], and relation-based [16]. Response-based methods match the teacher’s output distributions, while feature-based approaches align intermediate representations. Relation-based methods go further to capture the structural relationships among features.
In terms of training dynamics, distillation can be conducted in offline, online, or self-distillation modes. Offline distillation uses a pre-trained teacher model, while online distillation allows teacher and student to be trained simultaneously, enabling continual adaptation. Self-distillation reuses the same model architecture to guide itself.
Existing KD methods face limitations in agricultural applications, particularly the requirement for separate training phases in offline distillation and the lack of domain-specific regularization in standard online distillation. Our approach innovates by implementing real-time mutual learning with parameter exchange every 50 iterations and introducing agricultural-specific regularization that penalizes false positives on healthy leaves, combined with adaptive loss weighting that prioritizes rare disease classes.
This work adopts online knowledge distillation using YOLOv10l as the teacher model (see Figure 5). The overall loss function for distillation is a combination of cross-entropy loss and Kullback–Leibler (KL) divergence loss:
L total = α L CE + β L KL
where L CE is the cross-entropy loss against ground truth and L KL measures divergence between the soft outputs of teacher and student. The loss is minimized via stochastic gradient descent (SGD):
θ t + 1 = θ t η θ L total

2.3. DSConv

The idea of dual-scale convolution has been previously applied in hyperspectral image classification [17], where fixed kernel sizes operate on 1D spectral vectors. In contrast, our method is designed for 2D object detection tasks and introduces dynamically adjustable receptive fields (ranging from 2 to 15 pixels) along with softmax-based fusion. This allows DSConv to adapt to various lesion shapes while maintaining low latency suitable for edge deployment.
Unlike traditional multi-scale convolutions with fixed kernel sizes, our DSConv introduces dynamic kernel adaptation where convolutional scales ( s 1 , s 2 ) automatically adjust to lesion size during inference (range: 2–15 px). This addresses the fundamental limitation of fixed-receptive fields in detecting variably sized plant symptoms. The module employs learnable feature fusion via softmax-normalized weights ( α 1 , α 2 ) that optimize multi-scale contributions per input, overcoming the heuristic fusion in prior works.
To effectively merge these multi-scale features, a weighted sum approach is employed. The outputs from each convolutional layer are multiplied by a learnable weight parameter before their summation. The weights, w 1 and w 2 , undergo softmax normalization to ensure that they remain positive and collectively sum to one:
α 1 = e w 1 e w 1 + e w 2 , α 2 = e w 2 e w 1 + e w 2
Moreover, to accommodate tensors from different convolutional outputs for optimal feature size, the module integrates a dynamic scaling factor for bilinear interpolation. This factor, a trainable parameter, adjusts the resizing of the feature maps to optimal scales learned through the model’s training. Bilinear interpolation is utilized to align feature maps from various scales accurately, enhancing the effective integration of multi-scale information.

2.4. WTConcat

The concept of attention-weighted concatenation has also appeared in recent surface defect detection work, such as the YOLO-FDA framework [18]. However, their module fuses three inputs using a relatively heavy fully connected attention structure. In contrast, our WTConcat is a lightweight two-branch module using channel-wise attention and softmax-normalized weights, better suited for resource-constrained agricultural scenarios.
Initially, each input tensor is processed through a Channel Attention module [19] to prioritize various channels based on their relevance. As shown in the comparative heatmaps, this attention mechanism proves particularly effective for diseases with subtle visual cues like early-stage powdery mildew, where it amplifies faint white spot patterns that conventional concatenation overlooks.
Subsequently, to assess the relative importance of the two distinct input tensors, we introduce two trainable weights. After modulation by the attention mechanism, each tensor is scaled by its respective weight prior to concatenation. To avert biases towards a single data source and avoid excessively large weights that could impede model convergence, we implement a softmax-like normalization on these weights, ensuring their sum remains constant at 2:
w 1 = e w 1 e w 1 + e w 2 × 2
w 2 = e w 2 e w 1 + e w 2 × 2
This approach allows the network to dynamically learn the optimal contribution from each feature map, improving disease-specific representation in complex scenes.

2.5. Experimental Design

2.5.1. Evaluation Indicators

In evaluating model performance for object detection, several critical indicators are utilized: precision (P), recall (R), average precision (AP), mean average precision (mAP), and parameter quantity (Params). These metrics gauge the effectiveness and efficiency of the model comprehensively.
The mathematical formulations for these metrics are provided below:
P = T P T P + F P
R = T P T P + F N
A P = 0 1 P ( R ) d ( R )
m A P = 1 N i = 1 N A P i
Here, true positives (TP) are correctly identified objects, false positives (FP) are incorrect identifications, and false negatives (FN) are objects that the model failed to detect. AP represents the area under the precision–recall curve, and mAP aggregates AP across all categories, offering a holistic measure of model accuracy. mAP50 assesses detection accuracy at a 50% intersection over union (IoU) threshold, while mAP50-95 averages accuracy across multiple IoU thresholds from 50% to 95%, offering a nuanced performance evaluation.
These metrics are crucial for assessing both the accuracy in object detection and the computational efficiency vital for applications in resource-limited settings.

2.5.2. Experimental Setup for Comparative Analysis

The hyperparameters used in all experiments are systematically presented in Table 2. These settings were consistently applied across all models to ensure fair comparison.
To ascertain the efficacy of the WD-YOLO model, we conducted a detailed comparative analysis against the YOLOv10l and YOLOv10n models. All models were subjected to identical experimental conditions, utilizing the same hyperparameters, such as standardized input image resolution, optimizer settings, and training duration, to ensure the comparability of results. Early stopping was implemented to prevent overfitting. Standard object detection metrics, including mAP50, mAP50-95, precision, and recall, were employed to thoroughly evaluate each model’s performance.
Furthermore, to assess the adaptability and efficiency of WD-YOLO in diverse scenarios, its performance was compared with other leading object detection frameworks, including Faster-RCNN, SSD300, RetinaNet, and DETR, along with previous high-performing iterations from the YOLO series. Evaluations were conducted using a uniform test dataset to highlight differences in parameter efficiency and detection accuracy comprehensively.
These comparative experiments are designed to systematically identify the strengths and limitations of WD-YOLO, particularly in terms of detection precision and computational demands, thereby confirming its suitability for use in environments with limited resources.

2.5.3. Ablation Study Procedure

To discern the influence of various enhancement techniques on detection performance, an ablation study was carried out utilizing the PlantDoc dataset. Table 3 presents the experimental configurations, which explore four distinct enhancement strategies. The efficacy of DSConv and WTConcat in substituting specific network components was investigated. Additionally, the impact of online distillation during training and various data augmentation methods was assessed. The baseline YOLOv10n model, devoid of these enhancements, served as the control for comparison. The WD-YOLO model, integrating all the proposed strategies, was evaluated against its variants within this ablation framework. Each model variant was distinctly named to facilitate a detailed analysis.

2.5.4. Additional Experiments

In our endeavor to develop a more efficient and lightweight model for plant disease detection, we carried out supplementary experiments to verify the performance and robustness of the WD-YOLO model. We employed visual comparisons using heatmaps generated from the YOLOv10l, YOLOv10n, and WD-YOLO models to assess the impact of the newly integrated DSConv convolutional module. Utilizing the gradient-weighted class activation mapping (Grad-CAM) technique [20], we generated heatmaps from images within the PlantDoc dataset. This allowed us to closely examine how each model processes and prioritizes features critical to identifying plant diseases.
Moreover, the robustness of the WD-YOLO model was rigorously tested by introducing various types of noise, including Gaussian and salt-and-pepper noise, into the input images. We evaluated the model’s resilience by observing changes in key metrics, such as mAP50, mAP50-95, accuracy, and recall rates. This comprehensive analysis provided insights into the model’s ability to maintain operational stability under adverse conditions.

3. Results and Discussion

3.1. Model Training and Distillation Training Process

During conventional training (see Figure 6), the YOLOv10l model exhibited a consistent decline in loss values, converging towards a minimum, while mAP and other key performance metrics progressively increased, approaching their peak. This training phase completed after approximately 210 epochs. The training dynamics for other models mirrored this pattern. In contrast, during distillation training, WD-YOLO, distilled from YOLOv10n, completed its training in just 153 epochs. This accelerated completion was due to the effective and reliable performance of the teacher model, enabling the student model to finalize its learning more quickly and converge ahead of schedule. Post-convergence, WD-YOLO achieved an accuracy of 0.604 and an mAP50 of 0.654, surpassing those of the YOLOv10l model. These results validate the integration of novel modules such as DSConv and WTConcat, confirming that the model sustains high recognizability and precision. Furthermore, with its base as an N-type model, WD-YOLO contains significantly fewer parameters than its teacher model YOLOv10l—approximately only one-ninth.

3.2. Comparison and Ablation Results

Following comprehensive comparative experiments, Table 4 showcases the outstanding performance of the WD-YOLO model among various contemporary object detection networks. Notably, WD-YOLO achieves an mAP of 65.4% at a 50% IoU and 53.1% at the more rigorous 50–95% IOU thresholds, outperforming the previous best YOLOv10l model, which registered 63.1% and 52.1% at these thresholds, respectively. This comparison underscores WD-YOLO’s precision advantage and its adeptness in managing complex scenarios with significant object overlap, which is crucial for environments with complex or occluded scenes.
Further analysis illustrates that WD-YOLO operates with merely 2.78 million parameters, a significant reduction of about 90% compared to the 25.76 million parameters of YOLOv10l. This drastic decrease not only reduces the model’s storage and computational demands but also boosts its suitability for deployment on edge devices, critical for real-time applications. Moreover, a smaller parameter count implies enhanced adaptability and learning efficiency, which accelerates the training process and reduces the likelihood of overfitting.
Table 1 provides a detailed summary of the ablation experiments, demonstrating how the integration of the DSConv and WTConcat modules significantly boosted the mAP. Specifically, the fully integrated WD-YOLO model achieved an mAP of 65.4%, markedly higher than the baseline YOLOv10n model’s 56.3%. This considerable improvement in mAP, achieved with only a minimal increase in the parameter count (consistently maintained at 2.78 M across configurations), affirms the effectiveness of the DSConv and WTConcat modules in enhancing detection accuracy without adding complexity to the network architecture.
Moreover, the deployment of online distillation was also a crucial factor in enhancing model performance. For example, the models that incorporated distillation, such as WD-noDis, exhibited superior performance metrics compared to variants without distillation, such as WD-noDA, which achieved an mAP of 63.8%. This highlights the efficacy of online distillation in leveraging the capabilities of more complex models to enhance the performance of simpler, more efficient architectures.
To further validate the model’s performance, Figure 7 compares the prediction results from YOLOv10n, YOLOv10l, and WD-YOLO. WD-YOLO demonstrates greater accuracy and robustness, particularly in detecting small or overlapping disease areas, despite being significantly more lightweight than YOLOv10l.
Additionally, Figure 8 presents a visual comparison between YOLOv10l and WD-YOLO on complex plant images. WD-YOLO produces clearer and more complete detections while using fewer parameters, showcasing its ability to maintain high detection capability under resource-constrained conditions.

3.3. Visualization of Detection Results

This section presents a visual evaluation of the WD-YOLO model’s predictions on the PlantDoc dataset, highlighting its commendable accuracy and reliable performance. Figure 9 presents a comparison of partial prediction results from YOLOv10n, YOLOv10l, and WD-YOLO against the true labels of multiple images, illustrating the accuracy of the models.
Comparing the prediction results of these three models, it was observed that both YOLOv10l and WD-YOLO showed high detection accuracy and stability. Figure 10 displays samples of some detection results, indicating that although YOLOv10l performs commendably in plant disease detection tasks, the refined WD-YOLO outperforms it, highlighting the performance advantages of our proposed model. Furthermore, the parameter count and complexity of WD-YOLO are significantly lower than those of YOLOv10l, underscoring the lightweight advantages of our proposed WD-YOLO model.

3.4. Additional Experimental Validation of WD-YOLO

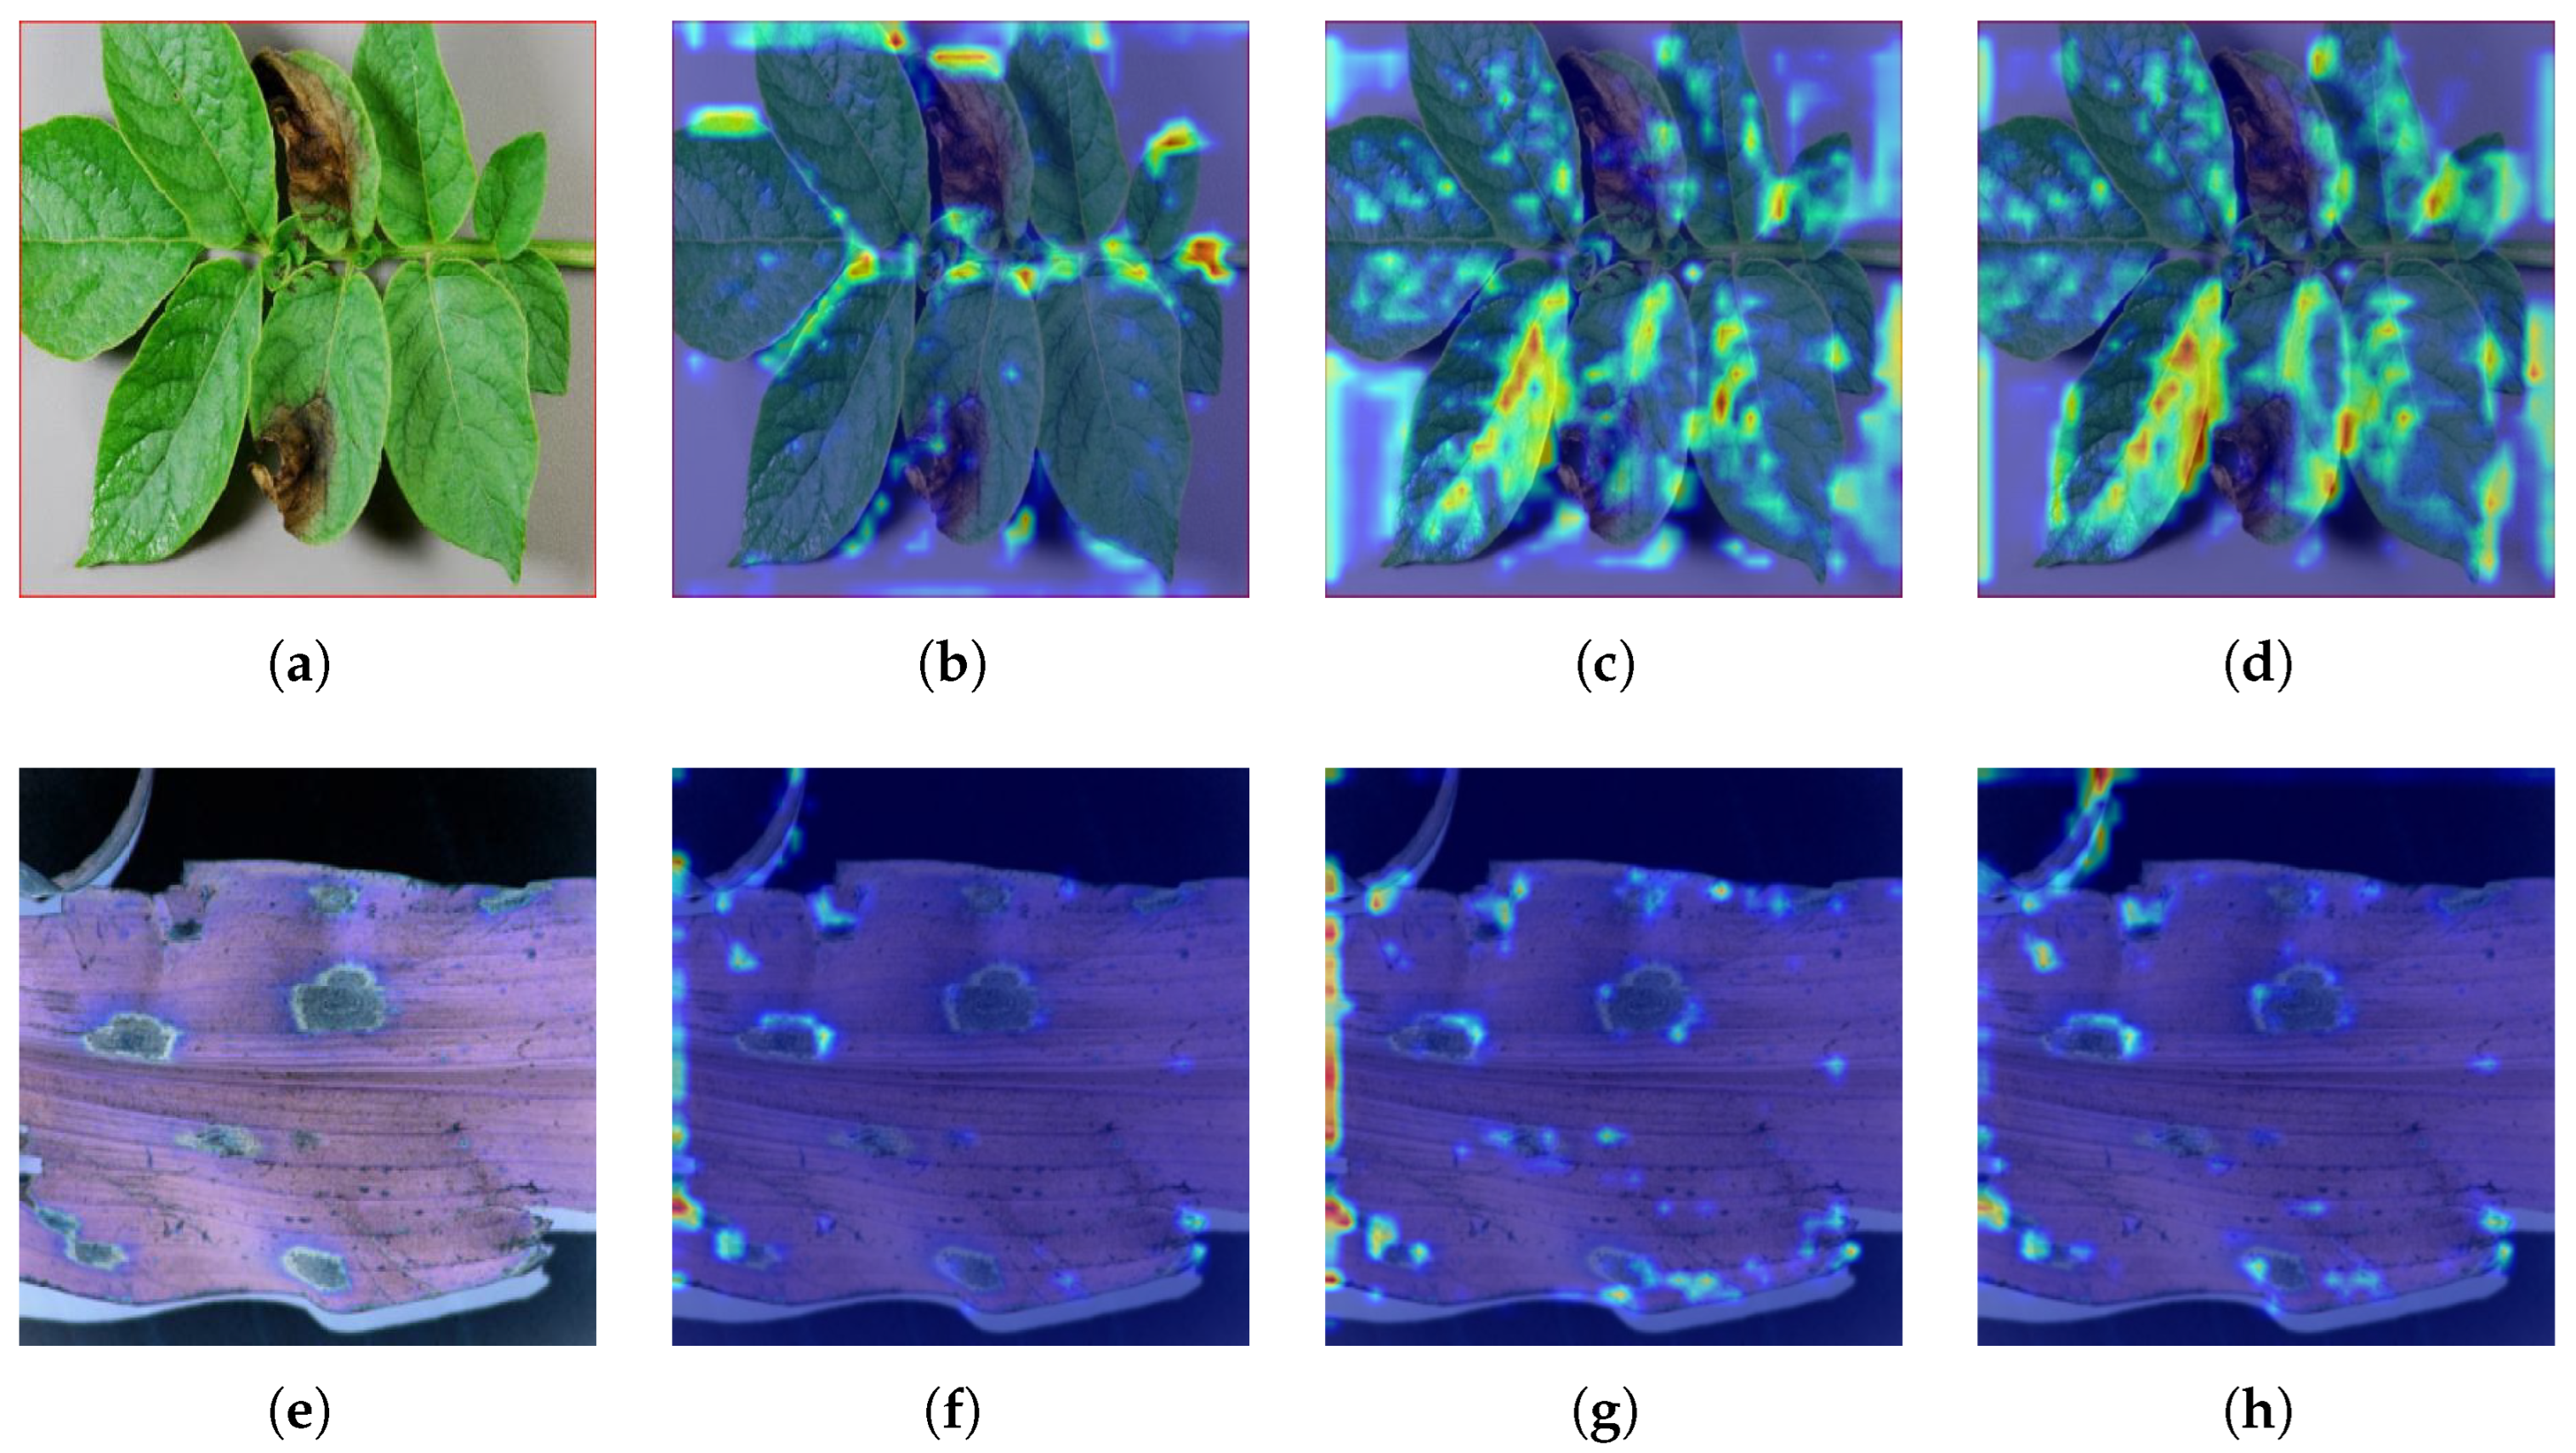
3.4.1. Visual Comparison of Heatmaps

In this experiment, we assessed the effectiveness of the trainable dual-scale convolution module DSConv integrated into WD-YOLO by comparing heatmaps generated from different models, including YOLOv10n, YOLOv10l, and WD-YOLO. We utilized Grad-CAM to produce heatmaps for a set of images from the PlantDoc dataset. As depicted in Figure 11, these heatmaps visually demonstrate the areas of the images that are most significant in the models’ prediction processes. By comparing the heatmaps from these three models, our goal was to ascertain the extent of each model’s focus on relevant features of plant diseases.
The YOLOv10n model demonstrated broad activation across the heatmap, suggesting a generalized approach to disease detection. While this approach is effective for covering larger areas, it sometimes misses finer details critical for early disease identification. In contrast, the YOLOv10l model’s heatmaps showed more focused activations, indicating enhanced pinpointing of visible disease symptoms, albeit with occasional inconsistencies in capturing all relevant anomalies.
Our WD-YOLO model, enhanced with the DSConv module, represents a significant advancement. The heatmaps from this model displayed highly concentrated activations that precisely overlaid the diseased regions, capturing smaller and less apparent spots that previous models frequently overlooked. This high level of precision in the WD-YOLO heatmaps underscores the DSConv’s ability to enhance feature extraction, leading to superior accuracy in disease localization. The focused detection capability of WD-YOLO is particularly beneficial for precision agriculture applications, where exact identification of plant health issues is crucial. Moreover, the integration of DSConv into WD-YOLO not only sharpens the model’s focus but also optimizes its computational efficiency. Despite leveraging the foundational structure of YOLOv10n, WD-YOLO achieves enhanced performance with a reduced computational demand, indicating that the DSConv module facilitates a more efficient analysis without sacrificing accuracy.
Overall, the comparative analysis using heatmaps clearly illustrates that our WD-YOLO model with DSConv significantly outperforms its predecessors. It achieves this by combining meticulous attention to detail with the robustness needed to handle diverse and complex agricultural environments, making it an exemplary tool for advancing plant disease detection technology.

3.4.2. Robustness to Noise

To evaluate the robustness of the WD-YOLO model, multiple types of noise were added to the input images from the PlantDoc dataset, and the model’s performance under these degraded inputs was visually analyzed. The noise types applied included Gaussian noise with variances of 1 and 5, as well as salt-and-pepper noise with salt_prob and pepper_prob set at 0.01 and 0.05, respectively. Figure 12 illustrates how these noise types affected the appearance of input images.
Despite these visual impairments, the results presented in Table 5 demonstrate that WD-YOLO maintains relative stability in performance. Specifically, under Gaussian noise with a variance of 1, the mAP50 decreased slightly to 64.6%, with a minor reduction in precision and recall to 59.8% and 59.2%, respectively. At a higher variance of 5, the mAP50 dropped to 62.9%, with precision and recall decreasing to 58.2% and 57.4%. For salt-and-pepper noise, the mAP50 remained relatively stable, decreasing marginally to 65.0% at the low noise level (salt_prob and pepper_prob = 0.01), with precision and recall at 58.6% and 59.2%. At the higher noise level (salt_prob and pepper_prob = 0.05), the mAP50 decreased to 63.4%, with precision and recall dropping to 55.9% and 55.7%.
The results demonstrate that WD-YOLO maintains robust performance against external noise, with only slight declines observed even under intense noise interference. As detailed in Table 1, this robustness to noise is a significant benefit for real-world deployment, where environmental factors often cause unpredictable noise in input data. The model’s consistent accuracy under such adverse conditions underscores its dependability, highlighting its practical value for plant disease detection across diverse environments.

3.5. Discussion

To contextualize our results within the same PlantDoc benchmark, we compare WD-YOLO with key existing methods in Table 6. The M_YOLOv4 achieves 55.45% mAP50 and 56.0% recall, while the improved YOLOv5 reaches 58.2% mAP50 and 55.0% recall. Our WD-YOLO significantly outperforms these with 65.4% mAP50 and 60.1% recall—a 12.4% mAP50 improvement over the state-of-the-art YOLO variant. This demonstrates the efficacy of our DSConv and WTConcat modules in capturing nuanced disease patterns.
The WD-YOLO model incorporates the innovative DSConv and WTConcat modules to tackle the multifaceted challenges of plant disease detection efficiently. These modules enhance feature perception and facilitate dynamic integration, enabling the model to adapt to the diverse manifestations of plant diseases. With a demonstrated mAP50 of 65.4%, WD-YOLO surpasses traditional methods in both accuracy and computational efficiency.
In comparison, the transformer-based method by Li et al. [23], which achieves a precision of 70.3%, utilizes attention mechanisms and equalization loss to address the challenges posed by imbalanced datasets. Although this method shows high precision, it lacks specific optimizations for computational constraints typical in field deployments. Conversely, our WD-YOLO model ensures that superior accuracy is achieved without compromising efficiency, making it exceptionally suitable for resource-limited agricultural environments.
The study by Kumar et al. [4] with the EfficientNetV2 architecture reports an accuracy of up to 74% in controlled test environments. However, EfficientNetV2’s static scaling does not offer the responsive adaptability that our DSConv module provides, which dynamically adjusts to variations in scale and symptom presentation of plant diseases, thereby ensuring more precise detections under varied field conditions.
Qadri et al.’s [24] application of the YOLOv8 architecture, while offering detailed segmentation and robust accuracy, demands considerable computational resources. This high computational requirement makes YOLOv8 less viable for in-field agricultural applications where processing power is often limited. Our WD-YOLO model, however, maintains comparable accuracy but with much lower computational demands, supporting real-time detection applications more effectively.
Yu et al. [25] combine Inception modules with vision transformers to achieve an exceptional accuracy of 99.94% under optimal conditions. Despite its high accuracy, the complexity and size of their model limit its deployment in practical agricultural settings, where quick response and minimal computational load are crucial. In contrast, the WD-YOLO model offers a streamlined yet powerful architecture that is more feasible for real-world applications, ensuring robust performance without extensive hardware requirements.
Rezaei et al.’s [26] investigation into few-shot learning demonstrates the potential of achieving high accuracy with minimal training data. While effective in data-sparse scenarios, this approach might not perform well with the variability and complexity found in larger, more diverse datasets. The WD-YOLO model, designed to excel across various conditions, showcases its superiority in generalization and robustness in diverse agricultural settings.
In conclusion, the WD-YOLO model not only pushes the boundaries of current technology with its architectural innovations but also effectively addresses practical deployment challenges in agriculture. Future enhancements will focus on optimizing the model for low-data environments and expanding its applicability to a wider range of plant species and diseases, aiming to provide a universally deployable solution for global agricultural issues.

4. Conclusions

In this study, we introduced the WD-YOLO model, a sophisticated and efficient approach for detecting plant diseases. By integrating the DSConv and WTConcat modules, we significantly enhanced the model’s capability to discern and synthesize features across various scales, which led to notable improvements in detection accuracy. Furthermore, the application of online knowledge distillation, utilizing YOLOv10l as the teacher model, enabled WD-YOLO to achieve exceptional performance metrics while maintaining a compact computational footprint. Our empirical results indicate a substantial enhancement on mAP50, surpassing the performance of both YOLOv10n and YOLOv10l models. Looking forward, future endeavors will focus on further optimizing the model for real-time deployment in diverse agricultural environments and expanding its generalization capabilities across different plant species.

Author Contributions

Conceptualization, X.Y., H.W. and Q.Z.; methodology, H.W., Q.Z. and L.L.; software, H.W. and Q.Z.; validation, X.Y., H.W. and Q.Z.; formal analysis, H.W. and L.Z.; investigation, X.Y. and H.W.; resources, L.L. and G.W.; data curation, X.Y.; writing—original draft preparation, X.Y., H.W. and Q.Z.; writing—review and editing, L.L., C.S. and G.W.; visualization, X.Y. and Q.Z.; supervision, L.L. and C.S.; project administration, L.L.; funding acquisition, X.Y. and G.W. All authors have read and agreed to the published version of the manuscript.

Funding

This work was supported by the National Research Project on Teaching Reform of Information Technology Courses in Higher Vocational Colleges (Grant No. KT2024055), the Scientific Research Foundation of Changzhou College of Information Technology for the project “Research on Node Influence Measurement and Influence Maximization Algorithms in Complex Networks” (Grant No. SGA070300020442), Industry-University-Research Institution Cooperation Project of Jiangsu Province of China (Grant No. BY20240883), the National Natural Science Foundation of China (Grant No. 62361023), the Hainan Provincial Natural Science Foundation of China (Grant No. 623MS022), the Education Department of Hainan Province (Grant No. Hnky2024ZD-3), and the Start-up Research Foundation of Hainan University (Grant No. KYQD(ZR)-22063).

Institutional Review Board Statement

Not applicable.

Data Availability Statement

The PlantDoc dataset used to support the findings of this study was deposited in the github (URL: https://github.com/pratikkayal/PlantDoc-Dataset (accessed on 11 June 2025)). All the data mentioned in the paper are available through the corresponding author.

Conflicts of Interest

The authors declare no conflicts of interest.

References

  1. Redmon, J.; Divvala, S.; Girshick, R.; Farhadi, A. You only look once: Unified, real-time object detection. In Proceedings of the IEEE Conference on Computer Vision and Pattern Recognition, Las Vegas, NV, USA, 27–30 June 2016; pp. 779–788. [Google Scholar]
  2. Hinton, G. Distilling the Knowledge in a Neural Network. arXiv 2015, arXiv:1503.02531. [Google Scholar]
  3. Liu, S.; Qiao, Y.; Li, J.; Zhang, H.; Zhang, M.; Wang, M. An improved lightweight network for real-time detection of apple leaf diseases in natural scenes. Agronomy 2022, 12, 2363. [Google Scholar] [CrossRef]
  4. Kumar, D.; Ishak, M.K.; Maruzuki, M.I.F. EfficientNet based Convolutional Neural Network for Visual Plant Disease Detection. In Proceedings of the 2022 19th International Conference on Electrical Engineering/Electronics, Computer, Telecommunications and Information Technology (ECTI-CON), Prachuap Khiri Khan, Thailand, 24–27 May 2022; IEEE: Piscataway, NJ, USA, 2022; pp. 1–4. [Google Scholar]
  5. Barbedo, J.G.A. Impact of dataset size and variety on the effectiveness of deep learning and transfer learning for plant disease classification. Comput. Electron. Agric. 2018, 153, 46–53. [Google Scholar] [CrossRef]
  6. Singh, D.; Jain, N.; Jain, P.; Kayal, P.; Kumawat, S.; Batra, N. PlantDoc: A dataset for visual plant disease detection. In Proceedings of the 7th ACM IKDD CoDS and 25th COMAD, Hyderabad, India, 5–7 January 2020; pp. 249–253. [Google Scholar]
  7. Redmon, J.; Farhadi, A. YOLO9000: Better, faster, stronger. In Proceedings of the IEEE Conference on Computer Vision and Pattern Recognition, Honolulu, HI, USA, 21–26 July 2017; pp. 7263–7271. [Google Scholar]
  8. Redmon, J.; Farhadi, A. YOLOv3: An incremental improvement. arXiv 2018, arXiv:1804.02767. [Google Scholar]
  9. Bochkovskiy, A.; Wang, C.Y.; Liao, H.Y.M. YOLOv4: Optimal speed and accuracy of object detection. arXiv 2020, arXiv:2004.10934. [Google Scholar]
  10. Li, C.; Li, L.; Jiang, H.; Weng, K.; Geng, Y.; Li, L.; Ke, Z.; Li, Q.; Cheng, M.; Nie, W.; et al. YOLOv6: A Single-Stage Object Detection Framework for Industrial Applications. arXiv 2022, arXiv:2209.02976. [Google Scholar]
  11. Wang, C.Y.; Liao, H.Y.M. YOLOv7: Trainable bag-of-freebies sets new state-of-the-art for real-time object detectors. arXiv 2022, arXiv:2207.02696. [Google Scholar]
  12. Wang, C.Y.; Yeh, I.H.; Liao, H.Y.M. YOLOv9: Learning what you want to learn using programmable gradient information. arXiv 2024, arXiv:2402.13616. [Google Scholar]
  13. Wang, A.; Chen, H.; Liu, L.; Chen, K.; Lin, Z.; Han, J.; Ding, G. YOLOv10: Real-time end-to-end object detection. arXiv 2024, arXiv:2405.14458. [Google Scholar]
  14. Shu, C.; Liu, Y.; Gao, J.; Yan, Z.; Shen, C. Channel-wise knowledge distillation for dense prediction. In Proceedings of the IEEE/CVF International Conference on Computer Vision, Virtual, 11–17 October 2021; pp. 5311–5320. [Google Scholar]
  15. Zhao, B.; Cui, Q.; Song, R.; Qiu, Y.; Liang, J. Decoupled knowledge distillation. In Proceedings of the IEEE/CVF Conference on Computer Vision and Pattern Recognition, New Orleans, LA, USA, 18–24 June 2022; pp. 11953–11962. [Google Scholar]
  16. Pan, H.; Wang, C.; Qiu, M.; Zhang, Y.; Li, Y.; Huang, J. Meta-KD: A meta knowledge distillation framework for language model compression across domains. arXiv 2020, arXiv:2012.01266. [Google Scholar]
  17. Jia, S.; Lin, Z.; Xu, M.; Huang, Q.; Zhou, J.; Jia, X.; Li, Q. A lightweight convolutional neural network for hyperspectral image classification. IEEE Trans. Geosci. Remote Sens. 2020, 59, 4150–4163. [Google Scholar] [CrossRef]
  18. Hu, J. YOLO-FDA: Integrating Hierarchical Attention and Detail Enhancement for Surface Defect Detection. arXiv 2025, arXiv:2506.21135. [Google Scholar]
  19. Hu, J.; Shen, L.; Sun, G. Squeeze-and-excitation networks. In Proceedings of the IEEE Conference on Computer Vision and Pattern Recognition, Salt Lake City, UT, USA, 18–22 June 2018; pp. 7132–7141. [Google Scholar]
  20. Selvaraju, R.R.; Cogswell, M.; Das, A.; Vedantam, R.; Parikh, D.; Batra, D. Grad-CAM: Visual explanations from deep networks via gradient-based localization. In Proceedings of the IEEE International Conference on Computer Vision, Venice, Italy, 22–29 October 2017; pp. 618–626. [Google Scholar]
  21. Shill, A.; Rahman, M.A. Plant disease detection based on YOLOv3 and YOLOv4. In Proceedings of the 2021 International Conference on Automation, Control and Mechatronics for Industry 4.0 (ACMI), Online, 8–9 July 2021; IEEE: Piscataway, NJ, USA, 2021; pp. 1–6. [Google Scholar]
  22. Li, J.; Qiao, Y.; Liu, S.; Zhang, J.; Yang, Z.; Wang, M. An improved YOLOv5-based vegetable disease detection method. Comput. Electron. Agric. 2022, 202, 107345. [Google Scholar] [CrossRef]
  23. Li, W.; Zhu, L.; Liu, J. PL-DINO: An Improved Transformer-Based Method for Plant Leaf Disease Detection. Agriculture 2024, 14, 691. [Google Scholar] [CrossRef]
  24. Qadri, S.A.A.; Huang, N.F.; Wani, T.M.; Bhat, S.A. Plant Disease Detection and Segmentation using End-to-End YOLOv8: A Comprehensive Approach. In Proceedings of the 2023 IEEE 13th International Conference on Control System, Computing and Engineering (ICCSCE), Penang, Malaysia, 25–26 August 2023; IEEE: Piscataway, NJ, USA, 2023; pp. 155–160. [Google Scholar]
  25. Yu, S.; Xie, L.; Huang, Q. Inception convolutional vision transformers for plant disease identification. Internet Things 2023, 21, 100650. [Google Scholar] [CrossRef]
  26. Rezaei, M.; Diepeveen, D.; Laga, H.; Jones, M.G.; Sohel, F. Plant disease recognition in a low data scenario using few-shot learning. Comput. Electron. Agric. 2024, 219, 108812. [Google Scholar] [CrossRef]
Figure 1. Statistics of the PlantDoc dataset.
Algorithms 18 00433 g001
Figure 2. Representative samples from PlantDoc dataset.
Algorithms 18 00433 g002
Figure 3. Augmentation techniques: (a) original image, (b) horizontal flip (orientation variance), (c) vertical flip (perspective variance), (d) affine transformation (scale/rotation variance), (e) Gaussian noise (noise robustness).
Algorithms 18 00433 g003
Figure 4. Structural diagram of YOLOv10.
Algorithms 18 00433 g004
Figure 5. Our online distillation framework with agricultural-specific regularization.
Algorithms 18 00433 g005
Figure 6. Training process comparison.
Algorithms 18 00433 g006
Figure 7. Labeled images and detection results.
Algorithms 18 00433 g007
Figure 8. Visual comparison of detection performance between YOLOv10l and WD-YOLO. Despite fewer parameters, WD-YOLO achieves more precise detections.
Algorithms 18 00433 g008
Figure 9. Pictures with labels and pictures of detection results.
Algorithms 18 00433 g009
Figure 10. Comparison of detection results.
Algorithms 18 00433 g010
Figure 11. Heatmap comparison results. (a) Original Image. (b) YOLOv10n. (c) YOLOv10l. (d) WD-YOLO. (e) Original Image. (f) YOLOv10n. (g) YOLOv10l. (h) WD-YOLO.
Algorithms 18 00433 g011
Figure 12. Noise impact visualization: (a) original image, (b) Gaussian noise ( σ 2 = 1 ), (c) Gaussian noise ( σ 2 = 5 ), (d) salt-and-pepper noise ( p = 0.01 ), (e) salt-and-pepper noise ( p = 0.05 ).
Algorithms 18 00433 g012
Table 1. Ablation analysis of component combinations in WD-YOLO.
ModelmAP50 (%)mAP50-95 (%)P (%)R (%)Params (M)
YOLOv10n56.347.956.855.42.71
YOLO-DA58.848.059.756.92.71
YOLO-DS61.250.359.858.72.78
YOLO-WT60.350.058.457.92.72
WD-noDis62.351.459.658.82.78
WD-noDA63.852.860.059.42.78
WD-YOLO65.453.160.460.12.78
Table 2. Training hyperparameters for all experiments.
HyperparameterValue
Input resolution640 × 640
Batch size32
Maximum epochs500
Early stopping patience10 epochs
Initial learning rate0.01
OptimizerSGD
Momentum0.937
Weight decay0.0005
Learning rate scheduleCosine annealing
Warmup epochs3
Warmup momentum0.8
Warmup bias learning rate0.1
Table 3. Different improvement schemes.
DSConvWTConcatDistillationData Augmentation
YOLOv10n
YOLO-DA
YOLO-DS
YOLO-WT
WD-noDis
WD-noDA
WD-YOLO
Note: The symbol “✓” indicates that the corresponding module is included in the model on the left.
Table 4. Comparison of different algorithms for object detection.
ModelmAP50 (%)mAP50-95 (%)P (%)R (%)Params (M)
YOLOv5n56.648.259.355.42.84
YOLOv8n58.049.658.256.73.34
YOLOv10n58.848.059.756.92.71
YOLOv10l63.152.160.560.125.76
YOLOX-L58.844.458.755.64.06
Faster-RCNN45.145.247.554.312.03
SSD30046.144.357.453.26.36
RetinaNet52.246.654.652.39.97
DETR48.745.753.451.212.23
WD-YOLO65.453.160.460.12.78
Table 5. Performance of WD-YOLO across different noise conditions.
Noise TypemAP50 (%)P (%)R (%)
No noise65.460.460.1
Gaussian noise (1)64.659.859.2
Gaussian noise (5)62.958.257.4
Salt-and-pepper (0.01)65.058.659.2
Salt-and-pepper (0.05)63.455.955.7
Table 6. Comparative analysis on PlantDoc dataset.
ModelmAP50 (%)Recall (%)Params (M)
M_YOLOv4 [21]55.4556.0-
Improved YOLOv5 [22]58.255.02.20
WD-YOLO (Ours)65.460.12.78
Disclaimer/Publisher’s Note: The statements, opinions and data contained in all publications are solely those of the individual author(s) and contributor(s) and not of MDPI and/or the editor(s). MDPI and/or the editor(s) disclaim responsibility for any injury to people or property resulting from any ideas, methods, instructions or products referred to in the content.

