Article

Clinical Validation of a Computed Tomography Image-Based Machine Learning Model for Segmentation and Quantification of Shoulder Muscles

by
Hamidreza Rajabzadeh-Oghaz
1,
Josie Elwell
1,
Bradley Schoch
2,
William Aibinder
3,
Bruno Gobbato
4,
Daniel Wessell
2,
Vikas Kumar
1 and
Christopher P. Roche
1,*
1
Exactech, Inc., 2320 NW 66th Ct., Gainesville, FL 32653, USA
2
Mayo Clinic, 4500 San Pablo Rd, Jacksonville, FL 32224, USA
3
Department of Orthopedic Surgery, University of Michigan, 24 Frank Lloyd Wright Drive, Ann Arbor, MI 48106, USA
4
Coe Jaragua. R. José Emmendoerfer, 1449-Nova Brasília, Jaraguá do Sul 89252-278, SC, Brazil
*
Author to whom correspondence should be addressed.
Algorithms 2025, 18(7), 432; https://doi.org/10.3390/a18070432
Submission received: 10 June 2025 / Revised: 27 June 2025 / Accepted: 1 July 2025 / Published: 14 July 2025
(This article belongs to the Special Issue Machine Learning in Medical Signal and Image Processing (3rd Edition))

Abstract

Introduction: We developed a computed tomography (CT)-based tool designed for automated segmentation of deltoid muscles, enabling quantification of radiomic features and muscle fatty infiltration. Prior to use in a clinical setting, this machine learning (ML)-based segmentation algorithm requires rigorous validation. The aim of this study is to conduct shoulder expert validation of a novel deltoid ML auto-segmentation and quantification tool. Materials and Methods: A SwinUnetR-based ML model trained on labeled CT scans is validated by three expert shoulder surgeons for 32 unique patients. The validation evaluates the quality of the auto-segmented deltoid images. Specifically, each of the three surgeons reviewed the auto-segmented masks relative to CT images, rated masks for clinical acceptance, and performed a correction on the ML-generated deltoid mask if the ML mask did not completely contain the full deltoid muscle, or if the ML mask included any tissue other than the deltoid. Non-inferiority of the ML model was assessed by comparing ML-generated to surgeon-corrected deltoid masks versus the inter-surgeon variation in metrics, such as volume and fatty infiltration. Results: The results of our expert shoulder surgeon validation demonstrates that 97% of ML-generated deltoid masks were clinically acceptable. Only two of the ML-generated deltoid masks required major corrections and only one was deemed clinically unacceptable. These corrections had little impact on the deltoid measurements, as the median error in the volume and fatty infiltration measurements was <1% between the ML-generated deltoid masks and the surgeon-corrected deltoid masks. The non-inferiority analysis demonstrates no significant difference between the ML-generated to surgeon-corrected masks relative to inter-surgeon variations. Conclusions: Shoulder expert validation of this CT image analysis tool demonstrates clinically acceptable performance for deltoid auto-segmentation, with no significant differences observed between deltoid image-based measurements derived from the ML generated masks and those corrected by surgeons. These findings suggest that this CT image analysis tool has potential to reliably quantify deltoid muscle size, shape, and quality. Incorporating these CT image-based measurements into the pre-operative planning process may facilitate more personalized treatment decision making, and help orthopedic surgeons make more evidence-based clinical decisions.

1. Introduction

The deltoid is the largest muscle in the shoulder and the primary elevator of the arm. The deltoid functions in coordination with the rotator cuff, to drive shoulder motion, as the rotator cuff dynamically stabilizes the humeral head by centering it on the glenoid of the scapula to maintain joint stability [1]. Degenerative changes to the deltoid and rotator cuff shoulder muscles, such as fat infiltration (FI) and loss of muscle mass due to atrophy, can impact shoulder joint function, and result in joint instability and reduced range of motion. Specifically, a non-functional deltoid muscle can limit the ability to elevate the arm and reduce motion in multiple planes, including both abduction and forward flexion [2,3,4,5]. Substantial impairment of arm elevation in these planes of motion can hinder many activities of daily living.
When orthopedic surgeons evaluate patients considering shoulder arthroplasty for the treatment of various degenerative conditions of the shoulder, that clinical assessment generally relies on range of motion measurements and subjective assessments of pain and function. While pre-operative imaging, including computed tomography (CT) and magnetic resonance imaging (MRI), is becoming increasingly common for patients with shoulder issues, surgeons typically assess images of the deltoid and other shoulder muscles through visual and subjective evaluations. The emerging field of radiomics has potential to augment the pre-operative assessment process through the use of more quantitative assessment measures. By extracting pixel-level data from the medical image, radiomics can transform medical image data into numerical representations that objectively characterize the patient’s anatomy and pathology.
However, the use of advanced image-based analyses first requires segmentation of the muscles and bones of interest. To isolate these anatomic structures for analysis, the boundaries of the bones/muscles must be delineated, which can be performed through manual segmentation (which is tedious and time-consuming) or by semi-automated or automated techniques (which requires rigorous validations to ensure accuracy). Several researchers have previously published studies using manual and/or automated segmentation of shoulder muscles from MRI and CT images [6,7,8,9,10,11,12,13,14]. However, none of these shoulder studies have performed automated radiomic analyses from CT images or examined the impact of model accuracy relative to quantified features of the region of interest.
Recent advances in machine learning (ML)-based clinical outcomes research have made it possible to utilize patient-specific data to predict clinical outcomes after anatomic (aTSA) and reverse (rTSA) total shoulder arthroplasty [15,16,17,18,19,20]. Such ML-based research has led to the development of novel clinical decision support tools which have helped surgeons make more evidence-based decisions using pre-operative patient demographic data, comorbidities, range of motion data, and subjective patient reports of pain and function [21,22]. However, these ML predictive algorithms do not currently utilize any radiomic-based measurements as model inputs.
Two recent studies evaluating pre-operative CT images from patients who underwent aTSA and rTSA reported that the shape and size of the deltoid muscle, particularly its flatness, volume, and sphericity, are predictive of active range of motion after aTSA and rTSA [23,24]. Given these findings, pre-operative evaluation of the deltoid muscle is likely important and may be helpful to improve treatment decision making. Since patients with non-functional deltoids may suffer from poorer surgical outcomes, clinical assessment techniques that consider the size, shape, and quality of the deltoid muscle may also help improve clinical outcome predictions.
The utilization of image-based data as inputs for clinical decision support tools necessitates the development of new image-based ML algorithms. Establishing the clinical validity of these tools/algorithms through rigorous evaluation by subject matter experts is a prerequisite for clinical deployment. The aim of this study is to conduct a shoulder expert validation of a novel ML-based framework which auto-segments the deltoid muscle from shoulder CT images and quantifies the volume, shape, and fatty infiltration.

2. Materials and Methods

The deltoid quantification pipeline includes a CT-based auto-segmentation model that delineates the muscle boundary relative to the surrounding tissue, followed by post-processing, and quantification of volume, fatty infiltration, and radiomics [23,24].

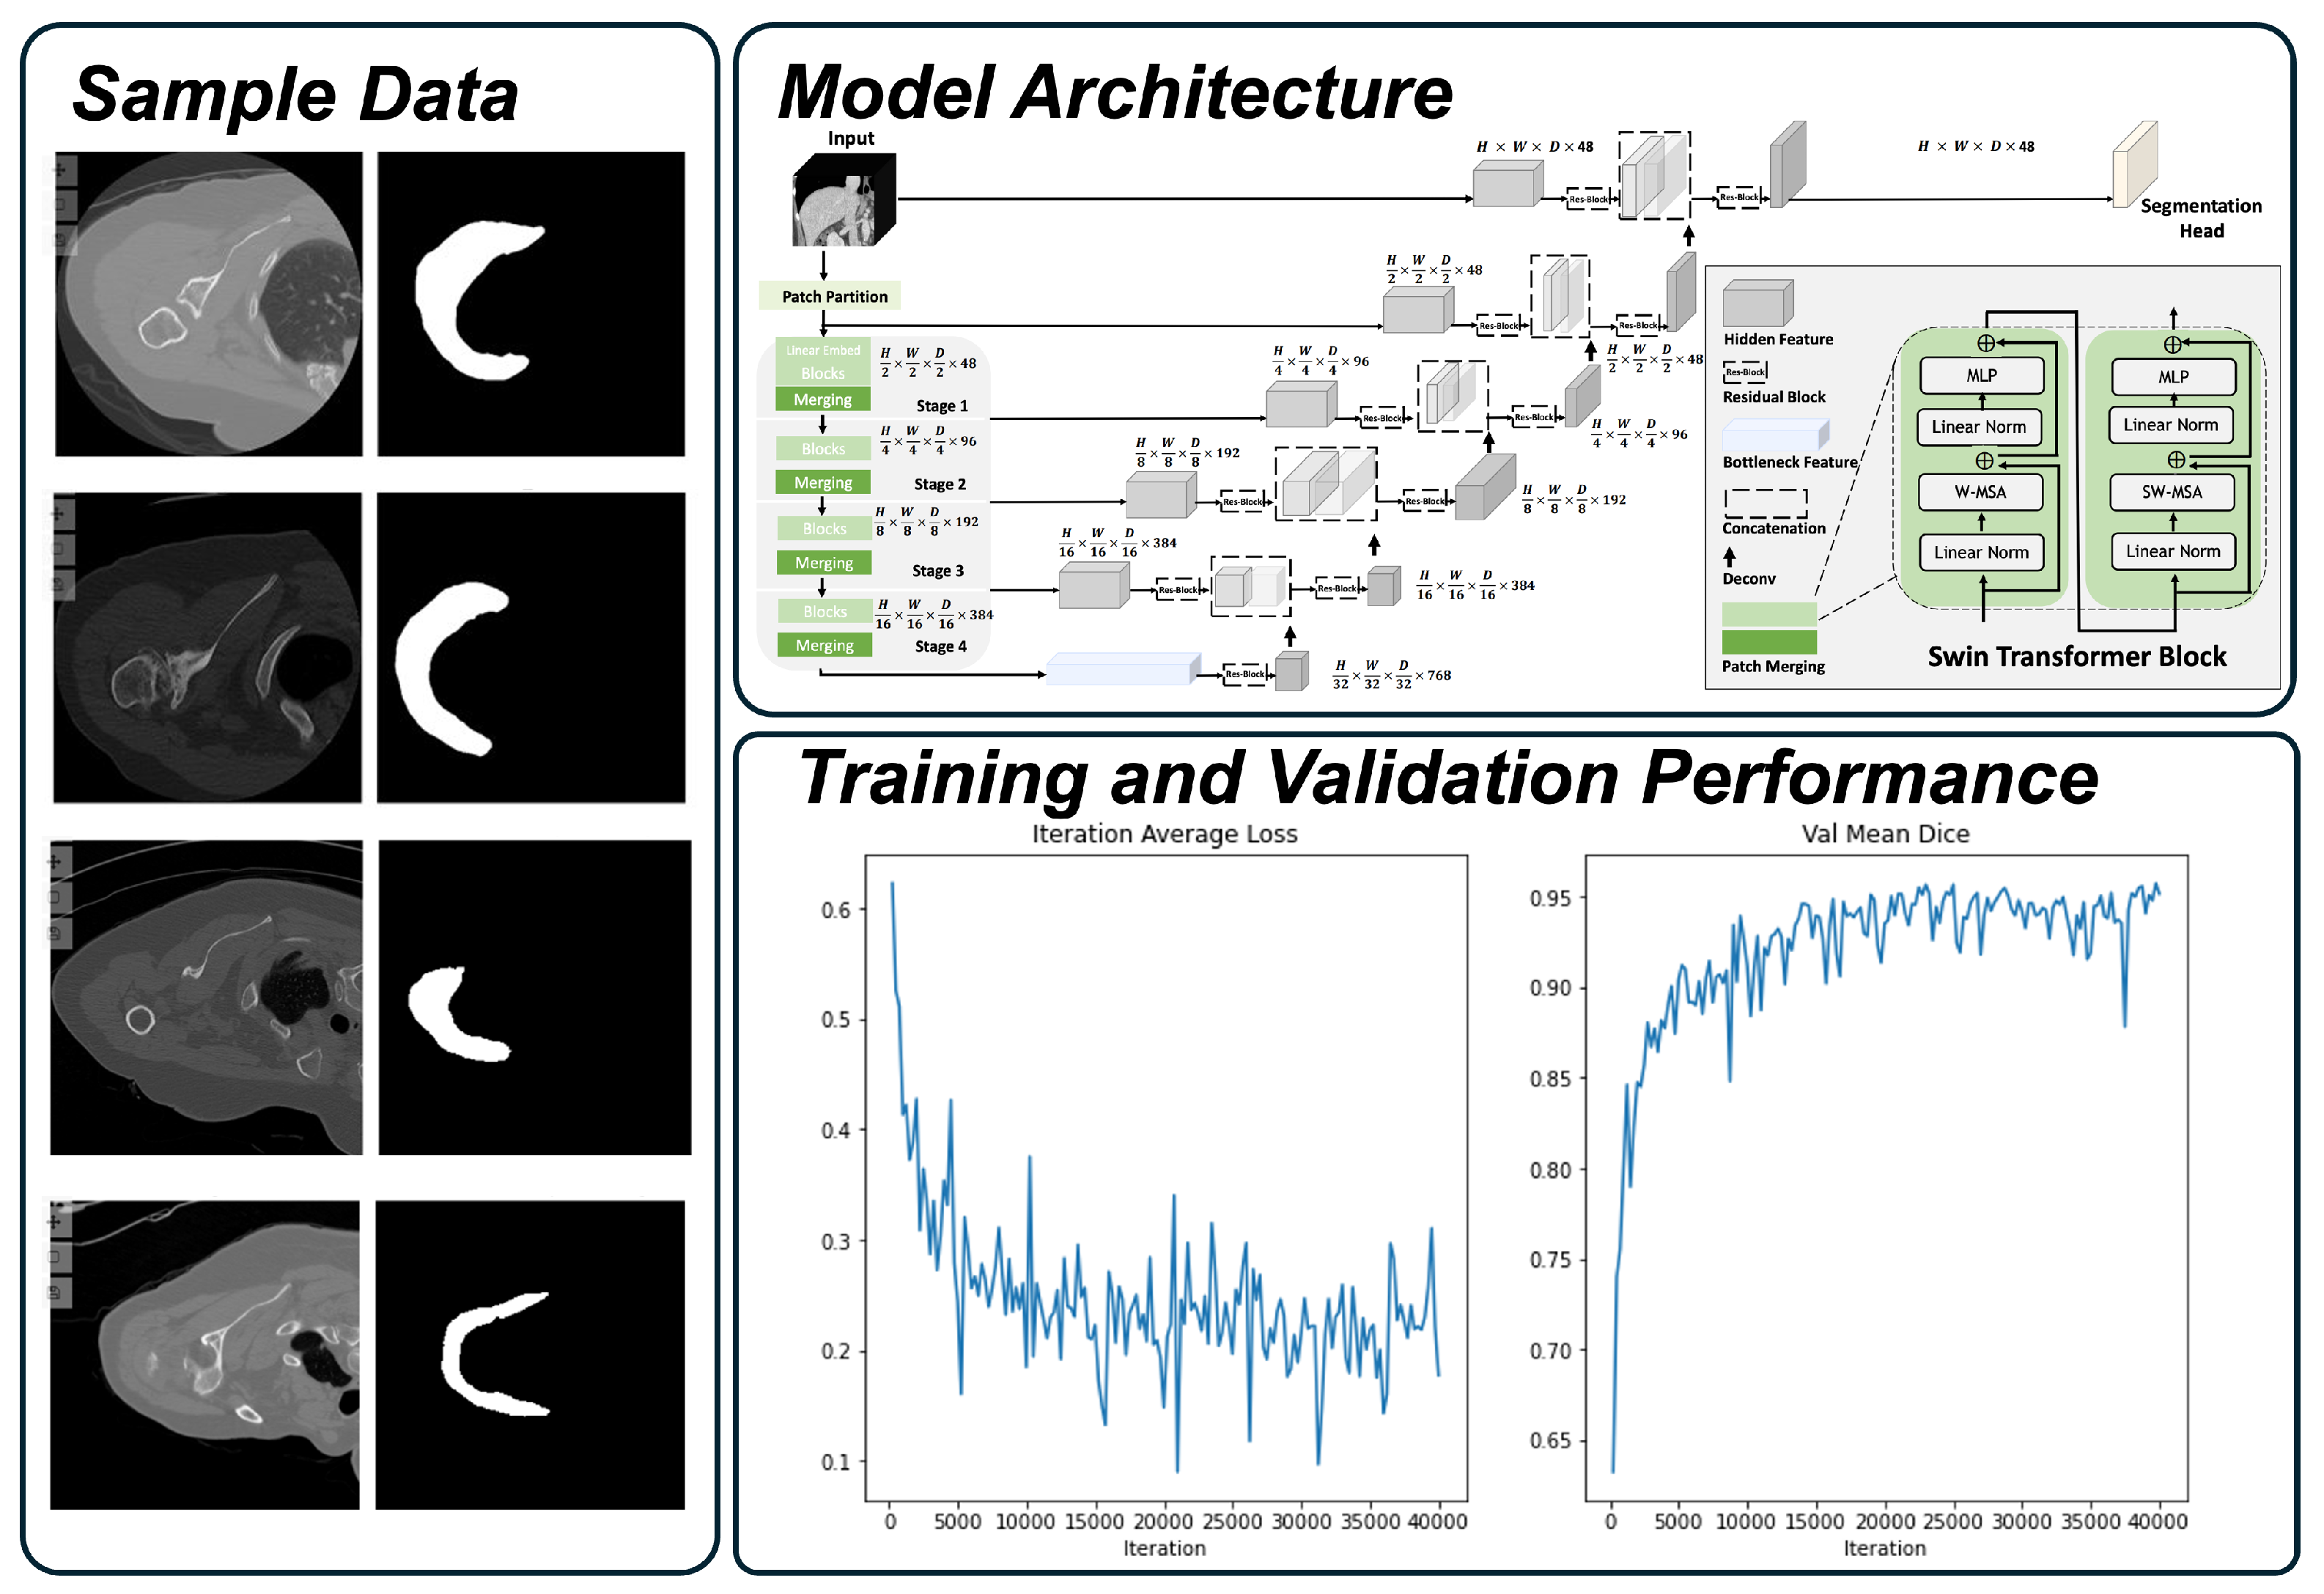
2.1. Deltoid Segmentation Model

Pre-operative CT images of patients who underwent shoulder arthroplasty were collected from an IRB-approved multi-center clinical outcome database of a single-platform shoulder prosthesis (Equinoxe, Exactech, Inc., Gainesville, FL, USA). All patients enrolled in this IRB-approved study provided informed consent. Inclusion criteria included primary arthroplasty with diagnoses of osteoarthritis, rotator cuff arthropathy, or rotator cuff tear. Additionally, each patient’s CT scan must include complete acquisition of the deltoid muscle and scapular bone. Patients with CT images that included a metal artifact were excluded.
All CT images were acquired using the ExactechGPS acquisition protocol. This CT protocol permits CT image slice thicknesses between 0.3 and 1.25 mm, with a recommended thickness of 0.625 mm and pixel resolutions between 0.3 × 0.3 mm to 1 × 1 mm. Additionally, this acquisition protocol permits CT images using multiple different convolution kernels from different CT manufacturers, including (but not limited to) BONE (GE Healthcare, Chicago, IL, USA), B41 (Siemens Healthineers, Erlangen, Germany), and FC30 (Toshiba/Canon Medical, Tustin, CA, USA). Please refer to Table 1 for additional information.
Deltoid masks were manually annotated by technicians with knowledge of shoulder anatomy using 3D slicer software (version 5.4.0; https://www.slicer.org, 10th May 2025) under the supervision of an experienced shoulder surgeon. These manually segmented masks served as training data for the ML-based auto-segmentation algorithm. An iterative batch-based human-in-the-loop approach was adopted for mask generation and model training. The process started with creating initial deltoid masks that were manually segmented for 60 patients. Next, a segmentation model was trained and used to create a new batch of masks for the remaining cases, which then underwent a correction process carried out by the technicians. These deltoid masks were then used as training data for additional iterations of the auto-segmentation ML model. In each iteration, the model was assessed using quantitative and qualitative assessments; specifically, model performance was quantified by the Dice coefficient, which quantified the similarity/voxel overlap between the predicted deltoid model and the ground truth generated by the technician. Iterative training continued until the model achieved a Dice coefficient of >0.90 on the internal test dataset.
We used a pre-trained model, SwinUnetR [25], which utilizes a U-shaped network with a Swin transformer as the encoder and connects it to a CNN-based decoder, to auto-segment the deltoid. Data were split by a ratio of 80:20 for training and internal testing cohorts. The CT-scans underwent multiple augmentation sequences, including flipping, with a probability of 0.5 for all three axes and shifts in intensity in the range [−0.1, 0.1]. A hybrid parameter, which computes both Dice loss and cross-entropy loss, was utilized as the loss function. The Adam optimizer was used with a learning rate of 0.0001 and a weight decay coefficient of 0.00005. The SwinUnetR configurations were set for image dimensions of 64 × 64 × 64, a network feature size of 48, and a maximum number of iterations of 40,000. The model inference (i.e., ML mask generation) was followed by a pre-defined post-processing pipeline, in which we performed island removal and surface smoothing. Finally, a quantification pipeline measured numerous metrics, such as: fatty infiltration (FI—percentage of fat within the muscle based on Hounsfield unit values), deltoid volume, normalized deltoid volume (deltoid volume normalized across all patients of the same age and gender), and radiomic features [23,24,26]. Please refer to Figure 1 for additional information related to the model architecture.

2.2. Internal Development

After five rounds of adding more deltoid labels, the model’s performance achieved a Dice coefficient of 0.93 ± 0.03 on the internal test dataset. A total of 97 deltoid masks were used for training and internal validation. In total, 71% of patients were female, 63% of patients were diagnosed with osteoarthritis, and 82% of patients had been treated with rTSA. The majority of CTs were imaged using GE scanners, followed by Siemens and then Toshiba scanners. Additional detailed patient information and imaging parameters used in the internal development dataset are described in Table 2.

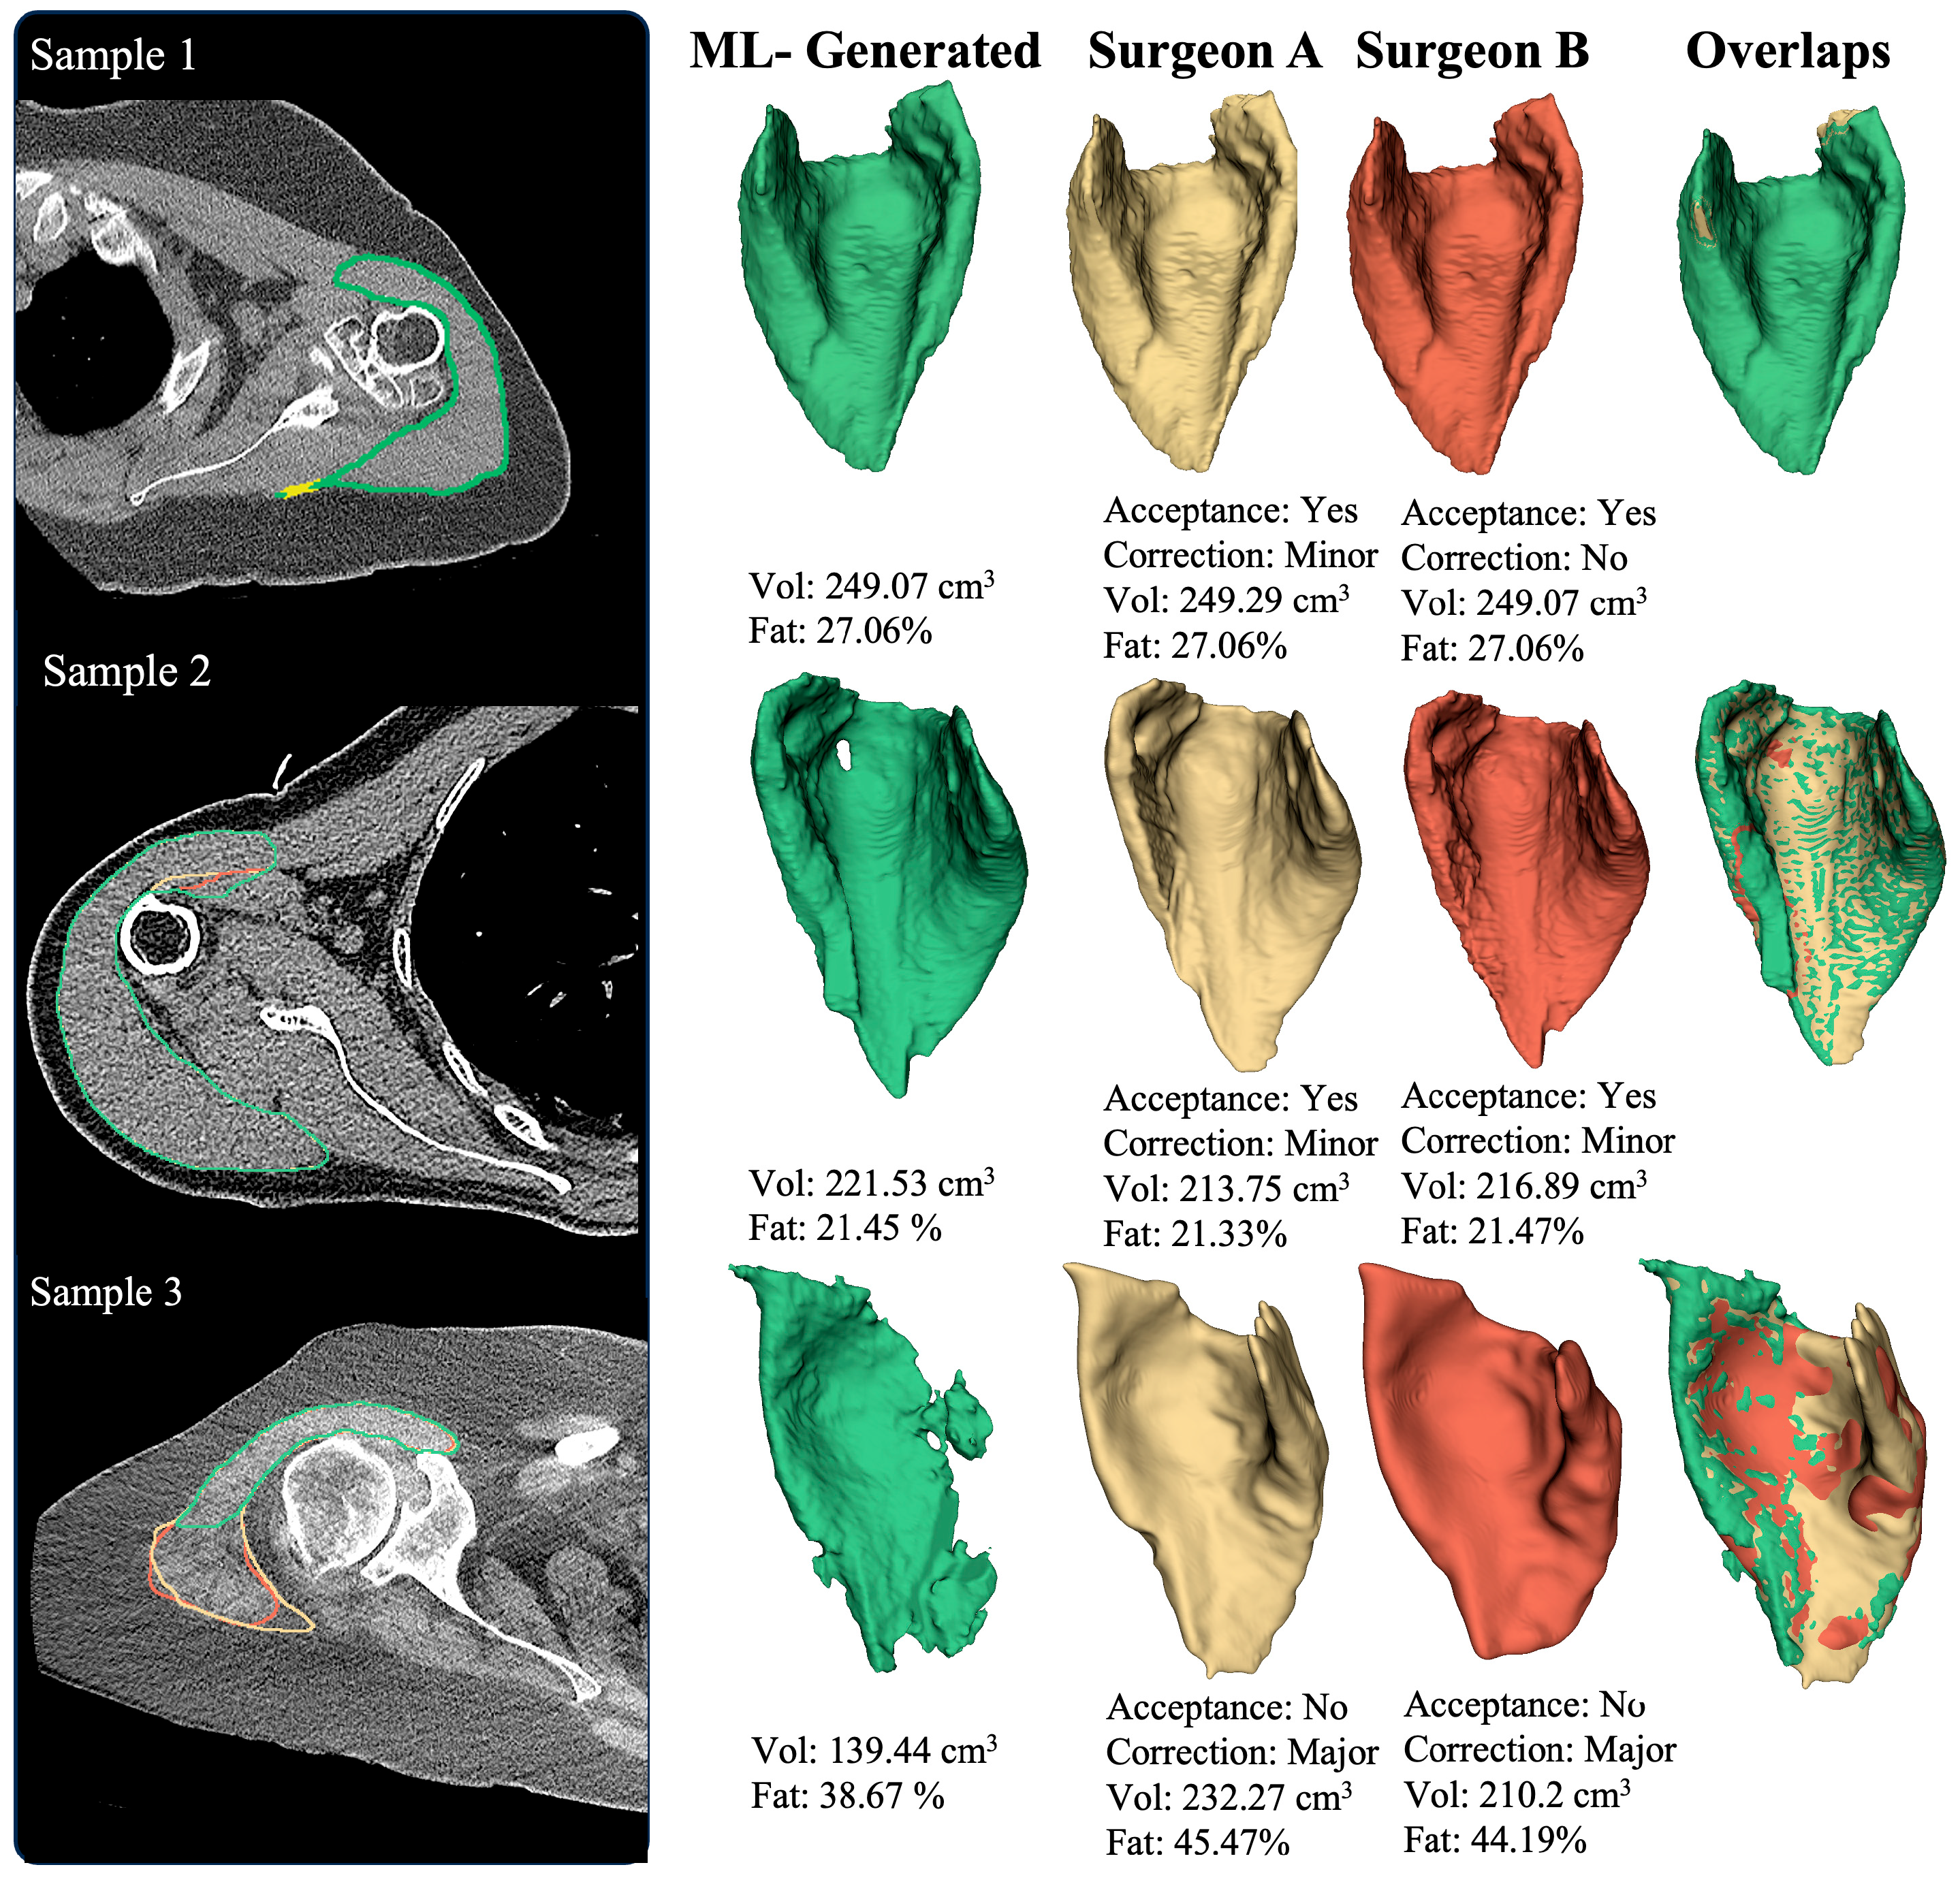
2.3. Expert Validation

To gain a more comprehensive understanding of the deltoid model’s performance, the segmentation algorithm was further evaluated by three shoulder surgeon experts. Specifically, the purposes of this validation were as follows: (a) to assess the clinical acceptance rate of the ML-generated deltoid masks, (b) perform a correction if the ML mask did not completely contain the full deltoid muscle or if the ML mask included any tissue other than the deltoid, (c) quantify segmentation and error between ML-generated and surgeon-corrected masks, and (d) test the non-inferiority of ML-generated masks relative to the surgeon-corrected masks compared to inter-surgeon variations.
The CT scans in the validation study were randomly selected from the same multi-center clinical outcomes database of shoulder arthroplasty patients from which the training data was derived. To ensure diversity and adequate sub-group representation, we implemented a stratified random sampling strategy. Patients were grouped by key demographic variables (i.e., age, gender, diagnosis, and treatment) and image-specific variables (image kernels, CT scan manufacturer), and then randomly sampled within each group to include at least three patients per demographic and image category.
A total of 32 patients were selected for expert shoulder surgeon validation. The selected cases underwent review to ensure they were not part of the training process and to confirm compliance with the above-mentioned inclusion criteria. The majority of patients were diagnosed with osteoarthritis, followed by rotator cuff arthropathy, and then rotator cuff tear, and 53% of the selected cases were female. Patients underwent imaging, with the devices used coming from several different CT scanner manufacturers (50% GE, 28% Siemens, and 22% Toshiba). Please refer to Table 2 for additional information related to the patient and imaging parameters used in the external validation dataset.
Three fellowship-trained shoulder surgeons and three technicians with experience in the manual segmentation of medical images participated in this validation study. The masks and the respective CT images were randomly distributed among surgeons, such that each surgeon reviewed about 20 cases, and each case was reviewed by at least two surgeons. Each mask evaluation required each surgeon to answer two questions: (1) Is the quality of the segmented mask clinically acceptable? (2) Does the mask benefit from minor or major corrections? A minor correction was required when a small segment of the ML-generated deltoid mask did not align with the deltoid boundary on a few slices, whereas a major correction was required when a large segment of the ML-generated deltoid mask did not align with the deltoid boundary on multiple slices. For the ML masks that required correction, a ground-truth mask was generated by technicians based on the surgeon’s comments, with verification of the final mask carried out by the surgeon. The differences between the ML-generated masks and the surgeon-corrected masks were quantified using the Dice coefficient, distance map (as defined by the percentage of the surface mesh of the ML-generated mask with a normal distance of more than 0.5 mm from the ground-truth mask), correction ratio (as defined by the percentage of corrected volume to ground-truth volume), and percentage error in volume and FI.
A non-inferiority analysis tested whether the error in ML segmentation and quantification was substantially worse than the variation between the surgeons reviewing a common set of masks. For the non-inferiority analysis, we followed a framework proposed by Ostmeier et al. [27], which requires definition of a non-inferiority margin ( Δ ). For non-inferiority of the Dice coefficient, Δ was defined as 1 — the minimum inter-surgeon Dice coefficient. For the non-inferiority of all other error metrics, Δ was defined as the maximum of inter-surgeon error. The following summarizes our null hypothesis for the non-inferiority analysis.
D i c e i n t e r s u r g e o n   D i c e m l s u r g e o n + Δ D i c e
E r r o r i n t e r s u r g e o n E r r o r m l s u r g e o n Δ E r r o r
Finally, a non-parametric one-sided Wilcoxon rank-sum test was used to test the hypothesis, with a significance level of (p < 0.05).

3. Results

Prior to the validation, one mask was excluded from the analysis because delineation of the deltoid was not possible due to the presence of hematoma. Aside from that one case, the validation was completed without issue. The time to perform the validation varied between surgeons, with surgeons A, B, and C completing their evaluations in 90 min, 120 min, and 180 min, respectively. There was 100% agreement among surgeons regarding the clinical acceptability ratings for each case. Table 3 summarizes the results of the expert shoulder surgeon qualitative validation, where surgeons A and C had a 95% acceptance rate and surgeon B had a 100% acceptance rate. In summary, 97% of the deltoid masks were deemed clinically acceptable and only one was rejected (deemed clinically unacceptable). Most ML-generated masks (81%) required only small/minor corrections. However, two ML-generated deltoid masks (6%) required a major correction, one of which was rejected.
Figure 2 depicts the deltoid image analysis for two representative patients and reports the deltoid muscle size, shape parameters, volume, and fatty infiltration calculated from the ML-generated masks. For patient sample 1, the deltoid presented with low fatty infiltration and a large muscle volume. For patient sample 2, the deltoid presented with a substantial amount of fatty infiltration. Figure 3 depicts the ML-generated and surgeon-corrected masks for three samples: two requiring minor corrections and one requiring a major correction. For patient sample 3, the deltoid required a major correction, perhaps due to the high degree of fatty infiltration in the posterior deltoid (Figure 3).
Table 4 reports the results of the quantitative assessment. For all cases, the median Dice coefficient was 1.0, indicating excellent similarity between ML-generated masks and the ground-truth, surgeon-corrected masks. The volume and fatty infiltration percentage errors were <1% in all cases. The only rejected case had a Dice coefficient of 0.75 and volume and fatty infiltration errors of 59% and 15%, respectively. The two cases that required major correction had Dice coefficients of 0.86, and volume and fatty infiltration errors of 27% and 8%, respectively. Model performance was also evaluated for different patient population and imaging parameters, which did not identify any substantial differences in any patient or imaging parameters as shown in Table 5.
Table 6 reports the non-inferiority results. The non-inferiority margin for Dice coefficient was 0.08. For the error metrics, the margins for the distance map, correction ratio, volume difference, and fat difference were 44%, 17%, 10%, and 3%, respectively. The ML-generated to surgeon-corrected error variation was non-inferior compared to the inter-surgeon variation for all metrics and surgeons. For surgeons A and B, the error between the ML model and surgeon correction was smaller than the inter-surgeon variations. For surgeon C, the ML model to surgeon-corrected error was higher, but was still found to be non-inferior to the inter-surgeon error.

4. Discussion

The results of our expert shoulder surgeon validation objectively demonstrate the high clinical acceptability of the ML-based deltoid muscle auto-segmentation model analyzed in this study. These promising findings suggest that our CT image auto-segmentation and quantification framework can analyze pre-operative CT scans and better quantify the muscles of the glenohumeral joint, characterizing each patient’s muscle size, shape, and quality. These insights can be used to optimize the preoperative planning process to consider more objective information related to the muscles in the shoulder when making treatment decisions related to shoulder arthroplasty [23,24].
Our study offers several advances compared to previous image-based research in the shoulder. While some [6,7,8,9,10,11,12,13,14] have previously proposed ML-based methods for the segmentation and quantification of shoulder soft-tissues, very few of these studies have investigated the deltoid, and of those that have, most utilized MRI. MRI is a more expensive and time-consuming imaging modality than CT, and MRI is less relevant to this particular use-case since patients considering shoulder arthroplasty may not routinely undergo MRI. Additionally, the utilization of CT imaging is particularly advantageous for patients considering shoulder arthroplasty due to the widespread usage of CT-based pre-operative planning software [28,29].
Only a few studies have utilized CT scans to auto-segment and quantify shoulder muscles [7,12,14]. Taghizadeh et al. [12] trained a CT-based Unet architecture to segment rotator cuff muscles and reported that the accuracy was comparable to that of human raters. Wakamatsu et al. [14] proposed a framework to segment the supraspinatus muscle by leveraging the scapula as a landmark to locate the muscles. Additionally, Azimbagirad et al. [7] proposed a semi-automatic CT-based framework for the segmentation of the deltoid and rotator cuff muscles. To our knowledge, our study is the first to present a fully automated CT-based ML framework for segmentation and radiomic quantification of the deltoid muscle. Future work will expand the scope of this tool to include other shoulder muscles and bones, by training algorithms for automated segmentation and radiomic quantification of the rotator cuff muscles and humeral and scapular bones in the shoulder. Additionally, we demonstrated the clinical application of this pipeline by using data from a large multi-institutional dataset to analyze the model performance across numerous different patient and image acquisition parameters, identifying no substantial differences across these parameters.
Typically, ML-based image validation studies are performed using internal datasets and by quantifying errors using mathematical metrics, like the Dice coefficient, which may not necessarily reflect the clinical acceptability/viability of the segmented model [30,31]. Our validation study advanced this effort by leveraging the knowledge and experience of multiple shoulder experts for whom the model was intended and by using external datasets generated separately from the development process to improve the generalizability and usability of the tool, which is necessary for successful adoption. Additionally, we leveraged a human-in-the-loop approach [32] to enhance the efficiency of model training during both the development and validation phases. Initialization of the deltoid masks during training increased the efficiency of annotators generating masks that served as model training data. Ma et al. [33] reported that the use of initialized masks reduced the mask generation time by 80%. Initialization of the deltoid masks increased the efficiency of the external validation phase as well, as surgeon evaluation only required correction of the ML-generated masks, instead of starting from scratch with manual segmentation, which substantially reduced the overall time and effort required to perform the validation. Furthermore, the application of a human-in-the-loop approach can extend beyond model deployment, allowing model performance to continuously improve through active learning and ongoing feedback from users.
Our validation study has several limitations. First, our training dataset contained slightly different distributions of age and gender than the validation dataset. However, our external validation did not show any significant difference in model performance between age and gender. Second, the validation dataset of 32 masks is relatively small. Despite the increased efficiency of correcting ML-generated masks, large scale studies of this nature remain challenging due to the time associated with generating expert curated ground-truth masks. Third, the use of initialized masks may introduce some anchoring bias, potentially skewing results, as greater differences between surgeons would be expected if the ground-truth were generated from scratch. Future efforts should focus on conducting larger scale expert validations incorporating continuous feedback monitoring with multiple iterations to ensure the robustness of the results. Fourth, the image database primarily consists of patients with bone-specific kernels, which restricts the generalizability of the model’s performance to soft-tissue kernels. Additionally, our validation study included CT images from the most common kernels (i.e., Bone, BonePlus FC30, B60s, etc.); further research is required to assess the performance of the auto-segmentation model on less common kernels and other imaging factors. Finally, we excluded images with metal artifacts, which potentially limits the application of our ML models for revision arthroplasty and for patients with previous shoulder surgery utilizing metal implants. Future work is required to refine the ML models with data augmentation techniques that better account for the metal artifacts in the image.

5. Conclusions

Shoulder expert validation of this CT image segmentation and quantification tool demonstrates a clinically acceptable performance for automated deltoid segmentation with no significant differences observed between deltoid image-based measurements derived from the ML-generated masks and the deltoid masks corrected by surgeons. These findings suggest that this CT image analysis tool has the potential to reliably quantify deltoid muscle size, shape, and quality. Given the predictive power of these radiomic measurements [23,24], incorporating CT image-based measurements in the pre-operative planning process may facilitate more personalized treatment decision making, and help orthopedic surgeons make more evidence-based clinical decisions for patients considering shoulder arthroplasty.

Author Contributions

Conceptualization, V.K.; Methodology, H.R.-O., J.E., D.W., V.K. and C.P.R.; Software, H.R.-O. and V.K.; Validation, H.R.-O., J.E., B.S., W.A. and B.G.; Formal analysis, H.R.-O., J.E., B.S., W.A., B.G., D.W. and V.K.; Writing—original draft, H.R.-O. and C.P.R.; Writing—review & editing, H.R.-O., J.E., B.S., W.A., B.G., D.W., V.K. and C.P.R.; Visualization, H.R.-O. and C.P.R.; Supervision, C.P.R.; Funding acquisition, C.P.R. All authors have read and agreed to the published version of the manuscript.

Funding

No funding was provided to complete this study; however, Exactech Inc. (Gainesville, FL) funded data collection for the clinical data used in this study. No authors have any stock or stock options in Exactech, Inc.

Institutional Review Board Statement

All clinical image and clinical outcomes data utilized in this multi-center study were collected utilizing an IRB-approved protocol (CR09-005, WCG study #: 1112376, 8/20/24).

Informed Consent Statement

Informed consent was obtained from all subjects involved in the study.

Data Availability Statement

Data are contained in this article.

Acknowledgments

We extend our deepest gratitude to François Boux de Casson for his significant role in designing and conducting this study. We also would like to express our sincere gratitude to Ashish Singh, Rakesh Raushan, and Likitha Shetty for their invaluable support in providing and managing the infrastructure required for this work. Finally, we extend our thanks to Sandrine Polakovic and Matthieu Coïc for their insightful contributions to the design of the study.

Conflicts of Interest

Bradley Schoch, William Aibinder, Bruno Gobbato, and Daniel Wessell are consultants for Exactech, Inc. Hamidreza Rajabzadeh-Oghaz, Josie Elwell, Vikas Kumar, and Christopher Roche are employed by Exactech, Inc. The authors declare no conflicts of interest.

Abbreviations

The following abbreviations are used in this manuscript:
aTSAAnatomic total shoulder arthroplasty
rTSAReverse total shoulder arthroplasty
MLMachine learning
CTComputed tomography
OAOsteoarthritis
RCARotator Cuff Arthropathy
RCTRotator Cuff Tears

References

  1. Roche, C.P. Reverse Shoulder Arthroplasty Biomechanics. J. Funct. Morphol. Kinesiol. 2022, 7, 13. [Google Scholar] [CrossRef] [PubMed]
  2. Goutallier, D.; Postel, J.M.; Bernageau, J.; Lavau, L.; Voisin, M.C. Fatty muscle degeneration in cuff ruptures. Pre- and postoperative evaluation by CT scan. Clin. Orthop. 1994, 304, 78–83. [Google Scholar] [CrossRef]
  3. Yoon, J.P.; Seo, A.; Kim, J.J.; Lee, C.H.; Baek, S.H.; Kim, S.Y.; Jeong, E.T.; Oh, K.S.; Chung, S.W. Deltoid muscle volume affects clinical outcome of reverse total shoulder arthroplasty in patients with cuff tear arthropathy or irreparable cuff tears. PLoS ONE 2017, 12, e0174361. [Google Scholar] [CrossRef]
  4. Wiater, B.P.; Koueiter, D.M.; Maerz, T.; Moravek, J.E., Jr.; Yonan, S.; Marcantonio, D.R.; Wiater, J.M. Preoperative deltoid size and fatty infiltration of the deltoid and rotator cuff correlate to outcomes after reverse total shoulder arthroplasty. Clin. Orthop. Relat. Res. 2015, 473, 663–673. [Google Scholar] [CrossRef] [PubMed]
  5. McClatchy, S.G.; Heise, G.M.; Mihalko, W.M.; Azar, F.M.; Smith, R.A.; Witte, D.H.; Stanfill, J.G.; Throckmorton, T.W.; Brolin, T.J. Effect of deltoid volume on range of motion and patient-reported outcomes following reverse total shoulder arthroplasty in rotator cuff-intact and rotator cuff-deficient conditions. Shoulder Elb. 2022, 14, 24–29. [Google Scholar] [CrossRef]
  6. Alipour, E.; Chalian, M.; Pooyan, A.; Azhideh, A.; Shomal Zadeh, F.; Jahanian, H. Automatic MRI-based rotator cuff muscle segmentation using U-Nets. Skelet. Radiol. 2024, 53, 537–545. [Google Scholar] [CrossRef]
  7. Azimbagirad, M.; Dardenne, G.; Ben Salem, D.; Werthel, J.; Boux De Casson, F.; Stindel, E.; Garraud, C.; Rémy-Néris, O.; Burdin, V. Robust semi-automatic segmentation method: An expert assistant tool for muscles in CT and MR data. Comput. Methods Biomech. Biomed. Eng. 2024, 11, 2301403. [Google Scholar] [CrossRef]
  8. Hess, H.; Ruckli, A.C.; Bürki, F.; Gerber, N.; Menzemer, J.; Burger, J.; Schär, M.; Zumstein, M.A.; Gerber, K. Deep-Learning-Based Segmentation of the Shoulder from MRI with Inference Accuracy Prediction. Diagnostics 2023, 13, 1668. [Google Scholar] [CrossRef]
  9. Khan, S.H.; Khan, A.; Lee, Y.S.; Hassan, M.; Jeong, W.K. Segmentation of shoulder muscle MRI using a new Region and Edge based Deep Auto-Encoder. Multimed. Tools Appl. 2021, 82, 14963–14984. [Google Scholar] [CrossRef]
  10. Kim, B.; Gandomkar, Z.; McKay, M.J.; Seitz, A.L.; Wesselink, E.O.; Cass, B.; Young, A.A.; Linklater, J.M.; Szajer, J.; Subbiah, K.; et al. Developing a three-dimensional convolutional neural network for automated full-volume multi-tissue segmentation of the shoulder with comparisons to Goutallier classification and partial volume muscle quality analysis. J. Shoulder Elb. Surg. 2025, S1058-2746(25)00107-7. [Google Scholar] [CrossRef]
  11. Lee, K.; Lew, H.M.; Lee, M.H.; Kim, J.Y.; Hwang, J.Y. CSS-Net: Classification and Substitution for Segmentation of Rotator Cuff Tear. In Proceedings of the Computer Vision—ACCV 2022: 16th Asian Conference on Computer Vision, Macao, China, 4–8 December 2022. [Google Scholar] [CrossRef]
  12. Taghizadeh, E.; Truffer, O.; Becce, F.; Eminian, S.; Gidoin, S.; Terrier, A.; Farron, A.; Büchler, P. Deep learning for the rapid automatic quantification and characterization of rotator cuff muscle degeneration from shoulder CT datasets. Eur. Radiol. 2021, 31, 181–190. [Google Scholar] [CrossRef] [PubMed]
  13. Riem, L.; Feng, X.; Cousins, M.; DuCharme, O.; Leitch, E.B.; Werner, B.C.; Sheean, A.J.; Hart, J.; Antosh, I.J.; Blemker, S.S. A Deep Learning Algorithm for Automatic 3D Segmentation of Rotator Cuff Muscle and Fat from Clinical MRI Scans. Radiol. Artif. Intell. 2023, 5, e220132. [Google Scholar] [CrossRef] [PubMed]
  14. Wakamatsu, Y.; Kamiya, N.; Zhou, X.; Kato, H.; Hara, T.; Fujita, H. Automatic Segmentation of Supraspinatus Muscle via Bone-Based Localization in Torso Computed Tomography Images Using U-Net. IEEE Access 2021, 9, 155555–155563. [Google Scholar] [CrossRef]
  15. Kumar, V.; Allen, C.; Overman, S.; Teredesai, A.; Simovitch, R.; Flurin, P.H.; Wright, T.W.; Zuckerman, J.D.; Routman, H.; Roche, C. Development of a predictive model for a machine learning–derived shoulder arthroplasty clinical outcome score. Semin. Arthroplast. JSES 2022, 32, 226–237. [Google Scholar] [CrossRef]
  16. Kumar, V.; Roche, C.; Overman, S.; Simovitch, R.; Flurin, P.-H.; Wright, T.; Zuckerman, J.; Routman, H.; Teredesai, A. Using machine learning to predict clinical outcomes after shoulder arthroplasty with a minimal feature set. J. Shoulder Elb. Surg. 2021, 30, e225–e236. [Google Scholar] [CrossRef]
  17. Kumar, V.; Roche, C.; Overman, S.; Simovitch, R.; Flurin, P.-H.; Wright, T.; Zuckerman, J.; Routman, H.; Teredesai, A. Use of machine learning to assess the predictive value of 3 commonly used clinical measures to quantify outcomes after total shoulder arthroplasty. Semin. Arthroplast. JSES 2021, 31, 263–271. [Google Scholar] [CrossRef]
  18. Kumar, V.; Roche, C.; Overman, S.; Simovitch, R.; Flurin, P.-H.; Wright, T.; Zuckerman, J.; Routman, H.; Teredesai, A. What Is the Accuracy of Three Different Machine Learning Techniques to Predict Clinical Outcomes After Shoulder Arthroplasty? Clin. Orthop. Relat. Res. 2020, 478, 2351–2363. [Google Scholar] [CrossRef]
  19. Kumar, V.; Schoch, B.S.; Allen, C.; Overman, S.; Teredesai, A.; Aibinder, W.; Parsons, M.; Watling, J.; Ko, J.K.; Gobbato, B.; et al. Using machine learning to predict internal rotation after anatomic and reverse total shoulder arthroplasty. J. Shoulder Elb. Surg. 2022, 31, e234–e245. [Google Scholar] [CrossRef]
  20. Allen, C.; Kumar, V.; Elwell, J.; Overman, S.; Schoch, B.S.; Aibinder, W.; Parsons, M.; Watling, J.; Ko, J.K.; Gobbato, B.; et al. Evaluating the fairness and accuracy of machine learning-based predictions of clinical outcomes after anatomic and reverse total shoulder arthroplasty. J. Shoulder Elb. Surg. 2024, 33, 888–899. [Google Scholar] [CrossRef]
  21. Simmons, C.S.; Roche, C.; Schoch, B.S.; Parsons, M.; Aibinder, W.R. Surgeon confidence in planning total shoulder arthroplasty improves after consulting a clinical decision support tool. Eur. J. Orthop. Surg. Traumatol. 2022, 33, 2385–2391. [Google Scholar] [CrossRef]
  22. Simmons, C.; DeGrasse, J.; Polakovic, S.; Aibinder, W.; Throckmorton, T.; Noerdlinger, M.; Papandrea, R.; Trenhaile, S.; Schoch, B.; Gobbato, B.; et al. Initial clinical experience with a predictive clinical decision support tool for anatomic and reverse total shoulder arthroplasty. Eur. J. Orthop. Surg. Traumatol. 2023, 34, 1307–1318. [Google Scholar] [CrossRef]
  23. Rajabzadeh-Oghaz, H.; Kumar, V.; Berry, D.B.; Singh, A.; Schoch, B.S.; Aibinder, W.R.; Gobbato, B.; Polakovic, S.; Elwell, J.; Roche, C.P. Impact of Deltoid Computer Tomography Image Data on the Accuracy of Machine Learning Predictions of Clinical Outcomes after Anatomic and Reverse Total Shoulder Arthroplasty. J. Clin. Med. 2024, 13, 1273. [Google Scholar] [CrossRef] [PubMed]
  24. Rajabzadeh-Oghaz, H.; Elwell, J.; Schoch, B.S.; Aibinder, W.R.; Gobbato, B.; Wessell, D.; Kumar, V.; Roche, C.P. Radiomic Analysis of the Deltoid and Scapula: Identification of CT-Image Based Measurements Predictive of Pain, Motion, and Function Before and After Shoulder Arthroplasty. JSES Int. 2025, in press. [Google Scholar] [CrossRef]
  25. Hatamizadeh, A.; Nath, V.; Tang, Y.; Yang, D.; Roth, H.; Xu, D. Swin UNETR: Swin Transformers for Semantic Segmentation of Brain Tumors in MRI Images. In Lecture Notes in Computer Science; Springer: Cham, Switzerland, 2022. [Google Scholar] [CrossRef]
  26. van Griethuysen, J.J.M.; Fedorov, A.; Parmar, C.; Hosny, A.; Aucoin, N.; Narayan, V.; Beets-Tan, R.G.H.; Fillion-Robin, J.C.; Pieper, S.; Aerts, H.J.W.L. Computational Radiomics System to Decode the Radiographic Phenotype. Cancer Res. 2017, 77, e104–e107. [Google Scholar] [CrossRef] [PubMed]
  27. Ostmeier, S.; Axelrod, B.; Verhaaren, B.F.J.; Christensen, S.; Mahammedi, A.; Liu, Y.; Pulli, B.; Li, L.J.; Zaharchuk, G.; Heit, J.J. Non-inferiority of deep learning ischemic stroke segmentation on non-contrast CT within 16-hours compared to expert neuroradiologists. Sci. Rep. 2023, 13, 16153. [Google Scholar] [CrossRef]
  28. Parsons, M.; Greene, A.; Polakovic, S.; Byram, I.; Cheung, E.; Jones, R.; Papandrea, R.; Youderian, A.; Wright, T.; Flurin, P.H.; et al. Assessment of surgeon variability in preoperative planning of reverse total shoulder arthroplasty: A quantitative comparison of 49 cases planned by 9 surgeons. J. Shoulder Elb. Surg. 2020, 29, 2080–2088. [Google Scholar] [CrossRef] [PubMed]
  29. Parsons, M.; Greene, A.; Polakovic, S.; Rohrs, E.; Byram, I.; Cheung, E.; Jones, R.; Papandrea, R.; Youderian, A.; Wright, T.; et al. Intersurgeon and intrasurgeon variability in preoperative planning of anatomic total shoulder arthroplasty: A quantitative comparison of 49 cases planned by 9 surgeons. J. Shoulder Elb. Surg. 2020, 29, 2610–2618. [Google Scholar] [CrossRef]
  30. Boman, M. Human-Curated Validation of Machine Learning Algorithms for Health Data. Digit. Soc. 2023, 2, 46. [Google Scholar] [CrossRef]
  31. Cabitza, F.; Campagner, A.; Soares, F.; García de Guadiana-Romualdo, L.; Challa, F.; Sulejmani, A.; Seghezzi, M.; Carobene, A. The importance of being external. methodological insights for the external validation of machine learning models in medicine. Comput. Methods Programs Biomed. 2021, 208, 106288. [Google Scholar] [CrossRef]
  32. Mosqueira-Rey, E.; Hernández-Pereira, E.; Alonso-Ríos, D.; Bobes-Bascarán, J.; Fernández-Leal, Á. Human-in-the-loop machine learning: A state of the art. Artif. Intell. 2022, 56, 3005–3054. [Google Scholar] [CrossRef]
  33. Ma, J.; He, Y.; Li, F.; Han, L.; You, C.; Wang, B. Segment anything in medical images. Nat. Commun. 2024, 15, 654. [Google Scholar] [CrossRef] [PubMed]
Figure 1. Left: Sample of training data utilized to tune the segmentation model. Top Right: SwinUnetR model architecture used for training the segmentation model. Bottom Right: Training and validation performance.
Algorithms 18 00432 g001
Figure 2. Deltoid segmentation and quantification analysis for two sample patients. Note that the yellow regions in the deltoid pictures represent fat (based on Hounsfield unit values ranging from −190 to −30); whereas, the red regions in the deltoid pictures represent healthy muscle tissue (based on Hounsfield unit values ranging from −29 to 150). Patient 1 (left) has low fatty infiltration with a high deltoid volume. Patient 2 (right) has a lower deltoid volume and a higher degree of FI. The pipeline includes the deltoid characteristics of 783 shoulder arthroplasty patients, where the distribution of metrics can be used to gauge the characteristics of a given patient relative to a broader cohort.
Algorithms 18 00432 g002
Figure 3. Comparing deltoid masks generated by ML and surgeons. The ML generated deltoid mask is shown in green, the deltoid mask corrected by surgeon A is shown in yellow, and the deltoid masks corrected by surgeon B is shown in red. Samples 1 and 2 demonstrate deltoid masks that were clinically acceptable and needed only minor corrections. Sample 3 is a deltoid mask that was clinically rejected and required a major correction. In Sample 3, the posterior deltoid exhibited a significant level of fatty infiltration relative to that exhibited by the anterior and middle deltoid.
Algorithms 18 00432 g003
Table 1. Patient and imaging variables included/excluded in this study.
Considered Populations
Patient Variable
Gender[M, F]
Age cohort<60, 60–70, 70–80, >80
Diagnosis[OA, RCA, RCT]
Image Variable
Kernels *[Bone, Bone+, Fc130, [131, 3], B60]
Manufacturer *[GE, Siemens, Toshiba]
Exclusion Criteria
Included in training processNone
Deltoid insertion cut offNone
Metal artifact around shoulderNone
Low image qualityNone
Other diagnoses (fracture, ON, RA, PTA) **None
Revision (shoulder)None
Image with pixel sizeSmaller than 0.3 and larger than 1mm
* Most five frequent kernels in our database. ** Patients with indicated diagnosis are excluded due to low prevalence.
Table 2. Summary of patients included in training and clinical validation.
Internal
Development
External
Validation
Patients 97 (100%)32 (100%)
Male28 (29%)15 (47%)
Female69 (71%)17 (53%)
Age
<607 (7%)7 (22%)
≥60 and <7036(37%)15 (47%)
≥70 and <8045 (46%)6 (19%)
≥809 (9%)4 (13%)
Diagnosis
OA61 (63%)25 (78%)
RCA30 (31%)5 (16%)
RCT24 (25%)6 (19%)
Device
aTSA17 (18%)10 (31%)
rTSA80 (82%)22 (69%)
Kernel
Bone52 (54%)10 (31%)
BonePlus8 (8%)6 (19%)
FC3016 (16%)7 (22%)
[‘I31s’, ‘3’]2 (2%)6 (19%)
B60s17 (18%)3 (9%)
Standard2 (2%)
Scanner Manufacturer
Toshiba16 (16%)7 (22%)
Siemens19 (20%)9 (28%)
GE62 (64%)16 (50%)
Table 3. Results of the expert shoulder surgeon’s qualitative validation.
Surgeon ASurgeon BSurgeon CTotal
Number of cases21202131
Accepted20 (95%)20 (100%)20 (95%)30 (97%)
No correction needed9 (42.9%)7 (35%)5 (23.8%)4 (13%)
Minor correction11 (52.4%)12 (60%)14 (66.7%)25 (81%)
Major correction1 (4.8%)1 (5%)2 (9.5%)2 (6%)
Table 4. Results of the quantitative validation. The ML to surgeon variations for all cases, as well as for cohorts that were accepted or rejected, or needed corrections, are shown. Note that all presented values represent the median followed by the 5th and 95th percentiles.
TotalDice
Coefficient
Distance
Map Error (%)
Correction
Ratio (%)
Volume Diff (%)FI Diff (%)
All Patients31 (100%) 1.0 [0.97, 1.0]1.58 [0.0, 8.97]0.55 [0.0, 5.49]0.28 [0.0, 8.97]0.06 [0.0, 2.19]
Accepted30 (97%)1.0 [0.98, 1.0]1.54 [0.0, 7.24]0.5 [0.0, 3.66]0.22 [0.0, 3.32]0.06 [0.0, 1.42]
Rejected1 (3%)0.7448.1167.258.6615.93
Minor Correction25 (81%) 1.0 [0.98, 1.0]2.38 [0.0, 6.38]0.88 [0.0, 3.55]0.49 [0.0, 2.64]0.08 [0.0, 1.38]
Major Correction2 (6%) 0.86 [0.73, 0.98]26.92 [6.56, 49.93]32.74 [3.4, 71.17]27.34 [3.4, 64.2]8.23 [0.55, 17.09]
Table 5. Model performance for different population and imaging attributes. Note that all presented values represent the median followed by the 5th and 95th percentiles.
CategoryVariable#Dice CoefficientCorrection Ratio (%)Distance-Map Error (%)Volume Diff (%)FI Diff (%)
All 32 (100%)1.0 [0.97, 1.0]0.55 [0.0, 5.49]1.58 [0.0, 8.97]0.28 [0.0, 8.97]0.06 [0.0, 2.19]
Gender
Female17 (53%)1.0 [0.87, 1.0]0.4 [0.0, 30.76]1.38 [0.0, 25.43]0.16 [0.0, 24.76]0.06 [0.0, 7.18]
Male15 (47%)1.0 [0.98, 1.0]0.7 [0.0, 3.8]2.0 [0.0, 7.82]0.38 [0.0, 3.36]0.08 [0.0, 2.19]
Age
<607 (22%)1.0 [0.99, 1.0]0.86 [0.0, 2.5]2.26 [0.0, 5.35]0.8 [0.0, 2.05]0.08 [0.0, 1.66]
(60, 70]15 (47%)1.0 [0.98, 1.0]0.32 [0.0, 4.5]1.04 [0.0, 8.57]0.21 [0.0, 3.44]0.04 [0.0, 1.66]
(70, 80]6 (19%)1.0 [0.75, 1.0]0.4 [0.0, 68.9]1.33 [0.0, 48.89]0.4 [0.0, 61.84]0.08 [0.0, 16.43]
>804 (13%)1.0 [0.99, 1.0]1.13 [0.12, 2.11]2.66 [0.4, 4.0]0.61 [0.02, 1.95]0.07 [0.01, 0.71]
Diagnosis
OA25 (78%)1.0 [0.97, 1.0]0.88 [0.0, 5.95]2.38 [0.0, 9.01]0.76 [0.0, 3.74]0.07 [0.0, 2.92]
RCA5 (16%)1.0 [0.99, 1.0]0.26 [0.0, 2.07]0.94 [0.0, 5.86]0.04 [0.0, 0.83]0.03 [0.0, 0.94]
RCT6 (19%)1.0 [0.74, 1.0]0.0 [0.0, 67.77]0.0 [0.0, 48.37]0.0 [0.0, 59.45]0.0 [0.0, 16.1]
Device Type
rTSA22 (69%)1.0 [0.97, 1.0]0.34 [0.0, 6.14]1.32 [0.0, 8.98]0.18 [0.0, 3.9]0.05 [0.0, 3.45]
aTSA10 (31%)0.99 [0.98, 1.0]1.58 [0.0, 3.75]3.54 [0.0, 5.58]1.56 [0.0, 3.42]0.1 [0.0, 1.42]
Kernel
FC307 (22%)1.0 [0.76, 1.0]0.36 [0.0, 66.64]1.06 [0.0, 47.85]0.36 [0.0, 57.87]0.06 [0.0, 16.77]
BonePlus6 (19%)1.0 [0.99, 1.0]0.00 [0.0, 2.12]0.0 [0.0, 5.18]0.0 [0.0, 1.99]0.0 [0.0, 0.15]
Bone10 (31%)0.99 [0.99, 1.0]1.36 [0.0, 2.84]3.76 [0.0, 7.27]0.66 [0.0, 2.37]0.11 [0.0, 2.26]
[‘I31s’, ‘3’]6 (19%)1.0 [0.98, 1.0]0.72 [0.0, 3.78]1.98 [0.0, 7.19]0.6 [0.0, 3.64]0.19 [0.0, 1.74]
B60s3 (9%)1.0 [0.99, 1.0]0.1 [0.0, 1.03]0.58 [0.0, 3.35]0.1 [0.0, 1.02]0.02 [0.0, 0.32]
Scanner Manufacturer
Toshiba7(22%)1.0 [0.76, 1.0]0.36 [0.0, 66.64]1.06 [0.0, 47.85]0.36 [0.0, 57.87]0.06 [0.0, 15.77]
GE16(50%)0.99 [0.99, 1.0]1.23 [0.0, 2.59]2.58 [0.0, 6.2]0.28 [0.0, 2.19]0.05 [0.0, 1.74]
Siemens9(28%)1.0 [0.98, 1.0]0.34 [0.0, 3.69]1.32 [0.0, 6.56]0.34 [0.0, 3.49]0.01 [0.0, 1.5]
Table 6. Results of the non-inferiority analysis. Note that all presented values represent the median followed by the 5th and 95th percentiles.
Surgeon ASurgeon BSurgeon C
ErrorsML to SurgeonInter-SurgeonNon
Inferior
p-Value
ML to SurgeonInter-SurgeonNon
Inferior
p-Value
ML to SurgeonInter-SurgeonNon
Inferior
p-Value
Dice
coefficient
1.00
[0.97,
1.00]
1.00
[0.98,
1.00]
p = 0.0011.00
[0.98,
1.00]
1.00
[0.98, 1.00]
p < 0.0011.00
[0.98,
1.00]
1.00
[0.98,
1.00]
p < 0.001
Distance
Map
Error (%)
0.56
[0.00, 9.01]
2.84
[0.00, 8.45]
p < 0.0011.025
[0.00,
7.24]
3.00
[0.00, 8.88]
p < 0.0012.84
[0.00, 6.25]
2.84
[0.00, 10.3]
p < 0.001
Correction
Ratio (%)
0.16
[0.00, 6.26]
0.96
[0.00,.46]
p < 0.0010.30
[0,
3.345]
0.725
[0.00, 3.58]
p < 0.0010.8
[0.00, 3.31]
0.65
[0.00, 3.51]
p < 0.001
Volume Diff (%)0.16
[0.00, 3.51]
0.53
[0.00, 3.77]
p < 0.0010.20
[0.00, 3.44]
0.39
[0.00, 1.98]
p < 0.0010.79
[0.00, 3.31]
0.30
[0.00, 1.85]
p < 0.001
FI
Diff (%)
0.04
[0.00, 3.52]
0.12
[0.00, 2.38]
p < 0.0010.09
[0.00, 1.42]
0.105
[0.00, 2.47]
p < 0.0010.06
[0.00, 2.19]
0.08
[0.00, 2.49]
p < 0.001
Disclaimer/Publisher’s Note: The statements, opinions and data contained in all publications are solely those of the individual author(s) and contributor(s) and not of MDPI and/or the editor(s). MDPI and/or the editor(s) disclaim responsibility for any injury to people or property resulting from any ideas, methods, instructions or products referred to in the content.

