
iCOR: End-to-End Electrocardiography Morphology Classification Combining Multi-Layer Filter and BiLSTM

 ,
,  , , ,
, , ,  ,
,
Abstract
1. Introduction
- Develop iCOR, an end-to-end DL model with a comprehensive ECG signal processing system incorporating noise removal, feature extraction, learning process, and morphology classification;
- Combine noise removal and feature extraction of ECG signals using multi-layer filters with DL-based signal delineation of normal and abnormal pathology to enhance generalization capabilities; and
- Evaluate with unseen data to accurately assess its performance and accuracy.
2. Materials and Methods
2.1. Data Preparation
2.2. Data Pre-Processing
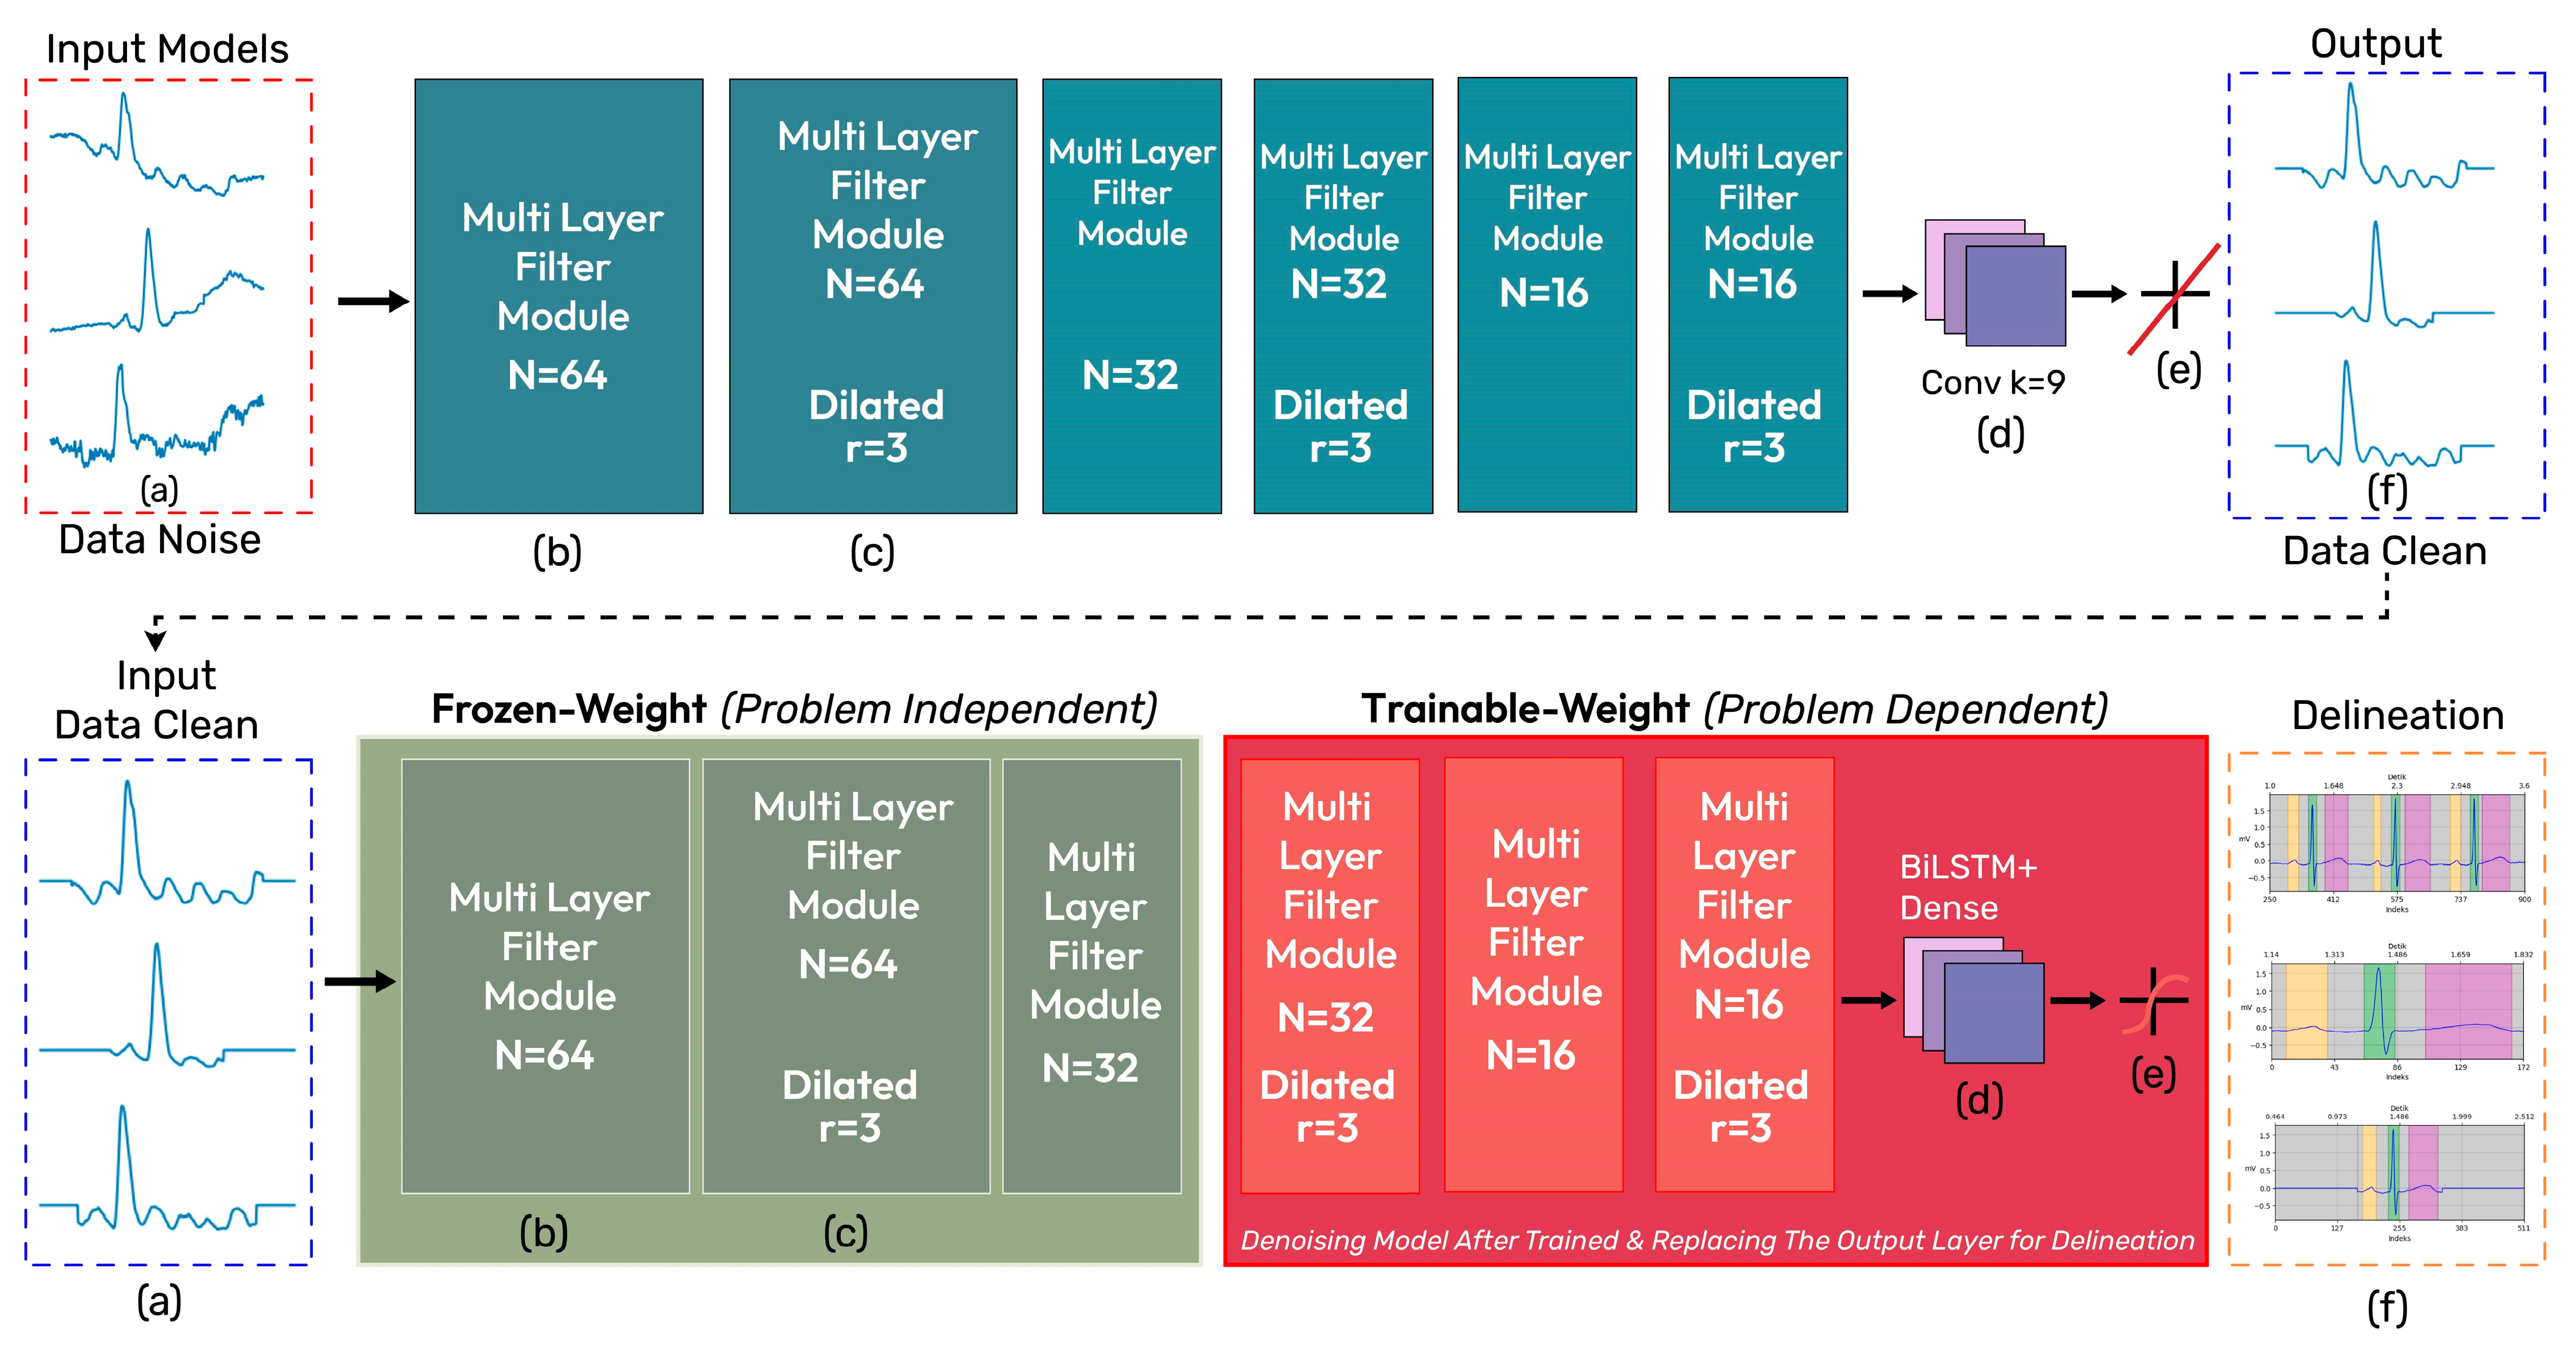
2.3. iCOR Proposed Model
2.4. Performance Metric Evaluation
2.5. Platform Implementation
3. Results and Discussion
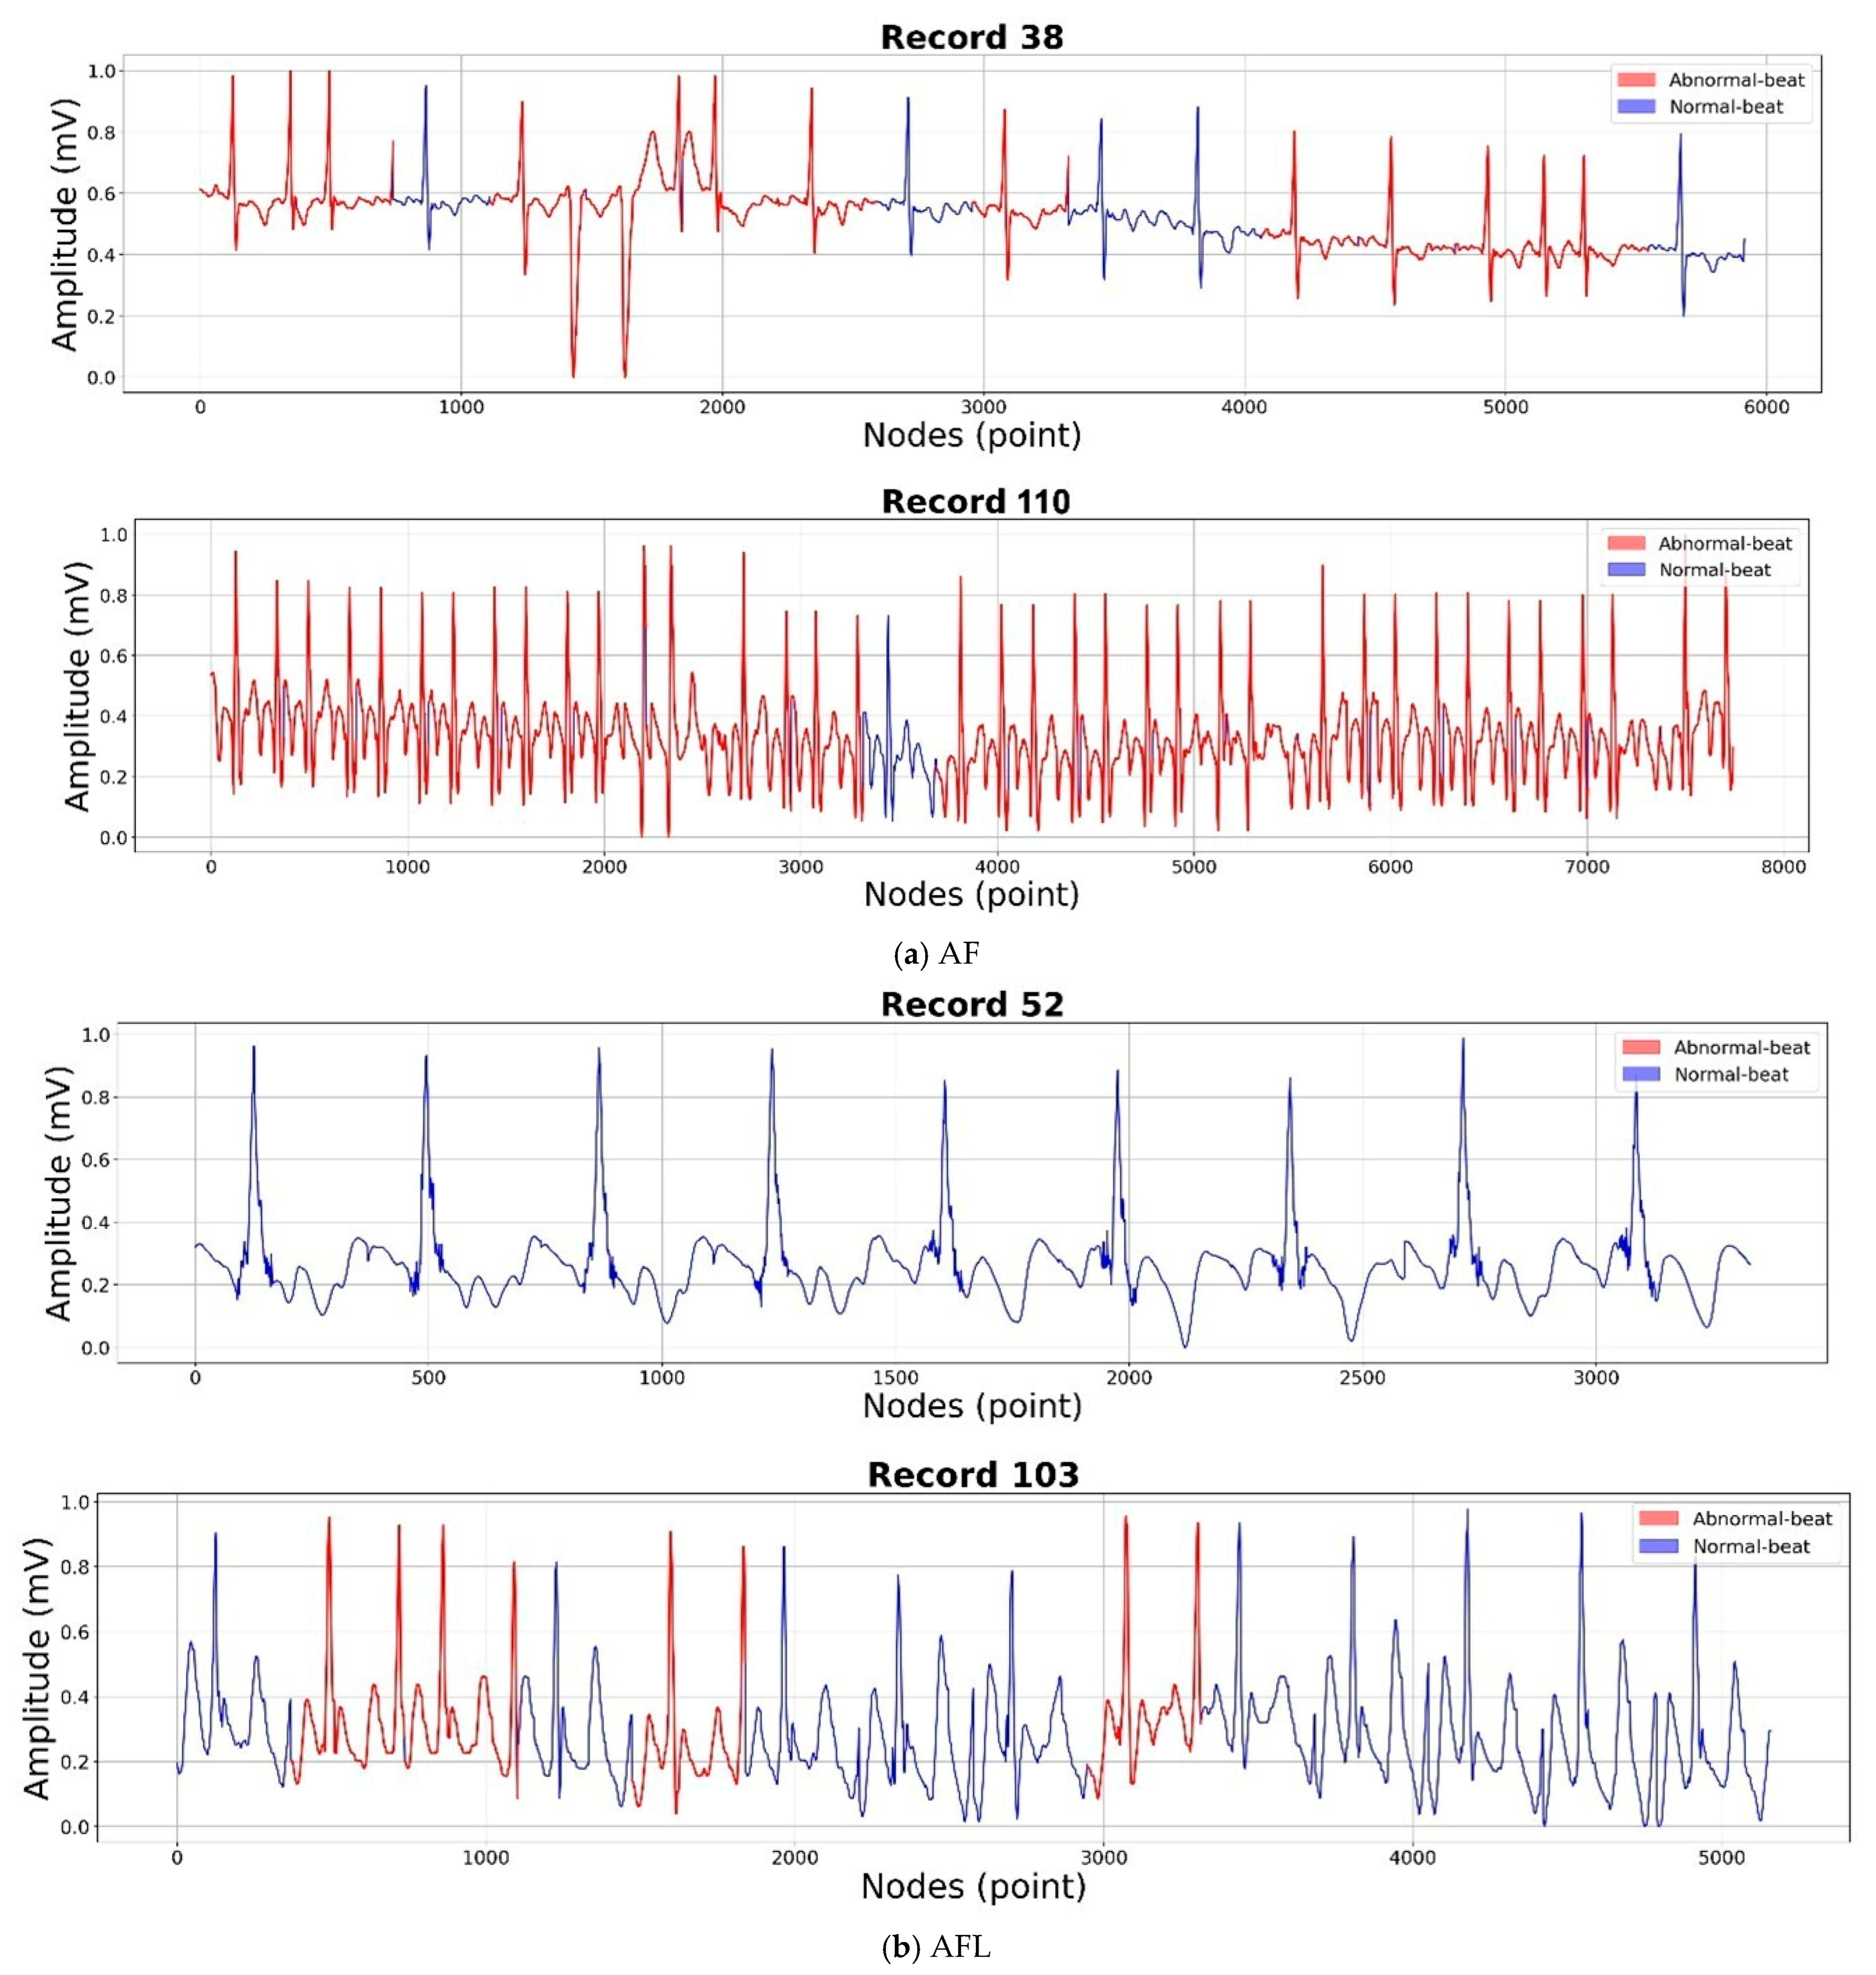
3.1. ECG Denoising
3.2. ECG Delineation
- This study was only concerned with BW noise for the ECG denoising process using an MLF;
- The testing of iCOR was only explored in noisy ECG signals.
4. Conclusions
Author Contributions
Funding
Data Availability Statement
Acknowledgments
Conflicts of Interest
References
- Chung, C.T.; Lee, S.; King, E.; Liu, T.; Armoundas, A.A.; Bazoukis, G.; Tse, G. Clinical significance, challenges and limitations in using artificial intelligence for electrocardiography-based diagnosis. Int. J. Arrhythmia 2022, 23, 24. [Google Scholar] [CrossRef] [PubMed]
- Mvuh, F.L.; Ebode Ko’a, C.O.V.; Bodo, B. Multichannel high noise level ECG denoising based on adversarial deep learning. Sci. Rep. 2024, 14, 801. [Google Scholar] [CrossRef] [PubMed]
- Chiang, H.-T.; Hsieh, Y.-Y.; Fu, S.-W.; Hung, K.-H.; Tsao, Y.; Chien, S.-Y. Noise Reduction in ECG Signals Using Fully Convolutional Denoising Autoencoders. IEEE Access 2019, 7, 60806–60813. [Google Scholar] [CrossRef]
- Hou, Y.; Liu, R.; Shu, M.; Chen, C. An ECG denoising method based on adversarial denoising convolutional neural network. Biomed. Signal Process. Control 2023, 84, 104964. [Google Scholar] [CrossRef]
- Birok, R.; Kapoor, R.; Choudhry, M.S. ECG denoising using artificial neural networks and complete ensemble empirical mode decomposition. Turkish J. Comput. Math. Educ. 2021, 12, 2382–2389. [Google Scholar]
- Mohguen, W.; Bouguezel, S. Denoising the ECG signal using ensemble empirical mode decomposition. Eng. Technol. Appl. Sci. Res. 2021, 11, 7536–7541. [Google Scholar] [CrossRef]
- Kumar, A.; Tomar, H.; Mehla, V.K.; Komaragiri, R.; Kumar, M. Stationary wavelet transform based ECG signal denoising method. ISA Trans. 2021, 114, 251–262. [Google Scholar] [CrossRef] [PubMed]
- Shi, H.; Liu, R.; Chen, C.; Shu, M.; Wang, Y. ECG baseline estimation and denoising with group sparse regularization. IEEE Access 2021, 9, 23595–23607. [Google Scholar] [CrossRef]
- Wang, J.; Li, R.; Li, R.; Li, K.; Zeng, H.; Xie, G.; Liu, L. Adversarial de-noising of electrocardiogram. Neurocomputing 2019, 349, 212–224. [Google Scholar] [CrossRef]
- Singh, P.; Pradhan, G. A new ECG denoising framework using generative adversarial network. IEEE/ACM Trans. Comput. Biol. Bioinform. 2020, 18, 759–764. [Google Scholar] [CrossRef]
- Romero, F.P.; Piñol, D.C.; Vázquez-Seisdedos, C.R. DeepFilter: An ECG baseline wander removal filter using deep learning techniques. Biomed. Signal Process. Control 2021, 70, 102992. [Google Scholar] [CrossRef]
- Lin, H.; Liu, R.; Liu, Z. ECG signal denoising method based on disentangled autoencoder. Electronics 2023, 12, 1606. [Google Scholar] [CrossRef]
- Chorney, W.; Wang, H.; He, L.; Lee, S.; Fan, L.-W. Convolutional block attention autoencoder for denoising electrocardiograms. Biomed. Signal Process. Control 2023, 86, 105242. [Google Scholar] [CrossRef]
- Alickovic, E.; Subasi, A. Effect of multiscale PCA de-noising in ECG beat classification for diagnosis of cardiovascular diseases. Circuits Syst. Signal Process. 2015, 34, 513–533. [Google Scholar] [CrossRef]
- Khorrami, H.; Moavenian, M. A comparative study of DWT, CWT and DCT transformations in ECG arrhythmias classification. Expert Syst. Appl. 2010, 37, 5751–5757. [Google Scholar] [CrossRef]
- Rizwan, A.; Priyanga, P.; Abualsauod, E.H.; Zafrullah, S.N.; Serbaya, S.H.; Halifa, A. A machine learning approach for the detection of QRS complexes in electrocardiogram (ECG) using discrete wavelet transform (DWT) algorithm. Comput. Intell. Neurosci. 2022, 2022, 9023478. [Google Scholar] [CrossRef] [PubMed]
- Wang, Z.; Zhu, J.; Yan, T.; Yang, L. A new modified wavelet-based ECG denoising. Comput. Assist. Surg. 2019, 24, 174–183. [Google Scholar] [CrossRef]
- Samann, F.; Schanze, T. Use of a trained denoising autoencoder to estimate the noise level in the ECG. Curr. Dir. Biomed. Eng. 2021, 7, 562–565. [Google Scholar] [CrossRef]
- Jimenez-Perez, G.; Alcaine, A.; Camara, O. Delineation of the electrocardiogram with a mixed-quality-annotations dataset using convolutional neural networks. Sci. Rep. 2021, 11, 863. [Google Scholar] [CrossRef]
- Nurmaini, S.; Darmawahyuni, A.; Rachmatullah, M.N.; Effendi, J.; Sapitri, A.I.; Firdaus, F.; Tutuko, B. Beat-to-Beat Electrocardiogram Waveform Classification Based on a Stacked Convolutional and Bidirectional Long Short-Term Memory. IEEE Access 2021, 9, 92600–92613. [Google Scholar] [CrossRef]
- Tutuko, B.; Darmawahyuni, A.; Nurmaini, S.; Tondas, A.E.; Naufal Rachmatullah, M.; Teguh, S.B.P.; Firdaus, F.; Sapitri, A.I.; Passarella, R. DAE-ConvBiLSTM: End-to-end learning single-lead electrocardiogram signal for heart abnormalities detection. PLoS ONE 2022, 17, e0277932. [Google Scholar] [CrossRef]
- Nurmaini, S.; Darmawahyuni, A.; Rachmatullah, M.N.; Firdaus, F.; Sapitri, A.I.; Tutuko, B.; Tondas, A.E.; Putra, M.H.P.; Islami, A. Robust electrocardiogram delineation model for automatic morphological abnormality interpretation. Sci. Rep. 2023, 13, 13736. [Google Scholar] [CrossRef] [PubMed]
- Banerjee, S.; Gupta, R.; Mitra, M. Delineation of ECG characteristic features using multiresolution wavelet analysis method. Measurement 2012, 45, 474–487. [Google Scholar] [CrossRef]
- Chen, H.; Maharatna, K. An automatic R and T peak detection method based on the combination of hierarchical clustering and discrete wavelet transform. IEEE J. Biomed. Health Inform. 2020, 24, 2825–2832. [Google Scholar] [CrossRef]
- Peimankar, A.; Puthusserypady, S. DENS-ECG: A deep learning approach for ECG signal delineation. Expert Syst. Appl. 2021, 165, 113911. [Google Scholar] [CrossRef]
- Londhe, A.N.; Atulkar, M. Semantic segmentation of ECG waves using hybrid channel-mix convolutional and bidirectional LSTM. Biomed. Signal Process. Control 2021, 63, 102162. [Google Scholar] [CrossRef]
- Wang, D.; Qiu, L.; Zhu, W.; Dong, Y.; Zhang, H.; Chen, Y.; Wang, L. Inter-patient ECG characteristic wave detection based on convolutional neural network combined with transformer. Biomed. Signal Process. Control 2023, 81, 104436. [Google Scholar] [CrossRef]
- Jimenez-Perez, G.; Alcaine, A.; Camara, O. U-Net Architecture for the Automatic Detection and Delineation of the Electrocardiogram. In Proceedings of the 2019 Computing in Cardiology (CinC), Singapore, 8–11 September 2019. [Google Scholar] [CrossRef]
- Wang, J.; Li, R.; Li, R.; Fu, B. A knowledge-based deep learning method for ECG signal delineation. Futur. Gener. Comput. Syst. 2020, 109, 56–66. [Google Scholar] [CrossRef]
- Liang, X.; Li, L.; Liu, Y.; Chen, D.; Wang, X.; Hu, S.; Wang, J.; Zhang, H.; Sun, C.; Liu, C. ECG_SegNet: An ECG delineation model based on the encoder-decoder structure. Comput. Biol. Med. 2022, 145, 105445. [Google Scholar] [CrossRef]
- Goldberger, A.L.; Amaral, L.A.N.; Glass, L.; Hausdorff, J.M.; Ivanov, P.C.; Mark, R.G.; Mietus, J.E.; Moody, G.B.; Peng, C.-K.; Stanley, H.E. PhysioBank, PhysioToolkit, and PhysioNet: Components of a new research resource for complex physiologic signals. Circulation 2000, 101, e215–e220. [Google Scholar] [CrossRef]
- Laguna, P.; Mark, R.G.; Goldberg, A.; Moody, G.B. A database for evaluation of algorithms for measurement of QT and other waveform intervals in the ECG. In Proceedings of the Computers in Cardiology, Lund, Sweden, 7–10 September 1997; pp. 673–676. [Google Scholar]
- Kalyakulina, A.I.; Yusipov, I.I.; Moskalenko, V.A.; Nikolskiy, A.V.; Kosonogov, K.A.; Osipov, G.V.; Zolotykh, N.Y.; Ivanchenko, M.V. Ludb: A new open-access validation tool for electrocardiogram delineation algorithms. IEEE Access 2020, 8, 186181–186190. [Google Scholar] [CrossRef]
- Dhas, D.E.; Suchetha, M. Dual phase dependent RLS filtering approach for baseline wander removal in ECG signal acquisition. Biomed. Signal Process. Control 2022, 77, 103767. [Google Scholar]
- Halvaei, H.; Sörnmo, L.; Stridh, M. Signal quality assessment of a novel ECG electrode for motion artifact reduction. Sensors 2021, 21, 5548. [Google Scholar] [CrossRef] [PubMed]
- Chen, Q.; Li, Y.; Yuan, X. A hybrid method for muscle artifact removal from EEG signals. J. Neurosci. Methods 2021, 353, 109104. [Google Scholar] [CrossRef] [PubMed]
- Uwaechia, A.N.; Ramli, D.A. A comprehensive survey on ECG signals as new biometric modality for human authentication: Recent advances and future challenges. IEEE Access 2021, 9, 97760–97802. [Google Scholar] [CrossRef]
- Naser, M.Z.; Alavi, A.H. Error metrics and performance fitness indicators for artificial intelligence and machine learning in engineering and sciences. Archit. Struct. Constr. 2023, 3, 499–517. [Google Scholar] [CrossRef]
- Liang, J. Confusion matrix: Machine learning. POGIL Act. Clgh. 2022, 3. Available online: https://pac.pogil.org/index.php/pac/article/view/304 (accessed on 13 April 2025).
- Chen, L.; Jiang, Z.; Barker, J.; Zhou, H.; Schlindwein, F.S.; Nicolson, W.; Ng, G.A.; Li, X. ECGVEDNET: A Variational Encoder-Decoder Network for ECG Delineation in Morphology Variant ECGs. IEEE Trans. Biomed. Eng. 2024, 71, 2143–2153. [Google Scholar] [CrossRef]

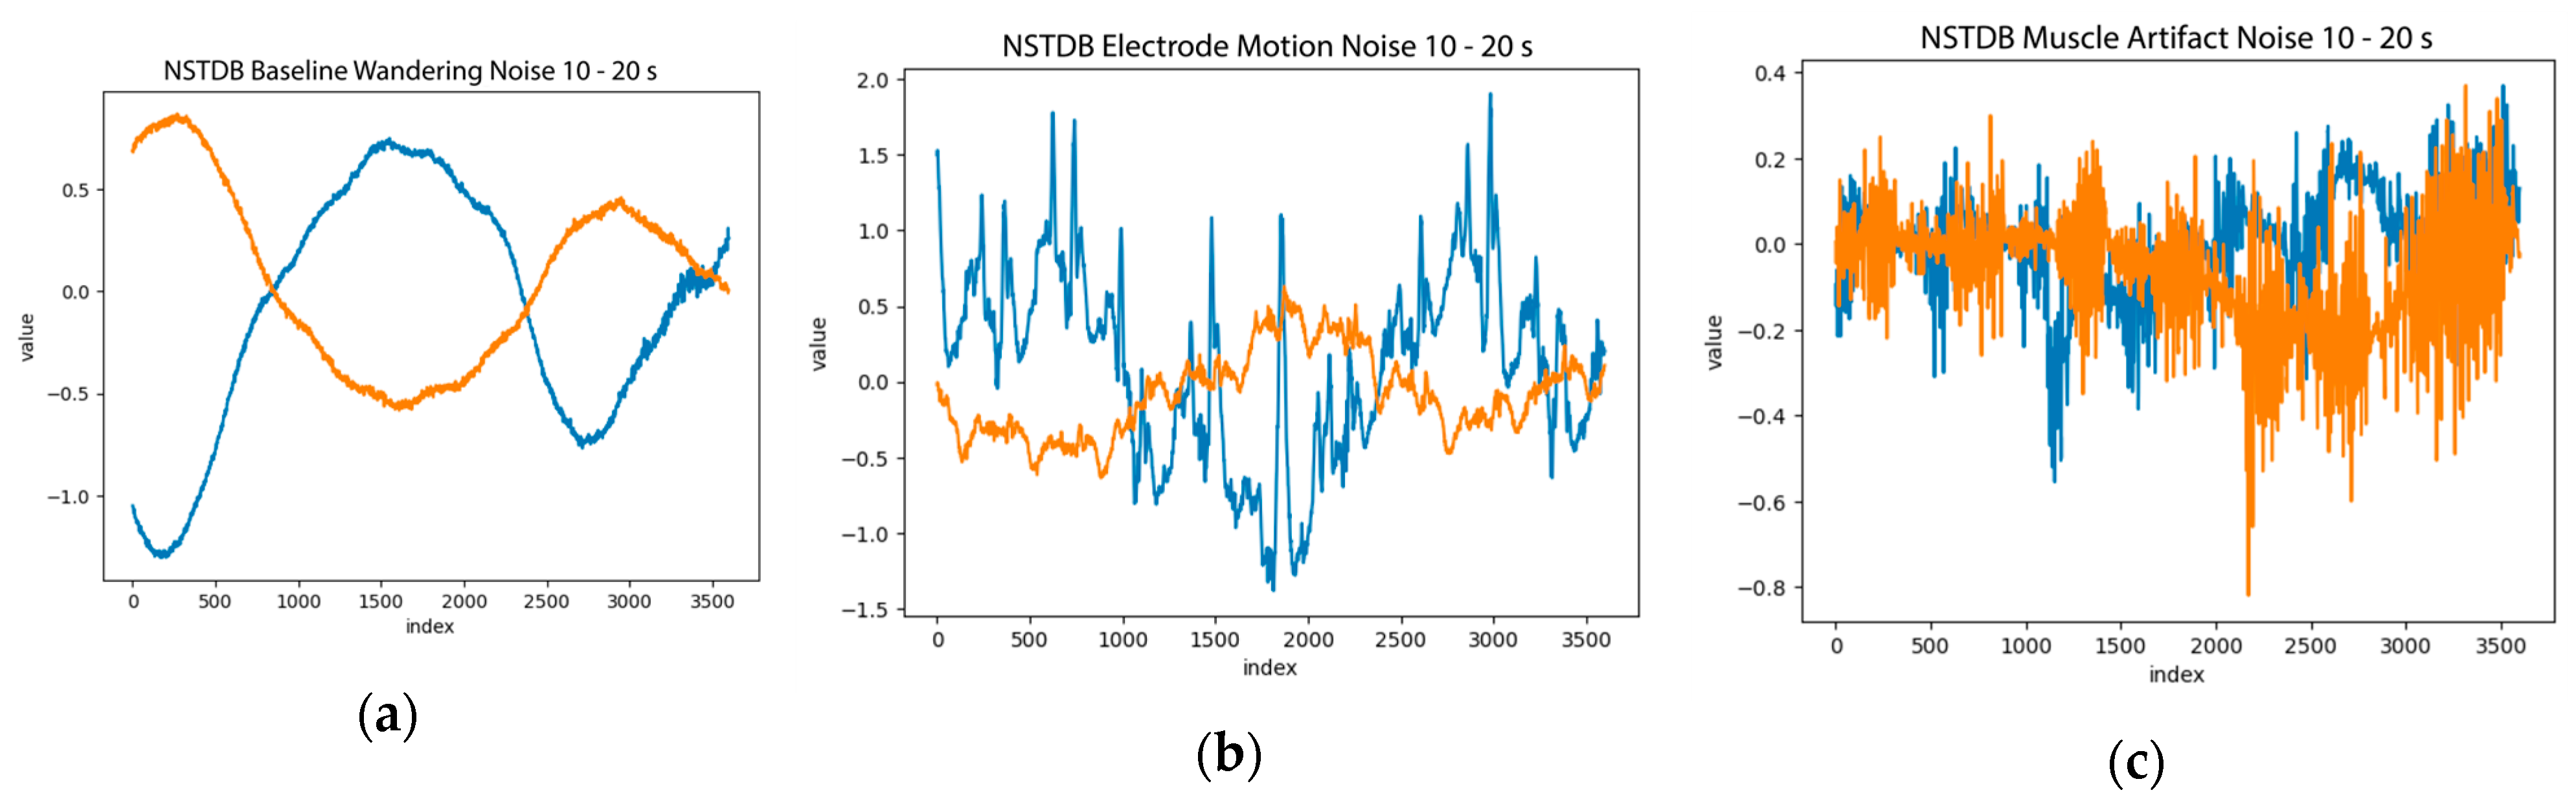
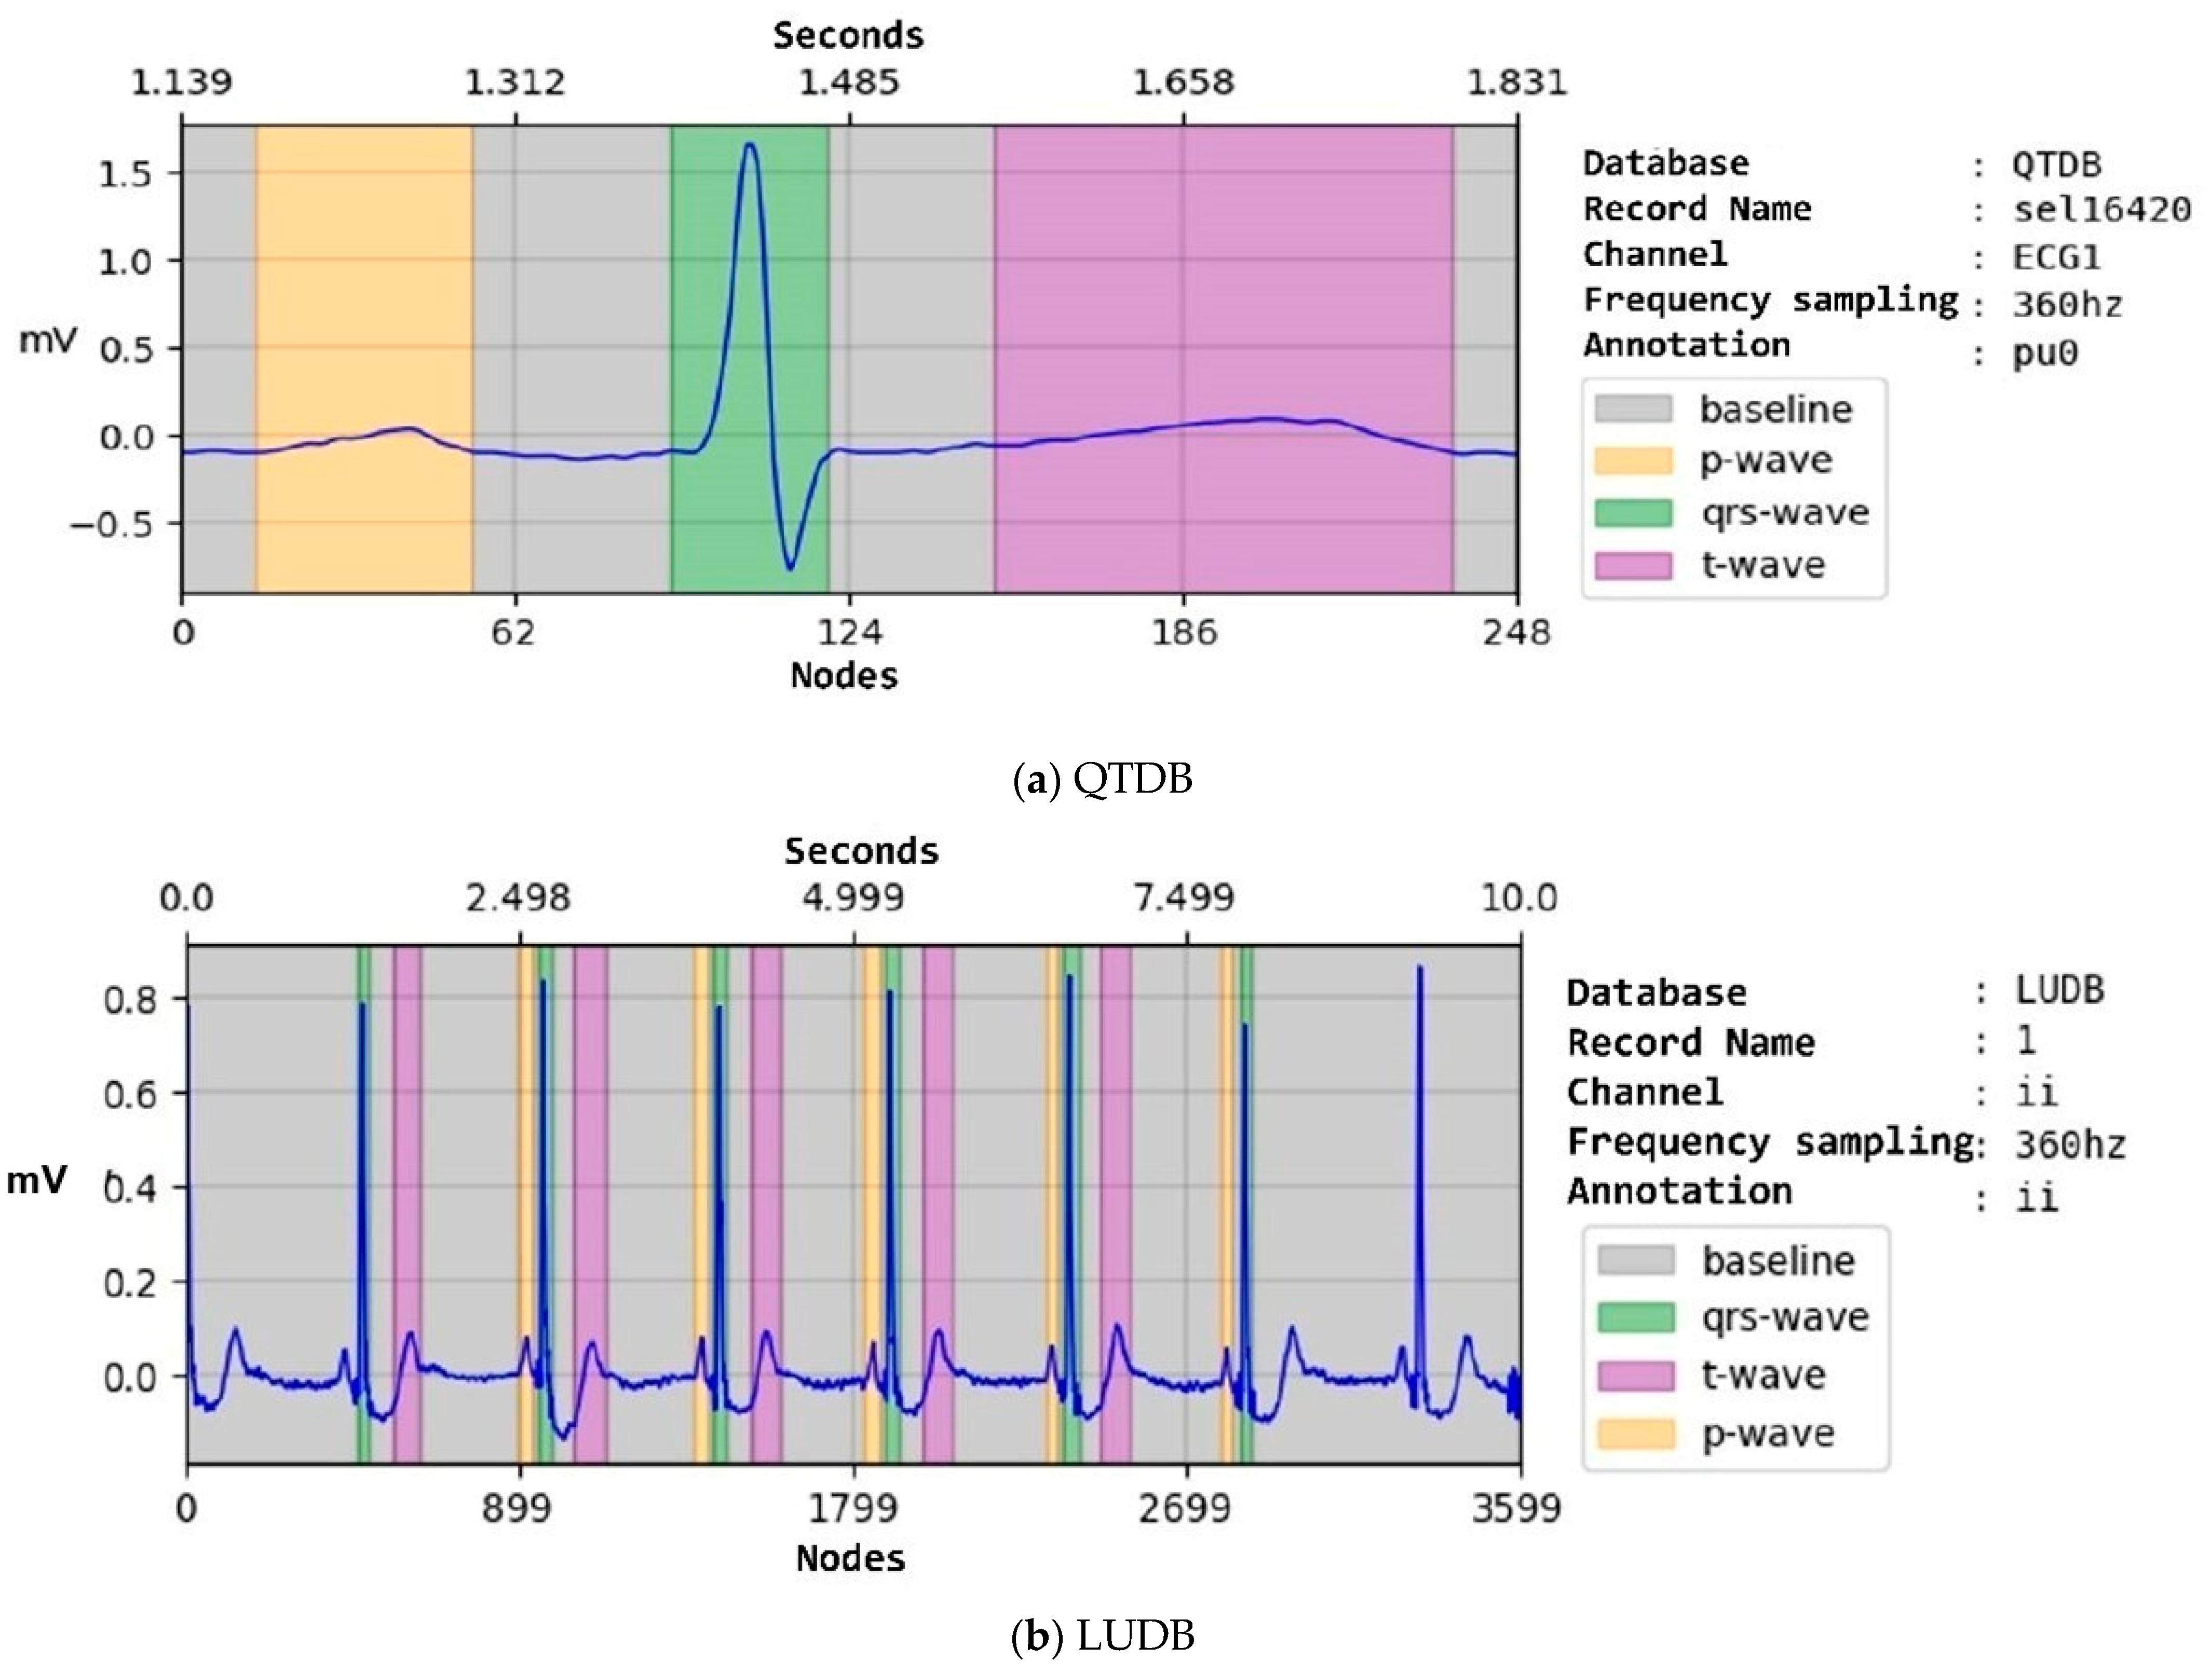
| Property | NSTDB | QTDB | LUDB |
|---|---|---|---|
| Frequency sampling | 360 Hz | 250 Hz | 500 Hz |
| Number of channels | 2 | 2 | 12 |
| The length of the signal (number of nodes) | 650,000 | 224,999 | 5000 |
| Unit | mV | mV | mV |
| Channel name | Noise1 and Noise2 | V2, mod.V1, ECG1, D4, CM4, CM5, V2-V3, V1-V2, V5, MLII, V1, V4, ECG2, V3, CM2, ML5, D3, V4-V5, and CC5 | i, ii, iii, aVR, aVL, aVF, and V1–V6 |
| Number of records | 6 | 105 | 200 |
| Pathology | ECG signal recording with baseline wander | Normal sinus Arrhythmia ST-change Supraventricular arrhythmia European ST-T Sudden death | Sinus rhythm Sinus tachycardia Sinus bradycardia Sinus arrhythmia Irregular sinus rhythm Abnormal rhythm |
| Function | Denoising ground truth | Denoising and delineation process | Delineation process |
| Database | Aim | ECG Records | ||
|---|---|---|---|---|
| Training Set | Validation Set | Testing Set (Unseen) | ||
| NSTDB | Denoising | Noise1 (BW) | - | Noise 2 (BW) |
| QTDB | Denoising and delineation (unseen) | Remaining records | Remaining records | MIT-BIH Arrhythmia (sel123 and sel233), MIT-BIH ST Change (sel302 and sel307), MIT-BIH Supraventricular Arrhythmia (sel820 and sel853), MIT-BIH Normal Sinus Rhythm (sel16420 and sel1679), European ST-T database (sele0106 and sele0121), Sudden death patients (sel32 and sel49), MIT-BIH Long-Term ECG (sel14046 and sel15814). |
| LUDB | Delineation | Remaining records | Remaining records | Sinus rhythm (2), Sinus bradycardia (1), Sinus arrhythmia (22), Sinus tachycardia (70), Irregular sinus rhythm (108), Atrial Fibrillation (8, 38, 44, 51, 83, 88, 93, 95, 96, 101, 110, 112, 129, 173), and Atrial Flutter (35, 52, 103). |
| Data | FE | Metrics Evaluation | Mean ± Standard Deviation | ||
|---|---|---|---|---|---|
| Training | Validation | Testing | |||
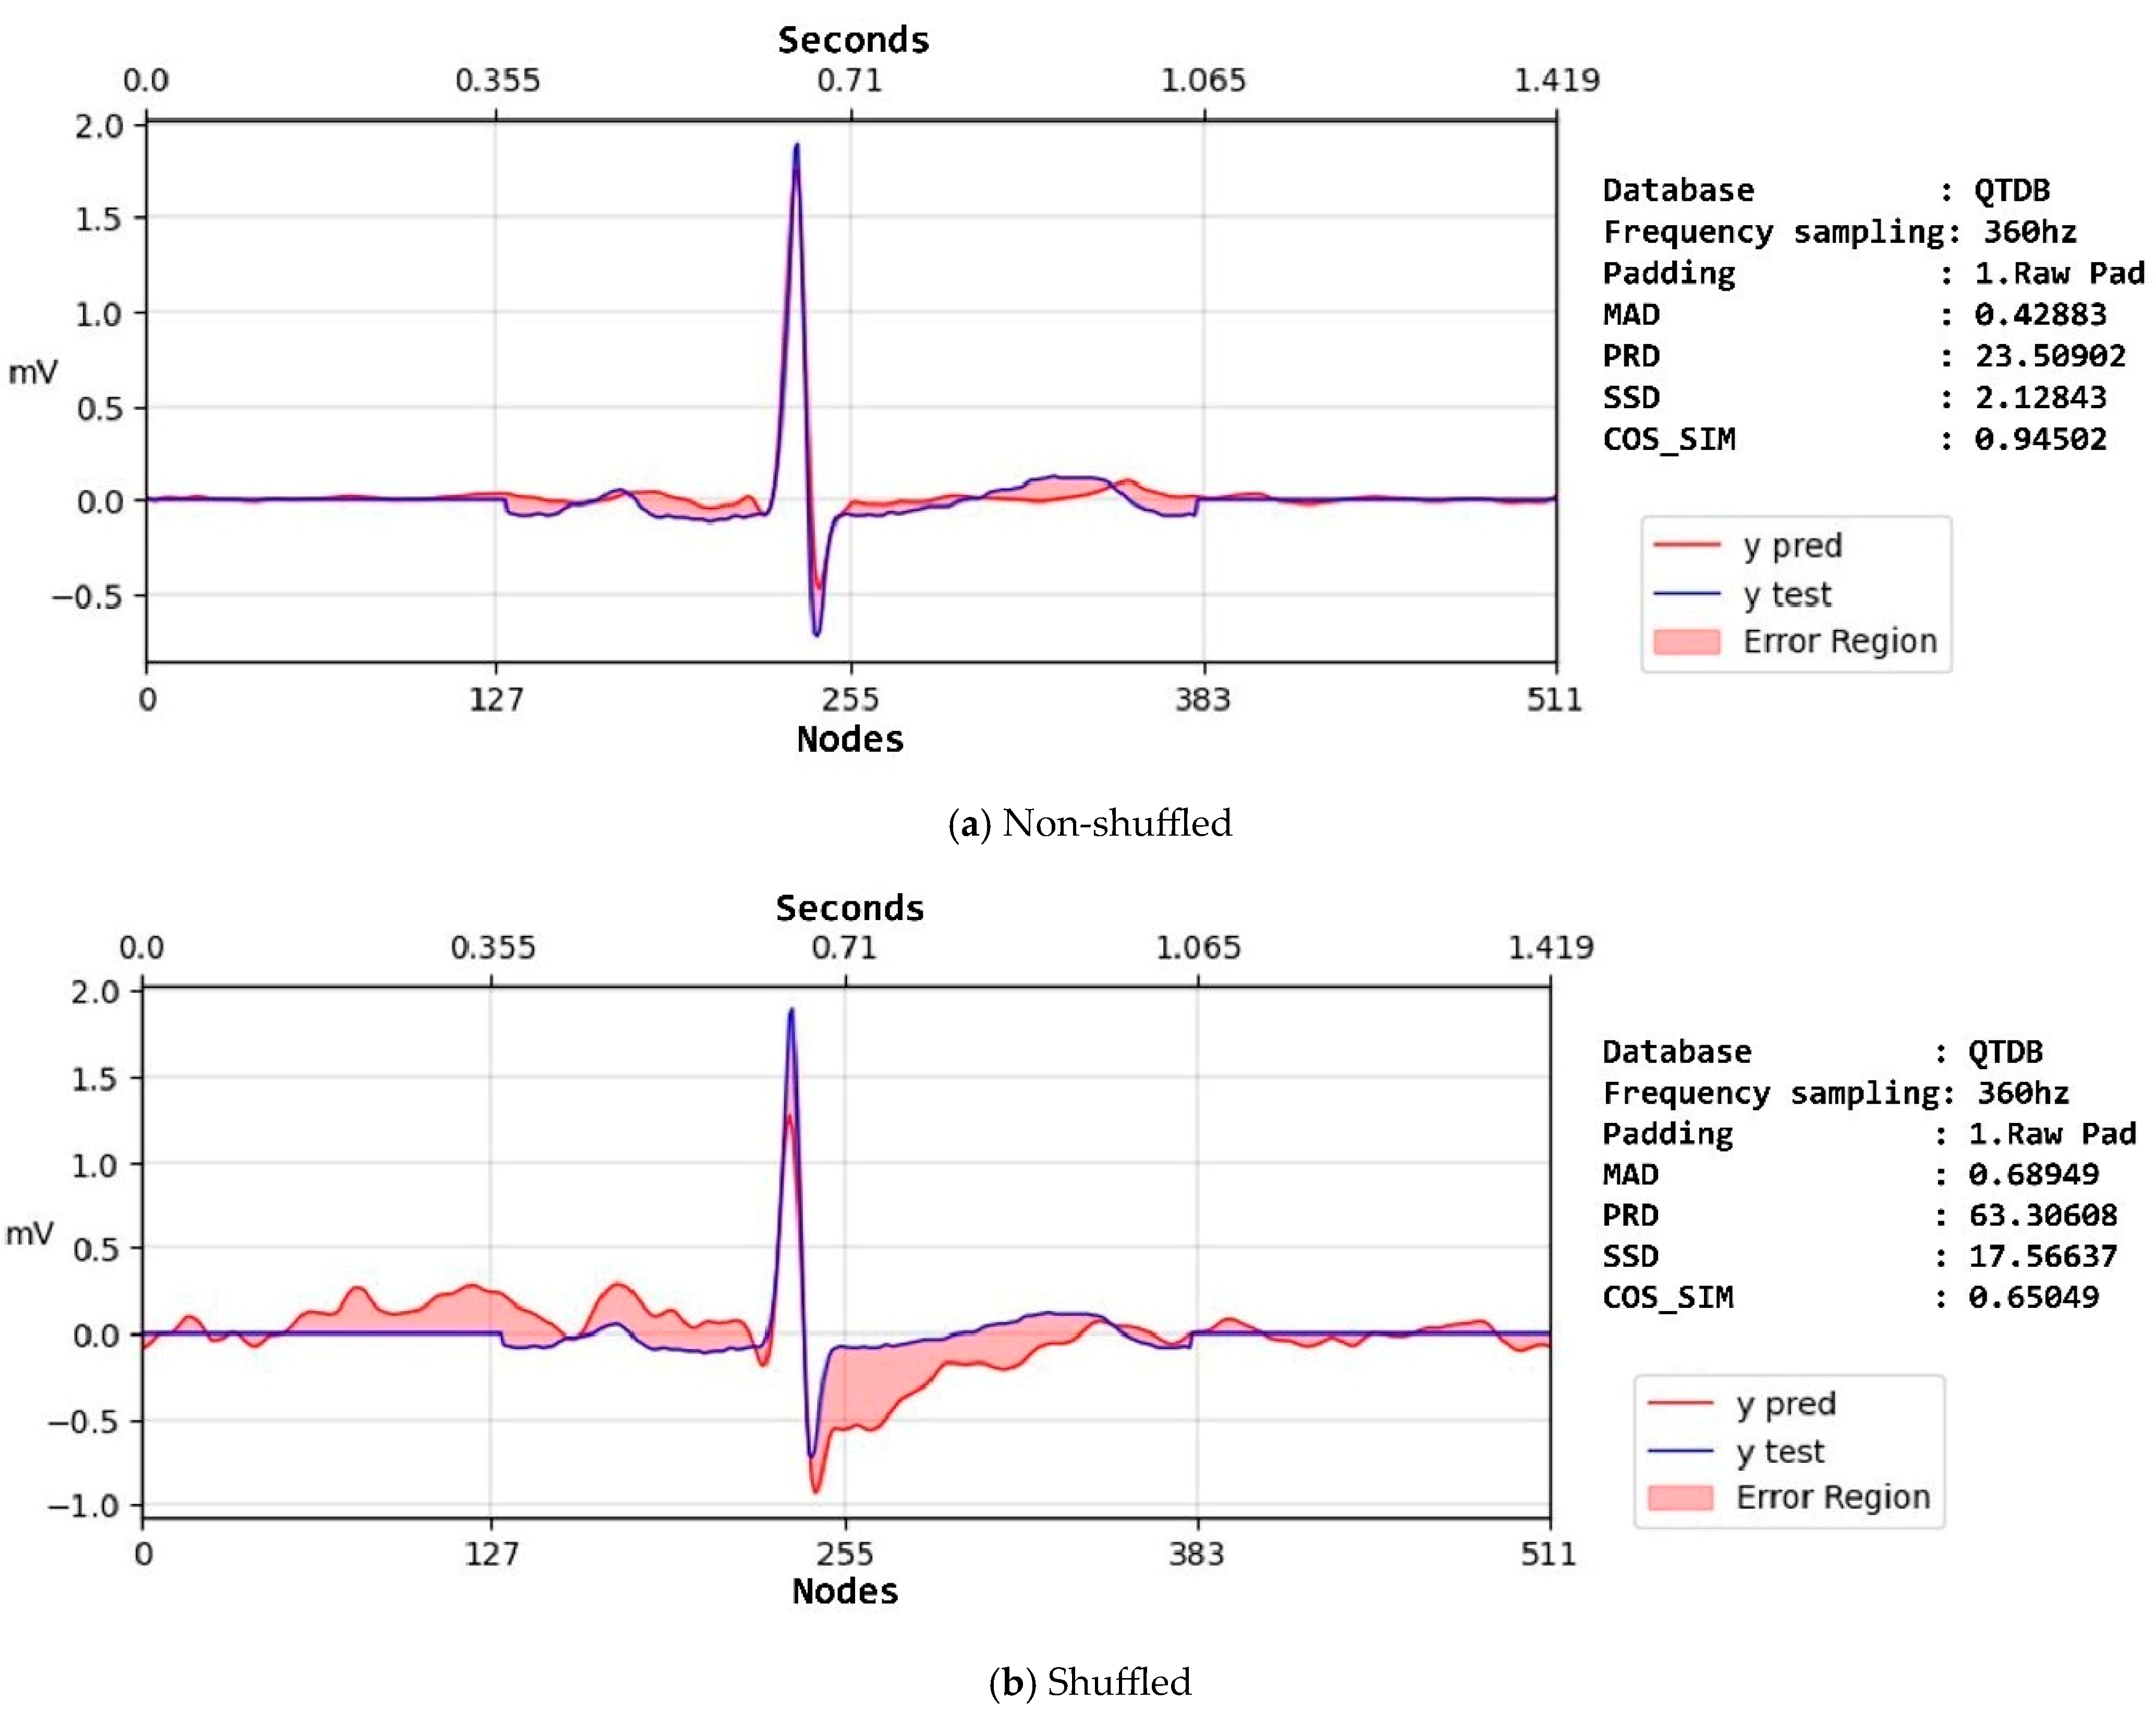
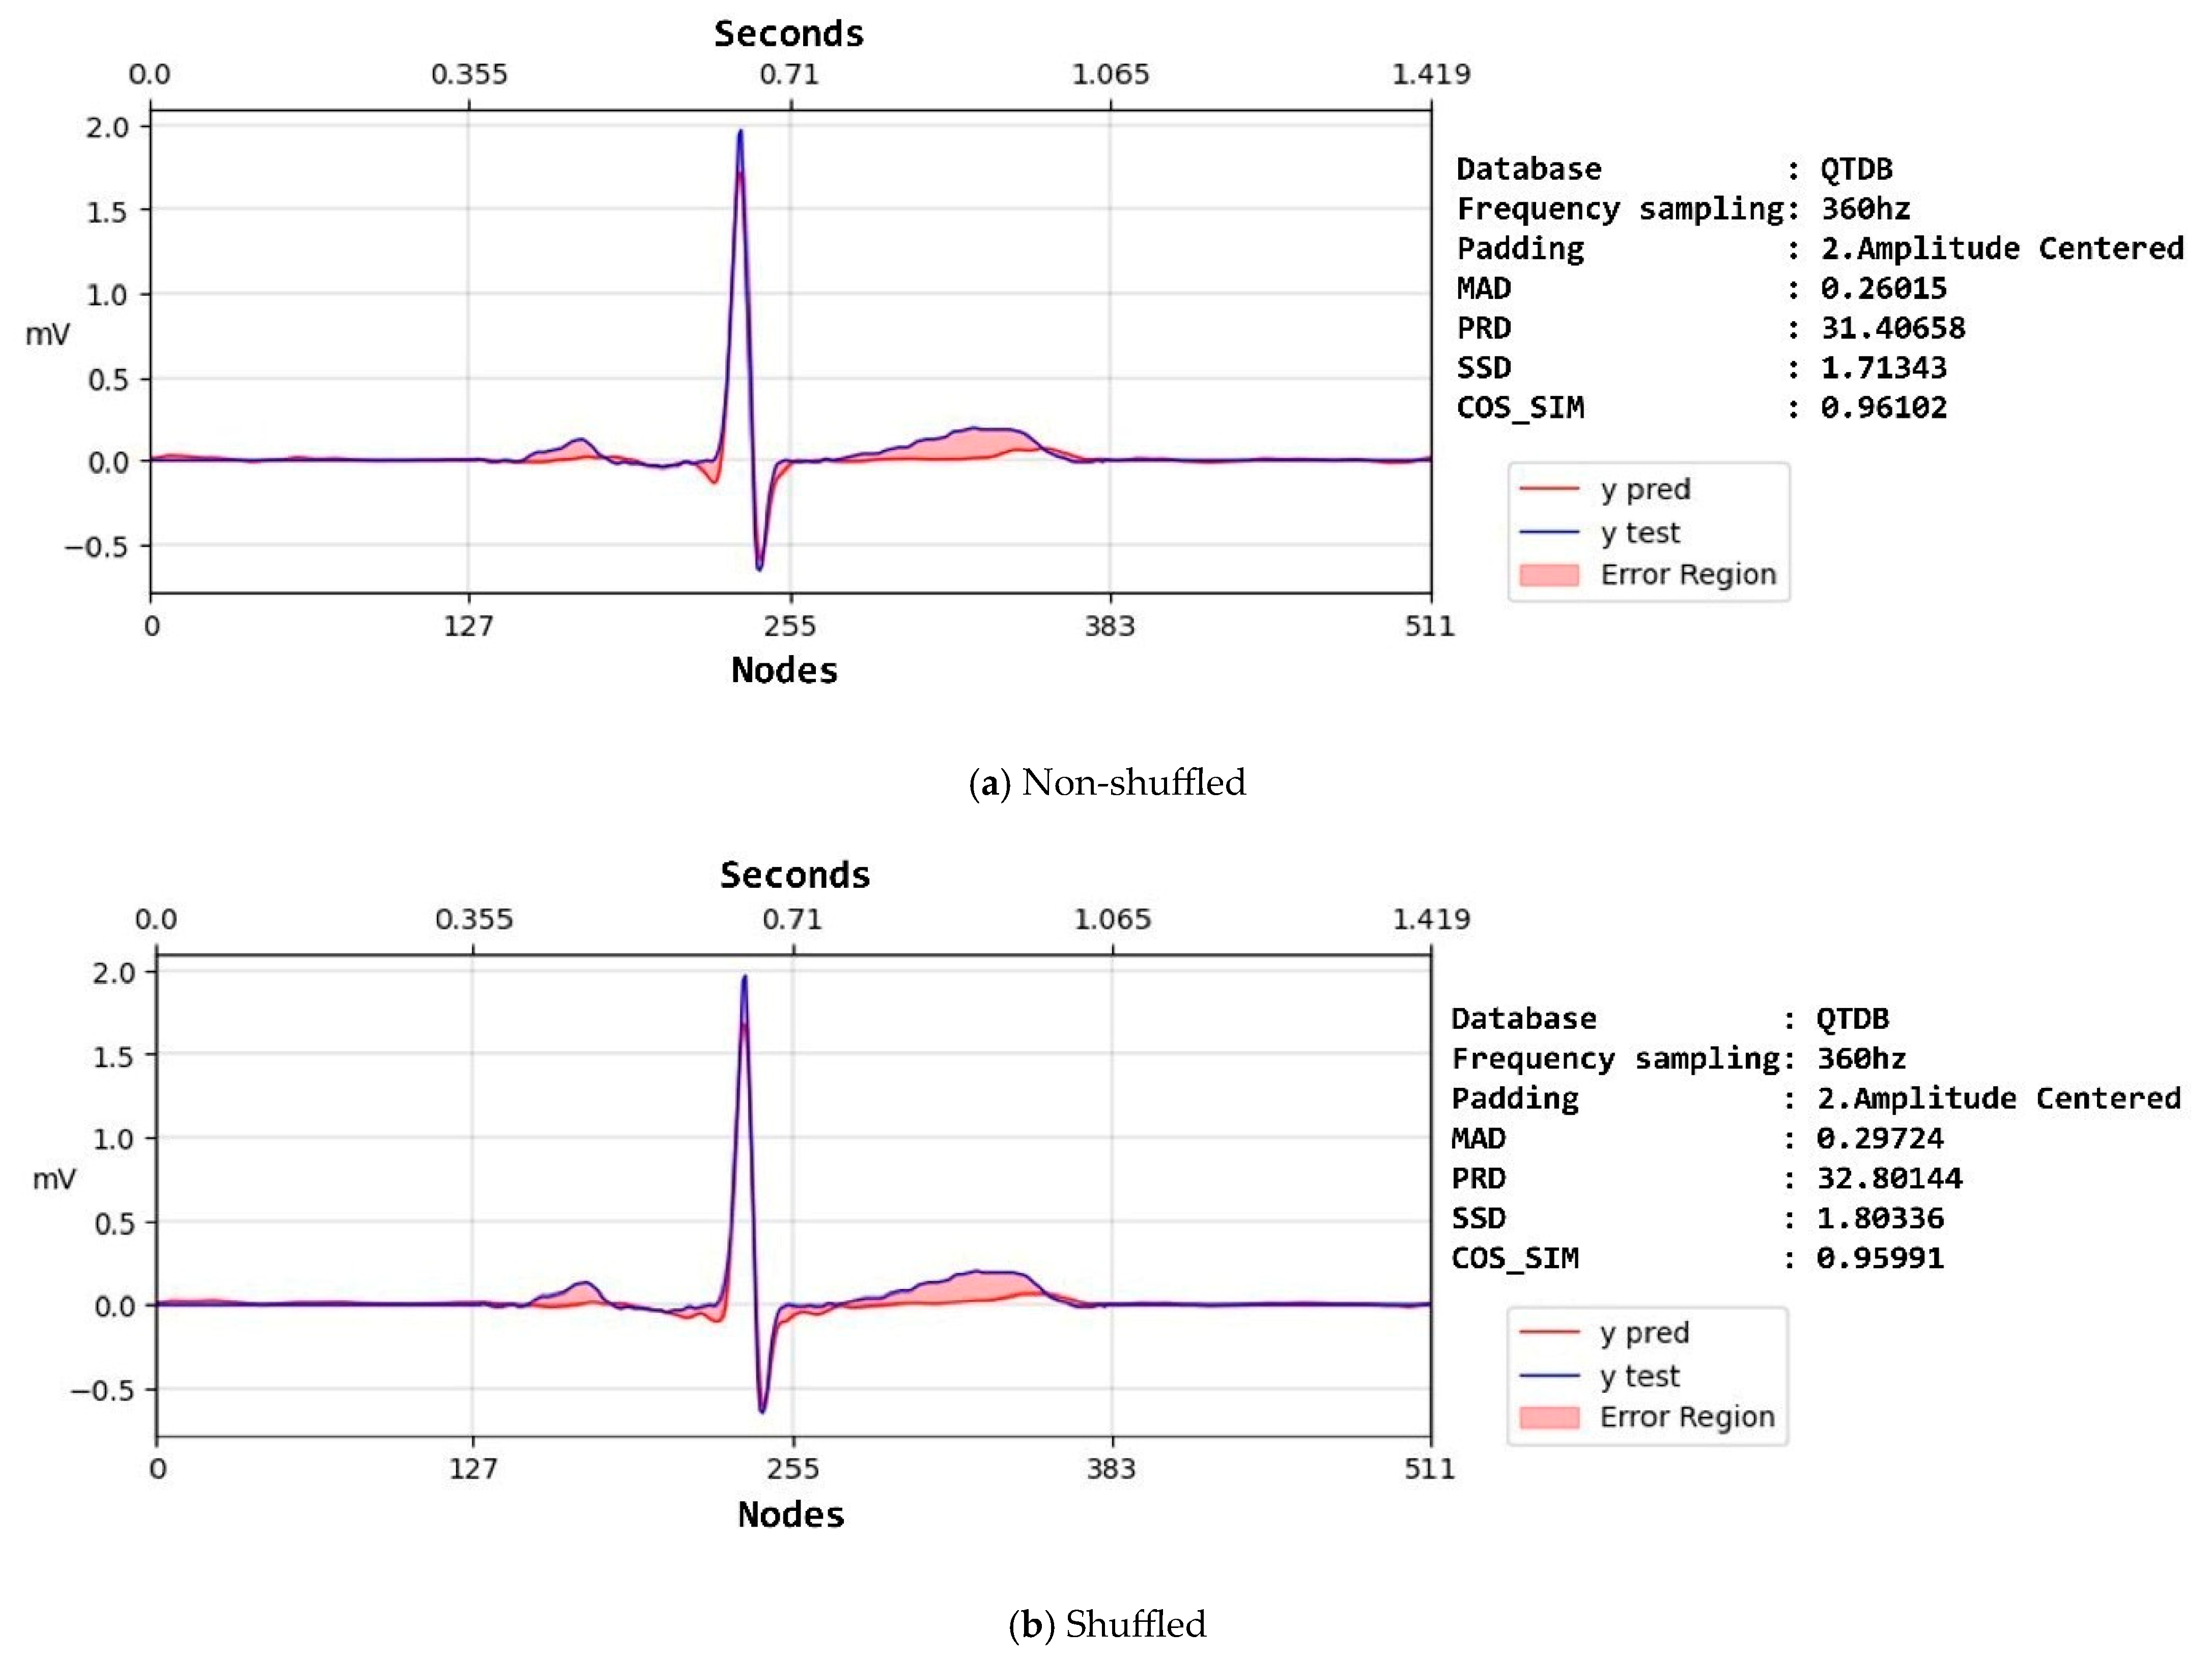
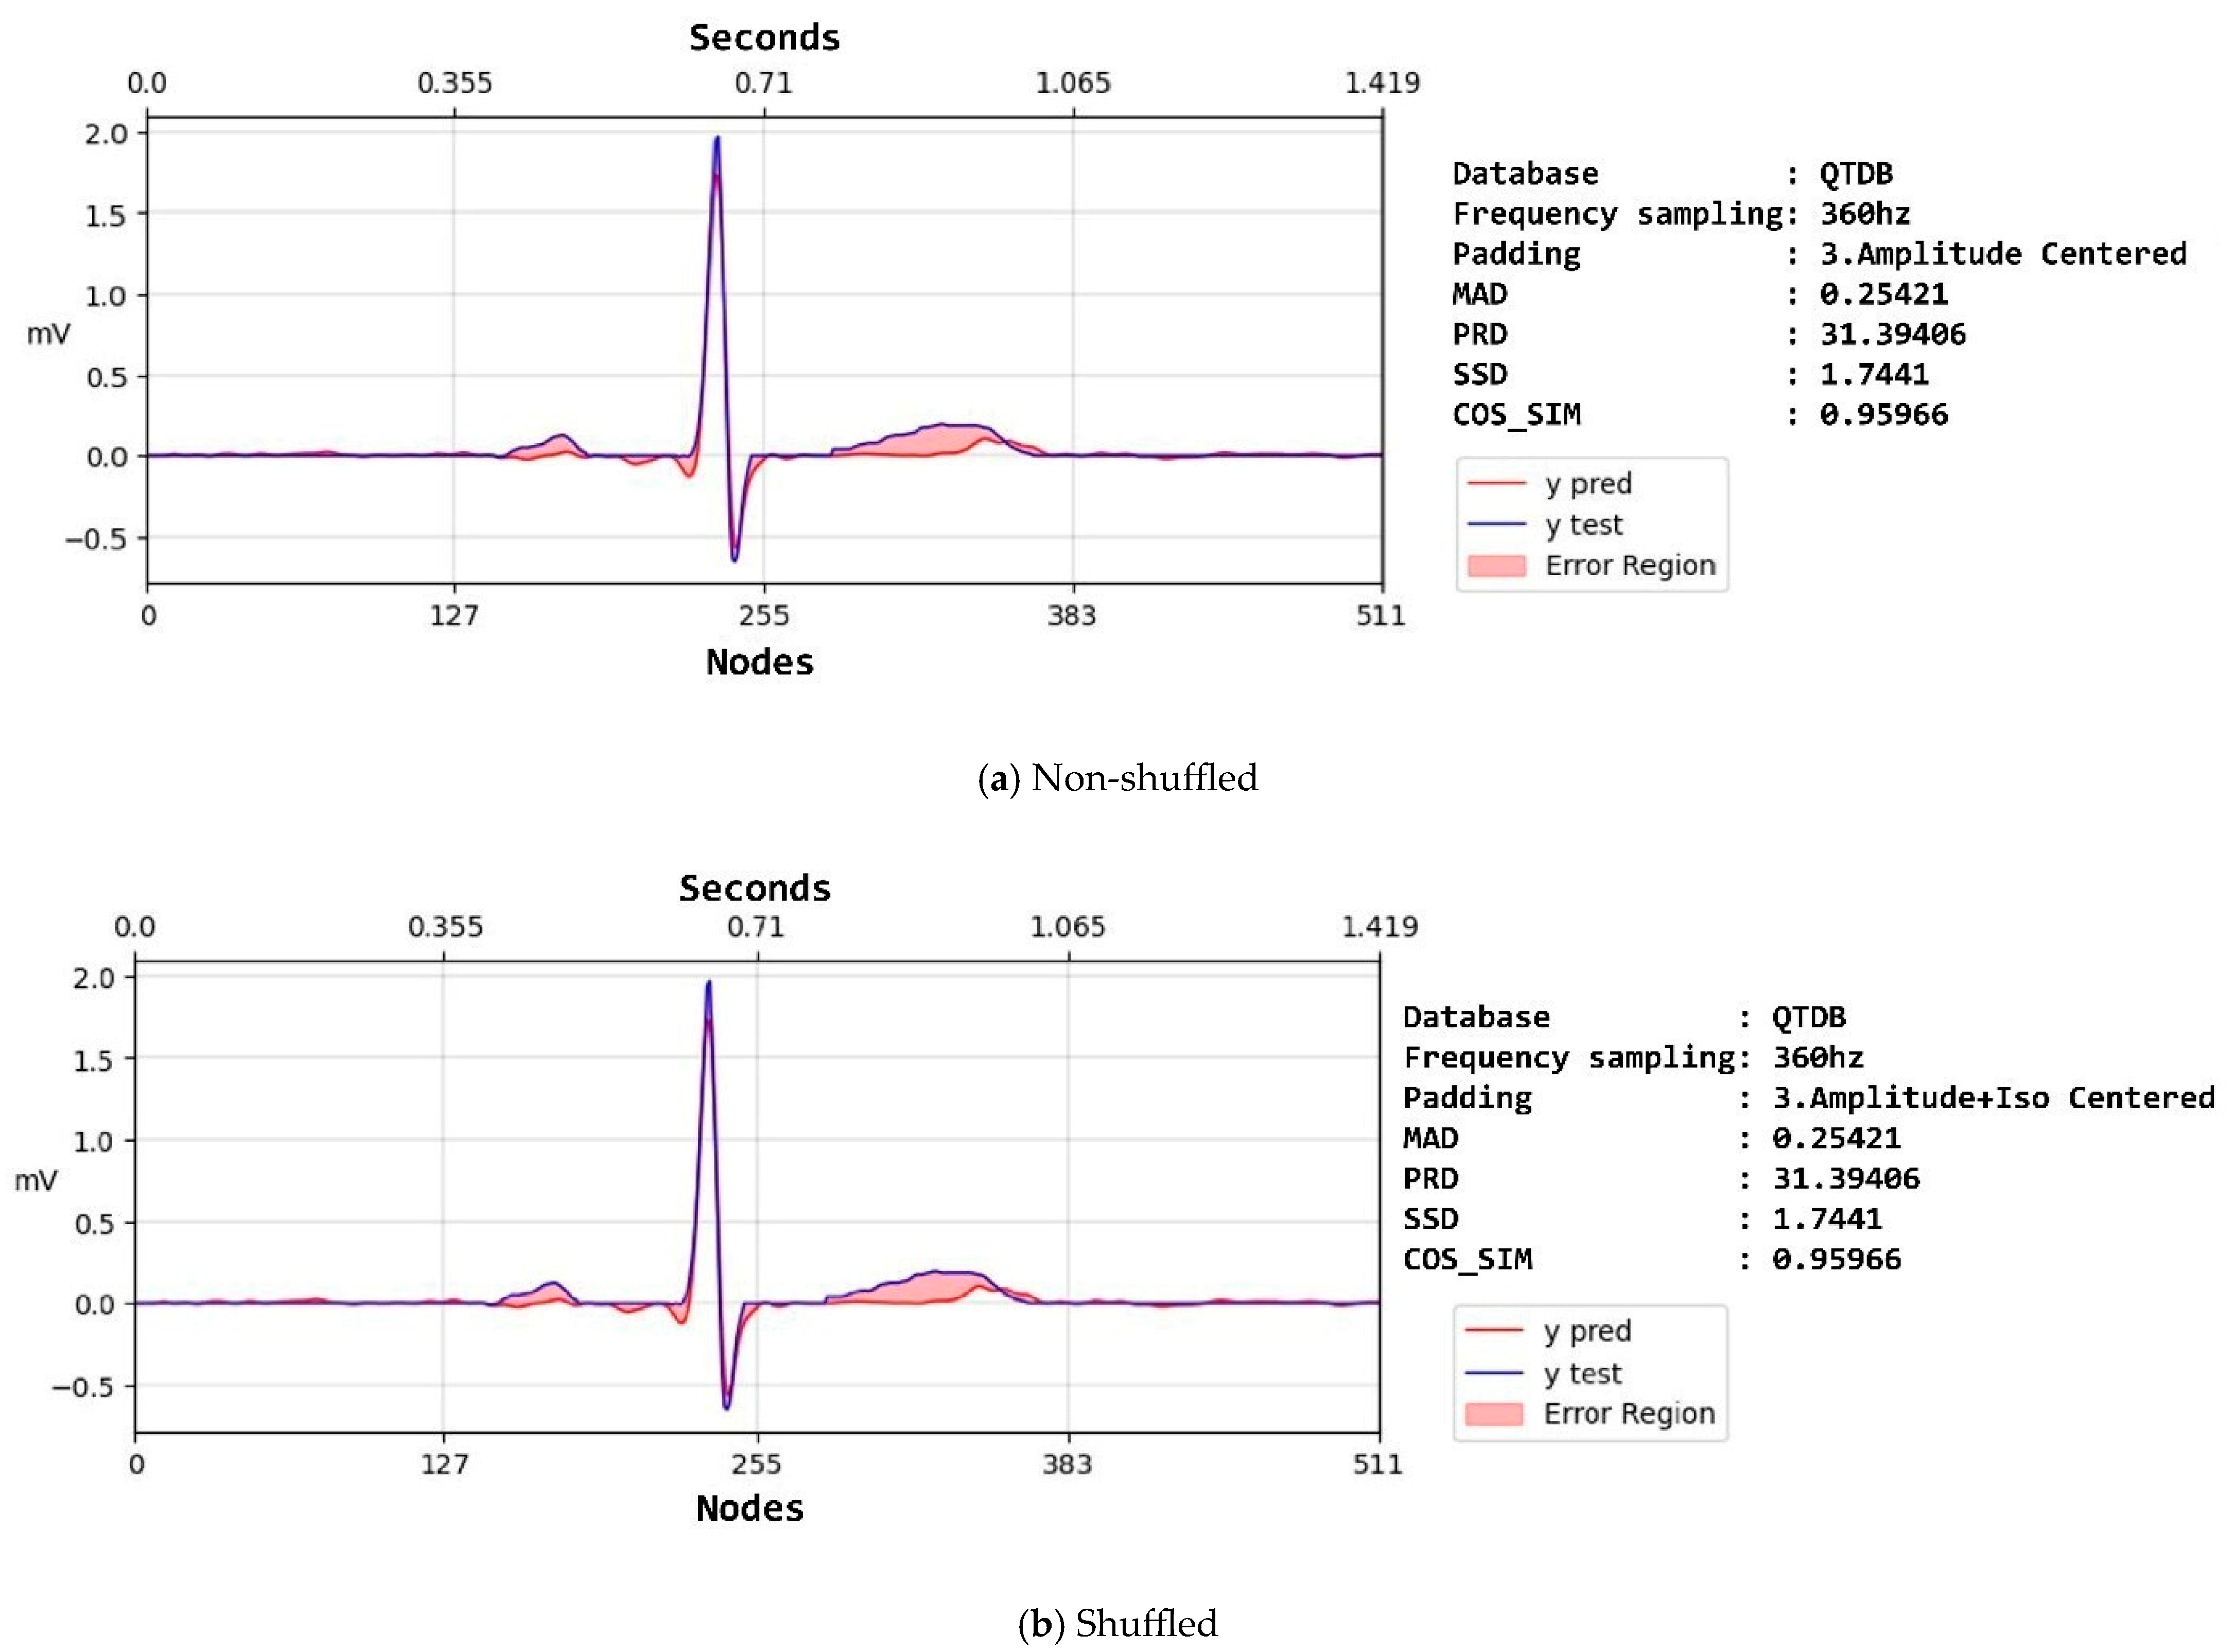
| Non-shuffled | Raw | SSD | 1665.42 ± 5994.15 | 1399.01 ± 2697.22 | 163.23 ± 370.85 |
| SNR | 14.17 ± 10.91 | 15.83 ± 10.84 | 17 ± 9.61 | ||
| MAD | 1.77 ± 2.48 | 1.75 ± 2.15 | 0.84 ± 0.79 | ||
| PRD | 209.08 ± 208.99 | 130.09 ± 167.42 | 103.75 ± 120.34 | ||
| COS_SIM | 0.58 ± 0.33 | 0.62 ± 0.33 | 0.68 ± 0.29 | ||
| Amplitude | SSD | 4.79 ± 9.83 | 24.32 ± 7.96 | 6.22 ± 7.3 | |
| SNR | 23.89 ± 7.94 | 37.01 ± 7.94 | 22.77 ± 7.3 | ||
| MAD | 0.31 ± 0.22 | 0.35 ± 0.25 | 0.41 ± 0.29 | ||
| PRD | 45.83 ± 33.9 | 43.86 ± 27.32 | 53.1 ± 30.21 | ||
| COS_SIM | 0.91 ± 0.1 | 0.91 ± 0.1 | 0.89 ± 0.1 | ||
| Amplitude–isoelectric | SSD | 3.86 ± 8.89 | 5.1 ± 9.28 | 5.03 ± 7.81 | |
| SNR | 25.15 ± 7.77 | 25.39 ± 7.75 | 23.39 ± 7.06 | ||
| MAD | 0.31 ± 0.22 | 0.35 ± 0.26 | 0.41 ± 0.3 | ||
| PRD | 39.67 ± 28.3 | 38.98 ± 27.59 | 50.39 ± 28.85 | ||
| COS_SIM | 0.93 ± 0.09 | 0.93 ± 0.1 | 0.91 ± 0.1 | ||
| Shuffled | Raw | SSD | 878 ± 4158.58 | 843.78 ± 4547.76 | 83.47 ± 117.33 |
| SNR | 11.66 ± 8.02 | 11.64 ± 8.01 | 12.16 ± 7.02 | ||
| MAD | 1.76 ± 2.08 | 1.74 ± 2.02 | 1.09 ± 0.6 | ||
| PRD | 114.03 ± 64.23 | 114.46 ± 65.08 | 118.86 ± 57.36 | ||
| COS_SIM | 0.65 ± 0.28 | 0.65 ± 0.28 | 0.61 ± 0.25 | ||
| Amplitude | SSD | 4.48 ± 8.26 | 4.32 ± 7.88 | 5.49 ± 7.32 | |
| SNR | 24.34 ± 7.84 | 37.02 ± 7.88 | 22.77 ± 7.32 | ||
| MAD | 0.32 ± 0.22 | 0.35 ± 0.25 | 0.43 ± 0.29 | ||
| PRD | 44.78 ± 34.2 | 45.21 ± 35.38 | 56.98 ± 37.66 | ||
| COS_SIM | 0.92 ± 0.09 | 0.91 ± 0.1 | 0.9 ± 0.1 | ||
| Amplitude–isoelectric | SSD | 3.6 ± 7.15 | 3.6 ± 7.11 | 4.81 ± 7.29 | |
| SNR | 25.55 ± 7.75 | 25.46 ± 7.81 | 23.46 ± 7.22 | ||
| MAD | 0.31 ± 0.22 | 0.35 ± 0.26 | 0.43 ± 0.3 | ||
| PRD | 37.72 ± 27.3 | 37.77 ± 27.2 | 53.05 ± 38.42 | ||
| COS_SIM | 0.94 ± 0.08 | 0.94 ± 0.09 | 0.91 ± 0.1 | ||
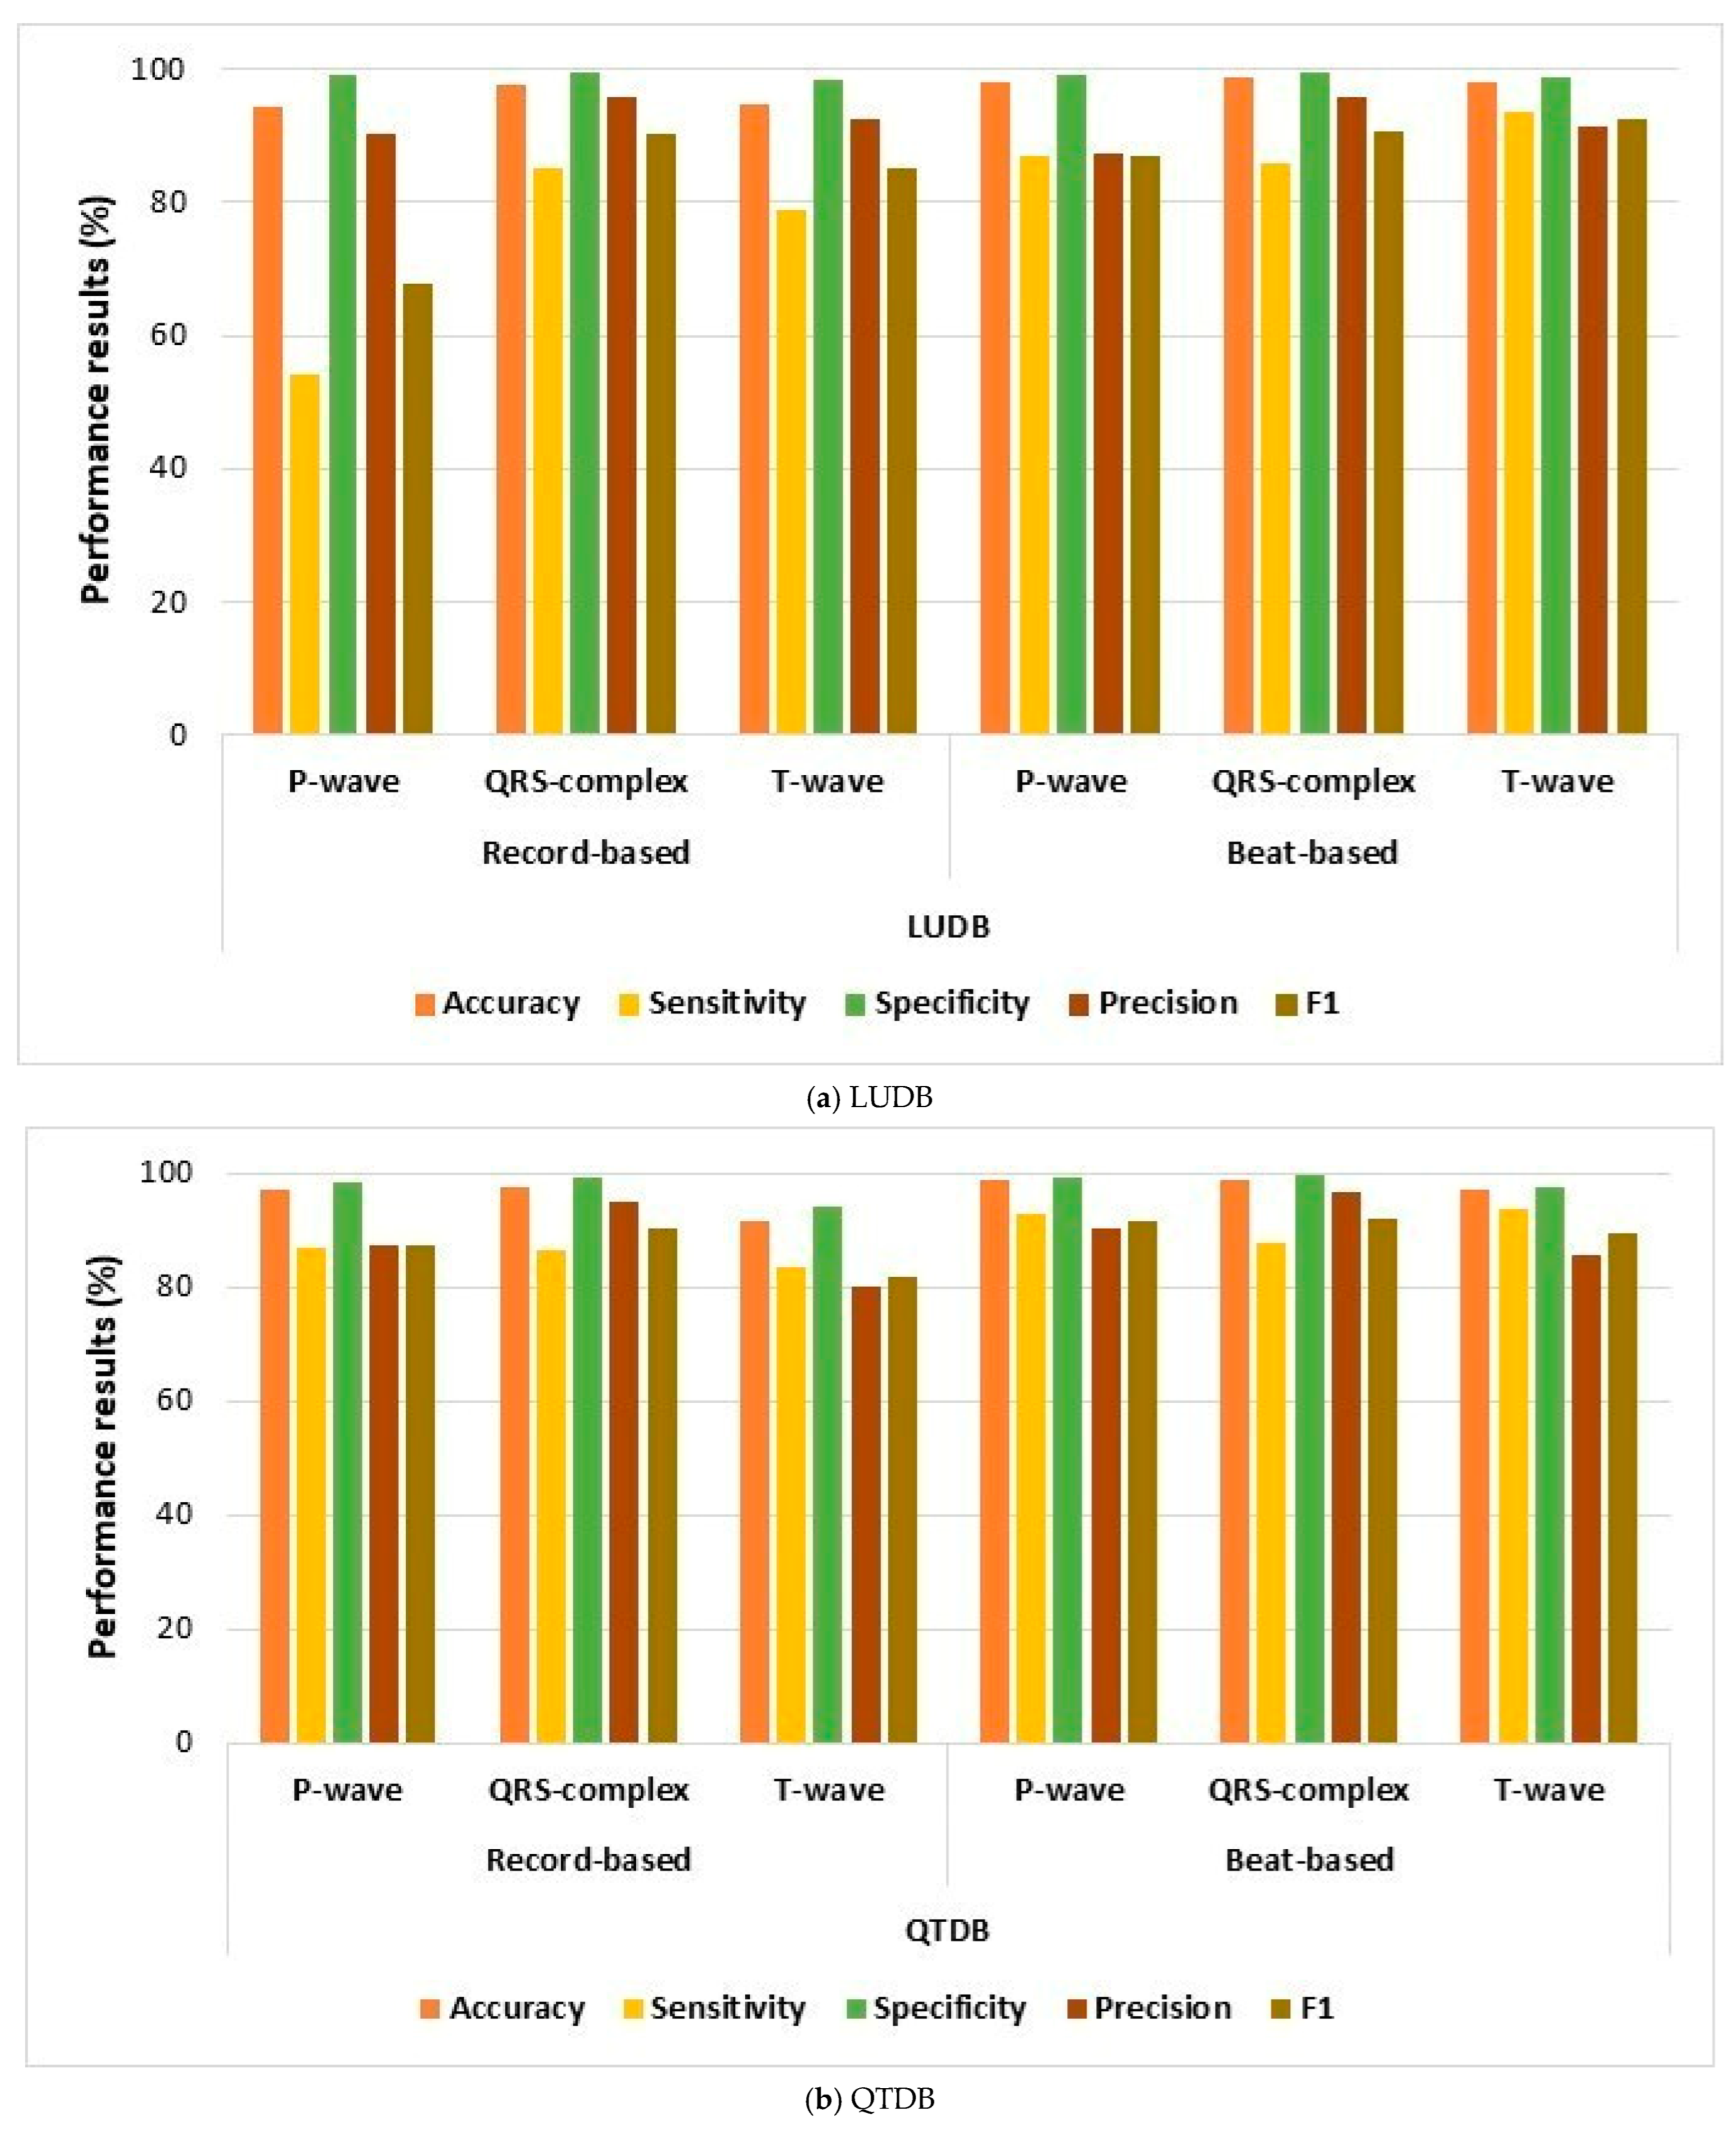
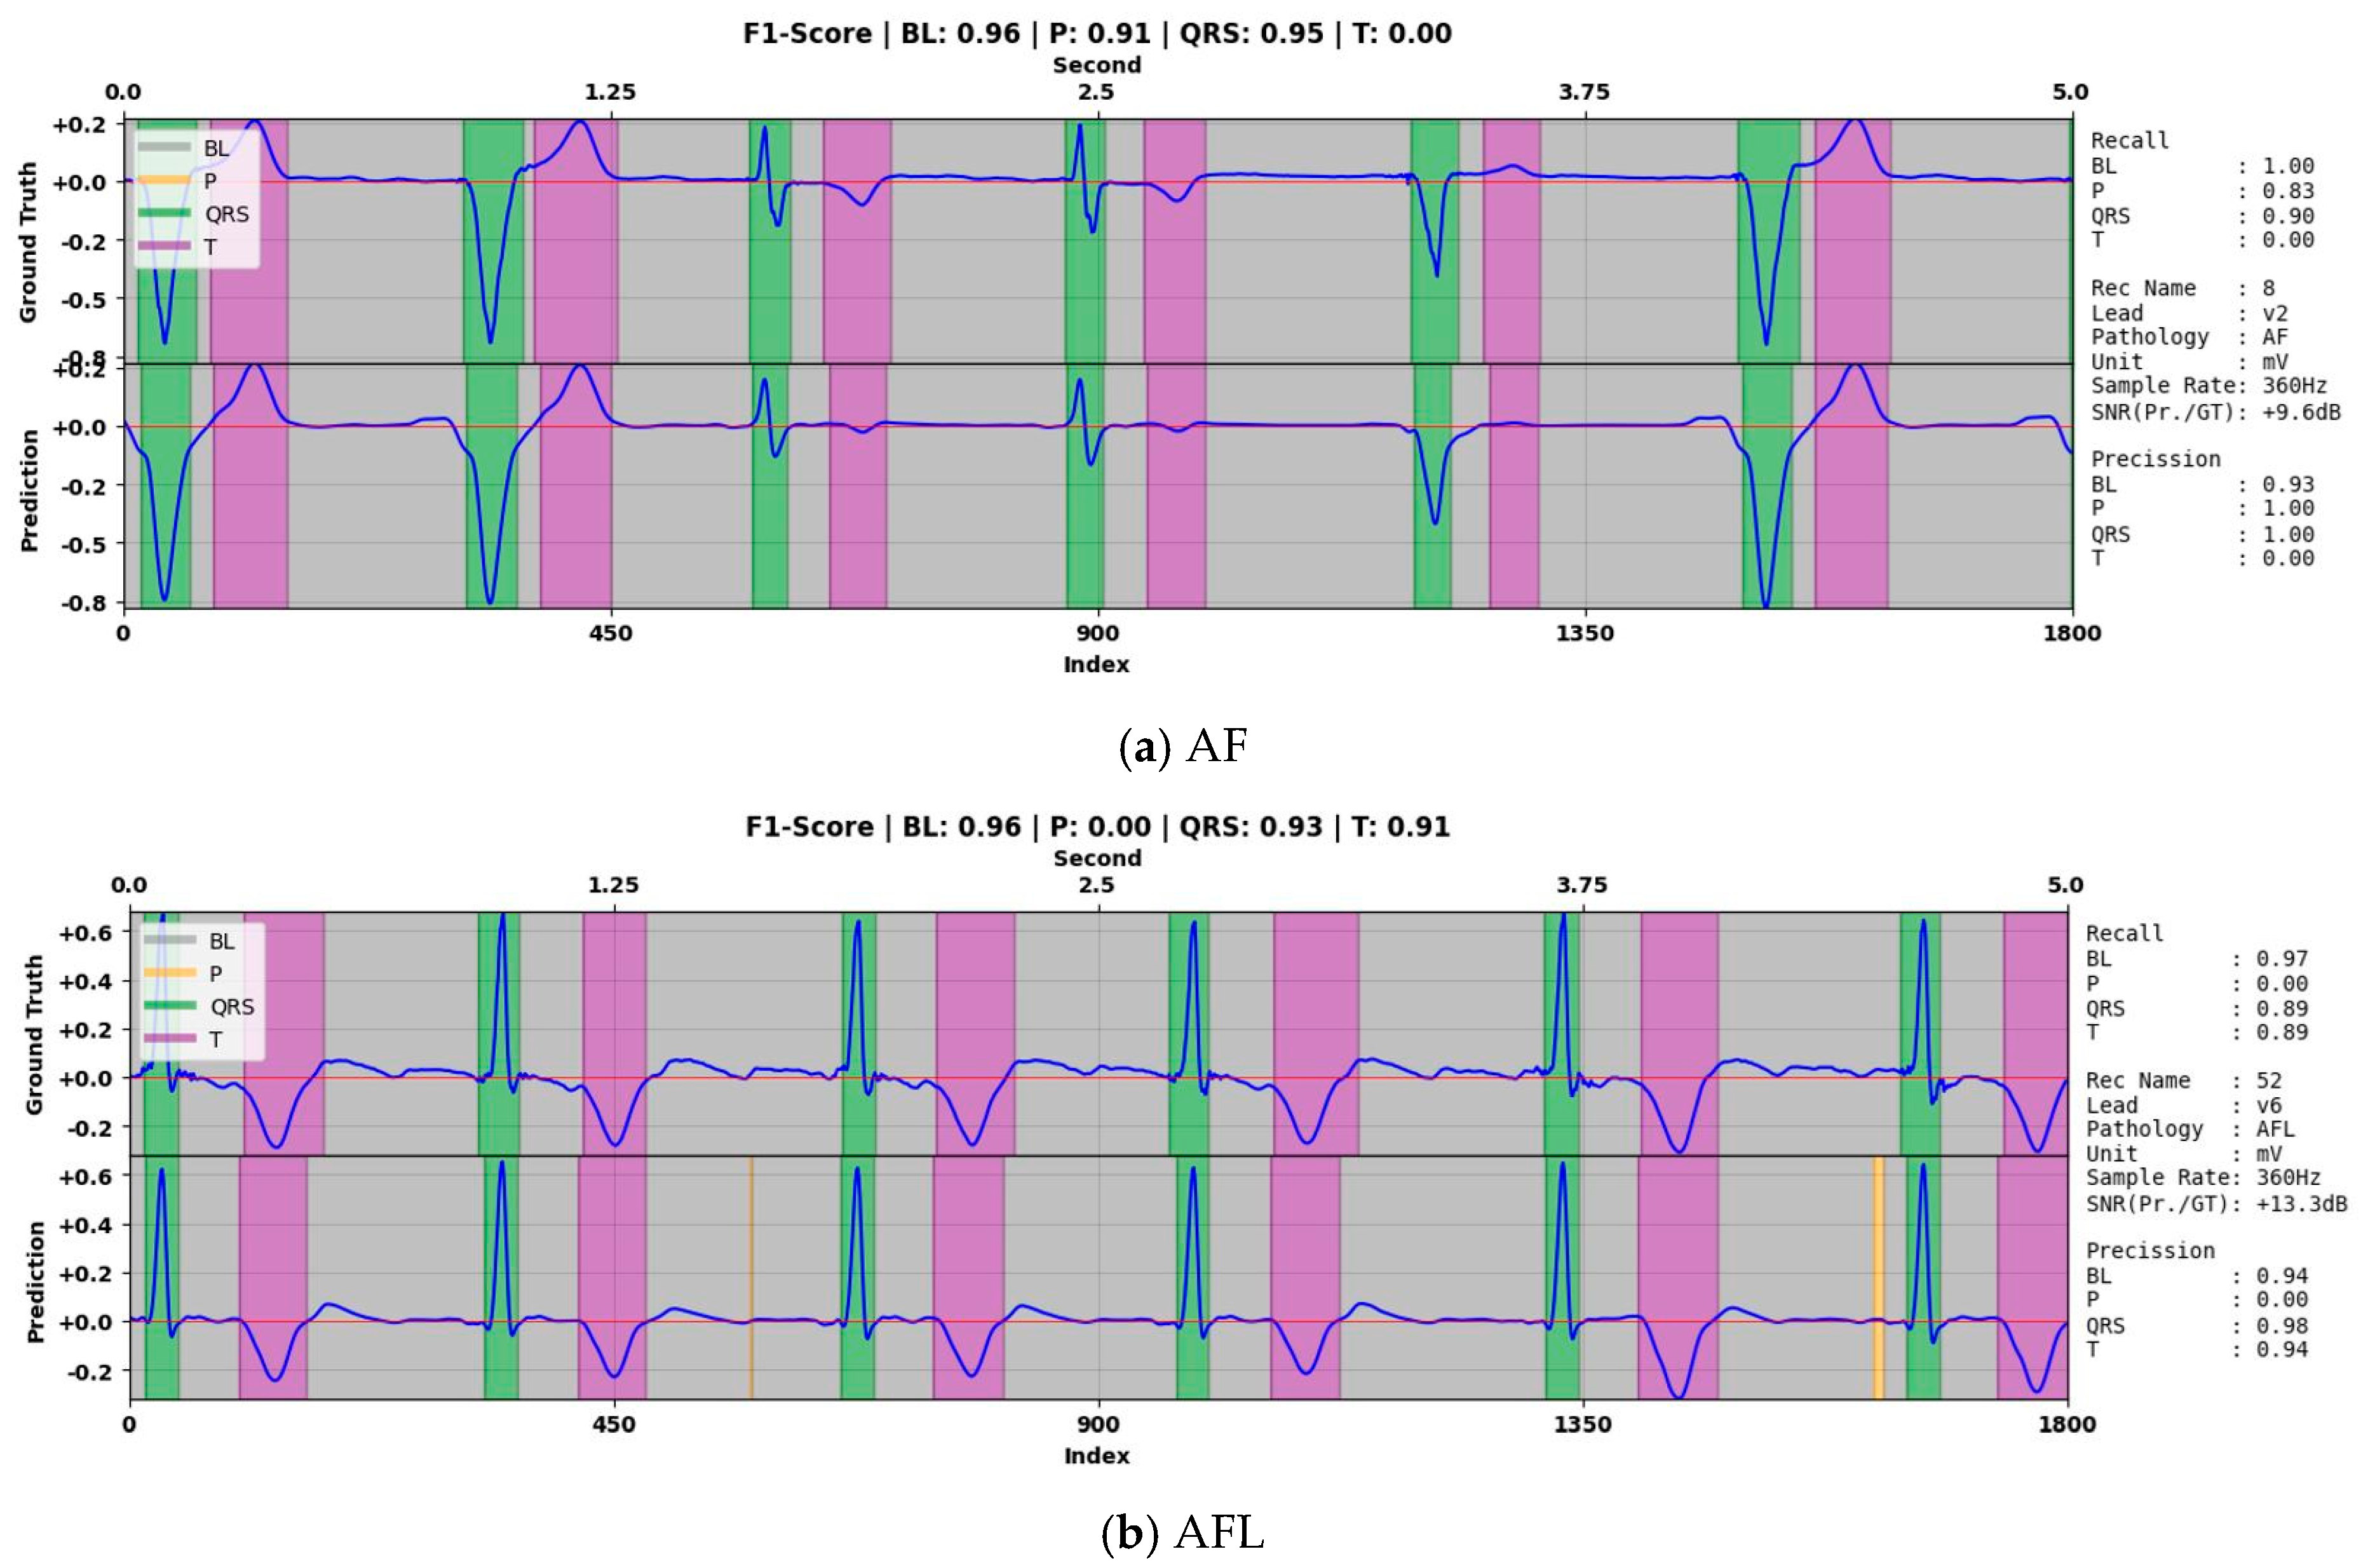
| AF Records | Class | Performance Results (%) | ||||
|---|---|---|---|---|---|---|
| Accuracy | Sensitivity | Specificity | Precision | F1 | ||
| 8 | P-wave | 99.7 | 0 | 99.7 | 0 | 0 |
| QRS-complex | 96.5 | 77.8 | 99.6 | 96.9 | 86.3 | |
| T-wave | 96.8 | 91.3 | 97.9 | 90.3 | 90.8 | |
| 38 | P-wave | 94.4 | 0 | 94.4 | 0 | 0 |
| QRS-complex | 95.5 | 76 | 99.5 | 96.6 | 85 | |
| T-wave | 84.7 | 16.8 | 99.7 | 91.4 | 28.3 | |
| 44 | P-wave | 97.8 | 0 | 97.8 | 0 | 0 |
| QRS-complex | 96.9 | 80.2 | 99.6 | 97.2 | 87.9 | |
| T-wave | 94 | 73.7 | 98 | 87.7 | 80.1 | |
| 51 | P-wave | 97.2 | 0 | 97.2 | 0 | 0 |
| QRS-complex | 96.5 | 77.2 | 99.9 | 99.1 | 86.8 | |
| T-wave | 95.6 | 76.4 | 98.8 | 91.6 | 83.3 | |
| 83 | P-wave | 96.3 | 0 | 96.3 | 0 | 0 |
| QRS-complex | 89.1 | 40.3 | 100 | 99.8 | 57.5 | |
| T-wave | 87.1 | 77 | 89.9 | 67.7 | 72 | |
| 88 | P-wave | 96.6 | 0 | 96.6 | 0 | 0 |
| QRS-complex | 97.9 | 89.7 | 99.1 | 93.5 | 91.6 | |
| T-wave | 81.4 | 24 | 95.6 | 57.7 | 33.9 | |
| 93 | P-wave | 97.1 | 0 | 97.1 | 0 | 0 |
| QRS-complex | 94.3 | 62.5 | 99.7 | 97.7 | 76.3 | |
| T-wave | 93.7 | 85.5 | 95.4 | 79.2 | 82.2 | |
| 95 | P-wave | 99.6 | 0 | 99.6 | 0 | 0 |
| QRS-complex | 93.7 | 53.7 | 99.2 | 90.2 | 67.3 | |
| T-wave | 89.4 | 73.8 | 93.3 | 73.8 | 73.8 | |
| 96 | P-wave | 96.1 | 0 | 96.1 | 0 | 0 |
| QRS-complex | 98.2 | 92.8 | 99 | 92.5 | 92.6 | |
| T-wave | 87.4 | 40.3 | 98.9 | 89.7 | 55.6 | |
| 101 | P-wave | 93.8 | 0 | 93.8 | 0 | 0 |
| QRS-complex | 96.7 | 80 | 99.6 | 97.2 | 87.7 | |
| T-wave | 89.4 | 63.8 | 96.6 | 83.8 | 72.4 | |
| 110 | P-wave | 98.9 | 0 | 98.9 | 0 | 0 |
| QRS-complex | 95.2 | 69.6 | 99.6 | 96.4 | 80.8 | |
| T-wave | 88.3 | 56.6 | 97.8 | 88.3 | 69 | |
| 112 | P-wave | 92.1 | 0 | 92.1 | 0 | 0 |
| QRS-complex | 98.1 | 91.9 | 99.2 | 95 | 93.4 | |
| T-wave | 87 | 37 | 97.2 | 73.5 | 49.2 | |
| 129 | P-wave | 97.7 | 0 | 97.7 | 0 | 0 |
| QRS-complex | 97.8 | 77.3 | 99.7 | 95.9 | 85.6 | |
| T-wave | 94.7 | 83.7 | 96.9 | 84.2 | 84 | |
| 173 | P-wave | 96.3 | 0 | 96.3 | 0 | 0 |
| QRS-complex | 97.9 | 88.1 | 99.4 | 95.6 | 91.7 | |
| T-wave | 93.4 | 73.4 | 98.7 | 93.9 | 82.4 | |
| AFL Records | Class | Accuracy | Sensitivity | Specificity | Precision | F1 |
|---|---|---|---|---|---|---|
| 35 | P-wave | 92.3 | 0 | 92.3 | 0 | 0 |
| QRS-complex | 95.1 | 83 | 98.9 | 96.1 | 89.1 | |
| T-wave | 80.7 | 36.2 | 99.8 | 98.8 | 53 | |
| 52 | P-wave | 96.9 | 0 | 96.9 | 0 | 0 |
| QRS-complex | 97.3 | 79.4 | 99.7 | 97.3 | 87.4 | |
| T-wave | 90.5 | 72.8 | 94.2 | 71.8 | 72.3 | |
| 103 | P-wave | 86.2 | 0 | 86.2 | 0 | 0 |
| QRS-complex | 96.9 | 91 | 97.9 | 87.8 | 89.4 | |
| T-wave | 85.6 | 49.6 | 95.1 | 72.6 | 58.9 |
| Authors | Method | Database | Accuracy (%) | |||
|---|---|---|---|---|---|---|
| ECG Denoising | ECG Delineation | P-Wave | QRS-Complex | T-Wave | ||
| Tutuko et al. [21] | DAE | BiLSTM | QTDB (normal sinus records only) | 99.81 | 99.86 | 99.35 |
| Chen et al. [40] | Regularized latent space (encoder–decoder) | ECGVEDNET | ICDIRS | - | 86.28 | 89.94 |
| Present study | iCOR | LUDB | 98 | 98.8 | 98 | |
| QTDB (normal and abnormal records) | 98.7 | 98.1 | 97 | |||
Disclaimer/Publisher’s Note: The statements, opinions and data contained in all publications are solely those of the individual author(s) and contributor(s) and not of MDPI and/or the editor(s). MDPI and/or the editor(s) disclaim responsibility for any injury to people or property resulting from any ideas, methods, instructions or products referred to in the content. |
© 2025 by the authors. Licensee MDPI, Basel, Switzerland. This article is an open access article distributed under the terms and conditions of the Creative Commons Attribution (CC BY) license (https://creativecommons.org/licenses/by/4.0/).
Share and Cite
Nurmaini, S.; Jatmiko, W.; Mandala, S.; Tutuko, B.; Erwin, E.; Tondas, A.E.; Darmawahyuni, A.; Firdaus, F.; Rachmatullah, M.N.; Sapitri, A.I.; et al. iCOR: End-to-End Electrocardiography Morphology Classification Combining Multi-Layer Filter and BiLSTM. Algorithms 2025, 18, 236. https://doi.org/10.3390/a18040236
Nurmaini S, Jatmiko W, Mandala S, Tutuko B, Erwin E, Tondas AE, Darmawahyuni A, Firdaus F, Rachmatullah MN, Sapitri AI, et al. iCOR: End-to-End Electrocardiography Morphology Classification Combining Multi-Layer Filter and BiLSTM. Algorithms. 2025; 18(4):236. https://doi.org/10.3390/a18040236
Chicago/Turabian StyleNurmaini, Siti, Wisnu Jatmiko, Satria Mandala, Bambang Tutuko, Erwin Erwin, Alexander Edo Tondas, Annisa Darmawahyuni, Firdaus Firdaus, Muhammad Naufal Rachmatullah, Ade Iriani Sapitri, and et al. 2025. "iCOR: End-to-End Electrocardiography Morphology Classification Combining Multi-Layer Filter and BiLSTM" Algorithms 18, no. 4: 236. https://doi.org/10.3390/a18040236
APA StyleNurmaini, S., Jatmiko, W., Mandala, S., Tutuko, B., Erwin, E., Tondas, A. E., Darmawahyuni, A., Firdaus, F., Rachmatullah, M. N., Sapitri, A. I., Islami, A., Arum, A. W., & Perwira, M. I. (2025). iCOR: End-to-End Electrocardiography Morphology Classification Combining Multi-Layer Filter and BiLSTM. Algorithms, 18(4), 236. https://doi.org/10.3390/a18040236