Abstract
Activity recognition and localization in outdoor environments involve identifying and tracking human movements using sensor data, computer vision, or deep learning techniques. This process is crucial for applications such as smart surveillance, autonomous systems, healthcare monitoring, and human–computer interaction. However, several challenges arise in outdoor settings, including varying lighting conditions, occlusions caused by obstacles, environmental noise, and the complexity of differentiating between similar activities. This study presents a hybrid deep learning approach that integrates human activity recognition and localization in outdoor environments using Wi-Fi signal data. The study focuses on applying the hybrid long short-term memory–bi-gated recurrent unit (LSTM-BIGRU) architecture, designed to enhance the accuracy of activity recognition and location estimation. Moreover, experiments were conducted using a real-world dataset collected with the PicoScene Wi-Fi sensing device, which captures both magnitude and phase information. The results demonstrated a significant improvement in accuracy for both activity recognition and localization tasks. To mitigate data scarcity, this study utilized the conditional tabular generative adversarial network (CTGAN) to generate synthetic channel state information (CSI) data. Additionally, carrier frequency offset (CFO) and cyclic shift delay (CSD) preprocessing techniques were implemented to mitigate phase fluctuations. The experiments were conducted in a line-of-sight (LoS) outdoor environment, where CSI data were collected using the PicoScene Wi-Fi sensor platform across four different activities at outdoor locations. Finally, a comparative analysis of the experimental results highlights the superior performance of the proposed hybrid LSTM-BIGRU model, achieving 99.81% and 98.93% accuracy for activity recognition and location prediction, respectively.
1. Introduction
The implementation of wireless sensing applications using Wi-Fi signals is both straightforward and cost-effective, leveraging the existing infrastructure designed for wireless communication [1]. Consequently, Wi-Fi signals have become extensively utilized for non-intrusive sensing applications in recent years. In modern Wi-Fi source devices, achieving high performance relies on integrating key technologies such as Multiple-Input Multiple-Output (MIMO) and Orthogonal Frequency Division Multiplexing (OFDM), which are essential for optimal functionality and efficiency [2]. MIMO-OFDM offers Channel State Information (CSI), indicating power attenuation and phase shift from transmitter to receiver at specific carrier frequencies. Beyond enhancing Wi-Fi network performance, CSI is valuable for Wi-Fi-based sensing applications, capturing signal travel through objects. These variations can be input into predefined models or machine learning algorithms for analysis [3]. This study used signal variations for simultaneous human activity recognition and localization.
Nowadays, commercial Wi-Fi devices have been demonstrated as the primary source of radio frequency signals [4], beyond transmitting information such as audio, video, voice, and data over the internet. Recently, Wi-Fi signal-incorporated devices have been pervasive in different urban outdoor environments. Through diligently investigating CSI from the radio spectrum, human activity recognition, gesture recognition, motion detection, fall detection, and breath monitoring become feasible [5]. In addition, some manufacturing practices have already started to provide Wi-Fi infrastructure-based outdoor localization services [6], which are widely used in various areas, including location-based and context-aware services. Meanwhile, human activity recognition is the most motivating research area in ubiquitous computing and human–computer interactions. Human activity recognition plays a crucial role in applications such as security surveillance, smart healthcare for the elderly, and smart city planning. Accurate localization enhances these applications by enabling real-time monitoring and automated decision making [7]. Different approaches have been conducted to human activity recognition techniques using computer vision, wearable sensor devices, and radars [8]. However, there are several limitations in deploying conventional techniques to sense human activities.
Computer vision-based sensing technologies have constraints related to operating in a certain range of line-of-sight (LoS) environments and being predisposed to obstacles, sensitive to lighting conditions, and prone to the problem of dead angles [9]. Moreover, the installation and maintenance costs of cameras are exorbitant, besides the privacy and security issues [10]. Similarly, wearable sensor-based techniques regularly require individuals to wear a particular device to monitor human activities. It is tiring to carry it, and it can be forgotten. Additionally, wearable devices needed for battery recharging were also seen as a major bottleneck for wearable device-based sensing technology [11]. On the other hand, in contrast to wearable devices, radar, and computer vision-based sensing techniques, Wi-Fi signal-based sensing is neither intrusive nor sensitive to lighting conditions. In addition, the usage of Wi-Fi signals turned out to be very promising for reasons such as its practical bandwidth, wide coverage, equitable transmitted power, and improved signal compared to short-range sensing technology [12].
Wi-Fi signal-based sensing techniques mainly utilize two different kinds of signals, CSI and received signal strength indication (RSSI) [13]. RSSI is the measurement of the average power of a received signal. It is also a coarse-grained radio channel measurement, and the performance of the RSSI-based system is affected by the signal quality. In an intricate environment, fluctuations in the signal quality arise because of multipath propagation [14]. Unlike RSSI, CSI is a fine-grained value and captures signal strength and phase information for orthogonal frequency-division multiplexing (OFDM) subcarriers between each pair of transmitter and receiver antennas. Moreover, CSI offers detailed information to capture the intelligent change in the signal quality between transmitter and receiver devices. Therefore, CSI-based Wi-Fi sensing has better performance [15]. CSI denotes the behavior of wireless signal propagation from the transmitter to the receiver at a particular carrier frequency along various multiple paths. It is a matrix of complex number values representing the amplitude attenuation and phase shifts triggered by path loss and multipath effects that occurred during scattering, diffraction, and distance attenuation [16]. Therefore, the time series characteristics of CSI can simultaneously recognize and localize a certain activity in a specific location.
Most existing studies focus on human activity recognition using Wi-Fi CSI in indoor settings, where multipath propagation enhances signal stability. However, outdoor environments introduce greater signal variability due to fewer reflections, making joint activity recognition and localization a more challenging and underexplored area. This study addresses this gap by developing a hybrid deep learning model that is optimized for outdoor scenarios. Hence, this study investigated joint tasks in an outdoor environment. The rationale for examining joint human activity recognition and localization is to enhance the performance in recognizing the individual’s action within their outdoor location. Localization requires substantial knowledge of the context in which the user is explicitly located [17]. Additionally, exploring joint tasks has revealed numerous beneficial human–computer interaction applications in outdoor environments. The joint task consisted of two main objectives as follows: identifying activities carried out at different locations and localizing individuals based on their activities. A significant challenge we encountered is the potential for data leakage in our study, particularly concerning the CSI of Wi-Fi signals.
Analyzing patterns in Wi-Fi signals, specifically the dynamics of CSI, allows us to differentiate between various activities and pinpoint their specific locations. However, collecting CSI data presents a significant challenge due to the associated costs of the required equipment. In this research paper, we utilize synthetic data as a strategic approach to reduce the need for actual measured CSI. By incorporating synthetic data into our study, we aim to address the challenges of relying solely on real-world CSI measurements. This approach helps us expand our dataset, offering a more comprehensive and cost-effective solution for analyzing Wi-Fi signal patterns and CSI dynamics in distinguishing between different activities and their locations. We propose a deep learning-based joint task to tackle the aforementioned issues by leveraging the advantageous properties of deep learning architectures. Therefore, the main contributions of this work can be summarized as follows:
- (1)
- A joint approach to human activity recognition and localization that utilizes Wi-Fi signal information and an LSTM-BIGRU network for enhanced accuracy.
- (2)
- The utilization of CTGAN to generate synthetic data and prevent CSI leakage.
- (3)
- The use of a real-world dataset obtained through the PicoScene Wi-Fi sensing device, which includes magnitude and phase information. The proposed approach enhances accuracy in activity detection and localization tasks by integrating both types of data.
The subsequent sections of the paper are structured as follows: Section 2 presents the literature on human activity recognition and localization using deep learning algorithms and identifies gaps in the research. Section 3 outlines the research methodology. Section 4 discusses the proposed system architecture. Section 5 and Section 6 discuss results and provide a discussion. Section 7 concludes the paper and suggests future research directions.
2. Literature Review
Human activity recognition and localization are crucial aspects facilitating human–computer interaction applications. They have many applications in security, surveillance, smart homes, daily activity monitoring, and fall detection for elderly people [18], and traditional approaches have used computer vision, wearable sensor-based, and smartphones. However, conventional methods, such as computer vision-based techniques, have defects in security and are exposed to environmental impacts like light occlusion and interference [19]. Likewise, sensor-based techniques usually require individuals to garb and attach smart sensors, which makes this process more tiresomeness [20]. On the other hand, Wi-Fi signal-based sensing has the ability to overcome the aforementioned challenges, since it does not require any wearable or attachable device for individuals. Additionally, Wi-Fi signal-based techniques provide various advantages due to their easy installation, low cost, and private security protection. Consequently, Wi-Fi signal-based devices are preferable for sensing human activities. Moreover, Wi-Fi technology exploits CSI and RSSI signals [21]; hence, it is susceptible to multipath interference and narrow-band interference, so it may cause very low recognition accuracy.
Contrasting RSSI, CSI provides amplitude attenuation and phase shift in multipath propagation at distinct frequencies. Therefore, CSI affords ampler and steadier frequency parameters for preeminent recognition and localization accuracy. CSI implies the variation in signals propagating from the transmitter to the receiver at a particular carrier frequency. Amplitude attenuation and phase shift may occur because of the impact of surrounding locations and nearby human motion. Therefore, CSI is used for Wi-Fi signal-based sensing. Several studies have explored Wi-Fi CSI for human activity recognition and localization, but they often focus on either indoor environments or treat these tasks independently rather than jointly. Below, we discuss key research in these domains and highlight existing gaps. For instance, Ref. [22] investigated joint tasks in an indoor environment by introducing amplitude attenuation. Similarly, Ref. [23] employed UWB for joint human activity recognition and localization in indoor locations. In contrast to indoor environments, there is inadequate multipath propagation in an outdoor environment. Hence, simultaneous activity recognition and localization tasks are challenging. This study examined simultaneous activity recognition and localization for a certain activity by employing CSI in an outdoor environment.
A limited number of research studies have been conducted in joint tasks in indoor locations. However, none has tackled the challenge of environmental factors on CSI variation and repeated tiresome data collection in outdoor environments. Moreover, the previous related works only coarsely recognize and localize humans, and the sensing outcomes commonly lack fine details because of insufficient CSI data. Naturally, Wi-Fi signals are sequential data, which are often collected from different access points over time. Therefore, a recurrent neural network (RNN) is the type of neural network broadly applied for time-sequential signals; its architecture is a combination of the input, output, and a hidden layer. Therefore, it is essential for CSI-based human activity recognition and localization, and several works have been conducted [24] to extract features and apply the long-short-term memory recurrent neural network over this network; several features in CSI signals can be effectively learned and extracted. However, if the size of the input is too large, which causes a large training time, it is time-consuming to train the RNN. This employs three deep learning networks together, including an auto-encoder, a convolutional neural network (CNN), and LSTM for human activity recognition [25]. It can sanitize annoying factors in the received raw CSI data. The performance of this technique is preferable to those in the abovementioned literature. However, this approach is prone to the phase shift in CSI caused by the timing offset between the Wi-Fi transmitter and receiver. Additionally, performance can be considerably degraded by a small mismatch in the phase domain of CSI. To handle this issue, a linear fitting method and phase calibration technique have been employed [26].
We applied a simple LSTM with one hidden layer and 128 hidden units for the CSI amplitude feature with a 52-dimensional vector. The proposed technique extracts features automatically without preprocessing, and then it can hold the temporal state information of the activity. Thus, it enhances the performance of the proposed approach. Other deep learning architectures, which include deep adversarial networks, deep reinforcement learning, and transfer learning, are also frequently used for CSI-based human activity recognition and localization. In addition to the above CNN- and RNN-based works in the literature [27], deep adversarial networks were used for cross-scenario human activity recognition in Ref. [28]. To accomplish this, the researchers designed a maximum–minimum adversarial method to correlate source features and target features. In addition, a center alignment approach was developed to further enhance the source domain’s feature quality, which is essential for performance improvement.
For the same purpose, Ref. [29] presented deep reinforcement learning-based human activity recognition. To do this, two issues, namely, the feature patterns of the received signals and the translation of the received data to the detection results, need to be jointly addressed. As a result, the authors combined two problems into one optimization problem and developed a deep reinforcement learning-based strategy to find the best solution by reducing the cross-entropy loss of the recognition results, thus enhancing recognition accuracy. However, most human activity recognition schemes are highly location-dependent and susceptible to environmental factors. To alleviate this issue, further research was conducted. For instance, Ref. [30] developed a human activity recognition scheme by utilizing transfer learning and a CNN to accomplish location-independent human activity recognition. The data distribution of the received signals and their properties were examined for feature extraction. Then, by transferring features from the source environments to the testing location, transfer learning and CNN were implemented to successfully learn discriminatory features. As a result, the proposed schemes achieved a preferable sensing performance. All the above deep learning schemes are mainly employed in human activity recognition. On the other hand, the above deep learning networks have also been also used in CSI-based localization.
Generally, the major limitation of existing works on simultaneous deep learning-based human activity recognition and localization using Wi-Fi signals is the limited dataset. Many of these works have been conducted on small and limited datasets, which may not represent real-world scenarios. As a result, overfitting the model and reduced generalization capabilities may be the result. However, there are several research studies that endeavored to address the challenges posed by the limited dataset of CSI through innovative techniques, with a notable emphasis on generative adversarial networks (GAN)-based approaches. These methodologies aim to overcome the scarcity of real-world CSI data by generating synthetic samples that closely resemble the underlying patterns and dynamics of authentic CSI observations. GAN-based strategies consist of a generator and a discriminator. The generator generates synthetic CSI samples, attempting to mimic the characteristics of the original data, while the discriminator evaluates the authenticity of these synthetic samples. Through an adversarial training process, the generator refines its output to be increasingly indistinguishable from real CSI data. This synthetic data generation process enables the expansion of the dataset, introducing additional instances that capture the diversity of CSI patterns. By effectively mitigating data scarcity, GAN-based techniques contribute to the robustness and generalization capabilities of models trained on CSI datasets.
To be more specific, the authors in [31] address the challenge of performance degradation in leave-one-subject-out validation for activity recognition based on CSI. They introduced a GAN-based framework called CsiGAN and conducted experiments on the following two distinct CSI datasets: SignFi data, which encompasses CSI traces related to sign language gestures, and FallDefi data, comprising CSI traces capturing various human activities like falling, walking, jumping, picking up, sitting down, and standing up. The authors propose a novel generator within the CsiGAN framework to generate synthetic samples, enhancing the discriminator’s performance. They achieve this by increasing the number of probability outputs from K + 1 to 2K + 1, where K denotes the number of classes, effectively correcting the decision boundary for each category. Additionally, they introduced manifold regularization to stabilize the learning process. It is noteworthy that their approach is rooted in CycleGAN [31], whereas our work utilized a conditional tabular GAN, representing a fundamental distinction. Our proposed methodology focuses on leveraging GANs to generate synthetic data, aiming to attain comparable accuracy with a reduced number of overall samples. This reduction in sample size leads to significant time and cost savings, distinguishing our approach from the cycle GAN-based method introduced by the authors [32]. Another limitation is the lack of diversity in activities.
Most of the existing works focus on a limited set of activities such as walking, running, and sitting, which limits the scope of the model for real-world applications where a diverse range of activities can be performed. Additionally, the accuracy of the model heavily depends on the environment in which it was trained, which can result in reduced performance when deployed in a different environment due to variations in the signal characteristics. Furthermore, some existing models have high computational complexity, making them unsuitable for real-time applications. Finally, some models are designed to work only in specific scenarios, such as indoor environments or with specific types of devices, limiting their applicability in other scenarios.
Moreover, Ref. [33] presents a WSN-based fingerprinting localization system for indoor environments, leveraging a low-cost sensor architecture and four tailored machine learning models. The system was validated through real experiments in complex indoor settings, demonstrating an average localization accuracy of 1.4 m. Additionally, the study analyzes the impact of reference point density on localization accuracy, highlighting the effectiveness of machine learning in enhancing WSN-based localization. Moreover, the study in [34], presents a SLAM-based localization and navigation system for social robots, specifically using the Pepper robot platform, to enhance autonomous indoor navigation in dynamic environments. The system is designed to enable efficient path planning while interacting with humans in complex indoor spaces. Validated using the robot operating system (ROS) in two different settings, the system demonstrated an average localization error of 0.51 m and an 86.1% user acceptability rate, highlighting its effectiveness in real-world applications.
On the other hand, to overcome the previously mentioned challenges. We proposed a solution to overcome the constraints of existing Wi-Fi CSI-based sensing for simultaneous human activity recognition and outdoor localization by generating synthetic data and using a variety of CSI features. Moreover, we proposed a hybrid neural network to develop a more efficient model. By employing a GAN, we can synthetically generate additional data to augment the original raw CSI dataset. This approach addresses limitations associated with the scarcity and costliness of real measured CSI data acquisition. The generated synthetic data captures the intricate patterns and dynamics present in the CSI, facilitating a more comprehensive representation of various activities.
The synthetic data are seamlessly integrated into the original CSI dataset, forming an augmented dataset with an increased volume of samples. This fused dataset is then utilized to train a hybrid neural network, combining features related to simultaneous human activity recognition and localization. The integration of synthetic data enriches the dataset, providing a broader spectrum of scenarios and variations for the neural network to learn from. A hybrid neural network leverages combined information from real and synthetic datasets, enhancing its ability to accurately perform joint human activity recognition and outdoor localization tasks. This approach contributes to overcoming data scarcity challenges, ultimately leading to improved accuracy and robustness in the model’s predictions for diverse scenarios in outdoor environments. As shown in Table 1, studies in this field are constrained by several limitations, including insufficient dataset availability, a lack of fine-grained CSI values, and restricted experimentation. Furthermore, these investigations face challenges related to the variation in phase in CSI. To address these issues and enhance the accuracy of joint human activity recognition and localization tasks, our approach involves leveraging the CTGAN algorithm to generate synthetic data. Additionally, we employ various preprocessing techniques to alleviate the impact of phase variations in the receiver, thereby overcoming the aforementioned challenges.

Table 1.
Summary of related work on joint activity recognition and indoor localization.
3. Research Methodology
Training Process of the CTGAN
The CTGAN synthesizer class from the synthetic data vault (SDV) library enables the generation of high-quality synthetic data. The process begins by initializing the synthesizer, where an instance of the CTGAN synthesizer is created with carefully selected parameters. These parameters significantly influence the training process, including key aspects such as batch size, learning rate, and the architecture of both the generator and discriminator networks. To improve the synthesizer’s ability to capture the complexities of the dataset, it is essential to provide metadata that accurately describes the structural relationships within the original data. This metadata acts as a guide, ensuring that the synthetic data closely mimic the underlying patterns and constraints of the source dataset.
The training phase involves exposing the CTGAN model to the provided dataset for a specified number of epochs. Throughout this process, the training progress is systematically logged, and the synthesizer may utilize a proportional-integral (PI) or proportional-integral-derivative (PID) controller to ensure convergence, refining the model’s generative capabilities effectively. A critical aspect of this phase is fine-tuning the generator and discriminator networks, which involves configuring key parameters such as network dimensions, learning rates, and weight decay to optimize their performance. The CTGAN algorithm determines loss values using a predefined formula, further detailed in the corresponding discussion. The fundamental objective is to minimize the discrepancy between the generated synthetic data and the original dataset. This difference is quantified using a loss function, which evaluates how well the synthetic samples align with the statistical properties and patterns of the real data. By iteratively minimizing this loss throughout training, CTGAN strives to generate synthetic data that accurately captures the distribution and characteristics of the original dataset.
As indicated in Table 2, achieving lower loss values, including negative values, signifies effective performance by the neural networks. To monitor training progress, we visualize the loss values across epochs, with the results presented in the accompanying graph. Additionally, Table 3 outlines the hyperparameter values used for the CTGAN. As shown in Figure 1, we configured four different training parameters to train our CTGAN model for data synthesis. Our experiments with different settings yielded the following results: As shown in Figure 1a, the model was trained for 100 epochs, but the generator loss did not achieve negativity, indicating instability. Additionally, generator loss fluctuated, and the discriminator failed to converge to zero, leading to poor-quality synthetic data. The discriminator exhibited erratic behavior, struggling to differentiate between real and synthetic data, often making arbitrary guesses. This instability in both components resulted in suboptimal performance in data generation. Figure 1a–d are shown the impact of epoch 100, 200, 800 and 500 respectively. As shown in Figure 1b, the model was trained for 200 epochs, leading to slight improvements in both generator and discriminator loss values compared to (a). The extended training period contributed to more stable losses, though the generator loss still did not reach negativity. The discriminator showed better stability around zero, but challenges persisted. While this extended training duration demonstrated some progress, it did not fully resolve the issues observed in (a), emphasizing the need for further optimization.

Table 2.
Loss function interpretation of the CTGAN.

Table 3.
Hyperparameters to train the CTGAN.
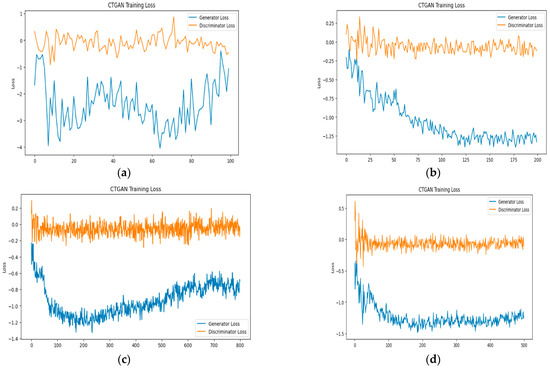
Figure 1.
Interpreting the progress of the loss function in the CTGAN.
In the cases of curves c and d, their discriminator losses converge to zero, signifying that the discriminator becomes highly efficient in distinguishing between real and synthetic data. Moreover, both generator losses converge to stabilized negative values, indicating the successful optimization of the generator’s ability to produce realistic synthetic data. However, a notable distinction arises when examining curve c. After 500 epochs, the generator loss in curve c experiences a shift, changing its value and becoming positive.
Despite the initial stabilization, this alteration implies a potential fluctuation in the generator’s performance, introducing uncertainty in the quality of the generated synthetic data. On the other hand, curve d, trained for 500 epochs, maintains a stabilized negative value for its generator loss. Simultaneously, the discriminator loss remains at zero, displaying a scenario where the generator has undergone optimal training. The synthetic data produced by the generator closely resembles the real data to the extent that the discriminator cannot effectively differentiate between the two. This achievement implies a high level of realism in the generated data, suggesting the model underwent successful and advanced training. Therefore, in this study, the CTGAN was applied with the parameters mentioned below, yielding promising results according to graph d.
The reason the hybrid LSTM-BIGRU outperforms CNN-ResNet, 1D-CNN, LSTM, and GRU is because it combines LSTM with an efficient BIGRU, making it well suited for complex sequential data tasks such as human activity recognition. Moreover, LSTM and the GRU handle sequential data better, but they process information in one direction. The BIGRU enhances this by capturing both past and future dependencies, improving contextual learning. Then, the LSTM-BIGRU combines the strengths of LSTM (handling long-term dependencies) and the BIGRU (efficient bidirectional processing), leading to improved accuracy. Bidirectional processing improves feature learning as traditional LSTM and GRU process information in a single direction (either forward or backward). The BIGRU processes input sequences in both forward and backward directions, providing richer feature representations. This bidirectional mechanism helps the model understand context more effectively, leading to better classification performance. In terms of computational efficiency and memory optimization, compared to pure LSTM, the GRU is computationally lighter due to its simplified gating mechanism. BIGRU uses fewer parameters than LSTM while maintaining similar performance, leading to faster training and lower memory usage. The LSTM-BIGRU hybrid takes advantage of LSTM’s and the BIGRU’s efficiency, striking a balance between accuracy and computational cost.
4. Proposed System Architecture
As shown in Figure 2, the proposed system architecture is divided into four phases, as follows: Phase I: Data collection from Wi-Fi signals, considering the transmitter (Tx) and receiver (Rx) with the activity, leading to the generation of raw CSI data. Phase II: Data splitting for training and testing, incorporating the fusion of synthetic and original data. Phase III: Real model training and testing, including comparisons between baseline and hybrid models. Phase IV: Training and classification, utilizing ReLU as the activation function, with both activity and location being identified.
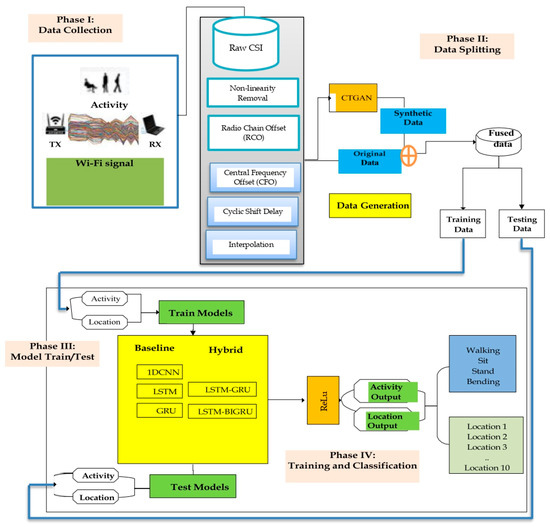
Figure 2.
Proposed system architecture.
The details of the proposed flowchart are narrated as follows: PicoScene is a Wi-Fi sensing platform that provides high quality and synchronized CSI data from Wi-Fi devices. PicoScene is designed to collect and process large-scale Wi-Fi CSI datasets for various research purposes, such as human activity recognition, localization, and wireless communication system optimization. Additionally, when compared to other existing tools like the Linux CSI tool and Atheros CSI tool, PicoScene has several advantages. Firstly, it supports a wide range of Wi-Fi chipsets and provides a higher sampling rate (up to 40 MHz) and higher resolution (up to 14 bits). This leads to more accurate and detailed CSI measurements. Additionally, PicoScene provides an easy-to-use and customizable software interface for data collection and processing, which can be adapted to different research scenarios. Lastly, PicoScene offers a powerful and flexible platform for Wi-Fi sensing and provides significant advantages over other tools for collecting Wi-Fi CSI data [39].
Due to the above reasons, we have used the PicoScene Wi-Fi sensing platform to collect CSI data for our joint human activity recognition and localization work. We implement the IEEE 802.11n protocol with a TP-Link Archer C1200 AC1200 wireless dual band gigabit router as a transmitter and used a Toshiba portage R930 laptop equipped with an intel® Wi-Fi Link 5300 AGN network interface card (NIC) as the receiver device [40]. In our work, we selected four activities as follows: walking, standing, sitting, and bending. As shown in Figure 3, the aforementioned activities were carried out across 10 distinct LoS locations between the transmitter and receiver devices with the same pattern. After collecting Wi-Fi CSI data, CSI data provides information about the signal’s amplitude and phase, which can be used for human activity recognition and localization.

Figure 3.
Working environment in Bahir Dar University Institute of Technology campus and the types of activities conducted in this study.
The amplitude and phase information of the CSI can be used to extract features, which can be used to distinguish between different human activities. It is important to note that the CSI matrix only contains raw information and thus is not directly applicable to human activity recognition. This is because it includes a lot of irrelevant information that can reduce the quality of the features extracted. Utilizing the CSI matrix to directly detect human activities can be time-consuming and increase system overhead due to its large size. To overcome these challenges, several techniques, such as nonlinear amplitude and phase removal, background reduction, correlation, filtering, and other preprocessing techniques, were used to produce accurate CSI data. Since Wi-Fi sensing passively captures movement data, privacy considerations are critical. This study ensured the compliance with ethical guidelines by obtaining participant consent and anonymizing CSI data before processing. Additionally, no personally identifiable information was collected, and all data were securely stored to prevent unauthorized access.
In addition to extracting phase and amplitude from the CSI data, we implemented different pre-processing techniques to enhance data quality. One of the key steps in handling outliers was the Nonlinear Amplitude and Phase Removal method, which addresses hardware-induced distortions in CSI measurements. These distortions introduce nonlinear variations in amplitude and phase, leading to inconsistencies. To mitigate these distortions, we followed a structured process. First, we conducted baseline data collection by capturing a reference dataset using a coaxial cable connection. This setup eliminated environmental multipath effects, allowing us to establish a baseline for identifying systematic nonlinear distortions introduced by the hardware.
Next, we performed error template extraction by analyzing deviations from the expected flat amplitude response and linear phase progression. From this analysis, we derived nonlinear amplitude and phase variations, which were stored as an error template representing hardware-specific biases in CSI measurements. Finally, during real-time correction, we refined the collected CSI data by dividing the measured amplitude values by the stored nonlinear amplitude template and subtracting the extracted nonlinear phase distortions from the raw phase values. This process effectively removed systematic hardware-induced errors, ensuring that the refined CSI data accurately represented the true signal characteristics. By implementing this pre-processing step, we mitigated extreme deviations in phase and amplitude that could otherwise be considered outliers. Additionally, we employed interpolation techniques to handle missing data, further enhancing the consistency and reliability of the processed CSI measurements. In our study, we implemented several pre-processing techniques to ensure the accuracy and consistency of the CSI data by verifying normalization.
One of the primary methods we used was the Nonlinear Amplitude and Phase Removal technique by comparing the processed CSI amplitude-frequency and phase-frequency characteristics with an ideal flat and linear response, respectively. The effectiveness of this normalization was confirmed by observing a significant reduction in systematic distortions errors, ensuring that the refined CSI data maintained its true physical characteristics of both amplitude and phase value. Additionally, we employed radio chain offset (RCO) correction to address phase inconsistencies among transceiver antenna pairs. RCO arises due to random phase fluctuations that occur when the network interface card (NIC) is powered on, introducing biases in CSI phase measurements. Since RCO remains stable over consecutive packets, we developed a method to mitigate its effects by subtracting the phase values obtained during subsequent measurements from the initial phase reference. This technique successfully reduced the impact of phase distortions, leading to more stable and uniform CSI phase data. By applying this correction, we ensured that phase values were normalized across different packets, improving the accuracy of angle-of-arrival (AoA) and time-of-flight (ToF) estimations.
To further enhance the reliability of CSI data, we implemented central frequency offset (CFO) correction to account for frequency desynchronization between the transmitter and receiver. CFO introduces an unwanted frequency shift in CSI measurements, affecting both amplitude and phase characteristics. To counteract this, we incorporated multiple high throughput-long training fields (HT-LTFs) within Wi-Fi frames, allowing us to analyze the phase differences induced by CFO over a fixed time interval (Δt = 4 μs, as per the 802.11 standard). This approach enabled us to estimate and compensate for CFO, effectively aligning the frequency characteristics across all subcarriers. By applying this correction, we eliminated frequency-dependent distortions, ensuring that CSI data remained accurate and consistent. Together, these normalization techniques significantly improved the quality of the CSI data, making it more robust for subsequent signal processing tasks such as localization and human activity recognition.
5. Implementation and Evaluation
5.1. Experimental Setup
To implement the proposed LSTM-BIGRU-based activity recognition and localization. One computer equipped with an Intel Wi-Fi 5300 NIC is used as the receiver, an IEEE 802.11n protocol-based TP-Link Archer C1200 AC1200 Wireless Dual Band Gigabit Router as the transmitter, and a Toshiba portage R930 laptop as the receiver. The transmitter sends packets continuously at the 2.5 GHz frequency band using its three antennae (Nt = 3) following the protocol of IEEE 802.11n. The receiver, which uses the PicoScene Wi-Fi sensing platform tool, collects and stores CSI for 10–80 subcarriers for each packet according to specific activities with its two antennas (Nr = 2). Additionally, the PicoScene platform was used to collect the Wi-Fi signal data, which was then preprocessed to extract CSI features. These features were used as input in our proposed hybrid neural network model for activity recognition and localization.
Overall, Figure 3 shows that the experimental setup for this study involved collecting Wi-Fi signal data using the PicoScene Wi-Fi sensing platform tool at 10 different locations and four different activities—standing, sitting, bending, and walking. The collected data were then preprocessed and used to train and evaluate a hybrid neural network for activity recognition and localization. As shown in Figure 3, we undertake a series of experiments aimed at substantiating the correlation between the amplitude of CSI and phase information. Volunteers are engaged in the task of pushing a sleek plate across the designated link, with varying speeds ranging from slow to fast. Through systematic experimentation, we seek to establish a clear connection between the observed CSI and the diverse phase value at which the participants move the target.
5.2. Data Collection
PicoScene is a Wi-Fi sensing platform that provides high-quality and synchronized channel state information data from Wi-Fi devices. PicoScene is designed to collect and process large-scale Wi-Fi CSI datasets for various research purposes such as human activity recognition, localization, and wireless communication system optimization. Additionally, when compared to other existing tools like the Linux CSI Tool and Atheros CSI Tool, PicoScene has several advantages. Firstly, it supports a wide range of Wi-Fi chipsets and provides a higher sampling rate (up to 40 MHz) and higher resolution (up to 14 bits). This leads to more accurate and detailed CSI measurements. Additionally, PicoScene provides an easy-to-use and customizable software interface for data collection and processing, which can be adapted to different research scenarios. Lastly, PicoScene offers a powerful and flexible platform for Wi-Fi sensing and provides significant advantages over other tools for collecting Wi-Fi CSI data.
After collecting Wi-Fi CSI data, CSI data provide information about the signal’s amplitude and phase, which can be used for human activity recognition and localization. The amplitude and phase information of the CSI can be used to extract features, which can be used to distinguish between different human activities. For instance, Figure 4 shows that the amplitude and phase of the CSI can be used to detect the reflection of the signal from a human body to represent the sitting activity in location 4 performed by one volunteer. The reflected signal’s characteristics vary depending on the human’s body shape, size, and motion, which can be used to distinguish between different activities. Additionally, the phase information can be used to estimate the distance and direction of the human body from the Wi-Fi access point, which can be used for localization. To use amplitude and phase information for human activity recognition and localization, CSI data are first collected and preprocessed. Then, features are extracted using signal processing and deep learning techniques. Finally, the extracted features are used to train a deep learning model for activity recognition and localization.
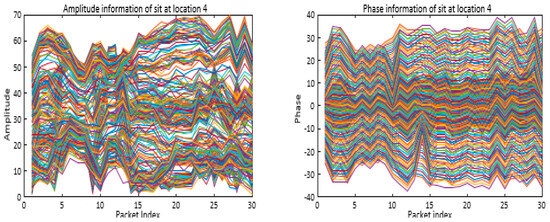
Figure 4.
CSI amplitude and phase information for the sitting activity in location 4.
Additionally, we visualize variations in the signals to represent different activities in the same locations. For instance, changes in signal strength, phase, and frequency can be used to differentiate between different activities or movements in the same location. Figure 5 demonstrates four different activities, including bending, sitting, standing, and walking, performed in the same location, carried out by plotting the amplitude values of the Wi-Fi signal over time. Each activity has a unique signal variation pattern that can be visualized as a waveform. For example, when a person is walking, there is periodic variation in the amplitude values of the Wi-Fi signal that can be observed in the waveform shown in Figure 5, upper right corner. Similarly, when a person is bending, there is a distinctive pattern of signal variation that can be visualized in the waveform, as shown in Figure 5, upper left corner. By analyzing the unique signal variation patterns of each activity, deep learning algorithms can be trained to recognize and classify different activities performed in the same location using Wi-Fi signals.
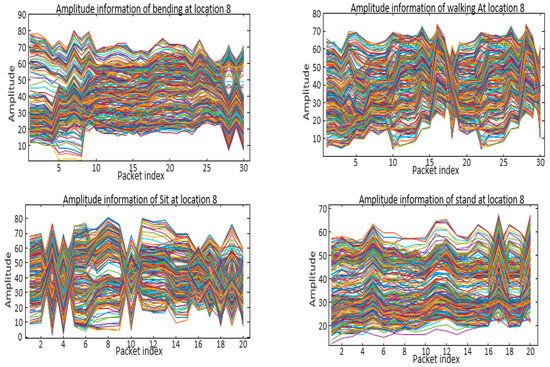
Figure 5.
CSI amplitude sample of different activities in the same location.
Similarly, Figure 6 visualizes variations in the signals to represent different activities in the same locations by plotting the phase values of the Wi-Fi signal over time. Each activity has a unique pattern of signal variation that can be visualized as a waveform. For example, when a person is sitting, there is periodic variation in the phase values of the Wi-Fi signal, which can be observed in the waveform shown in the bottom left corner.
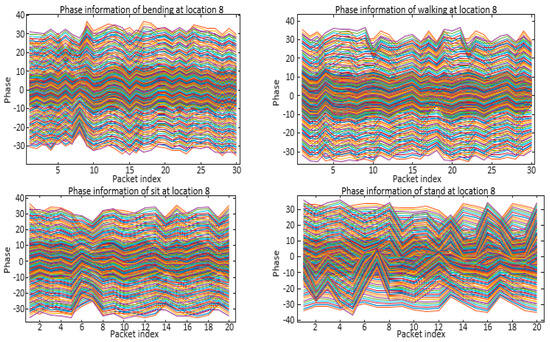
Figure 6.
CSI phase sample activities in the same location.
Moreover, when a person is standing, there is a distinctive signal variation pattern that can be visualized in the waveform, as shown in the bottom right corner. After analyzing the unique patterns of signal variation for each activity, deep learning algorithms can be trained to recognize and classify different activities performed in the same location using Wi-Fi signals. Additionally, Figure 7 shows that the variation in a signal for the same activity in different locations can be described by analyzing the features of the signal. Different factors, such as distance, obstructions, and interference, can affect the signal and cause variations in the features.
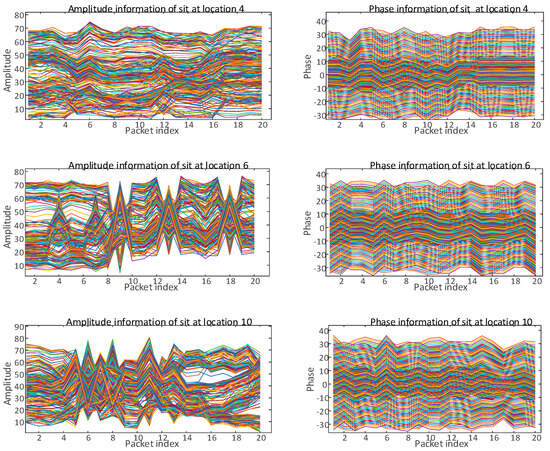
Figure 7.
CSI amplitude and phase sample of the same activity in different locations.
These variations can be observed through changes in the amplitude, phase, and frequency components of the signal. By analyzing and comparing these features across different locations, we can identify the differences and similarities in the signal patterns and use them to identify the activity and location. Additionally, our proposed system can be trained on these features to improve the accuracy of the recognition and localization process.
5.3. Dataset Preparation
In our experiment, we utilized the PicoScene Wi-Fi sensing platform to gather CSI data. One volunteer performed four different activities—walking, sitting, standing, and bending—as shown in Figure 3, at each of the 10 locations. For every designated activity, we precisely gathered a dataset comprising 10 to 80 CSI subcarriers. This particular data collection was conducted with distinct activity durations and varying motion patterns, executed by the volunteers in a predefined location.
As a result, we collected 3219 rows of subcarrier data in our 20 MHz bandwidth for the transmitter experiment setup and 4219 rows of subcarrier data in the 40 MHZ bandwidth of the transmitter in another experiment setup. As shown in Table 4, several sample packets and valid subcarrier segments were placed according to their respective activity and location index. For the systematic investigation of CSI samples, each activity was consistently carried out by four different volunteers across 10 distinct locations. This standardized approach ensured a balanced representation, with 40 packet samples (4 volunteers × 10 locations) dedicated to each activity. Within this framework, the segmentation of the subcarriers varied based on the duration of each activity, the unique motion patterns exhibited by volunteers, and the specific packet samples released from a transmitter. For illustrative purposes, as shown in Table 4, consider the example of a walking activity performed at Location 1. The CSI sample for this instance comprises 18 segments. Notable, the unique designation of MST1 encapsulates the following key information: ‘M’, ‘ST’ represents the specific activity (Stand), and ‘1’ signifies the particular location. This CSI sample is distinct from others, as it performed the same walking activity in the same location—Location 4. Despite the similarity in activity and location labels (ST1), the CSI segment for 20 segments differs due to the inherent variations in human motion. This emphasizes that even when the activity and location are identical, the CSI subcarrier segments captured from different volunteers have different values, reflecting the individualized nature of each volunteer’s motion and location orientation. The real part of the complex number (28) represents the magnitude or strength of the received signal, providing information about the amount of the transmitted signal reaching the destination.

Table 4.
Data distribution of activities conducted in a certain location.
The imaginary part of the complex number (6I) conveys the phase information. It indicates the shift in the phase of the received signal concerning the transmitted signal. This phase information is crucial for understanding the alignment and timing of the received signal. In essence, this CSI sample reflects the unique characteristics of the wireless channel during the standing activity conducted at Location 1. The real and imaginary components collectively capture the amplitude and phase information, offering a comprehensive snapshot of the channel’s state during this specific instance.
Moreover, Figure 8 describes the variation in signals in the same location and activity but performed by different volunteers. Figure 9 illustrates the fluctuation of signals within the same location and activity, although executed by different volunteers. The graph visually depicts how signals vary under identical circumstances, emphasizing the influence of individual volunteers on the observed signal dynamics. This comparison serves to underscore the personalized nature of signal responses, even when the location and activity remain constant. The graph provides a valuable visual representation of the diversity in signal characteristics attributed to the unique patterns and orientation of distinct volunteers engaging in the same task within the same location. Therefore, Figure 9 shows the dataset distribution, but this is not enough to construct a more efficient and accurate model. Consequently, we implemented the CTGAN to synthesize new data from the original raw data.
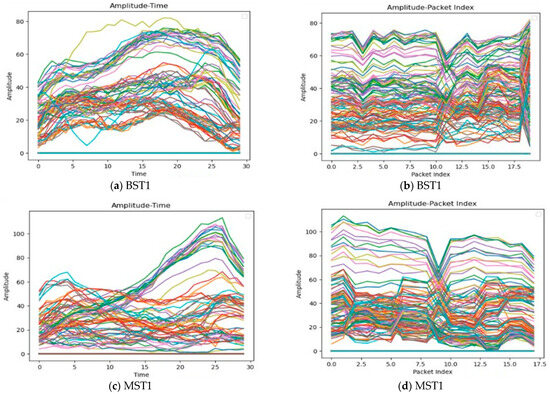
Figure 8.
Signal variation at the same location.
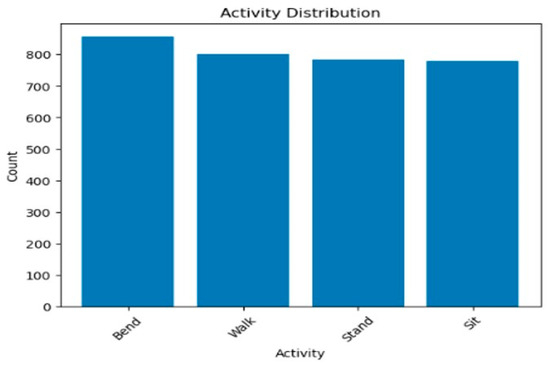
Figure 9.
Activity distribution of the experiment in the 20 MHz bandwidth.
5.4. Evaluation Metrics
For this study, evaluation metrics have been used to measure the performance of our models, including the confusion matrix, accuracy, precision, recall, and F1 scores.
- ▪
- Accuracy: Accuracy measures the overall correctness of the model by calculating the ratio of correctly predicted instances (both true positives and true negatives) to the total number of predictions.where TP (true positive): the model correctly predicted the positive class; TN (true negative): the model correctly predicted the negative class; FP (false positive): the model incorrectly predicted the positive class; and FN (false negative): the model incorrectly predicted the negative class.
- ▪
- Precision: Precision measures the accuracy of the positive predictions. It indicates how many of the predicted positive results were correct. High precision means that when the model predicts a positive class, it is usually correct.
- ▪
- Recall: Recall measures the ability of the model to identify all relevant instances (positives). It indicates how many actual positive cases were correctly predicted. High recall means the model captures most of the actual positives.
- ▪
- F1 Score: The F1 score is the harmonic mean of the precision and recall. It provides a single metric that balances both precision and recall, especially useful when the class distribution is imbalanced. A high F1 score indicates a good balance between precision and recall.
5.5. Experimental Results
Before implementing and evaluating each RNN model, we employed a grid search approach to determine the optimal set of hyperparameters. This involved systematically exploring various combinations of hyperparameter values, such as hidden size and the number of layers for each RNN architecture—LSTM GRU and LSTM-BIGRU. The goal was to identify the parameter configuration that yielded the highest average accuracy across all models.
The grid search allowed us to efficiently navigate the hyperparameter space and discover the most effective model settings for our specific dataset and task. We have used [32,34] hidden size and [1,2] number of layers as the search space to find the optimal hyperparameters. The outcomes of the grid search suggested training the RNN models with distinct hyperparameters, such as the hidden size and the number of layers, with the other parameters outlined in Table 5. As shown in Figure 10, we employed a hybrid deep learning model incorporating LSTM and GRU layers for simultaneous activity recognition and localization. The model architecture consists of the following: an input layer with 240 features, a bidirectional LSTM layer to effectively capture temporal dependencies, a bidirectional GRU layer to further enhance the model’s ability to learn complex patterns, fully connected layers with ReLU activation, and separate branches for activity and location predictions. We trained the model using the Adam optimizer with a learning rate of 0.0001. The training loop was executed over 60 epochs, with the cross-entropy loss function applied to both the activity and location predictions. At 20 MHz, the LSTM-GRU model demonstrated satisfactory training and test accuracy, indicating its ability to learn and generalize well on the given dataset. However, a notable concern was observed in the learning curve, where the loss function showed signs of divergence.

Table 5.
Hyperparameters.
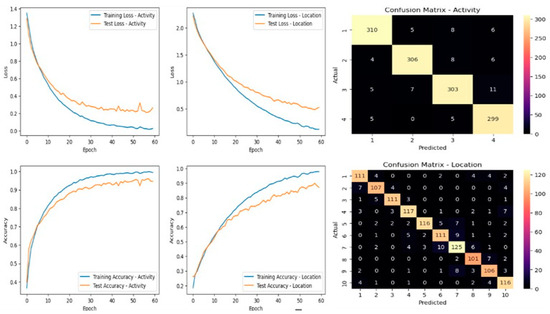
Figure 10.
Learning curve and confusion matrix of the LSTM-GRU model at 20 MHz.
Divergence in the learning curve suggests that the model struggles to converge to an optimal solution during training. This issue is characterized by an increasing trend in the training loss, indicating that the model’s parameter updates are not effectively minimizing the loss function. Addressing this challenge may require further hyperparameter tuning, regularization techniques, or adjustments to the network architecture to improve stability and convergence. On the other hand, the LSTM-GRU model at 40 MHz showcased in Figure 11 shows a more favorable learning curve. The loss curve demonstrates a smoother descent, suggesting that the optimization process is more stable and effective. This smoother learning curve implies that the model at 40 MHz is converging efficiently during training, which is crucial for achieving optimal performance. We investigated the LSTM-BIGRU hybrid neural network model for our simultaneous activity prediction and location estimation. It leverages a combination of LSTM and bidirectional GRU layers to capture temporal dependencies in the data.
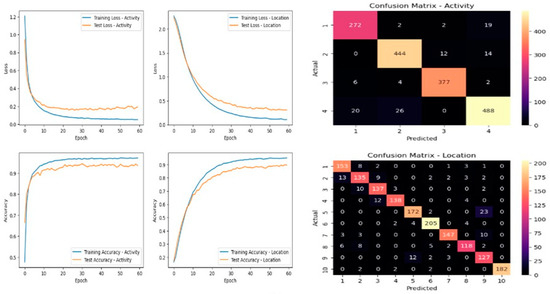
Figure 11.
Learning curve and confusion matrix of the LSTM-GRU at 40 MHz.
The LSTM layer extracts sequential features, and its bidirectional nature enhances the model’s understanding of both past and future contexts. The subsequent bidirectional GRU layer further refines the temporal representations. The fully connected layers transform the extracted features to predict activities and locations concurrently. The model’s architecture enables it to make predictions based on the entire input sequence, with the final output representing the joint predictions for activity and location at the last time step. The ReLU activation function is applied to enhance nonlinearity in the learned features. This integrated approach aims to provide a comprehensive solution for joint activity recognition and location estimation tasks from sequential CSI data.
The data visualizations in Figure 12 and Figure 13 illustrate the comprehensive training progression of the LSTM-BIGRU model concerning our concurrent task in a 20 MHz bandwidth. The activity loss curve exhibits a consistent descent throughout most epochs; however, a notable deviation occurs around epoch 55. This divergence raises concerns about potential challenges in the model’s generalization capabilities. However, the model achieved better accuracy compared to other models.
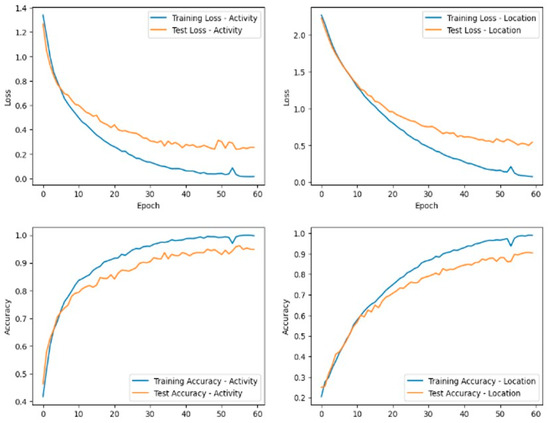
Figure 12.
Learning curve of the LSTM-BIGRU at 20 MHZ.
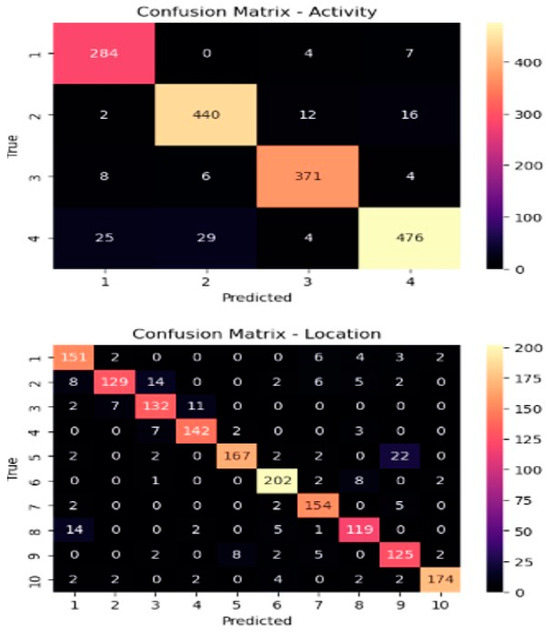
Figure 13.
Confusion matrix of the LSTM-BIGRU at 20 MHZ.
Upon comparing the models, ranging from simple architectures to hybrid designs, for the joint prediction of activity and location, several key observations can be made. Among these models, LSTM-BIGRU demonstrated the best performance for simultaneous activity recognition and localization, as illustrated in Figure 14 and Figure 15. As shown in Table 6 and Table 7, the RNN models achieved higher accuracy across both 20 MHz and 40 MHz bandwidths. The impact of the bandwidth on model performance is further highlighted in the provided accuracy tables. Figure 16 presents a comparative analysis of the results at 40 MHz and 20 MHz, revealing distinct performance trends across different models. Table 6 demonstrates that our proposed LSTM-BIGRU model outperforms the LSTM-GRU architecture in joint activity and location prediction tasks. While both LSTM and GRU models achieve good accuracy, LSTM generally performs better than the GRU. However, the LSTM-GRU and LSTM-BIGRU hybrid models exhibit significant improvements, achieving high accuracy in both training and testing for activity and location prediction.
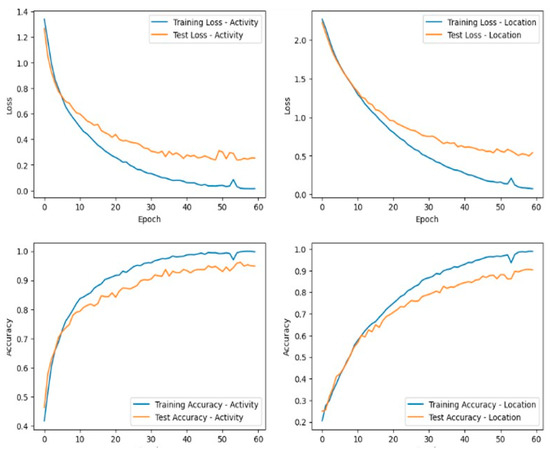
Figure 14.
Learning curve of the LSTM-BIGRU at 40 MHZ.
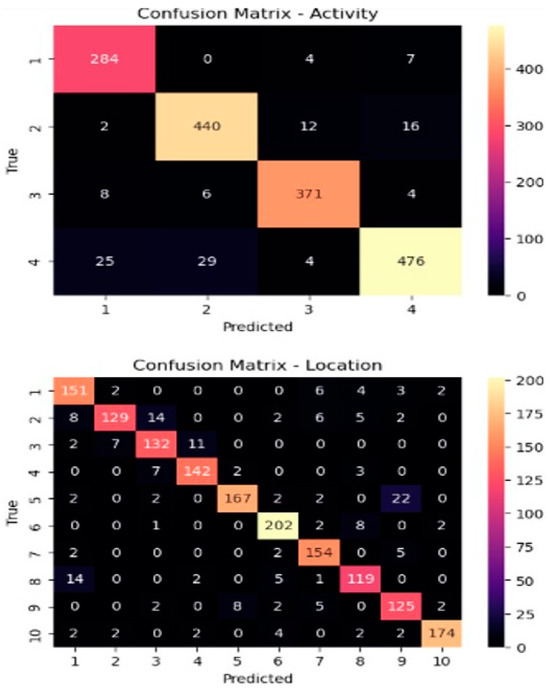
Figure 15.
Confusion matrix of the LSTM-BIGRU at 40 MHZ.

Table 6.
Model comparison in the 20 MHz bandwidth.

Table 7.
Model comparison in the 40 MHz bandwidth.
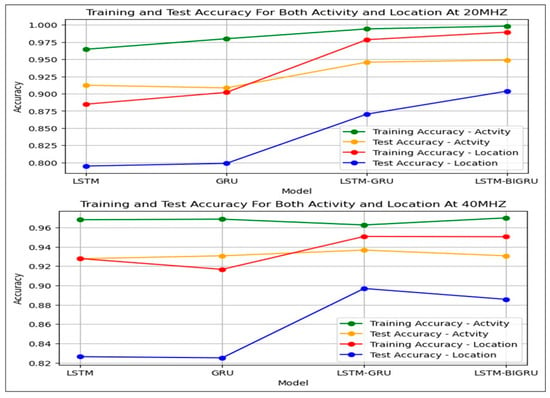
Figure 16.
Comparison of the training and testing accuracy of different models.
Additionally, Figure 15 further confirms that our proposed hybrid architectures enhance the model’s ability to capture intricate patterns in CSI data. Notably, location prediction accuracy is generally lower than activity prediction accuracy, suggesting that location estimation might be a more complex task or require further optimization.
For activity prediction, the LSTM model demonstrates slightly higher accuracy at 40 MHz (96.80%) compared to 20 MHz (96.45%) during training, with comparable testing accuracy (92.77% at 40 MHz vs. 91.23% at 20 MHz). However, for location prediction, there is a noticeable decrease in accuracy when transitioning from 40 MHz to 20 MHz; training accuracy drops from 92.78% (40 MHz) to 88.48% (20 MHz), and testing accuracy declines from 82.64% (40 MHz) to 79.50% (20 MHz).
Similarly, the GRU model exhibits a slight decrease in both training and testing accuracy for activity prediction when moving from 40 MHz to 20 MHz. Additionally, location prediction accuracy declines, highlighting the impact of a reduced bandwidth on the model’s ability to estimate location. In contrast, the LSTM-BIGRU hybrid model achieves higher accuracy at 20 MHz for both activity and location prediction, surpassing the results obtained at 40 MHz. Overall, our experiment indicates a general reduction in accuracy when transitioning from 20 MHz to 40 MHz. However, the hybrid models LSTM-GRU and LSTM-BIGRU appear to mitigate this, exhibiting enhanced performance at lower bandwidths. The impact on accuracy is influenced by the complexity of the data patterns and the architecture of the models, as illustrated in Figure 16.
6. Impact of Several Experimental Layouts
6.1. Impact of Synthetic CSI Data
The primary objective of the CTGAN is to generate synthetic CSI data that enhance the analysis of human activity and location. This synthetic data serve as a valuable supplement to the limited amount of real CSI data, ultimately aiming to improve the accuracy of human activity recognition and location estimation. To assess the quality and effectiveness of the generated CSI data, we employed deep learning techniques for evaluation. The synthetic data produced by the CTGAN successfully replicate the patterns and characteristics observed in real-world CSI data. To measure the impact, we trained the classifiers using a combination of real and synthetic CSI data and then evaluated their performance on a separate test dataset. By comparing the classification accuracy, with and without the inclusion of synthetic data, we assessed the benefits of incorporating CTGAN-generated CSI data. Figure 14 presents a learning curve outlining the process of evaluating the usability of synthetic CSI data. The evaluation adheres to the following structured approach: Training generator models using real CSI data to generate synthetic sensor data that mimic real-world characteristics. Combining synthetic CSI data with real sensor data to create a comprehensive dataset for training. Assessing model performance by analyzing classification accuracy improvements resulting from the inclusion of synthetic data.
6.2. Dataset Analysis
Following the preprocessing of raw CSI data, we obtained a refined dataset consisting of 835 walking samples, 739 sitting samples, 855 bending samples, and 790 standing samples. Each CSI data category was used to train its respective CTGAN model. Once the training process reached a stable state, the trained generator models were employed to synthesize CSI data based on specific requirements. Table 8 presents the accuracy of different models in predicting activity and location under the following two scenarios: using real CSI data alone and using a combination of hybrid synthetic and real CSI data. For real CSI data, the LSTM-GRU model outperforms other models in both activity and location prediction, while the LSTM-BIGRU demonstrates competitive performance. However, in the hybrid scenario, where synthetic and real data are combined, the LSTM-BIGRU emerges as the top performer, achieving the highest accuracy among all models. These results underscore the effectiveness of hybrid models, particularly the LSTM-BIGRU, in leveraging the synergy between synthetic and real data to improve predictive performance in complex tasks such as activity recognition and location estimation. Overall, when synthetic and real data are combined, all models, LSTM, GRU, LSTM-GRU, and LSTM-BIGRU, exhibit a substantial improvement in accuracy compared to using real CSI data alone.

Table 8.
Impact of synthetic data on model performance.
In our experiment, we used a well-trained CTGAN model with the previously listed hyperparameters to generate three synthetic CSI datasets of varying sizes as follows: 3219 samples, 6438 samples, and 9756 samples. As shown in Figure 17, the tick “0” on the x-axis represents the scenario where only real CSI data were used for training and evaluation. Conversely, the tick “all” indicates the presence of fully synthetic CSI data, which are equivalent in quantity to the real CSI data. The line chart illustrates that as the amount of synthetic CSI data increases, there is a consistent improvement in recognition and estimation accuracy. This trend confirms that the inclusion of synthetic CSI data enhances the accuracy of our proposed LSTM-BIGRU model over time.
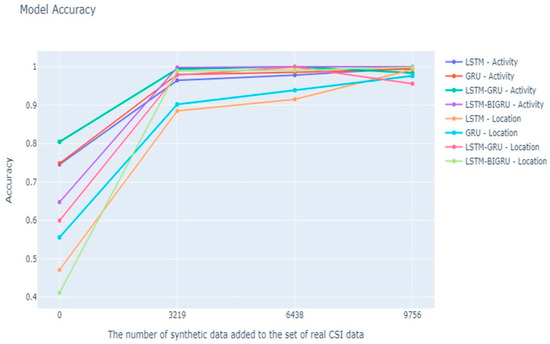
Figure 17.
Impact of an increasing number of synthetic data.
Furthermore, to validate the effectiveness of incorporating synthetic data into our proposed LSTM-BIGRU model for joint human activity recognition and localization, we analyzed the learning curves depicted in Figure 18 and Figure 19. The graphs illustrate the performance of our model when trained on real CSI data alone compared to a combination of real CSI data and synthetic data. The results demonstrate that the inclusion of synthetic data significantly enhances the accuracy of both activity and location predictions. This finding reinforces the effectiveness of our proposed model in accurately predicting and estimating human activity and location when synthetic data are incorporated alongside real CSI data.
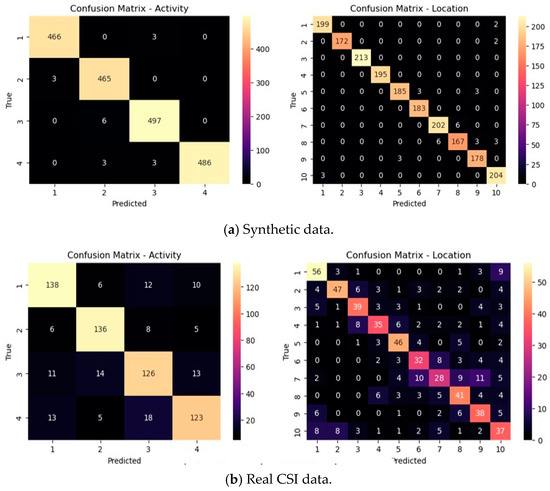
Figure 18.
Confusion matrix comparison of the real and integrated synthetic CSI data.
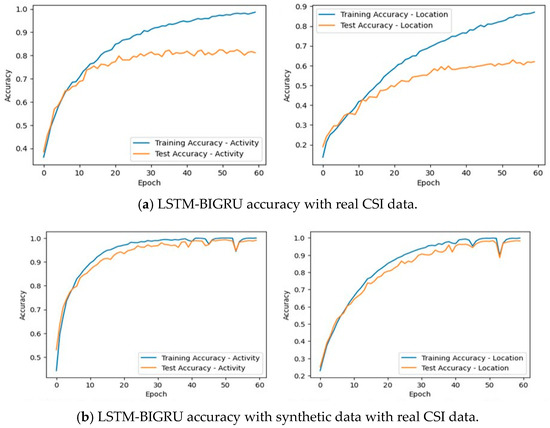
Figure 19.
Learning curve of the real and synthetic data CSI data.
Impact of the features: In this study, we leveraged two main features, namely the amplitude and phase information of CSI, to facilitate activity recognition and location estimation. The amplitude feature captures the magnitude of the signal, while the phase feature provides insights into the signal’s phase shift. By incorporating both amplitude and phase information, our approach enables a comprehensive analysis of the CSI data, allowing us to extract meaningful patterns and characteristics related to human activities and their corresponding locations. This multi-modal feature representation enhances the discriminative power of our model and improves its ability to accurately recognize different activities and estimate precise locations.
Table 9 demonstrates the impact of the features on the overall recognition and estimation accuracy of our proposed model. Moreover, the impact of combining amplitude and phase features on the joint human activity recognition and localization task is shown. The results are presented for the following three different models: LSTM, GRU, and LSTM-BIGRU. For both activity and location prediction, the inclusion of fused features (amplitude + phase) generally enhances training and testing accuracy across all models. Specifically, our proposed LSTM-BIGRU model shows the highest accuracy in both training and testing, reaching up to 99.91% for activity prediction and 97.63% for location prediction.

Table 9.
Impact of the features on the recognition and estimation of our model.
Impact of the bandwidth: We performed two significant experiments by varying the signal bandwidths at 20 MHz and 40 MHz within the IEEE 802.11n framework. The IEEE 802.11n offers flexibility in signal bandwidth choice, allowing for options of 20 MHz, 40 MHz, or 80 MHz. The selected bandwidth plays a crucial role in determining the data throughput, with higher bandwidths generally leading to increased data transfer rates. Our investigation focused on evaluating the joint human activity recognition and localization system under bandwidth conditions of 20 MHz and 40 MHz. It is important to note that we did not consider an 80 MHz bandwidth because the transmitter device used in our experiment did not support it.
The improvements observed in the accuracy suggest that leveraging combined amplitude and phase information contributes positively to the models’ performance in joint human activity recognition and localization.
Overall, our investigation uncovered a decrease in accuracy when transitioning from 20 MHz to 40 MHz. However, the hybrid models, particularly the LSTM-GRU and LSTM-BIGRU, seem to counteract this decline, displaying enhanced performance at the lower bandwidth. The impact on the accuracy is determined by the complexity of data patterns and the architectures of the models, as illustrated in Table 10.

Table 10.
Model comparison with related works.
6.3. Discussion
In [41], contrastive learning is utilized to separate content and style features, ensuring that enhanced underwater images maintain their structural integrity while improving visibility. This approach focuses on learning discriminative representations by enforcing style-based feature separation, optimizing image enhancement tasks. Similarly, in human activity recognition, distinguishing between different movements (e.g., walking, running, and sitting) relies on learning fine-grained sequential differences, much like how contrastive learning separates style and content features in image enhancement. However, while contrastive learning in image enhancement is used to disentangle and reconstruct meaningful visual representations, human activity recognition models primarily learn temporal dependencies to differentiate activities.
The activity recognition approach often relies on sequential models like the LSTM-BIGRU, which process temporal information, whereas contrastive learning in image processing is typically applied in convolutional or transformer-based architectures. We utilized CSI to investigate cooperative human activity recognition and localization. Our solution employed hybrid deep neural networks to accurately identify and localize specific actions performed by individuals in a given environment. By integrating modern deep learning algorithms, our study aimed to enhance the accuracy and reliability of human activity detection and location estimation using CSI data. We explored various deep neural network architectures, including 1D-CNN and RNN models such as LSTM and the GRU. Additionally, we examined hybrid RNN models, notably the LSTM-GRU and LSTM-BIGRU, which were extensively trained under different experimental conditions. Our research involved two key real-world studies, where we utilized the PicoScene Wi-Fi sensor platform to collect CSI data.
The first experiment was conducted using a 20 MHz bandwidth, while the second used a 40 MHz bandwidth, resulting in 7538 subcarrier segments across both settings. However, due to data limitations, constructing a highly accurate model within our proposed framework proved challenging. To address this limitation, we implemented a data generation technique. Specifically, we leveraged the CTGAN algorithm to generate synthetic data from real CSI data. After training the CTGAN model on our real CSI dataset, we successfully generated three distinct synthetic datasets that closely mirrored the characteristics of actual CSI data, complete with the corresponding labels. Following this, we conducted a series of experiments aimed at developing our proposed LSTM-BIGRU model for the joint task of activity recognition and localization. This process involved integrating the synthetically generated data with real CSI data to enhance the model’s accuracy.
Before constructing our proposed model, we performed parameter tuning using a grid search approach, focusing on hidden size and the number of layers as the search space. This meticulous approach allowed us to select the most reliable parameters, ensuring the development of an accurate model capable of effectively predicting activities and estimating locations. Our investigation provided key insights into the impact of incorporating synthetic data from CTGAN on the performance of our LSTM-BIGRU model for human activity recognition and localization. Using only real CSI data, our model achieved an accuracy of 81.21% for activity recognition and 61.96% for location estimation. However, when synthetic data were integrated with real CSI data, our LSTM-BIGRU model significantly improved, achieving 99.81% accuracy for activity recognition and 98.93% for location estimation. Furthermore, Table 10 presents a comparative analysis with two relevant studies that exclusively used real CSI data without incorporating synthetic data, providing a contextual foundation for our findings. To verify the statistical significance of our results, we conducted 10-fold cross-validation, yielding a standard deviation of ±0.3% for activity recognition accuracy, confirming the model’s robustness.
Notably, our proposed hybrid neural network model, reinforced with synthetic data, outperformed previous models that relied solely on real CSI data. By leveraging the unique features generated by the CTGAN, our model demonstrated exceptional performance, highlighting the effectiveness of synthetic data in enhancing the network’s ability to distinguish and localize human activities. This finding makes a significant contribution to the existing body of knowledge on integrated human activity recognition and localization. While previous research has primarily focused on CSI data, our study pioneers the inclusion of synthetic data, demonstrating its efficacy in improving the accuracy of hybrid neural networks. Additionally, our findings underscore the benefits of hybrid models in utilizing multiple data sources to produce more robust and accurate predictions. These insights not only advance our theoretical understanding but also have practical implications for designing more effective human activity recognition and localization systems.
Generally, the CNN-ResNet and 1D-CNN are highly effective for feature extraction but struggle with capturing sequential dependencies. In contrast, LSTM and the GRU excel at processing sequential data but operate in a single direction, limiting their ability to fully capture contextual relationships. The BIGRU enhances performance by processing sequences in both forward and backward directions, leading to richer feature representations and improved contextual learning. The LSTM-BIGRU hybrid model leverages the strengths of both architectures—LSTM’s ability to capture long-term dependencies and BIGRU’s efficient bidirectional processing. This combination results in improved classification accuracy while maintaining a balance between performance and computational efficiency. Additionally, the BIGRU uses fewer parameters than LSTM, making it more memory-efficient and faster to train while still delivering high accuracy. By integrating these advantages, the LSTM-BIGRU model offers superior performance compared to traditional LSTM and GRU models, making it a powerful choice for sequence-based tasks. While transformer-based models have demonstrated superior performance in various sequential tasks, LSTM was chosen as the backbone for this study due to its efficiency in capturing temporal dependencies and its proven success in human activity recognition and localization. Although transformers excel in modeling long-range dependencies, they require large-scale datasets and significant computational power for self-attention mechanisms. Given our dataset’s size, even after augmentation with the CTGAN, the computational cost of training transformers remained considerably higher than that of LSTM-based architectures.
7. Conclusions
This study presents a comprehensive investigation into the domain of joint human activity recognition and localization, leveraging CSI. Our methodology, based on hybrid deep neural networks, aims to enhance the precision and reliability of identifying specific activities performed by individuals within a given location. We extensively explored various deep neural networks, including 1D-CNN and RNN models such as LSTM, the GRU, the LSTM-GRU, and the LSTM-BIGRU. Despite the valuable insights obtained from real-world experiments conducted at 20 MHz and 40 MHz, inherent limitations in the data necessitated the use of innovative data generation techniques. Specifically, the CTGAN algorithm was employed to generate synthetic data from real CSI data, producing three synthetic datasets that closely resemble labeled real CSI data. The integration of synthetic data with real CSI data facilitated the development of our proposed LSTM-BIGRU model. Before constructing this model, a thorough parameter tuning process was conducted using grid search, focusing on hidden size and the number of layers as the search space. Upon evaluating the model’s performance, we found that it performed exceptionally well, particularly at 20 MHz, achieving an accuracy of 99.81% for activity recognition and 98.93% for location estimation. These results demonstrate the model’s effectiveness in integrated human activity recognition and localization. However, a noticeable decline in accuracy was observed at 40 MHz, highlighting the correlation between experimental conditions and model performance. Ultimately, our findings not only advance Wi-Fi-based sensing technology but also have significant implications for smart home automation, elderly care monitoring, and real-time security surveillance. By improving accuracy in outdoor settings, this study paves the way for deployable, non-intrusive activity recognition systems in public spaces, emphasizing the significance of experimental configurations and data augmentation strategies in enhancing model accuracy for real-world applications. These results pave the way for future research aimed at refining and expanding the capabilities of hybrid deep neural networks in addressing the complexities of human activity identification and localization. Future studies should focus on improving experimental setups, exploring advanced network architectures, diversifying data collection efforts, and analyzing the impact of different layouts on model performance.
Author Contributions
The work presented here was carried out in collaboration among all authors. Conceptualization, Y.Y.M. and M.A.; formal analysis, Y.Y.M. and Y.B.; methodology, A.M. and Y.Y.M.; supervision, W.A.; visualization, Y.Y.M. and M.A.; writing—original draft, Y.Y.M.; writing—review and editing, Y.B. and A.M., Fund Acquisition, Y.Y.M. All authors have read and agreed to the published version of the manuscript.
Funding
No funding received for this paper.
Data Availability Statement
The dataset can be available upon request.
Acknowledgments
The authors acknowledge the internet resources provided by the Bahir Dar Institute of Technology and Injibara University.
Conflicts of Interest
The authors reported no potential conflict of interest.
References
- Xie, T.; Jiang, H.; Zhao, X.; Zhang, C. A Wi-Fi-based wireless indoor position sensing system with multipath interference mitigation. Sensors 2019, 19, 3983. [Google Scholar] [CrossRef]
- De Bast, S.; Guevara, A.P.; Pollin, S. CSI-based positioning in massive MIMO systems using convolutional neural networks. In Proceedings of the 2020 IEEE 91st Vehicular Technology Conference (VTC2020-Spring), Antwerp, Belgium, 25–28 May 2020; pp. 1–5. [Google Scholar] [CrossRef]
- He, Y.; Chen, Y.; Hu, Y.; Zeng, B. Wi-Fi vision: Sensing, recognition, and detection with commodity MIMO-OFDM Wi-Fi. IEEE Internet Things J. 2020, 7, 8296–8317. [Google Scholar] [CrossRef]
- Easwaran, U.; Krishnaveni, V. Phase Noise Performance of MIMO—GFDM Systems for Millimeter Wave 5GTechnology. In Communication Technologies and Security Challenges in IoT: Present and Future; Springer: Singapore, 2024; pp. 447–468. [Google Scholar]
- Zhang, J.; Wu, F.; Wei, B.; Zhang, Q.; Huang, H.; Shah, S.W.; Cheng, J. Data Augmentation and Dense-LSTM For Human Activity Recognition Using Wi-Fi Signal. IEEE Internet Things J. 2020, 8, 4628–4641. [Google Scholar] [CrossRef]
- Damodaran, N.; Haruni, E.; Kokhkharova, M.; Schäfer, J. Device Free Human Activity and Fall Recognition Using Wi-Fi Channel State Information (CSI). CCF Trans. Pervasive Comput. Interact. 2020, 2, 1–17. [Google Scholar] [CrossRef]
- Bokhari, S.M.; Sohaib, S.; Khan, A.R.; Shafi, M.; Khan, A.U.R. DGRU Based Human Activity Recognition Using Channel State Information. Measurement 2021, 167, 108245. [Google Scholar] [CrossRef]
- Wang, Y.; Fortier, P. Union Bound on The Bit Error Rate For MIMO-GFDM Systems. Wirel. Pers. Commun. 2022, 123, 1825–1839. [Google Scholar] [CrossRef]
- Fabrègue, B.F.G.; Bogoni, A. Privacy and Security Concerns in the Smart City. Smart Cities 2023, 6, 586–613. [Google Scholar] [CrossRef]
- Liu, J.; Liu, H.; Chen, Y.; Wang, Y.; Wang, C. Wireless Sensing for Human Activity: A Survey. IEEE Commun. Surv. Tutor. 2019, 22, 1629–1645. [Google Scholar] [CrossRef]
- Che, F.; Ahmed, Q.Z.; Lazaridis, P.I.; Sureephong, P.; Alade, T. Indoor Positioning System (IPS) Using Ultra-Wide Bandwidth (UWB)—For Industrial Internet of Things (IIOT). Sensors 2023, 23, 5710. [Google Scholar] [CrossRef]
- Huang, J.; Liu, B.; Chen, C.; Jin, H.; Liu, Z.; Zhang, C.; Yu, N. Towards Anti-Interference Human Activity Recognition Based on Wi-Fi Subcarrier Correlation Selection. IEEE Trans. Veh. Technol. 2020, 69, 6739–6754. [Google Scholar] [CrossRef]
- Wu, G. Analysis of Multi-Path Fading and the Doppler Effect for Reconfigurable Intelligent-Surface-Assisted Wireless Networks. Entropy 2022, 24, 281. [Google Scholar] [CrossRef] [PubMed]
- He, Z.; Zhang, X.; Wang, Y.; Lin, Y.; Gui, G.; Gacanin, H. A robust CSI-BASED WI-FI passive sensing method using attention mechanism deep learning. IEEE Internet Things J. 2023, 10, 17490–17499. [Google Scholar] [CrossRef]
- Cheng, X.; Huang, B.; Zong, J. Device-Free Human Activity Recognition Based on GMM-HMM Using Channel State Information. IEEE Access 2021, 9, 76592–76601. [Google Scholar] [CrossRef]
- Bibbò, L.; Carotenuto, R.; Della Corte, F. An Overview of Indoor Localization System for Human Activity Recognition (HAR) in Healthcare. Sensors 2022, 22, 8119. [Google Scholar] [CrossRef]
- Asif, U.; Mashford, B.; Von Cavallar, S.; Yohanandan, S.; Roy, S.; Tang, J.; Harrer, S. Privacy Preserving Human Fall Detection Using Video Data. In Proceedings of the Machine Learning for Health Workshop, Online, 6 December 2020; pp. 39–51. [Google Scholar]
- Vaiyapuri, T.; Lydia, E.L.; Sikkandar, M.Y.; Díaz, V.G.; Pustokhina, I.V.; Pustokhin, D.A. Internet of Things and Deep Learning Enabled Elderly Fall Detection Model For Smart Homecare. IEEE Access 2021, 9, 113879–113888. [Google Scholar] [CrossRef]
- Iazzi, A.; Rziza, M.; Thami, R.O.H. Fall Detection System-Based Posture-Recognition for Indoor Environments. J. Imaging 2021, 7, 42. [Google Scholar] [CrossRef]
- An, H.; Park, W.; Park, S. Wireless Spy Camera Spotter System with Real Time Traffic Similarity Analysis and Wi-Fi Signal Tracing. IEEE Access 2024, 12, 4459–4470. [Google Scholar] [CrossRef]
- Zeeshan, M.; Pandey, A.; Kumar, S. CSI-based device-free joint activity recognition and localization using Siamese networks. In Proceedings of the 14th International Conference on Communication Systems & Networks (COMSNETS), Bengaluru, India, 4–8 January 2022; pp. 260–264. [Google Scholar]
- Cheng, L.; Zhao, A.; Wang, K.; Li, H.; Wang, Y.; Chang, R. Activity Recognition and Localization Based on UWB Indoor Positioning System and Machine Learning. In Proceedings of the 2020 11th IEEE Annual Information Technology, Electronics and Mobile Communication Conference (IEMCON), Vancouver, BC, Canada, 4–7 November 2020; pp. 0528–0533. [Google Scholar]
- Moshiri, P.F.; Shahbazian, R.; Nabati, M.; Ghorashi, S.A. A CSI-Based Human Activity Recognition Using Deep Learning. Sensors 2021, 21, 7225. [Google Scholar] [CrossRef]
- Mutegeki, R.; Han, D.S. A CNN-LSTM Approach to Human Activity Recognition. In Proceedings of the 2020 International Conference on Artificial Intelligence in Information and Communication (ICAIIC), Fukuoka, Japan, 19–21 February 2020; pp. 362–366. [Google Scholar]
- Yanjun, F.; Xiaoqi, C.; Kejun, Z.; Baiheng, M.; Zhanjun, Y. Method for Phase Height Mapping Calibration Based on Fringe Projection Profilometry. J. Infrared Laser Eng. 2022, 51, 20210403. [Google Scholar]
- Zheng, T.; Chen, Z.; Ding, S.; Luo, J. Enhancing RF Sensing with Deep Learning: A Layered Approach. IEEE Commun. Mag. 2021, 59, 70–76. [Google Scholar] [CrossRef]
- Wang, J.; Zhao, Y.; Ma, X.; Gao, Q.; Pan, M.; Wang, H. Cross-Scenario Device Free Activity Recognition Based on Deep Adversarial Networks. IEEE Trans. Veh. Technol. 2020, 69, 5416–5425. [Google Scholar] [CrossRef]
- Hu, J.; Zhang, H.; Bian, K.; Di Renzo, M.; Han, Z.; Song, L. Metasensing: Intelligent Metasurface Assisted RF 3d Sensing by Deep Reinforcement Learning. IEEE J. Sel. Areas Commun. 2021, 39, 2182–2197. [Google Scholar] [CrossRef]
- Ding, X.; Jiang, T.; Li, Y.; Xue, W.; Zhong, Y. Device-Free Location Independent Human Activity Recognition Using Transfer Learning Based on CNN. In Proceedings of the 2020 IEEE International Conference on Communications Workshops (ICC Workshops), Dublin, Ireland, 7–11 June 2020; pp. 1–6. [Google Scholar]
- Xiao, J.; Alkhers, N.; Kopycka-Kedzierawski, D.T.; Billings, R.J.; Wu, T.T.; Castillo, D.A.; Rasubala, L.; Malmstrom, H.; Ren, Y.; Eliav, E. Prenatal Oral Health Care and Early Childhood Caries Prevention: A Systematic Review and Meta-Analysis. Caries Res. 2019, 53, 411–421. [Google Scholar] [CrossRef] [PubMed]
- Zhu, X.; Xia, Y.; Wang, X.; Si, K.; Gong, W. Optical Brain Imaging: A Powerful Tool for Neuroscience. Neurosci. Bull. 2017, 33, 95–102. [Google Scholar] [CrossRef]
- Yan, B.; Cheng, W.; Li, Y.; Gao, X.; Liu, H. Joint Activity Recognition and Indoor Localization with WIFI Sensing Based on Multi-View Fusion Strategy. Digit. Signal Process. 2022, 129, 103680. [Google Scholar] [CrossRef]
- Alhmiedat, T. Fingerprint-Based Localization Approach for WSN Using Machine Learning Models. Appl. Sci. 2023, 13, 3037. [Google Scholar] [CrossRef]
- Alhmiedat, T.; Marei, A.M.; Messoudi, W.; Albelwi, S.; Bushnag, A.; Bassfar, Z.; Alnajjar, F.; Elfaki, A.O. A SLAM-Based Localization and Navigation System for Social Robots: The Pepper Robot Case. Machines 2023, 11, 158. [Google Scholar] [CrossRef]
- Zhang, X.-Y.; Li, C.; Shi, H.; Zhu, X.; Li, P.; Dong, J. Adapnet: Adaptability Decomposing Encoder–Decoder Network for Weakly Supervised Action Recognition and Localization. IEEE Trans. Neural Netw. Learn. Syst. 2020, 34, 1852–1863. [Google Scholar] [CrossRef]
- Wu, K.; Yang, M.; Ma, C.; Yan, J. CSI-Based Wireless Localization and Activity Recognition Using Support Vector Machine. In Proceedings of the 2019 IEEE International Conference on Signal Processing, Communications and Computing (ICSPCC), Dalian, China, 20–22 September 2019; pp. 1–5. [Google Scholar]
- Liu, M.; Ma, L.; Somasundaram, K.; Li, Y.; Grauman, K.; Rehg, J.M.; Li, C. Egocentric activity recognition and localization on a 3D map. In Proceedings of the 17th European Conference, Tel Aviv, Israel, 23–27 October 2022; Springer: Berlin/Heidelberg, Germany; pp. 621–638. [Google Scholar]
- Jiang, Z.; Luan, T.H.; Ren, X.; Lv, D.; Hao, H.; Wang, J.; Zhao, K.; Xi, W.; Xu, Y.; Li, R. Eliminating the barriers: Demystifying wi-fi baseband design and introducing the PicoScene WI-FI sensing platform. IEEE Internet Things J. 2021, 9, 4476–4496. [Google Scholar] [CrossRef]
- Su, J.; Liao, Z.; Sheng, Z.; Liu, A.X.; Singh, D.; Lee, H.-N. Human Activity Recognition Using Self-Powered Sensors Based on Multilayer Bi-Directional Long Short-Term Memory Networks. IEEE Sens. J. 2022, 23, 20633–20641. [Google Scholar] [CrossRef]
- Wang, F.; Feng, J.; Zhao, Y.; Zhang, X.; Zhang, S.; Han, J. Joint Activity Recognition and Indoor Localization with Wi-Fi Fingerprints. IEEE Access 2019, 7, 80058–80068. [Google Scholar] [CrossRef]
- Wang, Z.; Tao, H.; Zhou, H.; Deng, Y.; Zhou, P. A content-style control network with style contrastive learning for underwater image enhancement. Multimedia. Syst. 2025, 31, 60. [Google Scholar] [CrossRef]
Disclaimer/Publisher’s Note: The statements, opinions and data contained in all publications are solely those of the individual author(s) and contributor(s) and not of MDPI and/or the editor(s). MDPI and/or the editor(s) disclaim responsibility for any injury to people or property resulting from any ideas, methods, instructions or products referred to in the content. |
© 2025 by the authors. Licensee MDPI, Basel, Switzerland. This article is an open access article distributed under the terms and conditions of the Creative Commons Attribution (CC BY) license (https://creativecommons.org/licenses/by/4.0/).