Abstract
In view of the challenges brought by a complex environment, diverse data sources and urban development needs, our study comprehensively reviews the application of algorithms in urban residential vacancy rate observation. First, we explore the definition and measurement of urban residential vacancy rate, pointing out the difficulties in accurately defining vacant houses and obtaining reliable data. Then, we introduce various algorithms such as traditional statistical learning, machine learning, deep learning and ensemble learning, and analyze their applications in vacancy rate observation. The traditional statistical learning algorithm builds a prediction model based on historical data mining and analysis, which has certain advantages in dealing with linear problems and regular data. However, facing the high nonlinear relationships and complexity of the data in the urban residential vacancy rate observation, its prediction accuracy is difficult to meet the actual needs. With their powerful nonlinear modeling ability, machine learning algorithms have significant advantages in capturing the nonlinear relationships of data. However, they require high data quality and are prone to overfitting phenomenon. Deep learning algorithms can automatically learn feature representation, perform well in processing large amounts of high-dimensional and complex data, and can effectively deal with the challenges brought by various data sources, but the training process is complex and the computational cost is high. The ensemble learning algorithm combines multiple prediction models to improve the prediction accuracy and stability. By comparing these algorithms, we can clarify the advantages and adaptability of different algorithms in different scenarios. Facing the complex environment, the data in the observation of urban residential vacancy rate are affected by many factors. The unbalanced urban development leads to significant differences in residential vacancy rates in different areas. Spatiotemporal heterogeneity means that vacancy rates vary in different geographical locations and over time. The complexity of data affected by various factors means that the vacancy rate is jointly affected by macroeconomic factors, policy regulatory factors, market supply and demand factors and individual resident factors. These factors are intertwined, increasing the complexity of data and the difficulty of analysis. In view of the diversity of data sources, we discuss multi-source data fusion technology, which aims to integrate different data sources to improve the accuracy of vacancy rate observation. The diversity of data sources, including geographic information system (GIS) (Geographic Information System) data, remote sensing images, statistics data, social media data and urban grid management data, requires integration in format, scale, precision and spatiotemporal resolution through data preprocessing, standardization and normalization. The multi-source data fusion algorithm should not only have the ability of intelligent feature extraction and related analysis, but also deal with the uncertainty and redundancy of data to adapt to the dynamic needs of urban development. We also elaborate on the optimization methods of algorithms for different data sources. Through this study, we find that algorithms play a vital role in improving the accuracy of vacancy rate observation and enhancing the understanding of urban housing conditions. Algorithms can handle complex spatial data, integrate diverse data sources, and explore the social and economic factors behind vacancy rates. In the future, we will continue to deepen the application of algorithms in data processing, model building and decision support, and strive to provide smarter and more accurate solutions for urban housing management and sustainable development.
1. Introduction
As China’s urbanization process accelerates, the issue of urban residential vacancy rate has gradually surfaced and become a hot topic of widespread concern in all sectors of society [1,2,3,4]. With the continuous development of the real estate market and the in-depth advancement of urban planning, accurately grasping the urban residential vacancy rate is of great significance for government scientific decision making, rational allocation of resources and sustainable urban development [5,6]. However, traditional vacancy rate observation methods, such as the field survey method and questionnaire survey method, are insufficient in the face of complex and changing urban environments, a wide range of data sources and the ever-changing needs of urban development, and are unable to meet the current actual needs [7].
Regarding the papers on traditional methods, Shi et al. employed field surveys in Guiyang to estimate block-level vacancy rates, highlighting the limitations of manual data collection in rapidly expanding urban areas [8]. Additionally, He et al. compared traditional field surveys with machine learning models in Beijing, finding that algorithms significantly improved accuracy in dense urban environments [9]. Although both aimed to measure the vacancy rate, the former relied more on field surveys while the latter emphasized data-driven modeling techniques. For example, in a certain large-scale city, due to the rapid expansion of the urban area, the traditional field survey method can only cover less than 30% of the newly developed areas in a year, and the data obtained is often inaccurate due to subjective factors. The questionnaire survey method has a response rate of less than 50% in some communities, and the data integrity and accuracy are difficult to guarantee. Although the field survey method can directly obtain the use of houses, it has problems of low efficiency, limited scope and being susceptible to subjective factors; the questionnaire survey method depends on the cooperation of residents, which is difficult to guarantee the accuracy and integrity of data, and high cost for large-scale urban scope survey.
Fortunately, the rapid development of cutting-edge technologies such as big data and artificial intelligence in recent years has brought new ideas and methods to the observation of urban residential vacancy rates [10,11,12]. With its powerful data mining capabilities, the algorithm can accurately extract valuable information from massive data, greatly improving the accuracy and efficiency of observation. However, it must be recognized that the complexity of the urban environment, the richness and diversity of data sources and the ever-changing needs of urban development have brought more stringent challenges to the application of algorithms in this field [13,14]. How to fully integrate various data sources in complex urban scenes and adapt them to the needs of urban development has become a key problem that needs to be solved urgently in the current research [15].
In addition, urban residential vacancy rates are affected by a variety of factors, including economic development, population migration, and urban planning. These factors interact and intertwine with each other, further increasing the difficulty of vacancy rate observation [16,17,18,19]. To meet these challenges, many researchers have explored the application of algorithms in urban residential vacancy rate observation from different dimensions [20,21,22]. However, there is still a lack of comprehensive review and in-depth analysis of existing research results, making it difficult to form a systematic reference for subsequent research.
Based on this, we are committed to conducting a comprehensive review of the application of algorithms in urban residential vacancy rate observation, and to deeply explore how to deal with the challenges brought by complex environments, diverse data sources and urban development needs. The primary motivation behind our focus on algorithms for urban residential vacancy rate observation is deeply rooted in the current urban development landscape. The rapid urbanization in China has led to an unprecedented expansion of cities. This growth has outpaced the capabilities of traditional vacancy rate observation methods. For instance, traditional field surveys can no longer cover large-scale newly developed areas effectively. In a certain large-scale city, as mentioned earlier, the traditional field survey method can only cover less than 30% of the newly developed areas in a year. Moreover, the data obtained from such surveys is often marred by inaccuracies due to subjective factors. Questionnaire surveys, on the other hand, face a low response rate, sometimes less than 50% in some communities, and it is difficult to ensure data integrity and accuracy.
On the contrary, algorithms offer a promising solution. Their powerful data mining capabilities enable them to sift through massive amounts of complex data. For example, in the era of big data, algorithms can analyze large datasets from various sources, such as real estate transaction records, census data and remote sensing images, to extract valuable information related to residential vacancy rates. However, despite the potential of algorithms, there is currently a lack of a comprehensive understanding of how different types of algorithms, including traditional statistical learning, machine learning, deep learning and ensemble learning, perform in the context of urban residential vacancy rate observation. Each algorithm has its own strengths and limitations, and their effectiveness can vary depending on factors like data characteristics and the specific urban environment. This knowledge gap is precisely what our review aims to fill. By comprehensively evaluating these algorithms, we can provide a more solid foundation for urban planners, policy makers and real estate developers to make informed decisions. This paper will first systematically sort out the existing research results and carefully analyze the actual application effects of different algorithms in urban residential vacancy rate observation; secondly, from the three dimensions of complex environment, diverse data sources and urban development needs, it will deeply explore the difficulties faced by the current research; finally, it will propose practical solutions to these challenges and make reasonable prospects for future research directions.
Our research has important purposes and significance. In terms of research purpose, our study aims to comprehensively explore the application status, technical development level and challenges of algorithms in urban residential vacancy rate observation. By comprehensively combining and comparing various algorithms, we can clarify their advantages and disadvantages in dealing with complex environments, diverse data sources and meeting the needs of urban development. At the same time, with the help of empirical research and rich case analysis, we explore feasible solutions to improve the accuracy and efficiency of residential vacancy rate observation using algorithms, so as to provide scientific and efficient decision-making support tools for urban managers, real estate developers and relevant policy makers, and ultimately achieve the optimal allocation of urban resources and promote sustainable urban development. In terms of research significance, the value of this study is reflected in several key areas. On the one hand, by in-depth research on the application of algorithms in urban residential vacancy rate observation, it provides new technical means and methodology for solving the problem of urban residential vacancy, thereby improving the level of urban management and governance capabilities. On the other hand, this study helps to integrate and utilize multi-source data, enhance data-driven decision-making capabilities, and effectively promote the construction of smart cities. In addition, the research results will provide a solid scientific basis for the formulation and adjustment of relevant policies, help in the healthy and stable development of the real estate market and effectively alleviate resource waste and social contradictions. In short, our study has important theoretical and practical value in promoting the widespread application of algorithm technology in the field of urban management, and also provides valuable reference for the research and solutions of other urban problems.
2. Algorithmic Basis for Urban Residential Vacancy Rate Observation
2.1. Definition and Measurement of Urban Residential Vacancy Rate
As an important indicator for measuring the balance between demand and supply in the real estate market, the urban residential vacancy rate has important guiding significance for government decision making, urban planning and market investment [23,24,25]. The so-called urban residential vacancy rate refers to the proportion of unoccupied or unused residential buildings in a city to the total number of residential buildings in a certain period of time. This indicator comprehensively reflects the supply and demand situation of the residential market, the spatial utilization efficiency in the urbanization process, and the allocation effect of social resources. However, accurately measuring the urban residential vacancy rate faces many challenges, including how to reasonably define vacant residential buildings, how to obtain reliable data sources and how to deal with complex environmental factors.
In terms of defining vacant housing, in theory, vacant housing should include housing that has been unoccupied for a long time and cannot be used immediately, as well as housing that is occupied but the residence time is extremely unstable and does not meet the normal living characteristics [26,27,28]. However, in actual operation, this concept often varies due to differences in urban characteristics, regional culture and statistical methods. For example, some cities may only regard housing that has been unoccupied for several consecutive months as vacant, while ignoring some special cases where there are people living but the residence time is extremely unstable. Therefore, in order to accurately measure the vacancy rate of urban housing, it is necessary to unify and standardize the definition of vacant housing.
In terms of measurement methods, the measurement of urban residential vacancy rate depends on sufficient and accurate data support [29,30]. At present, common data sources mainly include population census, real estate registration, electricity usage, property fee payment and other channels. Among them, population census data have high authority and coverage, but the census cycle is long and the data update speed is slow; real estate registration and electricity usage data can more intuitively reflect the residential vacancy situation, but there may be problems such as incomplete data and inconsistent statistical caliber. In order to overcome the limitations of a single data source, researchers have tried to integrate multiple data sources and use technical means such as statistics and geographic information systems (GIS) to improve the accuracy and reliability of urban residential vacancy rate measurement. The complexity in defining and measuring the urban residential vacancy rate has a profound impact on the application of algorithms. A non-standardized definition of vacant housing can lead to misclassification by algorithms. For example, if some cities define vacant housing as those unoccupied for several consecutive months, while others consider houses with unstable residence times as vacant, algorithms trained on different definitions may produce inconsistent results. This lack of standardization makes it difficult for algorithms to accurately identify vacant houses.
In terms of measurement, the limitations of single-source data are a significant obstacle. Population census data, despite its high authority and wide coverage, has a long census cycle and slow data update speed. Real estate registration and electricity usage data, although more intuitive in reflecting the residential vacancy situation, may suffer from incomplete data and inconsistent statistical calibers. These issues mean that algorithms need to be designed to handle multi-source data. They must be able to integrate data from different sources, such as combining real estate transaction data with census data, to improve the accuracy of vacancy rate measurement. Additionally, algorithms need to account for the complex environmental factors that affect the measurement, like city size, regional development imbalance and the real estate market cycle. Understanding these aspects is not only crucial for accurately measuring the vacancy rate but also for developing and applying effective algorithms in this field.
In addition, the measurement of urban residential vacancy rate is also affected by complex environmental factors, such as city size, regional development imbalance and real estate market cycle. These factors lead to significant differences in residential vacancy rates between cities and regions, which poses a challenge to accurate measurement. To address this problem, researchers have gradually introduced algorithm-based observation methods, such as machine learning and deep learning, to meet the measurement needs in complex environments. These algorithms can effectively identify the characteristics of vacant homes and improve the accuracy of measurement results by learning and analyzing a large amount of historical data.
The definition and measurement of urban residential vacancy rate is a complex issue involving multidisciplinary and multi-field knowledge [31,32]. In order to better cope with the challenges of complex environment, diverse data sources and urban development needs, it is necessary to use modern algorithm technology to provide strong support for the accurate measurement of urban residential vacancy rate based on the clear definition of vacant housing and the integration of multiple data sources [33,34,35,36]. This will help governments, enterprises and investors to accurately grasp the dynamics of the residential market and provide a scientific basis for urban planning and socioeconomic development [37,38,39].
2.2. Algorithm Overview
In the research and application of urban residential vacancy rate observation, algorithms play a vital role. They provide key technical support for coping with the challenges of complex environments, diverse data sources and urban development needs [40]. We have organized the types of algorithms for urban residential vacancy rate observation into Figure 1.
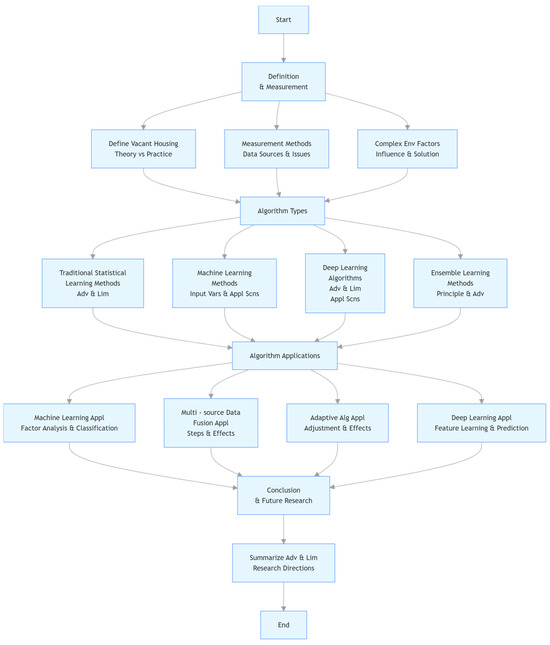
Figure 1.
Flowchart of algorithms for urban residential vacancy rate observation.
Traditional statistical learning methods, such as linear regression, logistic regression and time series analysis, are based on historical data mining and analysis to build residential vacancy rate prediction models [41,42]. For example, linear regression aims to find the best-fit linear relationship between independent variables (like economic growth rate, population density) and the dependent variable (residential vacancy rate). It uses the least-squares method to minimize the sum of the squared differences between the observed and predicted values. This approach assumes a linear relationship, which is relatively simple and computationally efficient. However, in real-world scenarios, especially in urban residential vacancy rate observation, the relationship is often more complex. For instance, when considering the impact of multiple factors on the vacancy rate, linear regression may not accurately capture the nonlinear interactions between variables.
For example, urban migration patterns often exhibit nonlinear relationships with vacancy rates. A sudden influx of young professionals may initially reduce vacancy rates in downtown areas but later lead to oversupply as new housing projects are rapidly developed, creating a U-shaped curve that linear regression cannot capture. Similarly, infrastructure investments (e.g., subway extensions) may have delayed effects on vacancy rates, with impacts varying by neighborhood density and socioeconomic composition. While polynomial regression can approximate certain nonlinear relationships (e.g., quadratic effects of housing prices on vacancy rates), it struggles with high-dimensional data and overfitting in complex urban systems. For example, capturing interactions between migration, policy, and infrastructure would require polynomial terms that quickly become computationally infeasible and difficult to interpret.
Such methods have certain advantages in dealing with linear problems and data with clear regularity. However, with the increasing complexity of the urban environment, the nonlinear characteristics of the data are becoming increasingly prominent, making it difficult for these traditional methods to meet actual needs in terms of prediction accuracy [43,44]. Despite their limitations in nonlinear scenarios, traditional statistical methods offer critical strengths, including interpretability and computational efficiency. For example, linear regression provides transparent insights into the relationship between variables, enabling policy makers to directly understand how factors like population density or housing prices influence vacancy rates. This clarity is invaluable for actionable decision making in urban planning [45,46]. Additionally, these methods are less prone to overfitting when working with limited datasets, a common challenge in urban vacancy rate studies where comprehensive data may be scarce. Moreover, their low computational demands make them accessible in resource-constrained environments or for rapid prototyping. In particular, when faced with complex nonlinear problems and a large amount of noisy data, the limitations of traditional statistical learning methods become more apparent. A study by Wang et al. applied linear regression to predict vacancy rates in Beijing using economic and demographic variables but found a poor fit (R2 = 0.45), highlighting its inability to model interactions between housing policies and market speculation [47]. In contrast, machine learning models achieved R2 > 0.78 by capturing nonlinear dynamics.
Machine learning methods, including support vector machines, decision trees and random forests, have shown great advantages in capturing nonlinear relationships in data due to their strong nonlinear modeling capabilities [48,49,50,51]. Support vector machines (SVMs) work by mapping the input data into a high-dimensional feature space and finding an optimal hyperplane that maximally separates different classes. In the context of residential vacancy rate observation, SVMs can classify whether a house is vacant or occupied based on various features like building attributes, location and market conditions. Decision trees, on the other hand, recursively split the data based on different features. Each internal node represents a feature test, and the branches represent the outcomes of the test. For example, a decision tree might first split the data based on the building age, then further split the data based on the location, to predict the vacancy rate. Random forests are an ensemble of decision trees. They build multiple decision trees on different subsets of the data and combine their predictions, which helps to reduce overfitting and improve the overall prediction accuracy. In urban residential vacancy rate analysis, random forests can handle large-scale and complex data, identifying important factors affecting the vacancy rate and their interactions.
In machine learning algorithms for predicting urban residential vacancy rates, typical input variables are crucial. They mainly include the following:
Geospatial variables: These include the longitude and latitude of residential properties, which help the algorithm identify regional vacancy rate differences.
Building attribute variables: Building age, structure type and area size matter. New and old buildings have different vacancy rates due to various factors. Different structural types affect living comfort and costs, influencing vacancy. Also, large- and small-area properties have different market demands and vacancy rates.
Socioeconomic variables: Regional economic development (measured by per capita GDP (Gross Domestic Product), industrial structure), population density, residents’ income level and employment situation impact the vacancy rate. Developed regions have lower vacancy rates. High-income groups’ high housing-quality requirements and low-income groups’ limited housing-buying/renting ability, along with employment factors, affect housing demand and vacancy.
Real estate market variables: Housing price trends, rental levels and the market supply–demand relationship influence the vacancy rate. Rising prices may lead to property hoarding, while rental levels and supply–demand ratios directly affect vacancy.
Deep learning algorithms, such as convolutional neural networks, recurrent neural networks and long short-term memory networks, effectively address the challenges brought by diverse data sources through automatic learning of feature representation and hierarchical learning capabilities [52,53,54]. These models show strong performance when processing large amounts of high-dimensional, complex data, making the observation of residential vacancy rates more accurate. However, deep learning methods also have certain limitations, such as complex training processes and high computational costs, which have brought certain problems to practical applications.
Ensemble learning methods, such as bagging, boosting and stacking, have been widely used in the observation of urban residential vacancy rates in China by combining multiple prediction models to improve prediction accuracy [55,56,57]. This type of method can make full use of the advantages of various algorithms, improve the stability and reliability of observation results and provide strong support for the regulation of urban residential vacancy rates. Driven by big data and cloud computing technologies, data-driven algorithms have made important progress and achieved accurate prediction of residential vacancy rates.
The algorithmic basis for observing urban residential vacancy rates involves multiple fields, reflecting the research trend of multidisciplinary cross-integration [58]. Researchers need to analyze specific issues and select appropriate algorithms, and combine multi-source data, interdisciplinary knowledge and practical experience to achieve accurate observation of urban residential vacancy rates. This process not only helps to improve the accuracy and practicality of observations, but also has a far-reaching impact on urban planning, real estate market supervision and housing policy formulation. To better illustrate the relationships and processes among the definition, measurement, algorithm types and their applications in urban residential vacancy rate observation, the following flowchart is provided:
Faced with the challenges of complex environment, diverse data sources and urban development needs, researchers have made continuous breakthroughs in the exploration and improvement of algorithms [59]. From traditional statistical learning methods to machine learning methods, to deep learning methods and ensemble learning methods, each algorithm has its unique advantages and application scenarios. In the practice of urban residential vacancy rate observation, researchers need to fully understand the principles and limitations of various algorithms, combine the characteristics of actual problems and flexibly use a variety of methods to achieve the best observation effect.
The algorithm for observing urban residential vacancy rates is based on a complex system built on traditional statistical learning, machine learning, deep learning and ensemble learning [60]. The continuous improvement and development of this system has provided strong technical support for urban managers, enabling observation work to better adapt to the needs of urban development and cope with the challenges of complex and changing environments and diverse data sources.
In the process of urban development, the observation of residential vacancy rate is not only related to the healthy development of the real estate market, but also affects the living quality of urban residents [61,62,63,64]. Therefore, it has become an urgent task to conduct in-depth research on the algorithm basis of urban residential vacancy rate observation, give full play to the advantages of various algorithms and provide strong guarantees for the accurate observation of urban residential vacancy rate in China. On this basis, it is expected to provide strong support for China’s urban development planning, housing policy formulation and real estate market regulation, and promote the sustainable development of cities.
In summary, different types of algorithms have their own advantages and disadvantages in observing urban residential vacancy rates. Traditional statistical learning methods are suitable for processing linear relationships and structured data, but have limited performance on nonlinear problems. Machine learning methods have advantages in capturing nonlinear relationships, but are sensitive to data quality and overfitting issues. Deep learning algorithms perform well in processing high-dimensional and complex data, but have high computational costs. Reinforcement learning and data mining methods are suitable for dynamic environments and exploratory analysis. Time series analysis is good at capturing the temporal dependency of data. The specific algorithm types and their characteristics are summarized in Table 1.

Table 1.
Algorithm types for observing urban residential vacancy rates.
2.3. Application of the Algorithm in Urban Residential Vacancy Rate Observation
In the rapid process of urban development, the residential vacancy rate is an important indicator reflecting the health of the real estate market [65,66]. For policy makers, urban planners and investors, its accurate observation is of great importance [67]. With the advent of the big data era, the application of algorithms in the observation of urban residential vacancy rates has gradually shown its unique advantages. It can not only effectively cope with complex environments and process diverse data sources, but also meet the diverse needs of urban development. With the support of modern algorithm technology, traditional statistical methods have been significantly improved and enhanced when faced with problems such as large data volume, high noise and high complexity.
Machine learning algorithms, such as those based on decision trees, support vector machines and random forests, have become mainstream in observing residential vacancy rates due to their strong nonlinear modeling capabilities. While machine learning and deep learning algorithms excel in capturing complex patterns, traditional statistical methods remain relevant for their interpretability and efficiency. For instance, in cases where data are limited or the focus is on policy-relevant insights (e.g., isolating the impact of a new housing policy), linear regression or time series analysis may be preferable. This trade-off between model complexity and interpretability is widely discussed in the literature, emphasizing the need for context-aware algorithm selection [68]. For example, in a medium-sized city study, the decision tree algorithm analyzed real estate and census data. Based on population structure, it found low vacancy rates for small apartments in young worker-dense areas. It also considered features like average income and distance to the city center, recursively splitting data for accurate vacancy classification. Support vector machines classified vacant and occupied houses using building and location features, achieving high accuracy. They can extract key factors affecting the vacancy rate through feature engineering, revealing relationships with socioeconomic factors. For example, analysis of real estate and census data shows that areas with more young migrant workers have lower small-apartment vacancy rates, while areas with an aging population may have higher large-house vacancy rates. Additionally, neural network algorithms like CNNs (convolutional neural networks) can analyze nighttime light remote sensing images to infer vacancy rates, and LSTMs (long short-term memory network) can predict future trends from time series rental or sales data [69]. For example, by analyzing real estate transaction records and census data together, it can be found that in areas with a high proportion of young migrant workers, the vacancy rate of small-sized apartments is relatively low, while in areas with a high aging population, the vacancy rate of large-sized houses may be relatively high. This indicates that population structure, as a socioeconomic factor, has a significant impact on the residential vacancy rate. Himeur et al. applied artificial intelligence-based anomaly detection of energy consumption in buildings to observe the residential vacancy rate, mainly using energy-related data [69]. Camero et al. used evolutionary deep learning for car park occupancy prediction, which has some relevance to residential vacancy rate observation as both involve space-occupancy prediction [70]. However, the former focused on energy-consumption-based analysis while the latter emphasized a specific deep learning algorithm for a related but different occupancy scenario. Their research differed from the others in that it was more centered on the data-fusion methodology itself rather than a specific algorithm application for vacancy rate observation. In addition, neural network algorithms, especially convolutional neural networks (CNNs) in processing remote sensing image data, and long short-term memory networks (LSTMs) in time series prediction, provide new perspectives and possibilities for observing residential vacancy rates. CNN can extract the characteristics of light and dark changes in residential areas from nighttime light remote sensing images, thereby inferring the vacancy rate, while LSTM can predict future vacancy trends by analyzing time series data of residential rental or sale.
In terms of the integration of diverse data sources, multi-source data fusion algorithms play a vital role [71]. In a large-scale urban study, principal component analysis (PCA) extracted key features from remote sensing images, census data and real estate transaction records, reducing data dimensionality. Then, the K-nearest neighbor (KNN) algorithm fused the data by calculating data-point similarities. For example, in Shenzhen’s 2023 vacancy rate monitoring, high-resolution satellite imagery, real estate transaction data and census data were integrated. PCA was used to extract core features such as building density, population density and transportation accessibility, while KNN classified and predicted vacancy rates across different urban areas. The results showed that the fused model improved accuracy by 15–20% compared to single-source data, identifying Qianhai New Area as having a lower vacancy rate due to its robust commercial infrastructure. This insight enabled the government to optimize public rental housing allocation policies, effectively reducing resource waste [72]. This improved vacancy rate observation accuracy and revealed that areas with high population density and good transportation had lower vacancy rates, providing insights for urban planning. Data from different sources, forms and periods, such as drone aerial images, census data and real estate transaction records, can be effectively integrated through data preprocessing, feature extraction and similarity measurement. This method not only improves the accuracy of vacancy rate observation, but also reveals the regional distribution of residential vacancy, providing a scientific basis for policy making. The combination of drone aerial photography technology and machine learning provides high-precision and high-resolution geographic information data for observing residential vacancy rates, making the observation results more accurate.
The introduction of adaptive algorithms has brought new vitality to the observation of urban residential vacancy rates [73]. This type of algorithm can dynamically adjust the observation model according to the different stages of urban development and regional characteristics, thereby improving the real time and accuracy of the prediction. In the process of urban new district development, the residential vacancy rate is affected by various factors such as planning, transportation and supporting facilities. The adaptive algorithm can flexibly respond to these challenges and provide more accurate data support for decision makers. Take Xiong’an New Area as an example. In the early stages of construction, an adaptive algorithm dynamically adjusted the weights of planning, transportation and population factors to predict a vacancy rate of 65% (due to incomplete infrastructure). As the area developed, the algorithm incorporated real-time data on new housing supply and population inflows, revising the mid-term vacancy rate prediction to 30% with an error margin of less than 5% compared to actual monitoring. This prediction enabled the administrative committee to proactively deploy commercial facilities, avoiding risks of urban vacancy [74].
Deep learning algorithms have also shown great potential in the observation of urban residential vacancy rates [70,73]. In a recent project, a CNN-based model trained on high-resolution remote sensing images automatically learned features like building density and green-area distribution for vacancy rate prediction, achieving high accuracy in different regions. An LSTM-based model analyzed historical vacancy rate time series data along with rental price and new housing supply factors, accurately predicting future trends to assist decision making. By constructing a deep neural network, the algorithm can automatically learn and extract complex features, enhancing the generalization ability of the observation model [70,75,76]. In particular, in the application of high-resolution remote sensing images, deep learning algorithms such as the image generation technology of generative adversarial networks (GANs) can generate realistic residential area images when data are insufficient, assisting in the judgment of vacancy conditions [77,78].
The application of algorithms in urban residential vacancy rate observation has achieved remarkable results. The application of different algorithms in urban residential vacancy rate observation follows a well-thought-out logic. Machine learning algorithms, with their strong nonlinear modeling capabilities, are well suited to capture the complex relationships between various factors and the vacancy rate. For example, decision trees, support vector machines and random forests can analyze data from multiple dimensions, such as real estate transaction records and census data. By doing so, they can identify key factors influencing the vacancy rate, like the impact of population structure on the vacancy rate of different-sized apartments. This ability to handle complex relationships is crucial because the factors affecting urban residential vacancy rates are highly nonlinear. Multi-source data fusion algorithms play a vital role in integrating diverse data sources. Data from different origins, such as drone aerial images, census data and real estate transaction records, each carry unique information. By fusing these data sources through preprocessing, feature extraction and similarity measurement, we can obtain a more comprehensive and accurate picture of the vacancy rate. This not only improves the accuracy of vacancy rate observation but also reveals the regional distribution of residential vacancy, providing a scientific basis for policy making. Adaptive algorithms are designed to address the dynamic nature of urban development. In the process of urban new district development, the residential vacancy rate is influenced by various factors like planning, transportation and supporting facilities. Adaptive algorithms can adjust the observation model in real time according to these changing factors, ensuring the timeliness and accuracy of the prediction. Deep learning algorithms, with their ability to automatically learn and extract complex features, enhance the generalization ability of the observation model. In the application of high-resolution remote sensing images, deep learning algorithms like generative adversarial networks (GANs) can generate realistic residential area images when data are insufficient, assisting in the judgment of vacancy conditions. Collectively, these algorithms form a comprehensive approach to address the challenges in accurately observing urban residential vacancy rates. This integrated approach is essential for urban planning, real estate management and policy making, as it provides more accurate and reliable data support, enabling more informed decision-making processes. The combination of machine learning, multi-source data fusion, adaptive and deep learning algorithms not only improves the accuracy and efficiency of observation, but also provides strong technical support for coping with complex environments, processing diverse data sources and meeting urban development needs [79]. In practical applications, the continuous optimization and improvement of these algorithm models are of great significance in improving generalization ability, reducing computational complexity and enhancing model interpretability. For example, by performing deep learning processing on remote sensing images, the residential vacancy behind the nighttime light changes can be more accurately identified; combined with drone aerial photography technology, the changes in residential areas can be monitored in real time, providing dynamic data support for urban planning; the combination of the Internet of Things and data analysis algorithms can collect and analyze residential electricity and water consumption data in real time, further refining the observation of vacancy rates. The comprehensive application of these technologies will undoubtedly provide more accurate and efficient technical means for observing urban residential vacancy rates and provide a scientific decision-making basis for the healthy development of cities.
3. Algorithmic Challenges in Complex Environments
3.1. Data Characteristics in Complex Environments
In the urban environment, algorithms face challenges from complex environments when observing residential vacancy rates. The data have significant spatiotemporal heterogeneity, with obvious differences in different areas. It is affected by multiple factors like macro-economy, policy, market and residents’ income, making it highly complex. Data sources are diverse, with issues like inconsistent coverage, accuracy and timeliness, and may contain missing or incorrect data. Also, residents’ behavior is unpredictable, adding to the complexity. Therefore, algorithms need strong adaptability and robustness to handle these challenges [80,81,82]. As shown in Table 2, these data features are derived from the imbalance of urban development, the diversity of regional functions and the variability of the residential market, which together constitute the challenges that the observation algorithm needs to deal with. The data characteristics in a complex environment are manifested in the following aspects: First, the data characteristics of urban residential vacancy rates show significant temporal and spatial heterogeneity. There are obvious differences in residential vacancy conditions in different cities, regions and even streets, which requires the algorithm to effectively identify and adapt to the differences in local characteristics [83,84]. For example, some newly built areas may have a high residential vacancy rate because supporting facilities are not yet complete, while some mature communities may have a relatively low vacancy rate because of convenient living. The algorithm needs to take these spatiotemporal factors into account and reasonably assign weights and extract features for data in different regions. Secondly, the urban residential vacancy rate is affected by many factors, including macroeconomics, policy regulation, market supply and demand, and residents’ income level, which make the data characteristics highly complex. In algorithm design, how to select key variables from many influencing factors and accurately capture the relationship between them and the vacancy rate has become a major challenge. In addition, there may be interactions between these factors, which further increases the difficulty of analyzing data features. Furthermore, the multi-source nature of data sources brings new challenges to the algorithm. The data sources for observing residential vacancy rates include but are not limited to real estate market transaction data, census data, remote sensing images and urban infrastructure information [85,86,87,88]. These data sources vary in coverage, accuracy, timeliness, etc., and may even have problems such as missing data and errors. To address these problems, the algorithm needs to have strong robustness and data fusion capabilities, be able to extract effective information from multi-source data, and reduce the uncertainty brought by a single data source. In addition, the dynamic nature of urban development also places higher demands on algorithms. With the advancement of urbanization, residential vacancy rates will be affected by urban planning, transportation development, industrial layout and other factors, showing a dynamic trend. The algorithm needs to have a certain predictive ability and be able to reasonably predict future vacancy rate changes based on historical data and existing trends to assist government departments and real estate companies in making effective decisions.
Table 2.
Data characteristics in complex environments.
Numerous studies have shown that there are significant nonlinear components in the field of urban residential vacancy rate observation. Take the research of a first-tier city as an example. Researchers collected the residential vacancy rate data of this city over the past decade. At the same time, they comprehensively considered multiple influencing factors such as GDP growth rate, population growth rate, housing price index and the intensity of policy regulation (such as purchase restriction policies and the number of adjustments to loan interest rates).
By establishing a traditional linear regression model, it was found that the goodness of fit of the model was only 0.45. This indicates that the linear model cannot well explain the changes in the vacancy rate, suggesting the existence of nonlinear relationships in the data.
Furthermore, a nonlinear machine learning algorithm, such as Support Vector Regression (SVR), was used to model the data. The results showed that the goodness of fit of the SVR model reached 0.78. And when predicting the vacancy rate in the next year, the mean squared error was 35% lower than that of the linear regression model. This comparison fully demonstrates that in the residential vacancy rate data of this city, there are a large number of complex laws that cannot be described by linear relationships, that is, there are significant nonlinear components.
The data characteristics in complex environments also include the unpredictability of residents’ behavior [89]. The data characteristics in complex environments are manifested in the following aspects: First, the data characteristics of urban residential vacancy rates show significant temporal and spatial heterogeneity. Liu et al. analyzed panel data from 35 Chinese cities and found that vacancy rates vary significantly across regions due to economic disparities and housing policies [90]. Wang et al. used geographically weighted regression to model spatial variations in vacancy rates, revealing that transportation infrastructure and population density are key drivers at the neighborhood level [91]. Residents’ choice of housing is not only affected by economic factors, but also closely related to personal preferences, family needs and other factors. These subjective factors make the characteristics of residential vacancy rate data more complex. The algorithm needs to be able to capture this unstructured information to enhance the interpretability and prediction accuracy of the model.To address these challenges, different algorithm types offer varying degrees of adaptability and robustness, as summarized in Table 1.
3.2. Algorithm Adaptability and Robustness
In the observation of urban residential vacancy rate, the algorithm faces many challenges in a complex environment, among which the adaptability and robustness of the algorithm are particularly important [92].
Adaptability is reflected in the ability of the algorithm to automatically adjust model parameters according to the environmental characteristics of different cities and regions to achieve accurate prediction of residential vacancy rates [93]. This requires algorithm designers to fully consider various influencing factors and design algorithms with adaptive capabilities. On the one hand, the algorithm needs to be able to automatically identify and learn the patterns in the data and capture the potential spatial correlation; on the other hand, the algorithm also needs to have strong generalization capabilities and be able to quickly adapt and give accurate prediction results when faced with new observation data.
Robustness refers to the ability of an algorithm to maintain stable performance in the face of outliers, noise and missing data [94]. In the actual process of observing urban residential vacancy rates, data quality issues are difficult to avoid, such as data collection errors and incomplete information, which will have a great impact on the performance of the algorithm. Therefore, it is crucial to improve the robustness of the algorithm. To achieve this goal, algorithm designers can use a variety of technical means, such as weighted sampling, data cleaning and model regularization, to reduce the impact of abnormal data on model performance. In addition, in view of the characteristics of the complex environment in the observation of urban residential vacancy rates, algorithm designers also need to pay attention to the following points: first, the algorithm should have the ability to analyze spatiotemporal correlations, and fully consider the dynamic changes of residential vacancy rates in time and space to improve the accuracy of predictions; second, the algorithm should be able to integrate multi-source data, such as remote sensing images, demographic data and socioeconomic indicators, so as to comprehensively capture the factors affecting residential vacancy rates; algorithm design should take into account computational efficiency to meet the needs of real-time processing of large-scale urban data.
In the face of the challenges of a complex environment, the adaptability and robustness of the urban residential vacancy rate observation algorithm are crucial [95]. By continuously optimizing the algorithm design and improving its adaptability and robustness, accurate observation of urban residential vacancy rates can be achieved, providing strong support for policy makers and urban planners. At the same time, this is also an important direction for future algorithm research, which requires joint efforts from academia and industry to meet the ever-changing needs of urban development.
4. Algorithm Application for Diverse Data Sources
4.1. Multi-Source Data Fusion
Multi-source data fusion is a crucial part of the algorithm in the observation of urban residential vacancy rate. Its core purpose is to make full use of diverse data sources to improve the accuracy, comprehensiveness and real-time performance of observation [96]. Similarly, Zhang et al. applied a stacked ensemble model to fuse social media data and electricity usage records, achieving 92% accuracy in identifying vacant properties [97]. Multi-source data fusion is crucial for observing urban residential vacancy rates as it integrates diverse data to enhance accuracy, comprehensiveness and real-time performance. In practical applications, the data sources involved in the observation of urban residential vacancy rate are extremely rich, including but not limited to geographic information system (GIS) data, remote sensing images, statistical data, social media data and urban grid management data. Each of these data sources have unique advantages, such as the spatial analysis capability of GIS data, the macro observation perspective of remote sensing images, the accuracy and authority of statistical data, the timeliness and dynamism of social media data and the refined management characteristics of urban grid management data.
In the face of these diverse data sources, algorithm application must first solve the data compatibility problem. Through data preprocessing, standardization and normalization, different data sources can be connected in terms of format, scale, accuracy and spatiotemporal resolution [98]. For example, high-resolution remote sensing images can be combined with low-resolution statistical data, and the images can be refined with the help of algorithms. The estimated results of the vacancy rate can be calibrated with statistical data, thereby ensuring observation efficiency while improving observation quality.
Furthermore, the multi-source data fusion algorithm needs to have the ability of intelligent feature extraction and correlation analysis [99]. In view of the rich information contained in different data sources, through machine learning, deep learning and other technologies, the characteristic variables that are highly correlated with the vacancy rate are automatically identified, such as the age, structure, use nature and surrounding supporting facilities of the building. At the same time, combined with the spatiotemporal data analysis method, the correlation model between data is established to explore the intrinsic relationship between the residential vacancy rate and multiple factors such as urban economic development, population mobility and urban planning.
In the process of data fusion, the algorithm also needs to deal with the uncertainty and redundancy of data [100]. To this end, the probability theory and information theory methods are introduced to screen out the data source that contributes most to the vacancy rate observation by calculating indicators such as mutual information and correlation coefficient between data, and eliminate or reduce data with high uncertainty and high redundancy, thereby improving the efficiency and quality of data fusion. In addition, in order to adapt to the ever-changing needs of urban development, the multi-source data fusion algorithm should have the ability to adapt and dynamically update. This means that the algorithm should not only consider the current data environment, but also predict and adapt to future data change trends. For example, with the expansion and renewal of the city, the vacancy rate characteristics of new residential areas and old residential areas may be significantly different. Therefore, the algorithm design needs to take into account flexibility and robustness to adapt to the dynamic needs of urban development.
Multi-source data fusion plays the role of bridging and linking in the application of algorithms to the observation of urban residential vacancy rate. It not only requires the algorithm to have the comprehensive ability to process different types of data, but also requires it to be able to extract effective information from massive data to meet the challenges of urban development needs in complex environments.
4.2. Algorithm Optimization Under Different Data Sources
In the observation of urban residential vacancy rate, according to the characteristics of various data sources, algorithm optimization becomes the key to improving the observation accuracy and efficiency [101]. Various data sources include but are not limited to remote sensing satellite images, street view images, real estate transaction records, power grid water data and community census information. These data have their own characteristics in terms of dimension, accuracy, timeliness, etc. In view of these characteristics, a series of optimizations have been carried out on the algorithm application to adapt to the challenges of complex environment and urban development needs. First, for the remote sensing satellite image data source, the optimization algorithm mainly focuses on image analysis and information extraction [102]. By using deep learning techniques, such as convolutional neural networks (CNN) and recurrent neural networks (RNN), residential areas can be effectively identified and classified, and the characteristics of vacant houses can be extracted. At the same time, combined with multi-temporal remote sensing data, change detection algorithms are used to monitor the dynamic changes of residential areas to more accurately judge the vacancy status. In addition, in view of the impact of different seasons and weather conditions on image quality, the optimization algorithm uses image enhancement and denoising technology to improve the stability and reliability of observation data. Secondly, street view images are another important data source, and their algorithm optimization focuses on image recognition and scene understanding. Using target detection technologies in deep learning, such as YOLO (You Only Look Once) and Faster R-CNN (Faster Region-based Convolutional Neural Network), residential buildings and their surroundings can be accurately identified, and the vacancy status can be inferred by analyzing the characteristics of the residential appearance and the surrounding environment. At the same time, combined with geographic information system (GIS) data, the optimization algorithm can more accurately locate and analyze the spatial distribution characteristics of urban residential vacancies. This method must also include the advantages and limitations of the data and methods used in this study.
The optimization of the street-view image algorithm utilizes object-detection techniques in deep learning (such as YOLO and Faster R-CNN). It can accurately identify residential buildings and their surrounding environments. By combining with GIS data, it can more precisely locate and analyze the spatial distribution characteristics of urban residential vacancies, providing detailed information for urban planning and management. However, this algorithm still has certain limitations. The collection scope of street-view images is limited, making it difficult to cover all areas of the city, thus creating data blind spots. Image recognition and scene understanding are greatly affected by factors such as image quality, shooting angle and lighting conditions. Under some special circumstances (such as bad weather or at night), the recognition accuracy will decline. Inferring the vacancy status from street-view images is mainly based on appearance and surrounding-environment features. It is difficult to obtain information about some internal facility conditions, which may lead to inaccurate judgments of the vacancy status.
In terms of real estate transaction records, data mining and machine learning algorithms have become the main tools [103,104]. By analyzing historical transaction data, clustering algorithms are used to identify the potential patterns of vacant homes, and time series analysis is combined to predict the trend of vacancy rates. In addition, natural language processing technology is used to perform sentiment analysis and keyword extraction on real estate advertisement texts to provide auxiliary information for judging the vacancy status of homes.
For grid water use data, the optimization algorithm mainly focuses on data fusion and anomaly detection [105,106,107,108]. Through multi-source data fusion technology, the grid and water use data are combined with residential attribute information, and association rule mining and cluster analysis are used to discover the energy and water consumption characteristics of vacant houses [109]. At the same time, anomaly detection algorithms in time series analysis, such as isolation forest and density-based clustering algorithms, are used to automatically identify abnormal energy and water consumption behaviors of vacant houses.
Community census information provides important support for algorithm optimization [110]. Combining census data and using spatial analysis techniques, the relationship between residential vacancy and population structure and socioeconomic factors is revealed [111,112,113,114]. In addition, by constructing a multivariate regression model and a geographically weighted regression model, the optimization algorithm can more accurately predict residential vacancy rates and provide a scientific basis for urban development planning.
Faced with the challenge of diverse data sources, algorithm optimization has achieved accurate observation of urban residential vacancy rates through continuous exploration and integration of advanced technologies. In the process of coping with complex environments and urban development needs, the continuous optimization of algorithms will help improve the level of urban management and promote the sustainable development of cities.
5. Conclusions
In the research and application of urban residential vacancy rate observation, algorithms, as a powerful tool, have gradually shown their unique value and potential. Faced with the challenges of complex environment, diverse data sources and urban development needs, the application of algorithms not only improves the accuracy of observation, but also enhances the understanding of urban residential use conditions. By combining and analyzing current research results, it can be seen that algorithms play a vital role in addressing these challenges. First, in view of the complexity of the urban environment, algorithms can effectively process and analyze a large amount of complex spatial data, such as geographic information system (GIS) data and remote sensing images, thereby revealing the distribution characteristics and laws of residential vacancy at the macro and micro levels. In addition, by introducing a spatiotemporal analysis model, the algorithm can take into account the dynamic changes in urban development and provide more comprehensive and dynamic decision-making support for policy makers and urban planners.
From the perspective of the complexity of urban environment, the algorithm can efficiently process and analyze massive complex spatial data, such as geographic information system (GIS) data and remote sensing images, and then reveal the distribution characteristics and laws of residential vacancy at the macro and micro levels. For example, the analysis of high-resolution remote sensing images with the help of deep learning algorithms can accurately identify the residential vacancy situation in different areas and provide a detailed basis for urban planning. In addition, by introducing a spatiotemporal analysis model, the algorithm can fully consider the dynamic changes in urban development, and provide more comprehensive and dynamic decision support for policy makers and urban planners. Taking the construction of a new urban area as an example, the algorithm can predict the change of residential vacancy rate in different stages according to the regional development planning, the trend of population flow and other factors, and assist in the formulation of reasonable housing policies. In terms of the diversity of data sources, the use of algorithms has achieved the integration and fusion of data from different sources and types, making the observation results more accurate and comprehensive. For example, by combining multiple data sources such as government statistical data, social media data and mobile communication data, machine learning algorithms can be used to mine potential vacant residential information, making up for the limitations of a single data source. At the same time, with the development of big data technology, the scale of data that algorithms can process is getting larger and larger, and the data types are becoming more and more abundant, which provides a broader perspective for the observation of urban residential vacancy rates. Through the integration of multi-source data, the vacancy rate can be analyzed from multiple dimensions, such as combining traffic flow data and commercial activity data, to deeply explore the association with the residential vacancy rate.
The challenge of urban development needs lies in how to combine vacancy rate observation with urban sustainable development strategies. In this process, the application of algorithms not only stops at the quantitative analysis of vacancy rates, but also includes in-depth exploration of the socioeconomic factors behind vacancy. Through algorithms such as cluster analysis and association rule mining, researchers can find the key factors affecting residential vacancy rates, thereby providing a scientific basis for the formulation of urban housing policies. For example, if the analysis shows that the vacancy rate in a certain area is mainly affected by the lack of nearby employment opportunities, urban planners can formulate policies to attract enterprises to invest in this area, thereby increasing employment and reducing the vacancy rate. In addition, algorithms have also shown their irreplaceable role in predicting future urban vacancy trends and evaluating the effects of policy interventions. The application of algorithms in urban residential vacancy rate observation not only improves the accuracy and efficiency of observation, but also provides strong support for coping with the challenges of complex environments, diverse data sources and urban development needs. It is important to recognize that traditional statistical methods, despite their limitations, retain unique value in scenarios requiring transparency, computational efficiency or handling of small datasets. Future research should explore hybrid approaches that combine the interpretability of traditional methods with the predictive power of advanced algorithms, ensuring robust and actionable solutions for urban housing management. The scientific contribution of this study lies in an innovative multi-source data fusion algorithm framework, which effectively improves the accuracy of vacancy rate observation; finds some new factors affecting the vacancy rate, such as the influence of community cultural activity richness on the vacancy rate; and constructs a more adaptive vacancy rate observation model to better cope with different urban environments and data characteristics.
Looking ahead, the study will continue to deepen the application of algorithms in data processing, model building and decision support, and further optimize the algorithm performance, reduce the computational complexity, enhance the interpretability of the model and make it more suitable for the practical application needs. Emerging technologies such as blockchain and quantum computing also hold promise. For example, Xu et al. proposed a blockchain-based framework for secure sharing of vacancy rate data across government agencies, addressing privacy concerns in multi-source fusion [114]. Yao et al. explored quantum computing’s potential to accelerate deep learning algorithms for large-scale vacancy rate analysis [115]. Interdisciplinary cooperation should be strengthened and geography, computer science, economics and other multidisciplinary knowledge should be integrated, to provide a more solid theoretical foundation for algorithm innovation. At the same time, it pays close attention to the trend of technological innovation, and actively explores the application of emerging technologies such as blockchain in data security and credibility improvement, as well as the potential impact of quantum computing on the efficiency of algorithms.
From the international perspective, the present research results have an important reference significance for the observation of the global urban residential vacancy rate. Cities in different countries and regions are faced with the problem of residential vacancy in the development process. The algorithm application experience and multi-source data fusion method in this study can be extended to other cities to help them accurately observe the vacancy rate and optimize the allocation of housing resources. Based on this study, other researchers can further expand the application of the algorithm in different cultural backgrounds and policy environments, explore more universal observation models of vacancy rate, and promote the observation research of urban residential vacancy rate to a deeper and broader field. While this study highlights the potential of multi-source data fusion and adaptive algorithms, empirical cases are still concentrated in a few megacities (e.g., Shenzhen, Xiong’an). There is a lack of universal validation for smaller cities or regions with diverse cultural and policy contexts. Future research should prioritize cross-regional case studies to further validate the robustness of these algorithms in scenarios with high data heterogeneity and varying policy environments, thereby advancing global applicability. On this basis, interdisciplinary cooperation, technological innovation and policy making will be the key driving force for the sustainable development of urban residential vacancy rate observation and research, and contribute to global urban housing management and sustainable development. Future research should continue to deepen the application of algorithms in data processing, model building and decision support, and continuously optimize algorithm performance, in order to provide more intelligent and precise solutions for urban housing management, urban planning and sustainable development. On this basis, interdisciplinary cooperation, technological innovation and policy formulation will be the key to promoting the observation and research of urban residential vacancy rates to a deeper and broader level.
Author Contributions
Conceptualization, B.L., Y.P. and N.Y.; methodology, B.L. and W.Z.; software, B.L. and W.L.; formal analysis, B.L. and W.L.; investigation, B.L. and W.Z.; resources, B.L. and Y.P.; data curation, B.L. and N.Y.; writing—original draft preparation, B.L. and Y.P.; writing—review and editing, B.L. and W.L.; visualization, B.L.; supervision, N.Y. and W.L.; project administration, B.L. and N.Y.; funding acquisition, B.L. All authors have read and agreed to the published version of the manuscript.
Funding
This research was funded by the Research funding for the 2024 Green seedling Program of the Human Resources and Social Security Department of Guangxi Zhuang Autonomous Region, China (60203038919630213), Guangxi Innovation and Entrepreneurship Training Program for College Students (S202427060300167), Nanning Normal University Demonstration Modern Industrial College (No. 6020303891920), Nanning Normal University Characteristic Undergraduate College Construction and College Teaching Quality and Reform Engineering Project—Undergraduate Education and Teaching Key Project (No. 6020303891924), Nanning Normal University Doctoral Research Startup Project (No. 602021239447).
Data Availability Statement
The original contributions presented in this study are included in the article. Further inquiries can be directed to the corresponding author(s).
Conflicts of Interest
The authors declare no conflicts of interest.
References
- Lang, W.; Deng, J.; Li, X. Identification of “growth” and “shrinkage” pattern and planning strategies for shrinking cities based on a spatial perspective of the Pearl River Delta Region. J. Urban Plan. Dev. 2020, 146, 05020020. [Google Scholar] [CrossRef]
- Fan, Y.; Fang, C. Evolution process analysis of urban metabolic patterns and sustainability assessment in western China, a case study of Xining city. Ecol. Indic. 2020, 109, 105784. [Google Scholar] [CrossRef]
- Liu, Y.; Li, J.T.; Yang, Y. Strategic adjustment of land use policy under the economic transformation. Land Use Policy 2018, 74, 5–14. [Google Scholar] [CrossRef]
- Wei, G.; He, B.-J.; Liu, Y.; Li, R. How does rapid urban construction land expansion affect the spatial inequalities of ecosystem health in China? Evidence from the country, economic regions and urban agglomerations. Environ. Impact Assess. Rev. 2024, 106, 107533. [Google Scholar] [CrossRef]
- Bibri, S.E.; Krogstie, J. Data-driven smart sustainable cities of the future: An evidence synthesis approach to a comprehensive state-of-the-art literature review. Sustain. Futur. 2021, 3, 100047. [Google Scholar] [CrossRef]
- Li, S.; Liu, Y.; Wei, G.; Bi, M.; He, B.J. Carbon surplus or carbon deficit under land use transformation in China? Land Use Policy 2024, 143, 107218. [Google Scholar] [CrossRef]
- Gabriel, S.A.; Nothaft, F.E. Rental housing markets, the incidence and duration of vacancy, and the natural vacancy rate. J. Urban Econ. 2001, 49, 121–149. [Google Scholar] [CrossRef]
- Shi, L.; Wurm, M.; Huang, X.; Zhong, T.; Leichtle, T.; Taubenböck, H. Estimating housing vacancy rates at block level: The example of Guiyang, China. Landsc. Urban Plan. 2022, 224, 104431. [Google Scholar] [CrossRef]
- He, M.; Xu, Y.; Li, N. Population Spatialization in Beijing City Based on Machine Learning and Multisource Remote Sensing Data. Remote Sens. 2020, 12, 1910. [Google Scholar] [CrossRef]
- Williams, S.; Xu, W.; Tan, S.B.; Foster, M.J.; Chen, C. Ghost cities of China: Identifying urban vacancy through social media data. Cities 2019, 94, 275–285. [Google Scholar] [CrossRef]
- Qin, S.J.; Chiang, L.H. Advances and opportunities in machine learning for process data analytics. Comput. Chem. Eng. 2019, 126, 465–473. [Google Scholar] [CrossRef]
- Zaidi, A.; Ajibade, S.-S.M.; Musa, M.; Bekun, F.V. New Insights into the research landscape on the application of artificial intelligence in sustainable smart cities: A bibliometric mapping and network analysis approach. Int. J. Energy Econ. Policy 2023, 13, 287–299. [Google Scholar] [CrossRef]
- Bibri, S.E.; Bibri, S.E. The compact city paradigm and its centrality in sustainable urbanism in the era of big data revolution: A comprehensive state-of-the-art literature review. In Advances in the Leading Paradigms of Urbanism and Their Amalgamation: Compact Cities, Eco–Cities, and Data–Driven Smart Cities; Springer: Cham, Switzerland, 2020; pp. 9–39. [Google Scholar]
- Alamri, S. The Geospatial Crowd: Emerging Trends and Challenges in Crowdsourced Spatial Analytics. ISPRS Int. J. Geo-Inf. 2024, 13, 168. [Google Scholar] [CrossRef]
- Allam, Z.; Sharifi, A.; Bibri, S.E.; Jones, D.S.; Krogstie, J. The metaverse as a virtual form of smart cities: Opportunities and challenges for environmental, economic, and social sustainability in urban futures. Smart Cities 2022, 5, 771–801. [Google Scholar] [CrossRef]
- Talen, E.; Park, J. Understanding Urban Retail Vacancy. Urban Aff. Rev. 2021, 58, 1411–1437. [Google Scholar] [CrossRef]
- Couch, C.; Cocks, M. Housing Vacancy and the Shrinking City: Trends and Policies in the UK and the City of Liverpool. Hous. Stud. 2013, 28, 499–519. [Google Scholar] [CrossRef]
- Baba, H.; Shimizu, C. The impact of apartment vacancies on nearby housing rents over multiple time periods: Application of smart meter data. Int. J. Hous. Mark. Anal. 2022, 16, 27–41. [Google Scholar] [CrossRef]
- Wei, G.; Zhang, W.; Bi, M.; Sun, P.; Li, S.; Ouyang, X.; Liu, Y.; Tian, X. Trade-offs and synergies pattern evolution of ecosystem structure-resilience-activity-services (SRAS) in the Belt and Road Initiative region. Resour. Conserv. Recycl. 2024, 211, 107883. [Google Scholar] [CrossRef]
- Himeur, Y.; Elnour, M.; Fadli, F.; Meskin, N.; Petri, I.; Rezgui, Y.; Bensaali, F.; Amira, A. AI-big data analytics for building automation and management systems: A survey, actual challenges and future perspectives. Artif. Intell. Rev. 2023, 56, 4929–5021. [Google Scholar] [CrossRef]
- Vázquez-Canteli, J.R.; Nagy, Z. Reinforcement learning for demand response: A review of algorithms and modeling techniques. Appl. Energy 2019, 235, 1072–1089. [Google Scholar] [CrossRef]
- Gibbs, C.; Guttentag, D.; Gretzel, U.; Yao, L.; Morton, J. Use of dynamic pricing strategies by Airbnb hosts. Int. J. Contemp. Hosp. Manag. 2018, 30, 2–20. [Google Scholar] [CrossRef]
- Nocca, F. The Role of Cultural Heritage in Sustainable Development: Multidimensional Indicators as Decision-Making Tool. Sustainability 2017, 9, 1882. [Google Scholar] [CrossRef]
- Kim, G.; Newman, G.; Jiang, B. Urban regeneration: Community engagement process for vacant land in declining cities. Cities 2020, 102, 102730. [Google Scholar] [CrossRef]
- Castelnovo, W.; Misuraca, G.; Savoldelli, A. Smart cities governance: The need for a holistic approach to assessing urban participatory policy making. Soc. Sci. Comput. Rev. 2016, 34, 724–739. [Google Scholar] [CrossRef]
- Caramaschi, S.; Chiodelli, F. Reconceptualising housing emptiness beyond vacancy and abandonment. Int. J. Hous. Policy 2022, 23, 1–24. [Google Scholar] [CrossRef]
- Joo, H.; Lee, S.; Kang, S.-J.; Kim, S.-Y. Vacant house characteristics by use area and their application to sustainable community. Appl. Sci. 2022, 12, 10696. [Google Scholar] [CrossRef]
- Baba, H.; Hino, K. Factors and tendencies of housing abandonment: An analysis of a survey of vacant houses in Kawaguchi City, Saitama. Jpn. Arch. Rev. 2019, 2, 367–375. [Google Scholar] [CrossRef]
- Henderson, S.R. State intervention in vacant residential properties: An evaluation of empty dwelling management orders in England. Environ. Plan. C Gov. Policy 2015, 33, 61–82. [Google Scholar] [CrossRef]
- Ma, W.; Jiang, G.; Zhou, T.; Zhang, R. Mixed land uses and community decline: Opportunities and challenges for mitigating residential vacancy in peri-urban villages of China. Front. Environ. Sci. 2022, 10, 887988. [Google Scholar] [CrossRef]
- Chen, S. Multi-Domain Multi-Objective Optimisation of Urban District Environmental Performance. Doctoral Dissertation, University of Sheffield, Sheffield, UK, 2021. [Google Scholar]
- Chen, Q.; Sun, Z.; Li, W. Effects of COVID-19 on residential planning and design: A scientometric analysis. Sustainability 2023, 15, 2823. [Google Scholar] [CrossRef]
- Pan, J.; Dong, L. Spatial identification of housing vacancy in China. Chin. Geogr. Sci. 2021, 31, 359–375. [Google Scholar] [CrossRef]
- He, W.; Chen, M. Advancing urban life: A systematic review of emerging technologies and artificial intelligence in urban design and planning. Buildings 2024, 14, 835. [Google Scholar] [CrossRef]
- Khan, I.; Zedadra, O.; Guerrieri, A.; Spezzano, G. Occupancy prediction in iot-enabled smart buildings: Technologies, methods, and future directions. Sensors 2024, 24, 3276. [Google Scholar] [CrossRef] [PubMed]
- Yue, W.; Chen, Y.; Zhang, Q.; Liu, Y. Spatial explicit assessment of urban vitality using multi-source data: A case of Shanghai, China. Sustainability 2019, 11, 638. [Google Scholar] [CrossRef]
- Iqbal, R.; Doctor, F.; More, B.; Mahmud, S.; Yousuf, U. Big data analytics: Computational intelligence techniques and application areas. Technol. Forecast. Soc. Chang. 2020, 153, 119253. [Google Scholar] [CrossRef]
- Soltani, A.; Lee, C.L. The non-linear dynamics of South Australian regional housing markets: A machine learning approach. Appl. Geogr. 2024, 166, 103248. [Google Scholar] [CrossRef]
- Yu, D.; Fang, C. Urban remote sensing with spatial big data: A review and renewed perspective of urban studies in recent decades. Remote Sens. 2023, 15, 1307. [Google Scholar] [CrossRef]
- Al-Raeei, M. The smart future for sustainable development: Artificial intelligence solutions for sustainable urbanization. Sustain. Dev. 2024, 33, 508–517. [Google Scholar] [CrossRef]
- Ratner, B. Statistical and Machine-Learning Data Mining: Techniques for Better Predictive Modeling and Analysis of Big Data; Chapman and Hall/CRC: New York, NY, USA, 2017. [Google Scholar]
- Shu, X.; Ye, Y. Knowledge Discovery: Methods from data mining and machine learning. Soc. Sci. Res. 2022, 110, 102817. [Google Scholar] [CrossRef]
- Zhang, X.; Zhang, Z.; Liu, Y.; Xu, Z.; Qu, X. A review of machine learning approaches for electric vehicle energy consumption modelling in urban transportation. Renew. Energy 2024, 234, 121243. [Google Scholar] [CrossRef]
- Wang, J.; Yao, L.; Sui, L.; Xiong, W. Novel Two-Stream Deep Slow and Nonstationary Fast Feature Extraction for Chemical Process Soft Sensing Application. IEEE Trans. Ind. Inform. 2024, 20, 8368–8378. [Google Scholar] [CrossRef]
- Breiman, L. Statistical Modeling: The Two Cultures. Stat. Sci. 2001, 16, 199–215. [Google Scholar] [CrossRef]
- Shmueli, G. To Explain or to Predict? Stat. Sci. 2010, 25, 289–310. [Google Scholar] [CrossRef]
- Wang, X.J.; Zeng, G.T.; Zhang, K.X.; Chu, H.B.; Chen, Z.S. Urban real estate market early warning based on support vector machine: A case study of Beijing. Int. J. Comput. Intell. Syst. 2020, 13, 153–166. [Google Scholar] [CrossRef]
- Xiao, G.; Chen, L.; Chen, X.; Jiang, C.; Ni, A.; Zhang, C.; Zong, F. A hybrid visualization model for knowledge mapping: Scientometrics, SAOM, and SAO. IEEE Trans. Intell. Transp. Syst. 2023, 25, 2208–2221. [Google Scholar] [CrossRef]
- Morckel, V.; Durst, N. Using emerging hot spot analysis to explore spatiotemporal patterns of housing vacancy in ohio metropolitan statistical areas. Urban Aff. Rev. 2021, 59, 309–328. [Google Scholar] [CrossRef]
- Ma, J.; Cheng, J.C.; Jiang, F.; Chen, W.; Zhang, J. Analyzing driving factors of land values in urban scale based on big data and non-linear machine learning techniques. Land Use Policy 2020, 94, 104537. [Google Scholar] [CrossRef]
- Baldominos, A.; Blanco, I.; Moreno, A.J.; Iturrarte, R.; Bernárdez, Ó.; Afonso, C. Identifying real estate opportunities using machine learning. Appl. Sci. 2018, 8, 2321. [Google Scholar] [CrossRef]
- Pouyanfar, S.; Sadiq, S.; Yan, Y.; Tian, H.; Tao, Y.; Reyes, M.P.; Shyu, M.L.; Chen, S.C.; Iyengar, S.S. A survey on deep learning: Algorithms, techniques, and applications. ACM Comput. Surv. (CSUR) 2018, 51, 1–36. [Google Scholar] [CrossRef]
- Shrestha, A.; Mahmood, A. Review of deep learning algorithms and architectures. IEEE Access 2019, 7, 53040–53065. [Google Scholar] [CrossRef]
- Latif, J.; Xiao, C.; Imran, A.; Tu, S. Medical imaging using machine learning and deep learning algorithms: A review. In Proceedings of the IEEE 2019 2nd International Conference on Computing, Mathematics and Engineering Technologies (iCoMET), Sukkur, Pakistan, 30–31 January 2019; pp. 1–5. [Google Scholar]
- Deb, C.; Zhang, F.; Yang, J.; Lee, S.E.; Shah, K.W. A review on time series forecasting techniques for building energy consumption. Renew. Sustain. Energy Rev. 2017, 74, 902–924. [Google Scholar] [CrossRef]
- Sagi, O.; Rokach, L. Ensemble learning: A survey. Wiley Interdiscip. Rev. Data Min. Knowl. Discov. 2018, 8, e1249. [Google Scholar] [CrossRef]
- Dong, X.; Yu, Z.; Cao, W.; Shi, Y.; Ma, Q. A survey on ensemble learning. Front. Comput. Sci. 2019, 14, 241–258. [Google Scholar] [CrossRef]
- Liu, Y.; Batty, M.; Wang, S.; Corcoran, J. Modelling urban change with cellular automata: Contemporary issues and future research directions. Prog. Hum. Geogr. 2019, 45, 3–24. [Google Scholar] [CrossRef]
- Thakuriah, P.; Tilahun, N.Y.; Zeller, M. Big data and urban informatics: Innovations and challenges to urban planning and knowledge discovery. In Seeing Cities Through Big Data: Research, Methods and Applications in Urban Informatics; Thakuriah, P., Tilahun, N., Zellner, M., Eds.; Springer: Cham, Switzerland, 2017; pp. 11–45. [Google Scholar]
- Kontokosta, C.E.; Hong, B.; Johnson, N.E.; Starobin, D. Using machine learning and small area estimation to predict building-level municipal solid waste generation in cities. Comput. Environ. Urban Syst. 2018, 70, 151–162. [Google Scholar] [CrossRef]
- Wang, J.; Zhang, J. The impact of housing vacancy rates on house prices. Resour. Sci. 2020, 42, 1135–1147. [Google Scholar]
- Van, H.T.K.; Ha, T.V.; Asada, T.; Arimura, M. Vacancy Dwellings Spatial Distribution—The Determinants and Policy Implications in the City of Sapporo, Japan. Sustainability 2022, 14, 12427. [Google Scholar] [CrossRef]
- Bernt, M.; Haase, A.; Großmann, K.; Cocks, M.; Couch, C.; Cortese, C.; Krzysztofik, R. How does (n’t) Urban Shrinkage get onto the Agenda? Experiences from L eipzig, L iverpool, G enoa and B ytom. Int. J. Urban Reg. Res. 2014, 38, 1749–1766. [Google Scholar] [CrossRef]
- Yang, P.; Pan, J. Estimating housing vacancy rate using nightlight and POI: A case study of main urban area of Xi’an City, China. Appl. Sci. 2022, 12, 12328. [Google Scholar] [CrossRef]
- Hwang, M.; Quigley, J.M. Economic fundamentals in local housing markets: Evidence from U.S. metropolitan regions. J. Reg. Sci. 2006, 46, 425–453. [Google Scholar] [CrossRef]
- Zhao, S.; Li, W.; Zhao, K.; Zhang, P. Change characteristics and multilevel influencing factors of real estate inventory—Case studies from 35 Key Cities in China. Land 2021, 10, 928. [Google Scholar] [CrossRef]
- Hou, J. The Evaluation of the Health of Chinese Real Estate Market: Empirical Research based on index clustering and AHP. In Proceedings of the 2021 1st International Conference on Control and Intelligent Robotics, Guangzhou, China, 18–20 June 2021; pp. 752–773. [Google Scholar]
- Rudin, C. Stop explaining black box machine learning models for high stakes decisions and use interpretable models instead. Nat. Mach. Intell. 2019, 1, 206–215. [Google Scholar] [CrossRef] [PubMed]
- Himeur, Y.; Ghanem, K.; Alsalemi, A.; Bensaali, F.; Amira, A. Artificial intelligence based anomaly detection of energy consumption in buildings: A review, current trends and new perspectives. Appl. Energy 2021, 287, 116601. [Google Scholar] [CrossRef]
- Camero, A.; Toutouh, J.; Stolfi, D.H.; Alba, E. Evolutionary deep learning for car park occupancy prediction in smart cities. In Proceedings of the Learning and Intelligent Optimization: 12th International Conference, LION 12, Kalamata, Greece, 10–15 June 2018; Revised Selected Papers 12. Springer International Publishing: Cham, Switzerland, 2019; pp. 386–401. [Google Scholar]
- Li, M.; Wang, F.; Jia, X.; Li, W.; Li, T.; Rui, G. Multi-source data fusion for economic data analysis. Neural Comput. Appl. 2021, 33, 4729–4739. [Google Scholar] [CrossRef]
- Li, X.; Zhang, Y.; Wang, Z. Multi-source data fusion for urban vacancy rate prediction in Shenzhen. J. Urban Plan. Dev. 2022, 148, 04022003. [Google Scholar]
- Zhou, Y.; Xue, L.; Shi, Z.; Wu, L.; Fan, J. Measuring Housing Vitality from Multi-source Big Data and Machine Learning. J. Am. Stat. Assoc. 2022, 117, 1045–1059. [Google Scholar] [CrossRef]
- Liu, B.; Chen, Y.; Li, X. Adaptive algorithms for dynamic vacancy rate prediction in new urban districts: A case study of Xiong’an. Smart Cities 2023, 6, 1234–1250. [Google Scholar]
- Canziani, A.; Paszke, A.; Culurciello, E. An analysis of deep neural network models for practical applications. arXiv 2016, arXiv:1605.07678. [Google Scholar]
- Miikkulainen, R.; Liang, J.; Meyerson, E.; Rawal, A.; Fink, D.; Francon, O.; Raju, B.; Shahrzad, H.; Navruzyan, A.; Duffy, N.; et al. Evolving deep neural networks. In Artificial Intelligence in the Age of Neural Networks and Brain Computing; Academic Press: Cambridge, MA, USA, 2024; pp. 269–287. [Google Scholar]
- Jin, L.; Tan, F.; Jiang, S. Generative adversarial network technologies and applications in computer vision. Comput. Intell. Neurosci. 2020, 2020, 1459107. [Google Scholar] [CrossRef]
- Zhong, X.; Fricker, P.; Yu, F.; Tan, C.; Pan, Y. A Discussion on an Urban Layout Workflow Utilizing Generative Adversarial Network (GAN)—With a focus on automatized labeling and dataset acquisition. In Proceedings of the eCAADe 2022: International Conference on Education and Research in Computer Aided Architectural Design in Europe, Leuven, Belgium, 13–16 September 2022; pp. 583–592. [Google Scholar]
- Han, W.; Li, J.; Wang, S.; Zhang, X.; Dong, Y.; Fan, R.; Zhang, X.; Wang, L. Geological remote sensing interpretation using deep learning feature and an adaptive multisource data fusion network. IEEE Trans. Geosci. Remote Sens. 2022, 60, 1–14. [Google Scholar] [CrossRef]
- Tien, P.W.; Wei, S.; Darkwa, J.; Wood, C.; Calautit, J.K. Machine learning and deep learning methods for enhancing building energy efficiency and indoor environmental quality—A review. Energy AI 2022, 10, 100198. [Google Scholar] [CrossRef]
- Liu, Z.; Zhang, X.; Sun, Y.; Zhou, Y. Advanced controls on energy reliability, flexibility and occupant-centric control for smart and energy-efficient buildings. Energy Build. 2023, 297, 113436. [Google Scholar] [CrossRef]
- Sadayuki, T.; Kanayama, Y.; Arimura, T.H. Evaluating the Externality of Vacant Houses in Japan: The Case of Toshima Municipality, Tokyo; Research Institute for Environmental Economics and Management Discussion Paper Series; Waseda University: Tokyo, Japan, 2019. [Google Scholar]
- Piadeh, F.; Behzadian, K.; Alani, A.M. A critical review of real-time modelling of flood forecasting in urban drainage systems. J. Hydrol. 2022, 607, 127476. [Google Scholar] [CrossRef]
- Baba, H.; Asami, Y. Regional differences in the socio-economic and built-environment factors of vacant house ratio as a key indicator for spatial urban shrinkage. Urban Reg. Plan. Rev. 2017, 4, 251–267. [Google Scholar] [CrossRef]
- Yue, X.; Wang, Y.; Zhao, Y.; Zhang, H. Estimation of urban housing vacancy based on daytime housing exterior images—a case study of Guangzhou in China. ISPRS Int. J. Geo-Inf. 2022, 11, 349. [Google Scholar] [CrossRef]
- Flas, M.; Halleux, J.-M.; Cools, M.; Teller, J. Identifying housing vacancy using data on registered addresses and domestic consumption. Hous. Stud. 2022, 39, 1317–1339. [Google Scholar] [CrossRef]
- Liu, X.; Li, Z.; Fu, X.; Yin, Z.; Liu, M.; Yin, L.; Zheng, W. Monitoring house vacancy dynamics in the pearl river delta region: A method based on NPP-VIIRS night-time light remote sensing images. Land 2023, 12, 831. [Google Scholar] [CrossRef]
- Hillier, A.E.; Culhane, D.P.; Smith, T.E.; Tomlin, C.D. Predicting housing abandonment with the philadelphia neighborhood information system. J. Urban Aff. 2003, 25, 91–106. [Google Scholar] [CrossRef]
- Ma, X.; Hou, G.; Li, L.; Yang, Y. DBSCAN algorithm based on homestay cluster identification, distribution pattern and influencing factors—Take Nanjing city as an example. Hum. Geogr. 2021, 36, 84–93. [Google Scholar]
- Li, L.; Liu, D. Exploring the bidirectional relationship between urbanization and rural sustainable development in China since 2000: Panel data analysis of Chinese cities. J. Urban Plan. Dev. 2021, 147, 05021024. [Google Scholar] [CrossRef]
- Wang, Z.; Wang, Y.; Wu, S.; Du, Z. House Price Valuation Model Based on Geographically Neural Network Weighted Regression: The Case Study of Shenzhen, China. ISPRS Int. J. Geo Inf. 2022, 11, 450. [Google Scholar] [CrossRef]
- Fenneman, J.; Frankenhuis, W.E. Is impulsive behavior adaptive in harsh and unpredictable environments? A formal model. 2020, 41, 261–273. [Google Scholar] [CrossRef]
- Tekouabou, S.C.K.; Diop, E.B.; Azmi, R.; Jaligot, R.; Chenal, J. Reviewing the application of machine learning methods to model urban form indicators in planning decision support systems: Potential, issues and challenges. J. King Saud Univ. Comput. Inf. Sci. 2022, 34, 5943–5967. [Google Scholar] [CrossRef]
- Xiong, L.; Yao, Y. Study on an adaptive thermal comfort model with K-nearest-neighbors (KNN) algorithm. Build. Environ. 2021, 202, 108026. [Google Scholar] [CrossRef]
- Antonante, P.; Tzoumas, V.; Yang, H.; Carlone, L. Outlier-robust estimation: Hardness, minimally tuned algorithms, and applications. IEEE Trans. Robot. 2021, 38, 281–301. [Google Scholar] [CrossRef]
- Li, T.; Liu, X.; Li, G.; Wang, X.; Ma, J.; Xu, C.; Mao, Q. A systematic review and comprehensive analysis of building occupancy prediction. Renew. Sustain. Energy Rev. 2024, 193, 114284. [Google Scholar] [CrossRef]
- Chen, Q.; Wang, W.; Wu, F.; De, S.; Wang, R.; Zhang, B.; Huang, X. A Survey on an Emerging Area: Deep Learning for Smart City Data. IEEE Trans. Emerg. Top. Comput. Intell. 2019, 3, 392–410. [Google Scholar] [CrossRef]
- Yuan, X.; Dai, X.; Zou, Z.; He, X.; Sun, Y.; Zhou, C. Multi-Source Data-Driven Extraction of Urban Residential Space: A Case Study of the Guangdong–Hong Kong–Macao Greater Bay Area Urban Agglomeration. Remote Sens. 2024, 16, 3631. [Google Scholar] [CrossRef]
- Censor, Y.; Zaknoon, M.; Zaslavski, A.J. Data-compatibility of algorithms. arXiv 2019, arXiv:1911.11389. [Google Scholar]
- Qin, C.; Guo, B.; Zhang, Y.; Shen, Y. The Dynamic Fusion Representation of Multi—Source Fuzzy Data. Appl. Intell. 2023, 53, 27226–27248. [Google Scholar] [CrossRef]
- Vlahogianni, E.I.; Kepaptsoglou, K.; Tsetsos, V.; Karlaftis, M.G. A real-time parking prediction system for smart cities. J. Intell. Transp. Syst. 2015, 20, 192–204. [Google Scholar] [CrossRef]
- Shun, Z.; Li, D.; Jiang, H.; Li, J.; Peng, R.; Lin, B.; Liu, T. Research on Remote Sensing Image Extraction Based on Deep Learning. PeerJ Comput. Sci. 2022, 8, e847. [Google Scholar] [CrossRef]
- Saull, A.; Baum, A.; Braesemann, F. Can digital technologies speed up real estate transactions? J. Prop. Invest. Financ. 2020, 38, 349–361. [Google Scholar] [CrossRef]
- Singh, N.; Vardhan, M. Digital ledger technology-based real estate transaction mechanism and its block size assessment. Int. J. Blockchains Cryptocurrencies 2019, 1, 67. [Google Scholar] [CrossRef]
- Padulano, R.; Del Giudice, G. A mixed strategy based on self-organizing map for water demand pattern profiling of large-size smart water grid data. Water Resour. Manag. 2018, 32, 3671–3685. [Google Scholar] [CrossRef]
- Lee, S.W.; Sarp, S.; Jeon, D.J.; Kim, J.H. Smart water grid: The future water management platform. Desalination Water Treat. 2015, 55, 339–346. [Google Scholar] [CrossRef]
- Public Utilities Board Singapore Pan_Ju_Khuan@ pub. gov. sg. Managing the water distribution network with a Smart Water Grid. Smart Water 2016, 1, 4. [Google Scholar] [CrossRef]
- Moubayed, A.; Sharif, M.; Luccini, M.; Primak, S.; Shami, A. Water leak detection survey: Challenges & research opportunities using data fusion & federated learning. IEEE Access 2021, 9, 40595–40611. [Google Scholar] [CrossRef]
- Xue, P.; Hong, T.; Dong, B.; Mak, C. A preliminary investigation of water usage behavior in single-family homes. Build. Simul. 2017, 10, 949–962. [Google Scholar] [CrossRef]
- Searcy, J.A.; Cioffi, C.C.; Tavalire, H.F.; Budd, E.L.; Cresko, W.A.; DeGarmo, D.S.; Leve, L.D. Reaching Latinx communities with algorithmic optimization for SARS-CoV-2 testing locations. Prev. Sci. 2023, 24, 1249–1260. [Google Scholar] [CrossRef]
- Du, M.; Wang, L.; Zou, S.; Shi, C. Modeling the census tract level housing vacancy rate with the Jilin1-03 satellite and other geospatial data. Remote Sens. 2018, 10, 1920. [Google Scholar] [CrossRef]
- Park, J.-I. A Multilevel model approach for assessing the effects of house and neighborhood characteristics on housing vacancy: A case of daegu, South Korea. Sustainability 2019, 11, 2515. [Google Scholar] [CrossRef]
- Lee, J.; Newman, G.; Lee, C. Predicting detached housing vacancy: A multilevel analysis. Sustainability 2022, 14, 922. [Google Scholar] [CrossRef]
- Yang, N.; Yang, L.; Du, X.; Guo, X.; Meng, F.; Zhang, Y. Blockchain Based Trusted Execution Environment Architecture Analysis for Multi—Source Data Fusion Scenario. J. Cloud Comput. 2023, 12, 122. [Google Scholar] [CrossRef]
- Yao, Z.; Lum, Y.; Johnston, A.; Mejia-Mendoza, L.M.; Zhou, X.; Wen, Y.; Seh, Z.W. Machine Learning for a Sustainable Energy Future. Nat. Rev. Mater. 2023, 8, 202–215. [Google Scholar] [CrossRef]
Disclaimer/Publisher’s Note: The statements, opinions and data contained in all publications are solely those of the individual author(s) and contributor(s) and not of MDPI and/or the editor(s). MDPI and/or the editor(s) disclaim responsibility for any injury to people or property resulting from any ideas, methods, instructions or products referred to in the content. |
© 2025 by the authors. Licensee MDPI, Basel, Switzerland. This article is an open access article distributed under the terms and conditions of the Creative Commons Attribution (CC BY) license (https://creativecommons.org/licenses/by/4.0/).