Abstract
Electric vehicles can serve as controllable loads, storing energy during off-peak periods and acting as generation units during peak periods or periods with high electricity prices. They function as distributed generation resources within distribution systems, requiring controlled charging and discharging of batteries. In this paper, we address the problem of the optimal allocation of parking lots within a distribution system to efficiently supply electric vehicle loads. The goal is to determine the best capacity and size of parking lots to meet peak hour demands while considering constraints on the permanent operation of the distribution system. Using the particle swarm optimization (PSO) algorithm, the study maximizes total benefits, taking into account network parameters, vehicle data, and market prices. Results show that installing parking lots could be economically profitable for distribution companies and could improve voltage profiles.
1. Introduction
In recent times, various challenges, such as environmental concerns, dwindling fuel resources, volatile fuel prices, and the necessity to reduce reliance on fossil fuels, have led to the recognition of electric vehicles (EVs) as a valuable asset in both transportation and power systems []. The concept of a smart grid, as highlighted by [], revolves around environmental conservation and incorporates elements like renewable energy sources (such as wind and solar power), demand response systems, and distributed generation technologies like EVs. This approach aims to optimize asset utilization, ensure reliable system operation, and offer greater choice to consumers.
The research by Markel and Bennion [] demonstrates that vehicles are parked for approximately 93–96% of the day, making them available for alternative uses such as serving as storage devices for the grid. This availability, combined with the increasing need for cost-effective energy storage solutions in the power system, suggests that EVs could be utilized as limited energy resources in the power system []. In addition to serving as storage devices, EVs can also be used as controllable loads. This means they can be operated as batteries to store energy during off-peak periods and as generation units during peak periods or intervals with high electricity prices. Despite their limited power output, EVs can still be a valuable distributed generation (DG) resource for V2G (vehicle-to-grid) technology implementation in smart grids.
DG technologies offer many economic and technical benefits, as highlighted in the work in [,]. However, these benefits can only be maximized when the optimal sizes and locations of DG units are determined. Sound decision-making in this regard can provide benefits to the distribution network, suppliers, and customers alike.
Optimal allocation of parking lots [,,,], as a new type of distributed generation (DG), should be prioritized alongside other resources for electricity generation. One of the key distinctions between parking lots and other traditional distributed generators (DGs) is the stochastic nature of their output. Due to the stochastic nature of EV owners’ behavior, the output of parking lots is also stochastic. Parking lots serve as charging stations for EVs for driving purposes. Parking lots function as storage devices, storing electrical power in the batteries of vehicles during times of low electricity prices and delivering power to the distribution system during times of high electricity prices.
High penetrations of distribution-connected storage devices or plug-in vehicles can have adverse impacts on the grid due to their charging loads, which are often randomly located or unmanaged additions. However, the optimal allocation of parking lots can help mitigate these issues by reducing network losses, improving voltage profiles, and consequently bringing economic benefits for the distribution system company (DISCO).
1.1. Research Objectives
The objectives of this research study are as follows:
- To determine the optimal location and size of parking lots to meet the demand of EV owners at peak time;
- To improve the distribution system voltage profile;
- To provide increased economic benefit to the distribution system.
1.2. Related Works
In the literature, various methods have been employed to solve the problem of locating parking lots. These methods can be broadly categorized into optimization, metaheuristics, machine learning, and game theory.
Optimization models are the most popular method used for EV parking lot allocation problems. Algafri et al. [] addressed smart city charging station allocation for electric vehicles using analytic hierarchy process and multi-objective goal programming. The primary objective is to assign electric vehicles to the most suitable charging stations, taking into account four objectives: maximizing the energy requested by electric vehicles, minimizing total response time, reducing charging costs, and minimizing battery degradation. Several factors, such as travel distance, state of charge, grid-to-vehicle energy trading, time, road traffic, driver priorities, and charging station capacity, are taken into account to address this problem. Tan et al. [] study a multi-agent system for electric vehicle charging scheduling in parking lots. Casella, Ferro, and Robba [] propose a decentralized optimization approach to the power management of electric vehicle parking lots.
Metaheuristics are the second commonly reported method to address the parking lot allocation and sizing problem. A model for multi-objective site selection of electric vehicle charging stations based on the Non-Dominated Sorting Genetic Algorithm (NSGA)-II is proposed by Zhang and Shi []. A multi-objective neural network algorithm (MONNA) for the optimal location of electric vehicle charging infrastructure in Tunis city is presented in Mehouachi et al. []. In El-Zonkoly and Santos Coelho [], a multi-objective algorithm based on the artificial bee colony (ABC) and firefly algorithms is proposed to optimally determine the number of parking lots to be allocated for plug-in hybrid electric vehicles (PHEVs) in a distribution system is proposed. In Fathy and Abdelaziz [], Gray Wolf Optimizer for optimal sizing and siting of energy storage systems in electric distribution networks is investigated. Kempton and Tomic [] present a method based on calculating the probability of electric vehicles (EVs) entering each parking lot for the long-term planning of EV parking lots. Ahmadi et al. [] perform optimal allocation of EV parking lots and DG in a micro grid using a two-stage genetic algorithm and particle swarm optimization (GA-PSO). Ferraz et al. [] developed a multi-objective optimization approach for the allocation of electric vehicle parking lots and smart charging with distributed energy resources. Kumar et al. [] performs hybrid genetic algorithm-simulated annealing-based electric vehicle charging station placement for optimizing distribution network resilience. Duan et al. [] proposes an improved metaheuristic method based on fire hawks for the optimization of electric vehicle parking lots in a distribution network. Amini and Islam [] studies the reliability-constraint allocation of EV parking lots is a radial distribution network. A genetic algorithm is utilized to achieve the best allocation of parking lots. The numerical results show that distribution feeders with no residential and commercial customers are not feasible to allocate parking lots. Shaheen et al. [] performs optimal electric vehicle charging and discharging scheduling using metaheuristic algorithms and proposes a V2G approach for cost reduction and grid support.
Machine learning models for parking lot allocation have also gained traction in recent years. Ding, Gan, and Shaker [] perform optimal management of parking lots using big data for electric vehicles via internet of things and Long Short-term Memory. Shariatzadeh et al. [] address charging scheduling in a workplace parking lot and develop bi-objective optimization approaches through predictive analytics of electric vehicle users’ charging behavior. Shahriar et al. [] provide a review on machine learning approaches for EV charging behavior. Varone et al. [] models solar parking lot management and proposes an IoT platform for smart charging EV fleets, using real-time data and production forecasts. Pourvaziri et al. [] develops an integrated deep learning and queueing theory approach for the planning of electric vehicle charging stations. Guo et al. [] designs a reinforcement learning-based intelligent car transfer planning system for parking lots.
Game theory is the fourth most popular method for EV parking lot allocation and sizing. Adil et al. [] perform optimal location and pricing of electric vehicle charging stations using machine learning and Stackelberg game. Lv et al. [] proposes a decision framework for improving the service quality of charging stations based on online reviews and evolutionary game theory. Boateng et al. [] develops a dynamic pricing and reservation-based framework leveraging multi-agent reinforcement learning in automated valet parking and charging. Abbasi et al. [] proposes a coupled game theory and Lyapunov optimization approach to electric vehicle charging at fast charging stations. Morais [] proposes a new approach for electric vehicle charging management in parking lots considering fairness rules. Kempton [] presents a new approach based on “EV owners’ welfare” that is proposed to determine the optimal number, location and capacity of each electric vehicle (EV) parking lot to maximize the profit of electrical distribution companies. Ref. Jannati-Oskuee et al. [] performed risk-based joint flexible distribution network expansion planning and allocation of EV parking lots using information gap decision theory (IGDT).
In this paper, we address V2G systems and propose a PSO-based approach to address the EV parking lot allocation and sizing problem. PSO is valued for its simplicity, ease of implementation, and its effectiveness in handling non-convex and multi-modal optimization challenges. However, it can sometimes face issues with premature convergence, where particles settle on a suboptimal solution without thoroughly exploring the full search space.
The rest of this paper is organized as follows. In Section 2, the mathematical model is presented. Section 3 presents the solution approach. In Section 4, a case study using the proposed approach is provided. In Section 5, a comparison of model results with other approaches available in the literature is performed. Conclusions and recommendations for future works are presented in Section 6.
2. Mathematical Model
The primary aim of the proposed model is to identify suitable locations and optimal sizes for EV parking lots by maximizing the objective function [,]. It consists of 5 cost functions that are homogenized based on weighted values as shown in Equation (1).
2.1. Objective Function
2.1.1. Charging Time of an EV
The charging time of an electric car depends on several factors, including the battery capacity, the charging power, and the initial state of charge of the battery. The charging time for full charging of an EV as a function of initial state of charge (SOC) can be calculated as Equation (2).
where is the initial SOC of the vehicle i, is the battery capacity of EV i, and is the power rate with which EV is charged. We are considering three levels of SOC for batteries, as depicted in Table 1, and the parking lot’s input–output power will exhibit three stages, similar to the illustration in Figure 1 [].
Table 1.
Initial SOC of available vehicles in the parking lot.
Figure 1.
Input–output power modeling of the parking lots.
It is worth noting that the charging process does not always happen at a constant rate. Typically, charging follows a curve where the speed is faster when the battery’s SOC is low, and it slows down as the battery approaches full capacity. This adjustment in charging speed is managed by the battery management system to ensure the battery’s health and safety are optimized. Moreover, certain electric vehicles are compatible with different charging speeds, including slower AC charging and faster DC fast charging. The charging duration can vary significantly based on the type of charging station and the capabilities of the EV. With advancements in EV technology, enhancements in charging infrastructure, and progress in battery chemistry, it is probable that charging times for electric vehicles will further improve.
2.1.2. Output Power of the EV Parking Lot
The output power of the EV parking lot is equal to
where represents the power rate at which the EV is charged, n represents the number of available vehicles in the parking lot, and denotes the total electrical power that the parking lot can supply to the connected vehicles. This capacity is determined by the parking lot’s charging capacity and the number of charging connectors it possesses. The charging capacity indicates the maximum power that the charging station can deliver at any given moment. This capacity may vary depending on factors such as the type of charging station (AC or DC fast charging), the capabilities of the charging infrastructure, and constraints within the local electrical grid.
For example, if you have a DC fast charging station with a charging capacity of 150 kW and it has two charging connectors, the total output power of the station would be
Output Power = 150 kW × 2 = 300 kW
This means that the station can deliver a maximum of 300 kilowatts of power to the connected electric vehicles simultaneously.
It is important to consider that although the charging station has a specific output power capacity, individual vehicles may not always draw the maximum available power. The charging rate of each EV is influenced by factors such as the capabilities of the vehicle’s onboard charger, the battery’s state of charge, and the power supply of the charging station. As a result, the actual charging rate of each vehicle may be lower than the station’s maximum output power.
2.1.3. Revenues of EVs
The profit made by parking lots from selling charging services to electric vehicles is calculated as
where is the total revenue gained from the parking lot, is the total time that the V2G power is dispatched, and is the market price of electricity at peak time.
2.1.4. Required Costs
The cost of vehicle-to-grid (V2G) power consists of three components: purchased energy, wear, and capital costs. The purchased energy and wear costs for V2G are additional expenses required specifically for V2G, not for driving. Similarly, the capital cost represents the expense of additional equipment necessary for V2G, distinct from the primary function of vehicles, which is transportation. In addition to the cost of V2G power, this section also models the cost of purchased energy for driving purposes [].
- 1.
- Capital cost of parking lot:
- 2.
- Cost of purchased energy to charge EVs for driving
- 3.
- Cost of purchased EV charging energy to charge vehicles for V2G power
The value of represents the energy cost purchased and is calculated using the following equation:
where is the cost of equipment degradation due to the extra use for V2G, and is the efficiency of the inverter.
2.1.5. Loss Mitigation Benefit
The power loss in the distribution system varies due to the output power of parking lots. Therefore, the cost of system loss can be evaluated using the following expression:
where
where represents the cost of electricity at load level j, is the network loss at load level j without V2G, is the network loss at load level j with V2G, is the resistance of branch b, and is the current of branch b at time interval j. The time denotes the required time for full charging of an EV at iteration k.
2.2. Constraints
The objective function is a maximized subject to three inequality constraints, which are described as follows:
- 1.
- Distribution line capacity limit. The power flow through the lines must be below the maximum permitted power of the lines due to the line’s thermal capacity.
- 2.
- Voltage drops limit. The voltage of each bus should be in the range of minimum and maximum voltages.
- 3.
- Vehicle limit in each parking lot. The capacity of each parking lot in a specific area is constrained by the number of EVs in that area. This constraint can be expressed as follows:
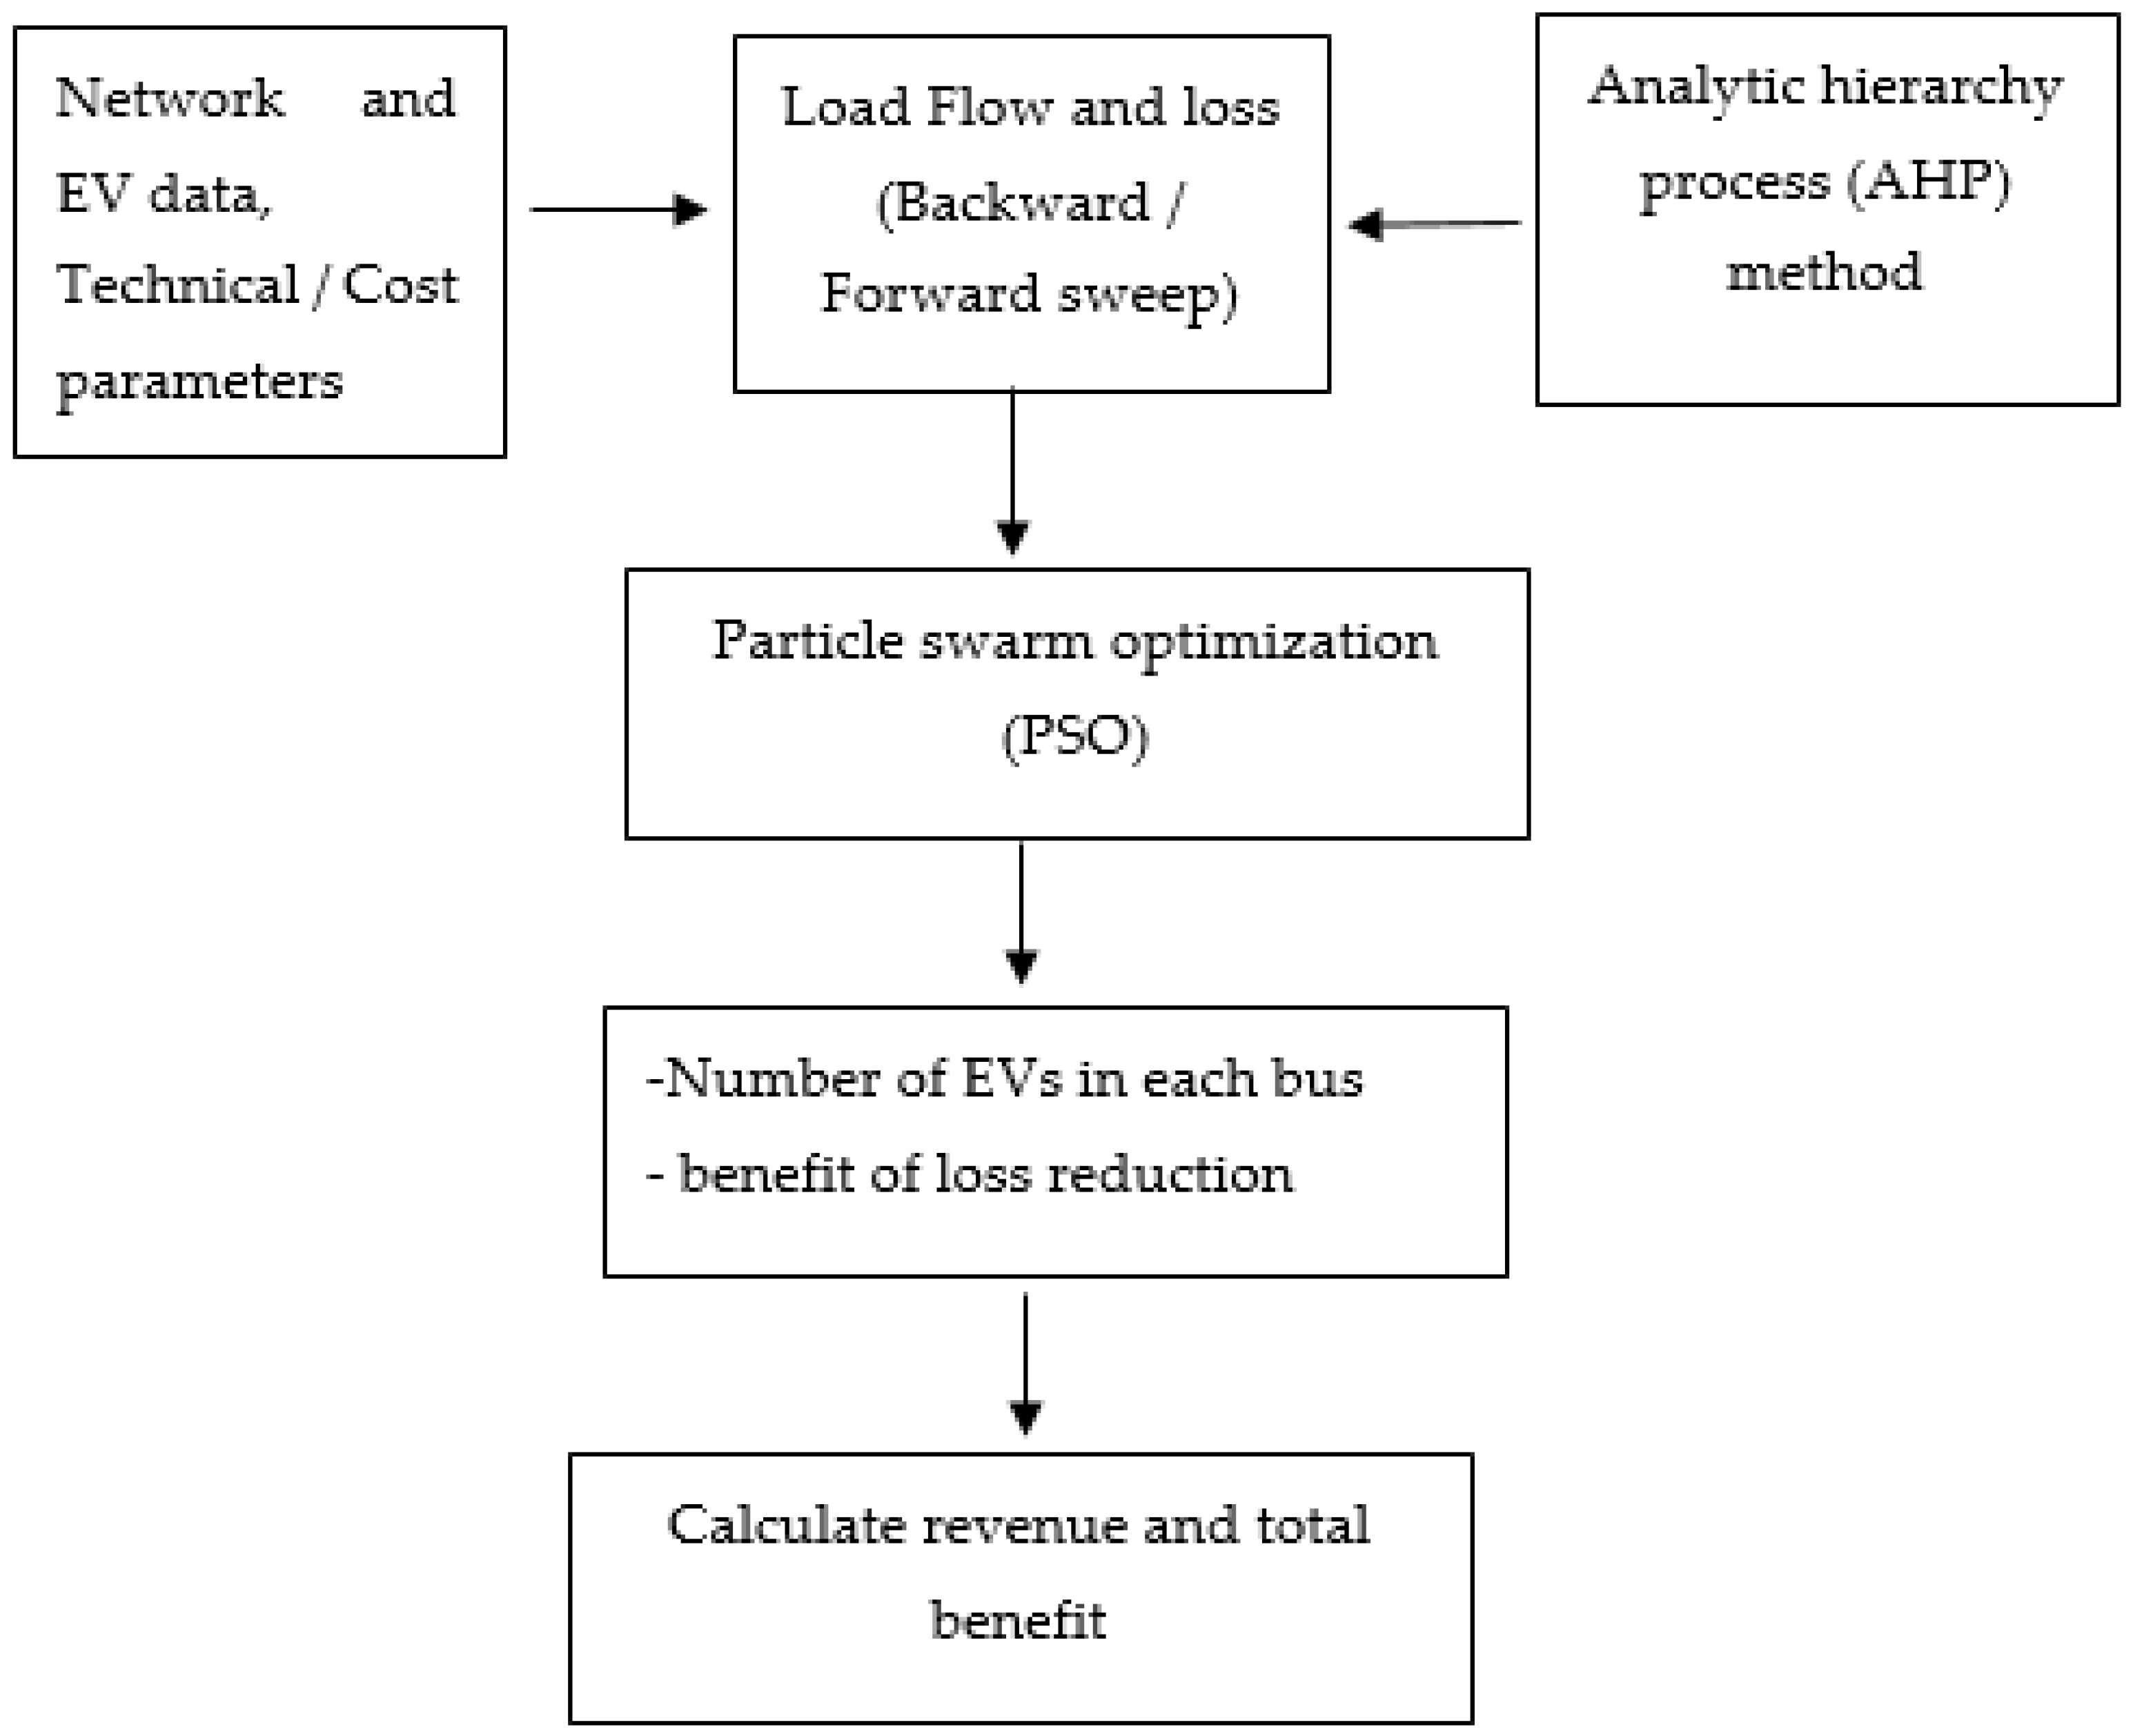
3. Solution Approach
Figure 2 presents the various steps of the proposed solution approach. In the first step, data are collected for the network, EVs, technical parameters, and cost. The AHP (analytic hierarchy process) method is then used to determine the weight of the costs and the revenue criteria. Following this, the backward/forward sweep power flow method is used to calculate power losses in the distribution network. The particle swarm optimization (PSO) algorithm is then employed to determine the number of electric vehicles in each bus and reduce the losses. Finally, the revenue is calculated, which is net income minus the required cost, and at the end, the total benefit is computed. The model was built using Python.
Figure 2.
Different phases in the suggested solution approach.
3.1. Assumptions
In order to allocate parking lots, some assumptions [,,] are taken into account as follows:
- This study assumes that the distribution company is responsible for supplying customer demand, installing parking lots, and controlling the charging and discharging of EV batteries. DISCO aims to fulfill these responsibilities while minimizing costs and improving the quality and reliability of customer service.
- It is important to note that in calculating profits, the study assumes that DISCO does not receive compensation from EV owners for battery charging required for driving purposes. Additionally, any vehicle degradation costs due to vehicle-to-grid (V2G) operations are covered by DISCO and paid to EV owners. These assumptions are made to incentivize EV owners to park their vehicles in the parking lot during days with high-priced peak electricity.
- All vehicles are assumed to be charged and discharged at their maximum charging rate. It is important to note that this assumption is common in several EV studies.
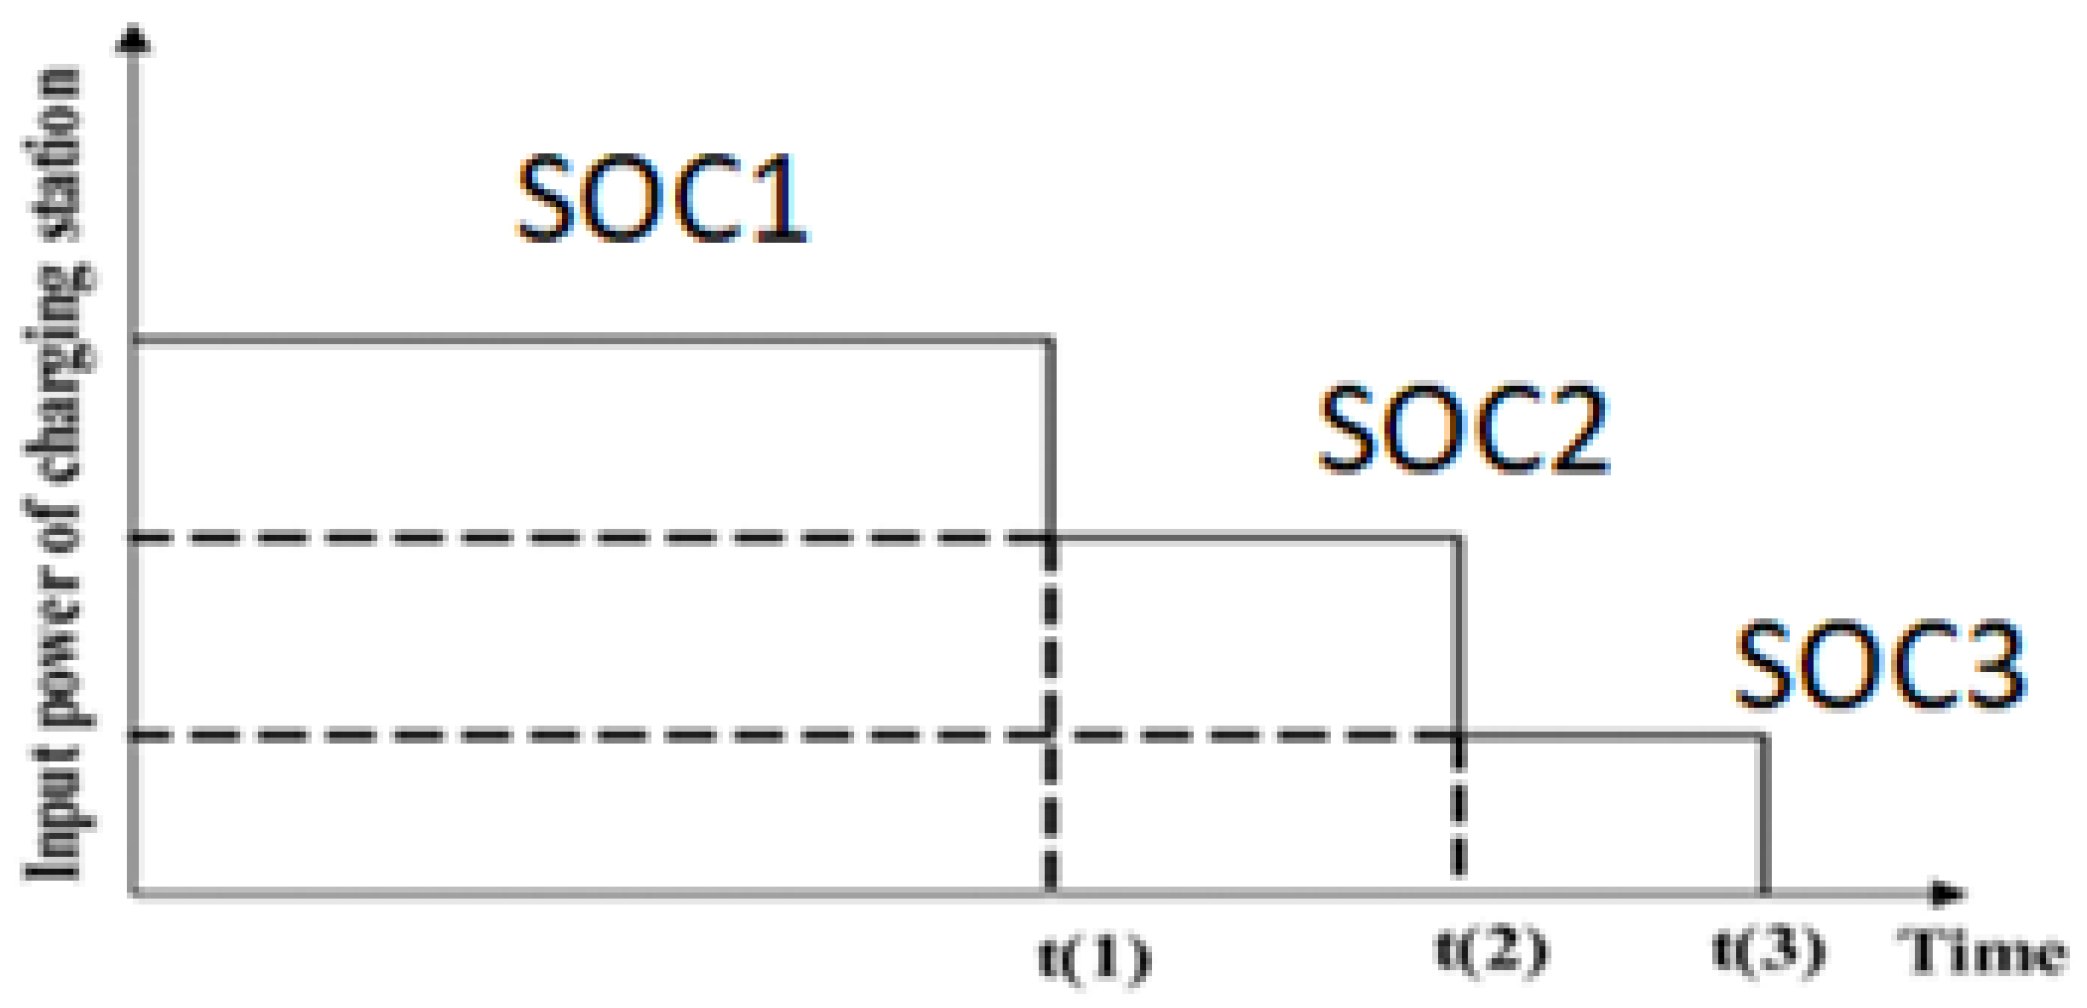
- In the modeling of parking lots, it is assumed that the initial state of charge of EVs has three levels (Figure 1). However, the proposed model can be adapted for use with other SOC levels as well. The initial SOC of vehicles can be adjusted using a suitable distribution function, and parking lots can be optimally placed considering this function.
- Another assumption made in the modeling of parking lots is that all batteries are the same size. As a result, the output power of the parking lot is assumed to be constant during the discharging state.
- Under traditional approximations used by utilities, there might be 200 peak hours in a year during which an incremental kW h of electricity would be worth USD 0.5/kW h []. Therefore, the maximum hours that vehicles deliver power to the network is assumed to be 200 h in a year.
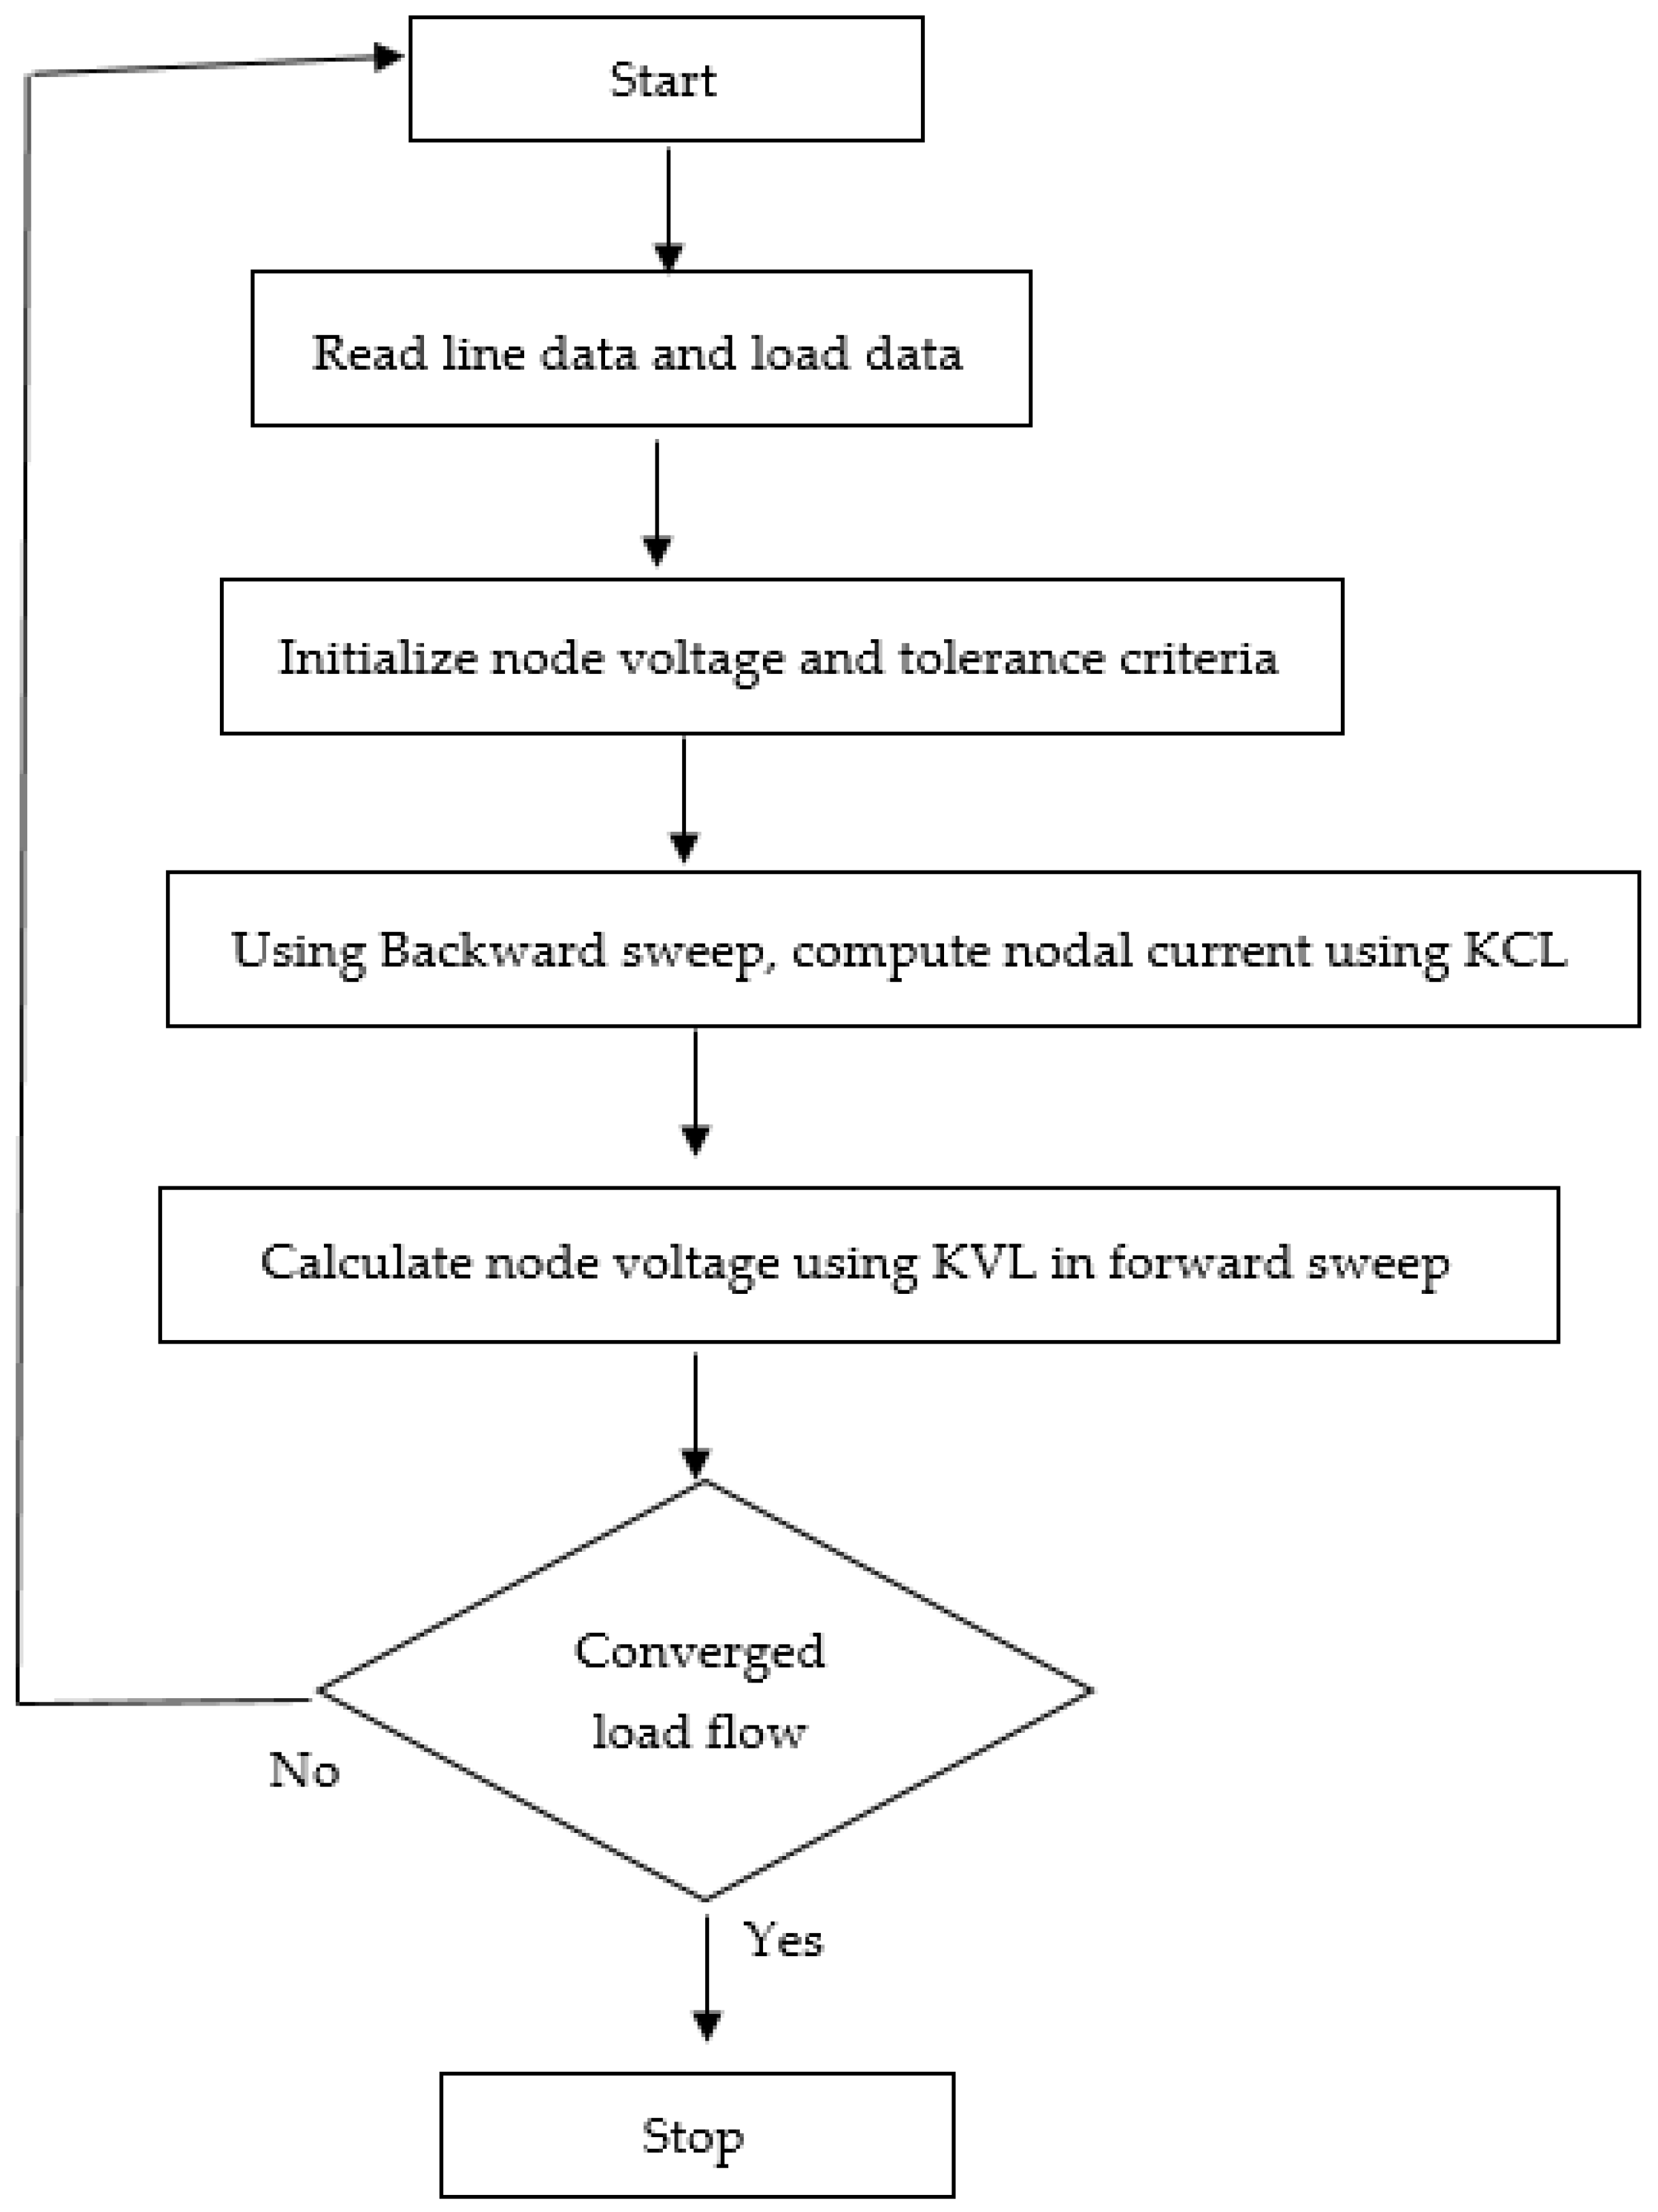
3.2. Load Flow
Load flow studies [] are essential for ensuring stable, reliable, and economical transmission of electrical power from generators to consumers through the grid system. We refer to the movement of both reactive and active power as “flow” or “load flow”. A mathematical technique for determining distinct bus voltages, their phase angles, and the flow of reactive and active power across various branches, generators, and loads in a steady-state setting is provided by power flow studies. The backward/forward sweep method is used to evaluate load flow in radial distribution. First, voltage data on the main line and its derivatives are all adjusted to the nominal voltage. Next comes an iterative procedure where Kirchhoff’s Current Law (KCL) is used to compute the branch current in the main line in a backward sweep after currents in derivative lines have been determined. Then, node voltages are calculated using Kirchhoff’s Voltage Law (KVL) in a forward sweep. Until the voltage magnitudes at each node in the current iteration and the previous iterations are lower than the tolerance limit, this backward and forward sweep approach is repeated.
3.2.1. Backward Sweep
This update moves towards the branches that are related to the source node from the branches that are the farthest away from it. During the backward propagation phase, the updated load flows in each branch are computed while taking the node voltages from the previous iteration into account. The voltage levels determined in the forward propagation phase are maintained throughout this procedure. Next, using the backward propagation method, the modified power loads in each branch are propagated backward along the feeder. This indicates that the backward propagation proceeds in the direction of the source node, beginning at the node that is farthest away from it.
3.2.2. Forward Sweep
The forward sweep in the backward/forward sweep technique entails updating nodal voltages from first-layer branches to last-layer branches. Computing the voltages at each node, starting with the feeder source node, is the aim of forward propagation. At the feeder substation, the voltage is adjusted to reflect its true value. The effective power in each branch is kept constant during the forward propagation phase at the value determined during the backward propagation step. The main steps of the suggested method, together with the relevant equations, are listed below.
Step 1: Initialization of voltages (assume an initial voltage at all nodes of , where N is the number of nodes).
Step 2: Iteration count initialization, K = 1. convergence_threshold = tolerance .
Step 3: Load Current computation.
For node = 2, 3, …., N. s represents the complex power at the load and v is the voltage. (in the simulation, the parking lot is modeled as a bus, ).
Step 4: Backward sweep: update the current starting from the end nodes.
Step 5: Forward sweep (start from the substation and move towards the end nodes).
For all node = 2, 3, …, N. , where R is the resistance of each branch and X is the reactance of each branch.
Step 6: Error.
for node = 2, 3…., N.
Step 7: Maximum error.
Step 8: The load flow is converging if is less than or equal to tolerance . If not, proceed to Step 3 and repeat the process after updating the iteration count to K = K + 1. The operation of the load flow computation utilizing the backward and forward sweep approach is shown in Figure 3.
Figure 3.
Load flow calculation using backward/forward sweep method.
3.3. Particle Swarm Optimization (PSO)
PSO [] is a nature-inspired optimization technique that draws inspiration from the collective behavior of groups in nature, like the flocking of birds or the schooling of fish. PSO works by simulating the movement of a swarm of particles through a multi-dimensional search space, aiming to find the best solution for a given problem. It is particularly effective for solving optimization problems with numerous variables and complex, non-linear objective functions. The objective function stated in Equation (1) is maximized with the PSO (particle swarm optimization) algorithm. Each member of the group in PSO is characterized by a velocity vector and a position vector in the search space. With each iteration, the particles’ new positions are determined based on their velocity and current position in the search space.
In the problem’s dimensional space, solutions are represented by matrices with corresponding dimensions. Therefore, the position and velocity of PSO can be denoted by matrices of size and , respectively, where represents the value of position in dimension j and represents the value of velocity in dimension j. The operations of the algorithm are also conducted as matrix operations, and the velocity and position update models of the standard PSO are represented as follows:
where and and are constants representing the acceleration coefficients that control the particle’s movement. Parameters and are random numbers following a Gaussian distribution and taking values between 0 and 1, and t represents the current iteration number. represents the value of the dimension of the globally optimal particle in the previous t iterations, and represents the value of the dimension of the optimal position of particle i in the previous t iterations. The inertia weight parameter, or “w”, is a term used in optimization methods like PSO. The inertia weight (‘w’) in PSO maintains a balance between the local and global search space exploration. Throughout the optimization process, Equation (22) modifies ‘w’ to progressively lower its value over iterations, which is a popular strategy to balance exploration and exploitation ( is the maximum inertia weight, is the minimum inertia weight, and t is the number of iterations).
The algorithm involves four steps:
- Initialization: Initialize a population of particles with random positions and velocities in D dimensions in the search space.
- Estimation: Estimate the fitness of each particle in this population.
- Update: Calculate the speed of each particle and move to the next position.
- Termination: Stop the algorithm if it reaches a certain stop criterion; otherwise, go back to the estimation stage.
The PSO algorithm relies on the interplay between particles’ individual experiences (pBest) and the collective best experience of the swarm (gBest) to navigate the search space effectively and converge towards promising regions. The parameters used in the PSO study are = 4; = 0.9; = 0.2; c1 = c2 = 2; dim = 2; and PopSize = 5.
3.4. Calculation of Weighting Factors
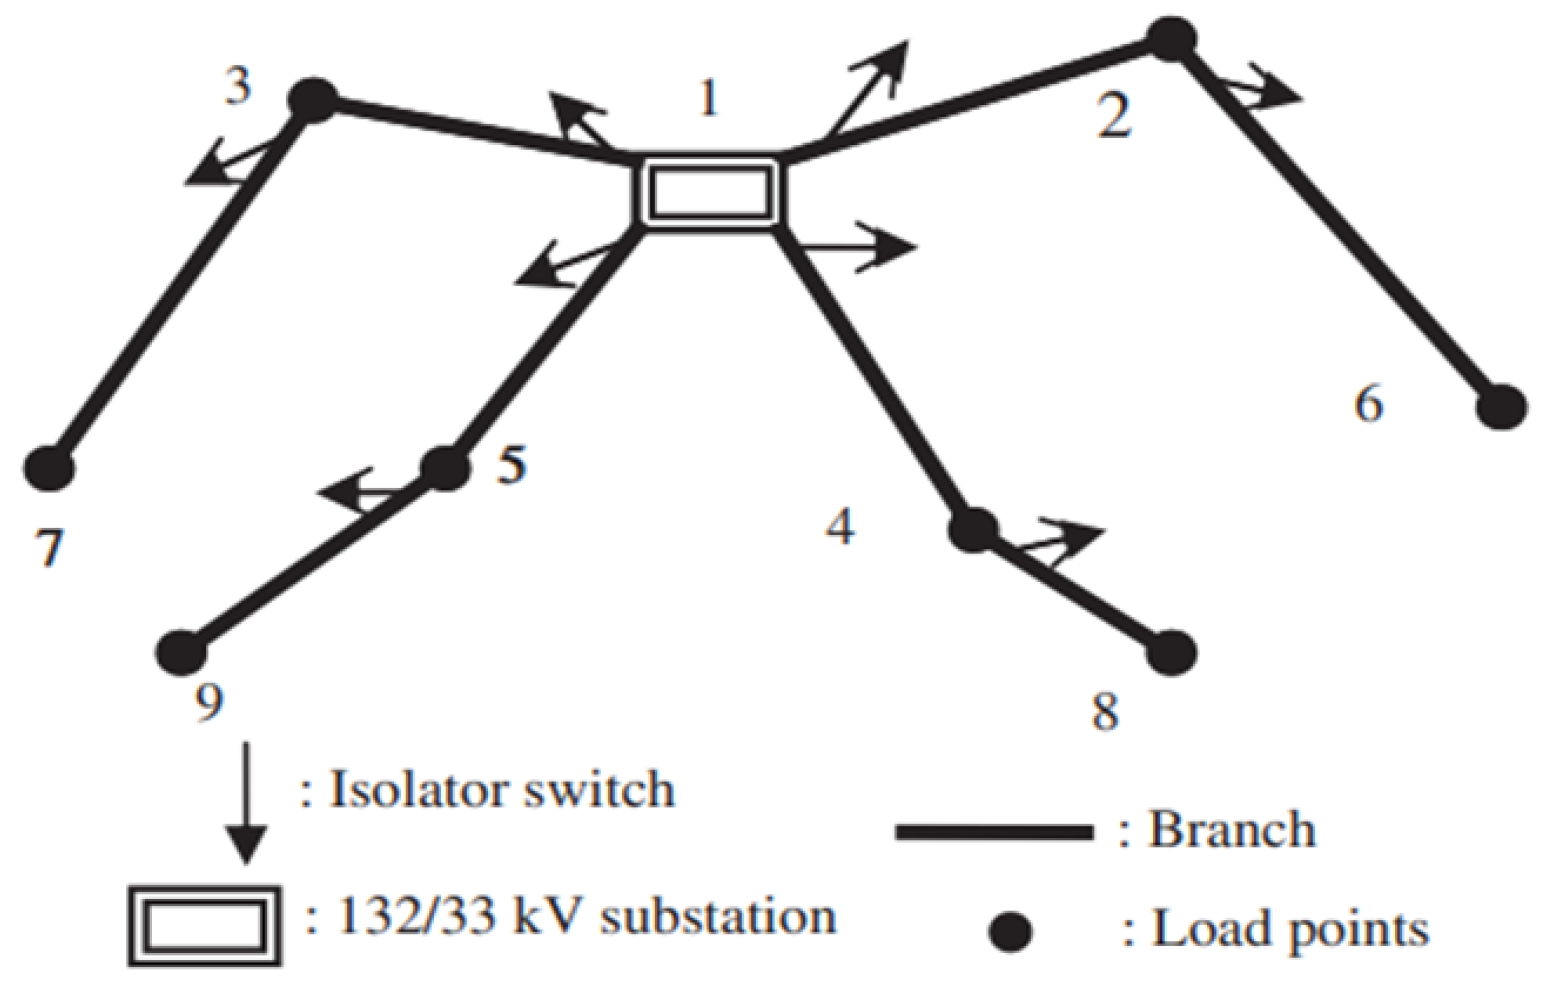
The analytic hierarchy process (AHP) is used to calculate the weights of the various cost functions of the objective function (Equation (1)). In the first step of AHP, the research factors must be extracted from various sources or obtained from experts. Once the factors and options are identified, the problem is divided into criteria levels and sub-criteria, and arranged in a hierarchical diagram (main criteria at the top). Then, a matrix of pairwise comparisons is formed. The elements of each level are compared pairwise with other related elements at a higher level, and matrices of paired comparisons are created. To assess the importance and preference in these pairwise comparisons, a scale of one to nine is commonly used (Table 2).
Table 2.
Preference values for pairwise comparisons.
4. Case Study
Figure 4 shows the case study’s test arrangement. Dispersed generations with power factors of 0.9 lag and ranging from 1 to 5 MW have been regarded as negative loads in order to assess the proposed method. Eight load points are powered by a high-voltage distribution substation with a rating of 132–33 kV that is part of the distribution test network. The network’s isolator switches, which have a maximum capacity of 25 MVA, isolate each branch. Every load point in the network has a power factor of 0.9 latency, making them all suitable sites for parking lot installations. The test network’s technical specifications are shown in Table 3, which loads data in three stages [].
Figure 4.
Studied test network.
Table 3.
Technical characteristics of branches and load data.
Table 4 provides a summary of the system’s further technical and financial specifications. The following presumptions [,] are made in our study:
Table 4.
Technical/cost parameters.
- The highest billing rate is applied to each vehicle.
- Three degrees of load conditions—light, medium, and peak load—are taken into consideration in this paper.
- The parking lot is represented in the simulation as a bus (Q = 0).
- It is considered that there are always vehicles available.
- Three degrees of initial state of charge (SOC) for electric vehicles (EVs) are assumed in parking lot modeling.
- Every battery has identical dimensions. As a consequence, the output power of the parking lot is continuous in a flat discharging condition.
According to estimates by traditional utilities, there may be 200 or so peak hours annually during which an extra kWh of power is worth 0.5 USD/kWh. As a result, automobiles are believed to provide the network with electricity for no more than 200 h annually.
4.1. Calculation of Criteria Weights
The AHP approach is used to determine the ideal weighting factors in every scenario. The vector of weighting coefficients is the same in all scenarios and is given by w = [ 0.2, 0.2, 0.2, 0.2, 0.2].
In the next step, the location of the parking lot will be determined using load flow, and with the PSO algorithm, the number of EVs in each parking lot will be discovered.
4.2. Calculation of Load Flows
The load flow is calculated for four lines (1–3–7, 1–5–9, 1–4–8, and 1–2–6). We will demonstrate the application of the forward/backward sweep technique for line 1–3–7 as an example.
Step 1: Initialization of voltages in eight nodes, Kv.
Step 2: Iteration count initialization, .
Step 3: Load Current computation,
.
Step 4: Update current starting from the end nodes (backward sweep),
.
Step 5: Forward sweep,
.
Step 6: Error,
.
Step 7: Maximum error,
.
Step 8: If is more than tolerance (), then update the iteration count to k = k + 1 and go to Step 3 and repeat the steps. K = 2.
Iteration 2
Step 3: Load Current computation (line 1-3-7),
,
Step 4: Update the current starting from the end nodes (backward sweep),
.
Step 5: Forward sweep,
.
Step 6: Error,
.
Step 7: Maximum error,
.
Step 8: is greater than tolerance (), so update the iteration count to and go to Step 3. These steps are repeated, and in K = 6, the becomes less than tolerance (), so the load flow is converged at iteration 6.
4.3. Calculating the Location of Parking Lots and Sizing
The location of parking lots, the number of EVs, and the benefit of loss reduction (Equation (10)) are obtained using the PSO algorithm. At the end, the benefit of providing peak power (net income - required cost) and total benefit is calculated using Equation (1).
Additionally, in order to see the voltage enhancement in the presence of V2G, the voltage profile is examined for three different scenarios, both with and without V2G power.
4.4. Scenario Generation
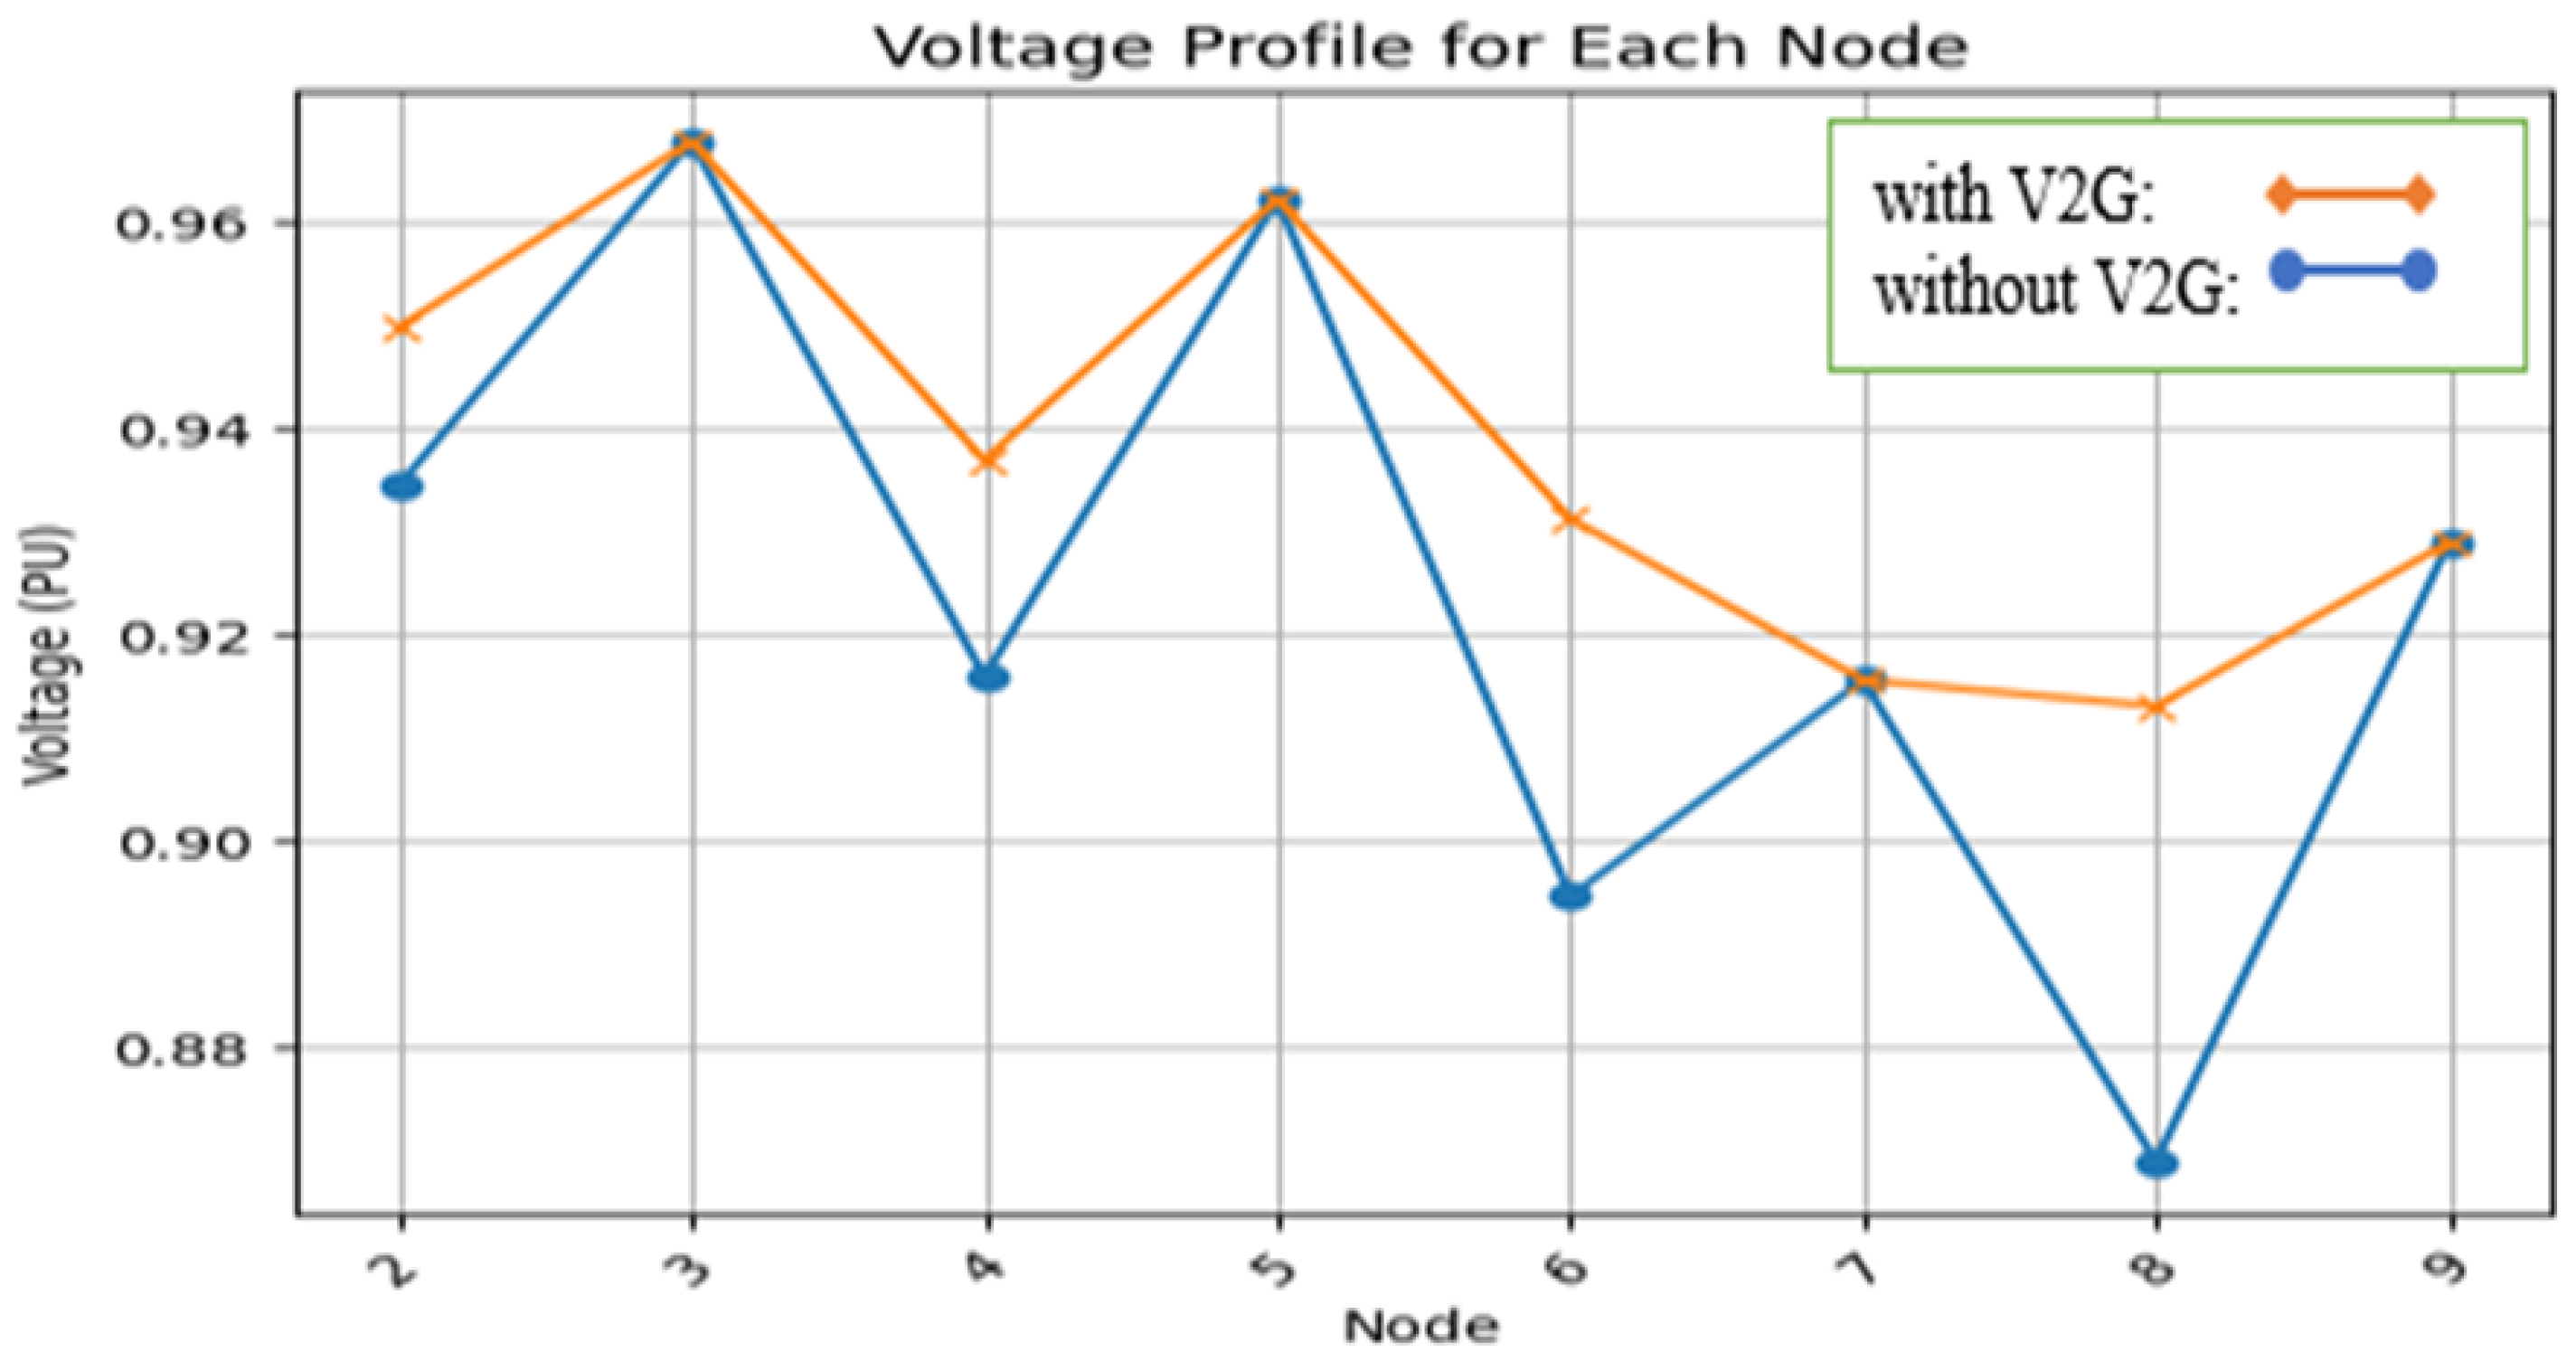
4.4.1. Scenario 1: Pv: 15 kw and ES: 50 Kwh
The outcomes of scenario 1 are presented in Table 5. It is considered that vehicles’ availability is 100%. Put otherwise, all EV owners respect the agreement. The total yearly benefit is USD 188,089.803.
Table 5.
Simulation results of scenario 1.
Figure 5 displays the voltage profile of load locations during peak hours, when parking lots provide electricity to the distribution system. The algorithm converges at a total of six iterations with a tolerance of p.u.
Figure 5.
Voltage profile in peak load (scenario 1).
There is a voltage decrease on buses 6 and 8, as seen in Figure 5 and Table 6 (without V2G). Since the voltage on buses 6 and 8 is less than 0.9 p.u., the optimization constraint is not in the required range in this scenario. Nonetheless, when V2G power is present, the voltage profile of the buses improves. It is important to remember that the voltage in every bus is the same as the voltage in every node determined by the load flow technique (after convergence).
Table 6.
Voltage magnitude of 9-bus system (50 Kw).
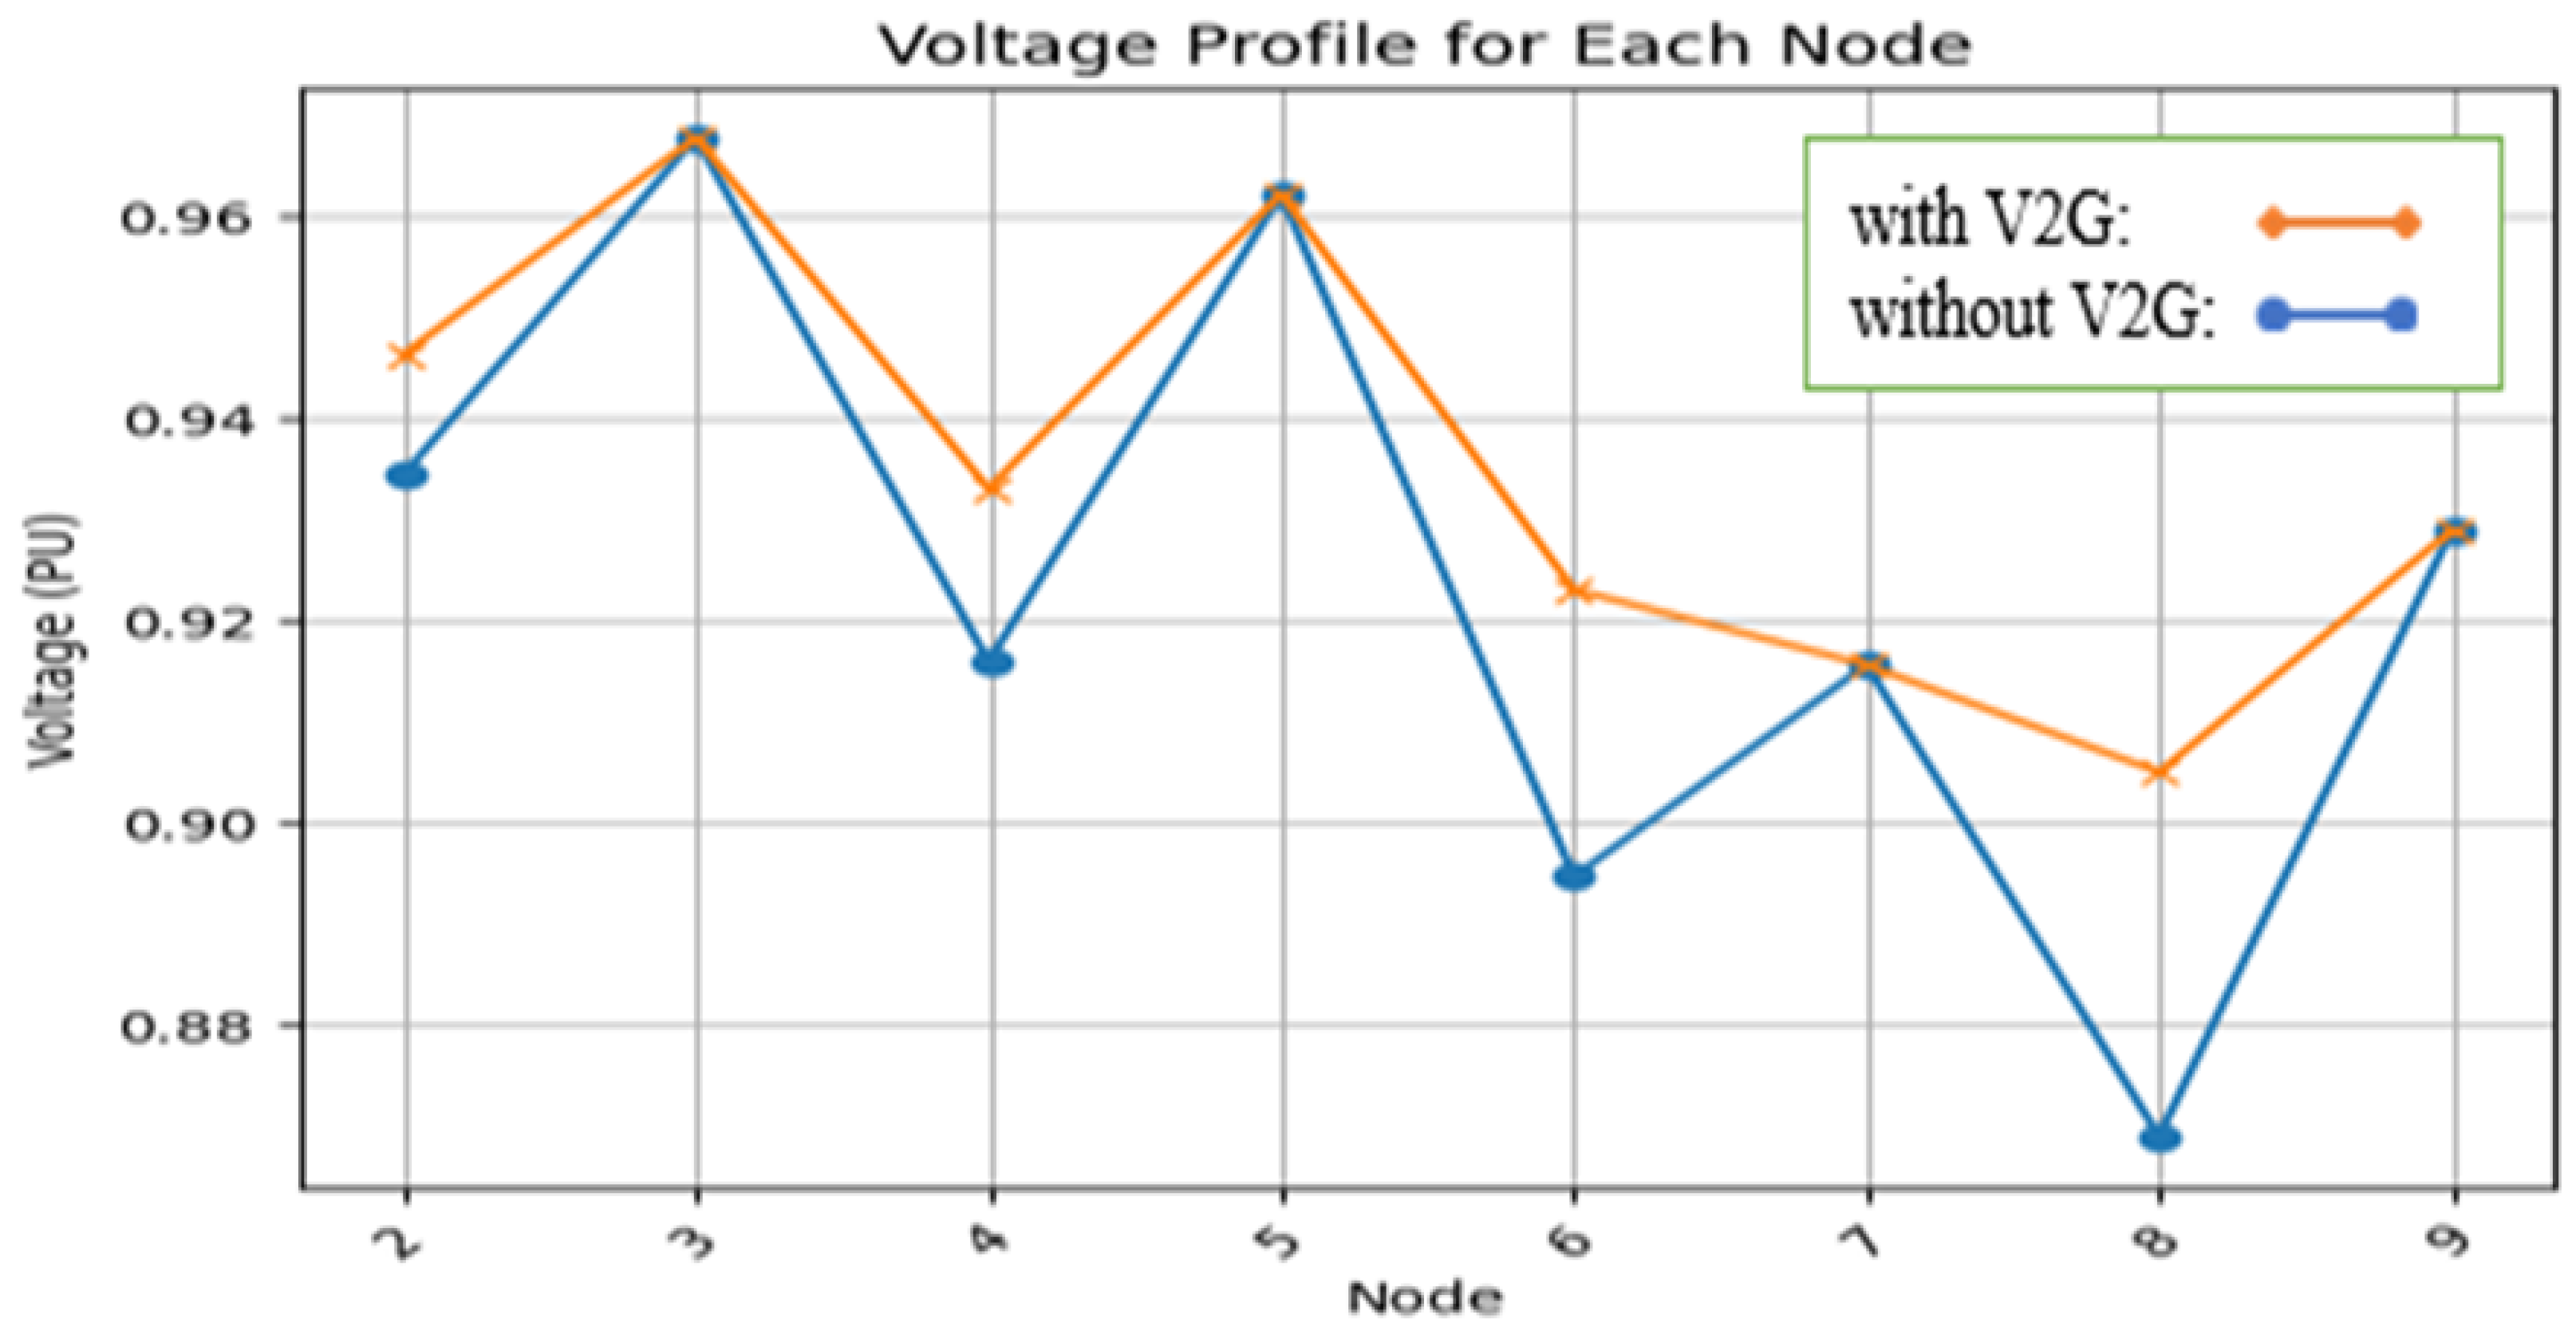
4.4.2. Scenario 2: Pv: 50 kw and ES: 100 Kwh
The vector of weighting coefficients is calculated like scenario 1. w = [ 0.2, 0.2, 0.2, 0.2, 0.2]. Table 7 displays the outcome of scenario 2. Vehicle availability is assumed to be 100%. Or, to put it another way, every EV owner honors the agreement. The statistics show that the total yearly benefit is USD 185731.7176.
Table 7.
Simulation results of scenario 2.
Figure 6 displays the voltage profile of load points, or parking lots that provide electricity to the distribution system, during peak hours. The total number of iterations needed is six, and the tolerance is 10-5 p.u. Bus numbers 6 and 8 experience a voltage loss when there is no V2G in the network, as shown in Figure 6 and Table 8, since their voltage is less than 0.9 p.u. But when V2G is present, this problem is resolved.
Figure 6.
Voltage profile in peak load (scenario 2).
Table 8.
Voltage magnitude of 9-bus system (50 Kw).
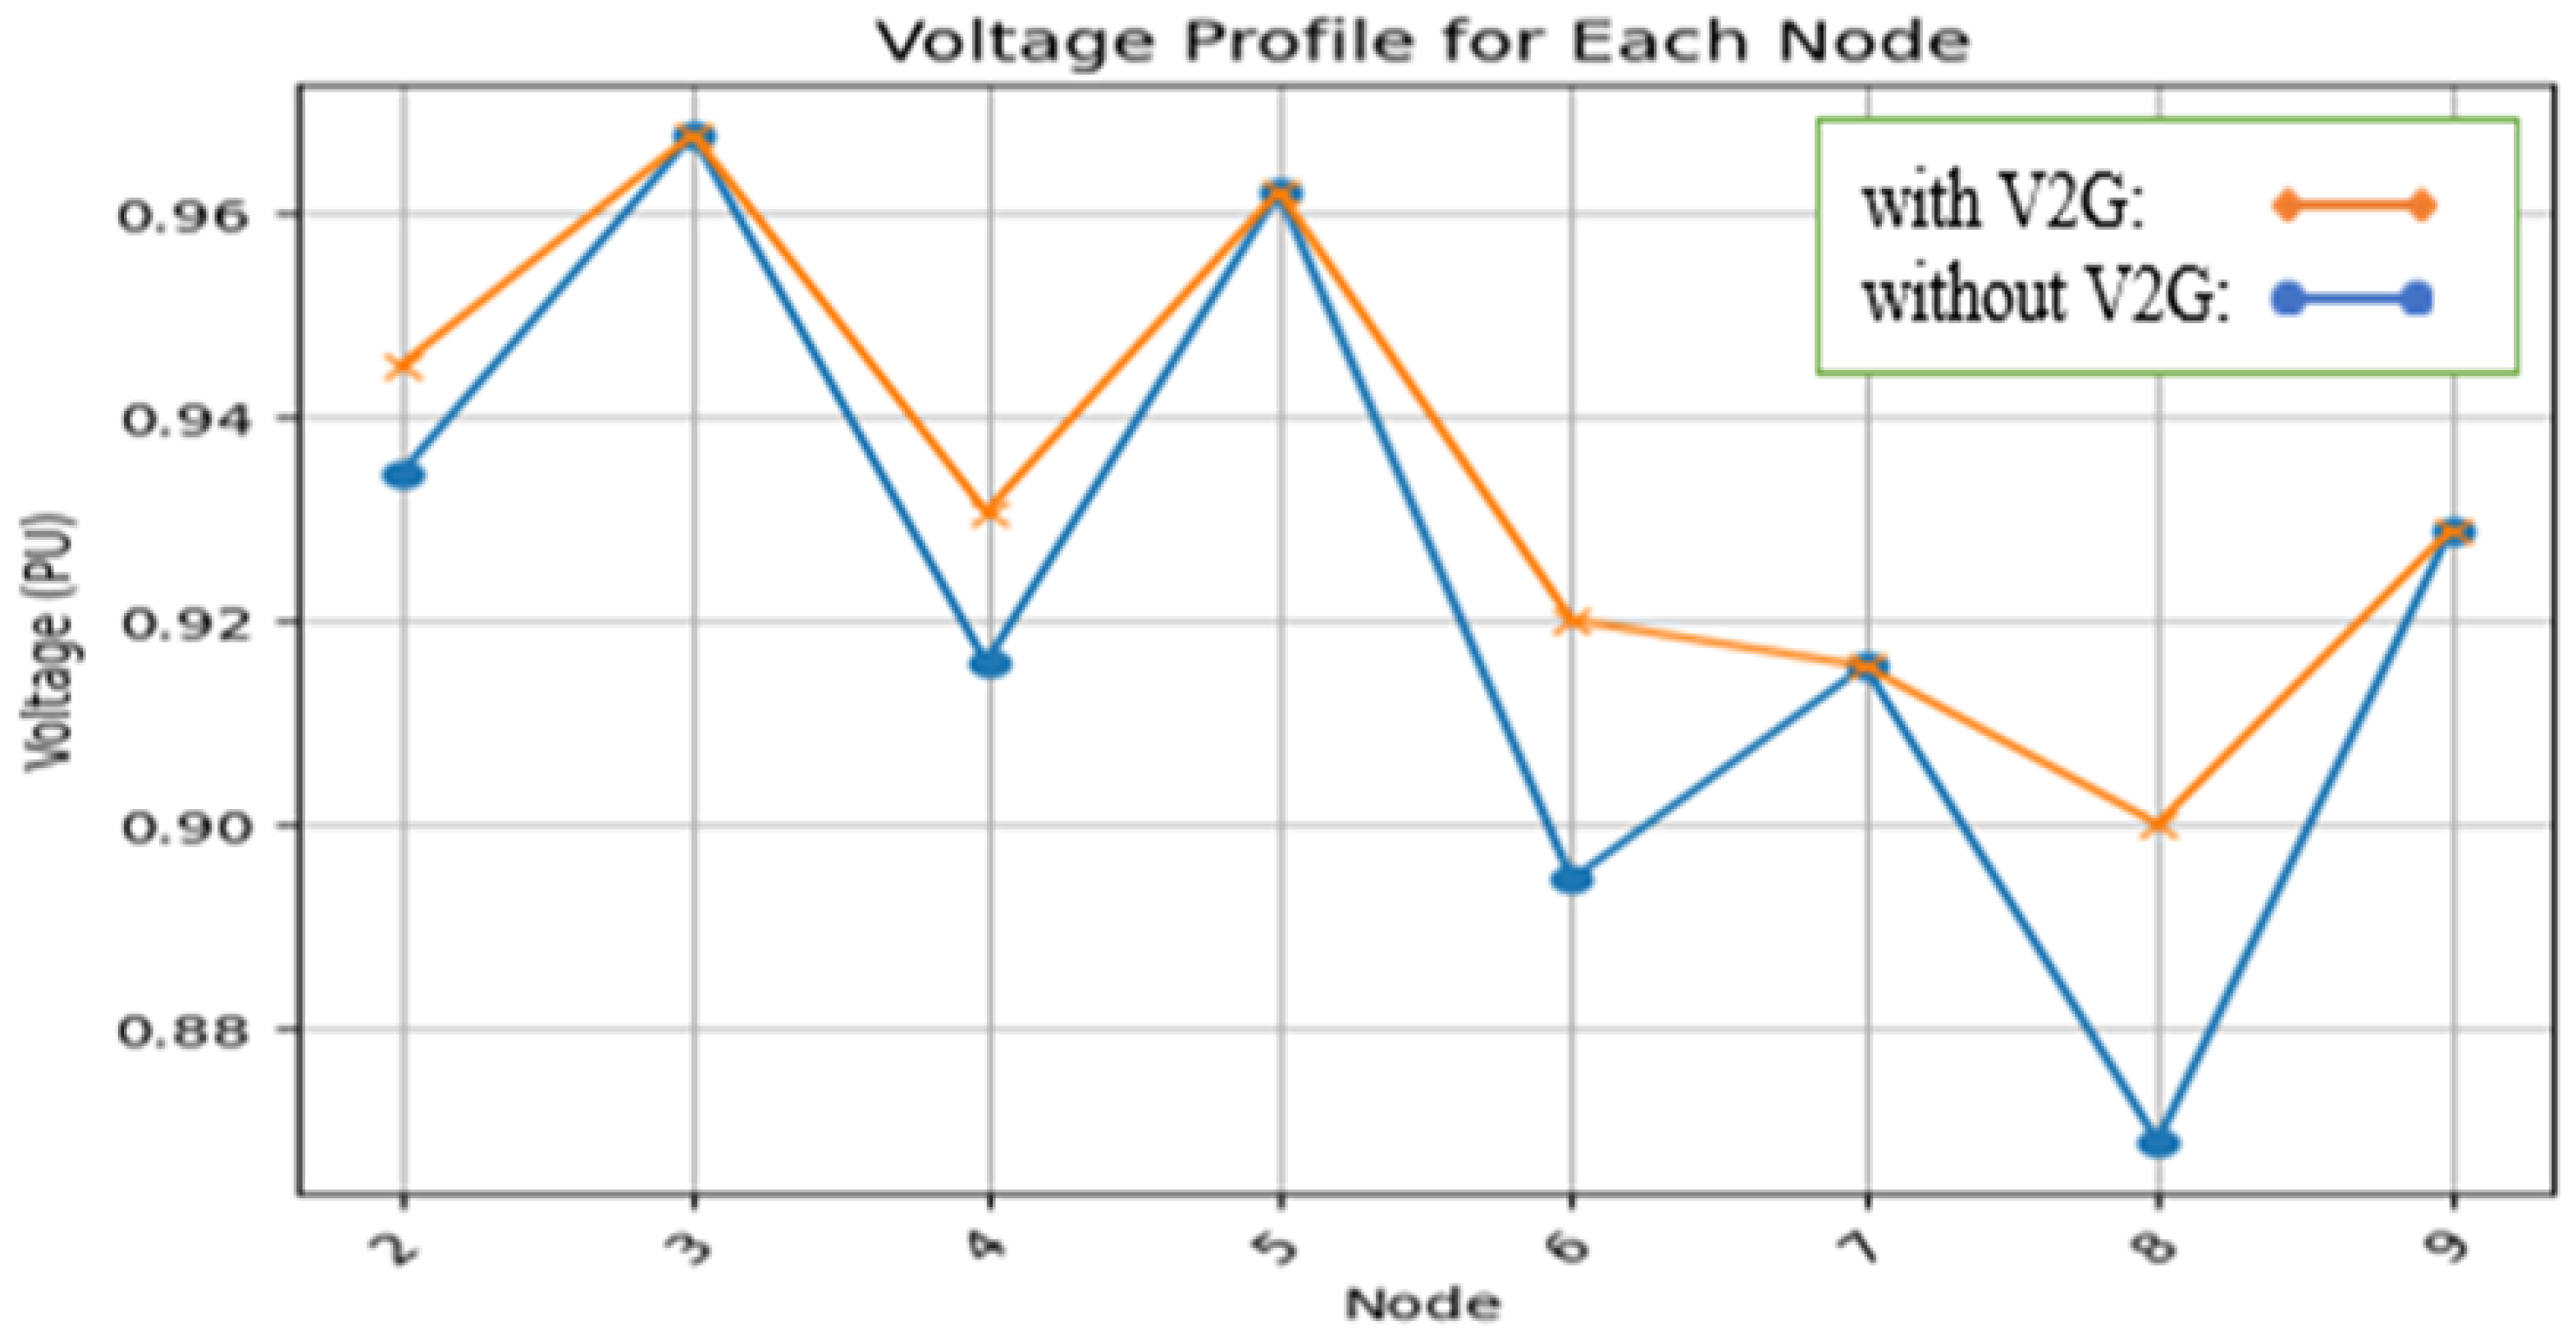
4.4.3. Scenario 3: Pv: 100 kw and ES: 100 Kwh
w = [0.2, 0.2, 0.2, 0.2, 0.2]
Table 9 displays the results from scenario 3 with the yearly total benefit value as USD 176,902.4823. The availability of vehicles is 100%. Stated differently, every owner of an EV abides by the agreement.
Table 9.
Simulation results of scenario 3.
Figure 7 displays the voltage profile of load sites during peak hours when parking lots provide electricity to the distribution system. The total number of iterations needed is six, and the tolerance is p.u.
Figure 7.
Voltage profile in peak load (scenario 3).
Table 10 and Figure 7 show that there is a voltage reduction at bus numbers 6 and 8, where the voltage is less than 0.9 p.u. (without V2G). In the presence of V2G power, the voltage profile of the buses improves, but the optimization constraints are still within a reasonable range.
Table 10.
Voltage magnitude of 9-bus system (100 Kw).
5. Results Analysis and Discussion
Table 11 presents the comparison results of our work with [,,]. The outputs are presented in terms of the total numbers of EVs used, voltage drop points (with V2G), total capacity of the EV to the network, and the total benefit of loss reduction. The authors in [] estimated and located 975 EVs in the network with a total capacity of 14,625 kW. In contrast, ref. [] explored four methods (Competition over resource optimization—COR, Gray Wolf Optimization—GWO, Water Cycle Algorithm—WCA, and Whale Optimization Algorithm—WOA approaches), resulting in the location of 600, 687, 735, and 712 EVs in the network, respectively, with the same total capacity of 14,625 kW. On the other hand, ref. [] did not consider EVs in the distribution network; instead, they estimated and located about 5 MW of DGs in the network, distributed across three load types (light, medium, peak). Consequently, their approach demonstrates the potential for significantly reducing losses and increasing benefits compared to others. This study achieves a higher benefit in loss reduction with a smaller number of EVs compared to [,]. In addition, the results in [,] are based on specific parameters, such as Pv = 15 kW and ES = 50 kWh, without considering other network conditions. Furthermore, the optimization constraint for bus number 8 in [,] is not within the appropriate range (voltage drop occurs at bus number 8 during peak hours). This paper, by considering various situations, demonstrates that utilizing fast charging stations and vehicles with higher battery capacities can significantly reduce the total number of EVs while improving voltage drop during peak times.
Table 11.
Results comparison.
6. Conclusions and Future Works
This paper aims to address the optimal allocation and sizing of parking lots within a distribution system to efficiently supply loads. A particle swarm optimization-based approach is proposed. The model focuses on maximizing total benefits, considering network data and market prices. Results from the study showed that installing parking lots could be economically profitable for the distribution company and could improve the voltage profile. The simulation results indicate that changes in the battery capacity of EVs in parking lots and the power rate at which the EVs are charged (Pv) result in variations in the outcomes. To achieve more accurate results, it is essential to precisely determine the size of the batteries and the power rate at which the EVs are charged. This would involve careful consideration of factors such as the expected usage patterns of the EVs, the charging infrastructure available, and the overall objectives of the optimization process. Fine-tuning these parameters can lead to more precise and effective outcomes in the optimization of parking lot allocations for EV charging. In addition to the benefits already mentioned, this approach offers several other advantages such as improvements in the voltage profile, reductions in the power flow, and enhanced equipment lifespan. Several avenues for future research and development can be pursued based on the findings and limitations of this work. These directions include the following:
- A simple system with nine buses was considered in this paper. The proposed method can be used for a complex system like one with 33 buses or 69 buses.
- The weighting coefficient can lead to variations in the results. In this study, the weighting coefficient was equal and all arrays in matrix A were 1. The same approach can be used to examine the effects of various weighting coefficients.
- It was assumed that all EV owners respected the contract, and the availability of vehicles was 100 percent. If the availability of vehicles is 80 percent or less, it can have an effect on the result. Reliability improvement has not been investigated in this work, and can be part of future works.
- In the modeling of parking lots, it is assumed that the initial state of charge (SOC) of EVs has three levels. The proposed model can be used for other SOC levels.
Several operational constraints that can affect the efficiency of the proposed parking system for BEVs/PHEVs, such as ambient temperature, technical issues, or the need for a vehicle to leave the parking lot earlier than planned, can also be integrated in future studies.
Author Contributions
Methodology, M.S.A.; Writing—original draft, M.S.A.; Writing—review & editing, A.A.; Supervision, A.A. All authors have read and agreed to the published version of the manuscript.
Funding
This research received no external funding.
Data Availability Statement
The original contributions presented in this study are included in the article. Further inquiries can be directed to the corresponding author.
Conflicts of Interest
The authors declare no conflicts of interest.
References
- Moradijoz, M.; Parsa Moghaddam, M.; Haghifam, M.R.; Alishahi, E. A multi-objective optimization problem for allocating parking lots in a distribution network. Int. J. Electr. Power Energy Syst. 2013, 46, 115–122. [Google Scholar] [CrossRef]
- Gellings, C.W. The Smart Grid: Enabling Energy Efficiency and Demand Response; River Publishers: Nordjylland, Denmark, 2009. [Google Scholar]
- Markel, T.; Bennion, K. Field Testing Plug-in Hybrid Electric Vehicles with Charge Control Technology in the Xcel Energy Territory; Technical Report; National Renewable Energy Laboratory (NREL): Golden, CO, USA, 2009. [Google Scholar]
- Peterson, B.; Whitacre, J.F. The economics of using plug-in hybrid electric vehicle battery packs for grid storage. J. Power Sources 2010, 195, 2377–2384. [Google Scholar]
- Moradi, M.; Abedini, M. A combination of genetic algorithm and particle swarm optimization for optimal DG location and sizing in distribution systems. Int. J. Electr. Power Energy Syst. 2012, 34, 66–74. [Google Scholar]
- Aman, M.; Jasmon, J.; Mokhlis, H.; Bakar, A. Optimal placement and sizing of a DG based on a new power stability index and line losses. Int. J. Electr. Power Energy Syst. 2012, 43, 1296–1304. [Google Scholar]
- Mirzaei, M.J.; Kazemi, A.; Homaee, O. A probabilistic approach to determine optimal capacity and location of electric vehicles parking lots in distribution networks. IEEE Trans. Ind. Inform. 2015, 12, 1963–1972. [Google Scholar]
- Mohsenzadeh, A.; Pazouki, S.; Ardalan, S.; Haghifam, M.R. Optimal placing and sizing of parking lots including different levels of charging stations in electric distribution networks. Int. J. Ambient. Energy 2018, 39, 743–750. [Google Scholar] [CrossRef]
- Moradijoz, M.; Ghazanfarimeym, A.; Moghaddam, M.P.; Haghifam, M.R. Optimum placement of distributed generation and parking lots for loss reduction in distribution networks. In Proceedings of the 2012 17th Conference on Electrical Power Distribution, Tehran, Iran, 2–3 May 2012; pp. 1–5. [Google Scholar]
- Sattarpour, T.; Farsadi, M. Parking lot allocation with maximum economic benefit in a distribution network. Int. Trans. Electr. Energy Syst. 2017, 27, e2234. [Google Scholar]
- Algafri, M.; Alghazi, A.; Almoghathawi, Y.; Saleh, H.; Al-Shareef, K. Smart City Charging Station allocation for electric vehicles using analytic hierarchy process and multiobjective goal-programming. Appl. Energy 2024, 372, 123775. [Google Scholar] [CrossRef]
- Tan, M.; Zhang, Z.; Ren, Y.; Richard, I.; Zhang, Y. Multi-agent system for electric vehicle charging scheduling in parking lots. Complex Syst. Model. Simulation 2023, 3, 129–142. [Google Scholar]
- Casella, V.; Ferro, G.; Robba, M. A decentralized optimization approach to the power management of electric vehicles parking lots. Sustain. Energy Grids Netw. 2024, 38, 101301. [Google Scholar]
- Zhang, H.; Shi, F. A multi-objective site selection of electric vehicle charging station based on NSGA-II. Int. J. Ind. Eng. Comput. 2024, 15, 293–306. [Google Scholar]
- Mehouachi, I.; Trojette, M.; Grayaa, K. MONNA: Multi-objective neural network algorithm for the optimal location of electric vehicle charging infrastructure in Tunis city. J. Clean. Prod. 2023, 431, 139837. [Google Scholar] [CrossRef]
- El-Zonkoly, A.; dos Santos Coelho, L. Optimal allocation, sizing of PHEV parking lots in distribution system. Int. J. Electr. Power Energy Syst. 2015, 67, 472–477. [Google Scholar]
- Fathy, A.; Abdelaziz, Y.A. Grey Wolf Optimizer for Optimal Sizing and Siting of Energy Storage System in Electric Distribution Network. Electr. Power Components Syst. 2017, 45, 601–614. [Google Scholar]
- Kempton, W.; Tomic, J. Vehicle-to-grid power fundamentals: Calculating capacity and net revenue. J. Power Sources 2005, 144, 268–279. [Google Scholar] [CrossRef]
- Ahmadi, M.; Rastgoo, S.; Mahdavi, Z.; Nasab, M.A.; Zand, M.; Sanjeevikumar, P.; Khan, B. Optimal allocation of EVs parking lots and DG in micro grid using two-stage GA-PSO. J. Eng. 2023, e12237. [Google Scholar] [CrossRef]
- Ferraz, R.S.; Ferraz, R.S.; Rueda-Medina, A.C.; Fardin, J.F. Multi-objective Optimization Approach for Allocation of Electric Vehicles Parking Lots and Smart Charging with Distributed Energy Resource. J. Control. Autom. Electr. Syst. 2023, 34, 1070–1079. [Google Scholar]
- Kumar, B.A.; Jyothi, B.; Singh, A.R.; Bajaj, M.; Rathore, R.S.; Tuka, M.B. Hybrid genetic algorithm-simulated annealing based electric vehicle charging station placement for optimizing distribution network resilience. Sci. Rep. 2024, 14, 7637. [Google Scholar]
- Duan, F.; Eslami, M.; Khajehzadeh, M.; Alkhayer, A.G.; Palani, S. An improved meta-heuristic method for optimal optimization of electric parking lots in distribution network. Sci. Rep. 2024, 14, 20363. [Google Scholar]
- Amini, M.H.; Islam, A. Allocation of electric vehicles’ parking lots in distribution network. In Proceedings of the ISGT 2014, Washington, DC, USA, 19–22 February 2014. [Google Scholar]
- Shaheen, H.I.; Rashed, G.I.; Yang, B.; Yang, J. Optimal electric vehicle charging and discharging scheduling using metaheuristic algorithms: V2G approach for cost reduction and grid support. J. Energy Storage 2024, 90, 111816. [Google Scholar] [CrossRef]
- Ding, X.; Gan, Q.; Shaker, M.P. Optimal management of parking lots as a big data for electric vehicles using internet of things and Long–Short term Memory. Energy 2023, 268, 126613. [Google Scholar]
- Shariatzadeh, M.; Antunes, C.H.; Lopes, M.A. Charging scheduling in a workplace parking lot: Bi-objective optimization approaches through predictive analytics of electric vehicle users’ charging behavior. Sustain. Energy Grids Netw. 2024, 39, 101463. [Google Scholar] [CrossRef]
- Shahriar, S.; Al-Ali, A.R.; Osman, A.H.; Dhou, S.; Nijim, M. Machine learning approaches for EV charging behavior: A review. IEEE Access 2020, 8, 168980–168993. [Google Scholar]
- Varone, A.; Heilmann, Z.; Porruvecchio, G.; Romanino, A. Solar parking lot management: An IoT platform for smart charging EV fleets, using real-time data and production forecasts. Renew. Sustain. Energy Rev. 2024, 189, 113845. [Google Scholar]
- Pourvaziri, H.; Sarhadi, H.; Azad, N.; Afshari, H.; Taghavi, M. Planning of electric vehicle charging stations: An integrated deep learning and queueing theory approach. Transp. Res. Part Logist. Transp. Rev. 2024, 186, 103568. [Google Scholar]
- Guo, F.; Xu, H.; Xu, P.; Guo, Z. Design of a reinforcement learning-based intelligent car transfer planning system for parking lots. Math. Biosci. Eng. 2024, 21, 1058–1081. [Google Scholar]
- Adil, M.; Mahmud, M.P.; Kouzani, A.Z.; Khoo, S.Y. Optimal Location and Pricing of Electric Vehicle Charging Stations Using Machine Learning and Stackelberg Game. IEEE Trans. Ind. Appl. 2024, 60, 4708–4722. [Google Scholar] [CrossRef]
- Lv, S.; Xiao, A.; Qin, Y.; Xu, Z.; Wang, X. A decision framework for improving the service quality of charging stations based on online reviews and evolutionary game theory. Transp. Res. Part Policy Pract. 2024, 187, 104168. [Google Scholar]
- Boateng, G.O.; Si, H.; Xia, H.; Guo, X.; Chen, C.; Agyemang, I.O.; Ansari, N. Automated valet parking and charging: A dynamic pricing and reservation-based framework leveraging multi-agent reinforcement learning. IEEE Trans. Intell. Veh. 2024, e12237. [Google Scholar]
- Abbasi, M.H.; Arjm Zadeh, Z.; Zhang, J.; Krovi, V.; Xu, B.; Mishra, D.K. A Coupled Game Theory and Lyapunov Optimization Approach to Electric Vehicle Charging At Fast Charging Stations. IEEE Trans. Veh. Technol. 2024, 73, 14224–14235. [Google Scholar]
- Morais, H. New approach for electric vehicles charging management in parking lots considering fairness rules. Electr. Power Syst. Res. 2023, 217, 109107. [Google Scholar]
- Kempton, W. Vehicle to Grid Power; FERC: Washington, DC, USA, 2007. [Google Scholar]
- Jannati-Oskuee, M.R.; Mojtahedzadeh, S.; Karimi, M. Risk-based joint flexible distribution network expansion planning and allocation of EV parking lots. Energy Syst. 2024, 15, 1255–1287. [Google Scholar]
- Shojaabadi, S.; Abapour, S.; Abapour, M.; Nahavandi, A. Optimal planning of plug-in hybrid electric vehicle charging station in distribution network considering demand response programs and uncertainties. IET Gener. Transm. Distrib. 2016, 10, 3330–3340. [Google Scholar]
- Jeonghwan, J.; Rothrock, L.; Mcdermott, P.L.; Barnes, M. Using the analytic hierarchy process to examine judgment consistency in a complex multiattribute task. IEEE Trans. Syst. Man, Cybern.-Part Syst. Hum. 2010, 40, 1105–1115. [Google Scholar]
- Clement, K.; Haesen, E.; Driesen, J. The impact of charging plug-in hybrid electric vehicles on a residential distribution grid. IEEE Trans. Power Syst. 2010, 25, 371–380. [Google Scholar]
- Sioshansi, R. Modeling the impacts of electricity tariffs on PHEVs. Oper. Res. 2012, 60, 1–11. [Google Scholar]
- Soares, J.; Canizes, B.; Lobo, C.; Vale, Z. Electric vehicle scenario simulator tool for smart grid operators. Energies 2012, 5, 1881–1899. [Google Scholar] [CrossRef]
- Deosaria, T.; Choudhary, S.; Meena, T. Load flow analysis using Forward and Backward sweep, and minimising power losses using Genetic Algorithm. Int. J. Adv. Eng. Manag. (IJAEM) 2022, 4, 763–772. [Google Scholar]
- Zhao, M.; Zhao, H.; Zhao, M. Particle swarm optmization algorithm with adaptive two-population strategy. IEEE Access 2023, 11, 62242–62260. [Google Scholar]
- Khalesi, N.; Rezaei, N.; Haghifam, M.R. DG allocation with application of dynamic programming for loss reduction and reliability improvement. Int. J. Electr. Power Energy Syst. 2011, 33, 288–295. [Google Scholar]
- Fathy, A.; Abdelaziz, Y.A. Competition over resource optimization algorithm for optimal allocating and sizing parking lots in radial distribution network. J. Clean. Prod. 2020, 264, 121397. [Google Scholar]
- Haji-Aghajani, E.; Hasanzadeh, S.; Heydarian-Forushani, E. A novel framework for planning of EV parking lots in distribution networks with high PV penetration. Electr. Power Syst. Res. 2023, 217, 109156. [Google Scholar]
Disclaimer/Publisher’s Note: The statements, opinions and data contained in all publications are solely those of the individual author(s) and contributor(s) and not of MDPI and/or the editor(s). MDPI and/or the editor(s) disclaim responsibility for any injury to people or property resulting from any ideas, methods, instructions or products referred to in the content. |
© 2025 by the authors. Licensee MDPI, Basel, Switzerland. This article is an open access article distributed under the terms and conditions of the Creative Commons Attribution (CC BY) license (https://creativecommons.org/licenses/by/4.0/).