1. Introduction
The world is witnessing a major shift in the way healthcare systems operate. With the increase in life expectancy and a corresponding rise in healthcare expenses, governments and healthcare providers are pressured to adjust to this reality. Consequently, a major transformation is necessary to cope with the growing health-related demands of the population. This transformation can be achieved by upgrading old habits into new ideologies, improving system standards, and increasing cost-efficiency. Such a shift will move the system from a reactive vision, built on the needs of the patients, to a more proactive view, where healthcare is focused on maintenance and solutions [
1].
Health systems consist of complex organizations with an interconnected array of services and provider agencies that significantly influence the economy, being responsible for employing more individuals than any other industry in developed countries. Therefore, skilled management is essential in any part of the system [
2]. By examining various types of complex interactions among the elements in the health system, through extraction and prediction of behaviors, there will be more efficient management and control over the outcomes, as complex procedures often display unpredictable patterns due to the synergistic effects of multiple sources. Like in societies, for organizations to achieve the expected results, there is a need for a multitude of elements to execute their services properly so that everything integrates well within the organization [
3]. The dynamic nature of health systems requires continuous management, adjustment, and control, including consistent monitoring, feedback, assessment, and review. Maintaining such steps toward the objectives and targets is crucial for achieving managerial or educational changes in the organization. The health system comprises multiple subsystems, such as organizations, objectives, managers, goals, and internal information systems; moreover, these need to maintain fluent communication among themselves, with similar organizations, and with the health macro system [
2].
Despite numerous efforts over the years, healthcare organizations (HOs) are still far behind forward-thinking industrial organizations [
4]. Chaotic amounts of information and knowledge are created by the daily procedures of the organization, overwhelming the management forces of the HOs. Limitations in time and resources constrain the efficacy at which administrators can utilize evidence-based management, process problems, access colloquial and systematic data, inspect the data indications, and decide on the obtained results. This inefficiency is partly due to the organization’s lack of knowledge and competence with the necessary tools for such objectives [
5].
Alongside the current technological advances experienced by the healthcare sector, the production of huge amounts of data has become unmanageable through the available technological tools. Therefore, new approaches are needed for the way data are organized and processed by organizations [
6]. In response to these challenges, the significant benefits of using data have led to the emergence of “Data Science” as a distinct field, encompassing Artificial Intelligence (AI), Data Mining (DM), and Machine Learning (ML), as stated by Provost and Fawcett [
7]: “At a high level, data science is a set of fundamental principles that guide the extraction of knowledge from data”. Data Science (DS) covers all relevant techniques and methods, combining multiple interdisciplinary sciences to extract meaning and insight from complex and large organizational data. By merging technology with mathematical knowledge, it explores, visualizes, and utilizes algorithmic/mathematical computation to gain an understanding of existing organizational problems [
8,
9].
Organizations have benefited greatly from the use of big data, as they have created new spaces for expansion. However, data can be very shallow assets, meaning they will never return useful information by simply being inputted into an algorithm [
9]. Issues such as the five V’s (i.e., volume, velocity, variety, veracity, and value) hinder big data and can jeopardize the efficiency of the process. In the case of health data, they can be categorized into objective data, originating from measurable sources, or subjective data, meaning data that exist in our minds based on past experiences and observations, which allows us to detect attitudes through sentiment analysis [
9,
10]. Techniques such as AI, DM, and ML are explored in terms of measuring patterns in behavior (physical or mental), but not in terms of internal conditions such as attitudes or beliefs that would otherwise be collected through other gathering methodologies such as interviews, observations, literary records, or surveys [
10].
Since management deals with human motivation and behavior, employees are pivotal in achieving the objectives of the organization. It is essential to consider not only the patients’ information, mindsets, views, and practices but also, and perhaps more critically, those of the workforce within the system [
2]. Concerns have been raised about the present and future significant decrease in health human resources, compounded by the growing demand for chronic care and a predisposition towards burnout among health professionals. The need for appropriate administration, improvement, and preservation of healthcare workers (HCWs) is, therefore, evident. To meet such standards, HOs must adopt new technological knowledge that can deliver easy-to-implement, effective solutions for complex human resources management challenges [
11]. The ideal way to gather data that accurately reflects an organization’s reality is by obtaining it directly from its own foundation—namely, the users of the organization. Thus, the most suitable informants would be the HCWs, who, as daily observers of the conditions within these organizations, provide the most valuable and relevant information about the organization’s actual state. This article makes use of such a tactic by presenting an approach where beliefs, expectations, group knowledge, and general knowledge become the focus of a causal model or system, with the value determined by the states of the variables within the system. By applying the Theory of Declarative Knowledge based on an entropic perspective for Knowledge Representation and Reasoning (KRR), it allows the construction of scenarios in the form of “X and optionally Y” or “X or otherwise Y”, depending on the logical values that the alternatives may present, ranging from 0 to 1.
This case study translates HCWs’ responses to specific questionnaire topics into logical programs to assess the HO’s performance, from which conclusions were drawn and future work outlined. The study aimed to explore HCWs’ views within a HO, focusing on leadership, teamwork, and work engagement. It seeks to answer the following research question: How do healthcare professionals perceive the overall functioning of their organization in terms of leadership, teamwork, and work engagement?
1.1. Network of a Health Organization
The network of an organization, or task-oriented working group, is a management form designed to foster a more organic organization. This approach creates a representative and involved atmosphere that facilitates the exchange of problems, views, and beliefs among the workforces. Such a structure is particularly suitable for the complex and dynamic environments found in HOs, where staff specialization is high, and both technology and organizational roles are constantly evolving. In these settings, shared management is crucial when making decisions that affect both healthcare workers and patients. Moreover, strong leadership alone is insufficient in such a synergistic system; a culture of engagement and empowerment must be cultivated [
2].
Implementing a network form of administration in health systems management encourages and empowers HCWs to actively participate in and impact their work environment. This involvement makes the workforce feel valued and more engaged in the organization’s success, thus, improving outcomes for both staff and patients and enhancing job and patient satisfaction. The goal is to promote cooperation within the organization so that workers feel respected and acknowledged. By integrating an efficient network model where continuous communication is maintained, HCWs will be more engaged with the organization’s goals and feel more validated. The purpose of such a model is to strengthen the relationship between the workforce and leadership by enhancing the transfer of knowledge between the two groups, aiming to achieve better results. However, implementing a network organization is challenging and complex. Engaging leaders and workers in the process can be difficult, as workers may not initially understand the benefits of such a collaborative approach. To effectively address these challenges, HOs can utilize advanced feedback tools. These tools are designed to capture comprehensive insights on organizational dynamics, providing a detailed picture of engagement levels and areas requiring improvement. By analyzing this feedback, leadership can pinpoint specific resistance points and misconceptions, allowing for targeted interventions. Training programs and workshops can then be tailored based on the insights gained, ensuring that they directly address the actual concerns and knowledge gaps identified among the workforces [
2].
This challenge is less pronounced with the new workforce being educated in these ideologies. Future generations of workers will likely adopt a different stance toward the organization’s policies, demanding participation, empowerment, and control over their roles as respected members of the organization [
12]. To facilitate the transformation of the health system in a more fluid transition, HOs must adopt a more organic approach to problem-solving. This includes implementing technological practices that promote a network-oriented health organization more effectively, where reluctance and opposition to change are minimized. Unlike traditional hierarchical models, which rely on rigid structures and top-down decision making, healthcare organizations are designed to grant clinicians professional autonomy, ensuring that decisions remain closely tied to medical expertise. However, strict role divisions can sometimes hinder coordination and slow response times in complex environments. Networked models do not replace this structure but instead enhance collaboration by enabling real-time data sharing, interdepartmental communication, and participatory decision making. These approaches help streamline processes while maintaining autonomy and preserving specialized roles within the healthcare system. Networked models, on the other hand, empower frontline workers and facilitate a faster exchange of ideas, enabling quicker decision making and more adaptive responses to patient needs. However, these models require a strong foundation of open communication and shared goals to prevent disorganization and ensure that all voices are heard and effectively coordinated.
1.2. Health Organization as an Entropic System
Organizations, such as social systems, are artificial constructs with orderly structures that deliver services to the population. Management serves as a tool to maintain order within the organization, enhancing efficiency through the systematic division of workforce and leadership distribution.
In terms of entropy, highly structured organizations often exhibit stagnation and low levels of organizational entropy. In contrast, networked organizations are more adaptable, granting more freedom to the workforce and fostering a sense of empowerment. HOs typically experience high levels of organizational entropy. Thus, management can be viewed as the process of managing this entropy. Moreover, during organizational transformations, especially under transformational leadership, entropy tends to increase [
13].
Despite advancements, data quality often lacks the reliable insights needed from processed information. HOs typically gather data from various traditional sources, such as observational documents, commentaries, and repositories, as well as from the routines, performances, rules, and procedures of HCWs. Managing organizational entropy plays a pivotal role in shaping healthcare outcomes. High entropy, marked by flexibility and empowerment, generally enhances staff satisfaction and patient care by promoting a more responsive and engaged workforce. In contrast, low entropy environments, defined by rigid structures and top-down decision making, can stifle innovation and delay responses to the rapidly changing demands of healthcare. By strategically managing entropy, organizations can harness its benefits to improve operational efficiency and patient outcomes.
In a HO, knowledge is dispersed throughout the network and is generated by HCWs through their personal experiences, sentiments, and values related to the working environment. This knowledge is then assimilated by the management team and leaders. Therefore, it is crucial to utilize tools capable of measuring the existing knowledge entropy within an organization. Doing so can help reduce the volume of redundant knowledge stored in the network, thereby facilitating the sharing of knowledge by HCWs and distributing their experiences across the network [
13]. By strategically managing the challenges presented by high entropy, HOs can foster a culture that enhances innovation, improves care delivery, and maximizes the overall health system performance.
2. A Thermodynamic Approach to Knowledge Representation and Reasoning
This article presents one way to measure the entropic state of the HCWs in an HO. It is assumed that the entropy ranges in the interval 0…1, where low entropy corresponds to order and high entropy to disorder or chaos [
14]. Indeed, the problem-solving methodology presented in this article is based on The Laws of Thermodynamics and aims to describe the practices of KRR as a process of energy degradation [
15]. In order to explain the basic rules of the proposed approach, the First and Second Law of Thermodynamics are considered, attending to the idea that one’s system moves from state to state over time. The former, also known as the Energy Saving Law, states that the total energy of an isolated system is constant, i.e., cannot change over time. This means that energy can be converted but cannot be generated or destroyed. The latter deals with entropy, a property that quantifies the orderly state of a system and its evolution. These characteristics fit the proposed vision of KRR practices, as this must be understood as a process of energy degradation, i.e., energy can be decomposed and used in sense of devaluation, but never used in the sense of destruction [
14], viz.
Exergy (EX), sometimes called available energy or more precisely available work, is the part of the energy that can be arbitrarily used by a system, or in other words, giving a measure of its entropy;
Vagueness (VA), i.e., the corresponding energy values that may or may not have been consumed;
Anergy (AN), which is the energetic potential that has not yet consumed, being, therefore, available, i.e., all of the energy that is not exergy.
There are many approaches to KRR using the epitome of Logic Programming (LP), namely in the areas of Model Theory and Proof Theory for problem solving. In this article, the Proof Theoretical approach to problem solving was adopted and expressed as an extension of the LP language [
16]. Under this setting, an LP program will be grounded on a finite set of clauses, as shown in Algorithm 1.
| Algorithm 1. A Prime Instance of a Logic Program. The first clause denotes the closure of the predicate, “,” designates “logical and”, while “?” is a domain atom denoting “falsity”, and “p1, …, pn”, “p”, “q1, …, qm”, and “q” are classical ground literals. |
| { |
| not p, not exceptionp |
| p1, …, pn, not q1, …, not qm |
|
|
| } |
The classical ground literals are either positive atoms or atoms preceded by the classical negation sign [
16]. Indeed stands for strong negation, while not denotes negation-by-failure, i.e., a failure in proving a certain statement since it was not declared in an explicit way. According to this way of thinking, a set of abducibles are present in every program [
17]. In this work are given in the form of exceptions to the extensions of the predicates that make the program, i.e., clauses of the form, viz.
These clauses denote data, information, or knowledge that cannot be simply deleted. On the other hand, clauses of the type, viz.
These invariants make it possible to specify the context under which the universe of discourse should be understood. They enable the development of robust frameworks for reasoning, where exceptions and constraints are integrated seamlessly into the knowledge representation process. Such logical structures, when combined with principles from thermodynamics, offer a powerful foundation for analyzing and improving the efficiency and adaptability of AI systems.
Building on this foundation, the integration of Computational Collective Intelligence with disciplines like Knowledge Representation, Thermodynamics, and Mathematical Logic provides a robust framework for intelligent decision making [
18,
19]. This interdisciplinary approach applies thermodynamic principles to assess AI systems, emphasizing energy efficiency and entropy as key factors for performance and sustainability [
20,
21]. Its adaptability and flexibility make it suitable for a wide range of applications:
Complex Data Environments: Focus on energy efficiency helps structure AI systems to manage and process large datasets effectively, crucial in big data analytics and cloud computing [
22,
23];
Decision-Making Systems: Mathematical logic enhances AI’s reasoning capabilities, precision, and reliability in applications like autonomous vehicles and financial systems, ensuring that decisions are sound, verifiable, and systematically derived [
23];
Dynamic Systems: The framework supports AI adaptability and continuous learning, ideal for robotics and systems in evolving environments [
24];
Interdisciplinary Applications: Integration across fields like healthcare and environmental science ensures comprehensive solutions that address ethical, sustainable, and technical considerations [
25].
This integrated approach is both novel and universally applicable, demonstrated through its success in diverse case studies [
26,
27].
3. Methodology
This section provides a detailed description of the study design, data collection procedures, instruments employed, sample characteristics, and data analysis methods, along with the ethical considerations observed throughout the research process.
3.1. Study Design
This study aimed to evaluate the perspectives of HCWs in a HO regarding leadership, teamwork, and work engagement. It sought to answer the following research questions:
What are healthcare workers’ perceptions of the performance of their organization in terms of leadership, teamwork, and work engagement?
What are the levels of work satisfaction among healthcare workers in the organization, and what insights can be drawn to understand the factors influencing their satisfaction?
The study was conducted in a hospital in Northern Portugal, chosen for its accessibility and relevance to the research objectives. Like most healthcare organizations, the hospital operates as a complex and interconnected structure, providing a suitable context for assessing the interplay between leadership, teamwork, and work engagement.
The research followed a longitudinal design as the same participants completed questionnaires over a five-month period. A Likert scale was employed to collect data and to facilitate the transformation of non-numeric information into numeric data, following the methodology proposed in [
28].
The instrument was a comprehensive questionnaire consisting of multiple sections, each informed by a thorough literature review. These sections included the following:
Sociodemographic Data: Attaining age, gender, profession, academic qualifications, and years of professional experience;
Leadership: Assessing HCWs’ perceptions of their leaders’ effectiveness in fostering trust, collaboration, and motivation;
Teamwork: Evaluating the confidence and cohesion within workgroups in addressing challenges and achieving organizational goals;
Work Engagement: Measuring HCWs’ enthusiasm, dedication, and absorption in their role dedication, and absorption in work.
The questionnaire was designed to facilitate the transformation of qualitative perceptions into quantifiable data, enabling an evaluation of organizational dynamics. This structure provided a clear framework for capturing and analyzing HCWs’ insights while ensuring data validity and reliability. In focusing on HCWs’ perspectives, this study aimed to provide actionable insights directly from those most engaged with the day-to-day operations of the HO. These findings contribute to a deeper understanding of the key factors influencing leadership, teamwork, and engagement within HOs.
3.2. Data Collection
The choice of a questionnaire survey method arose from a thorough examination of available techniques, with the decision bolstered by its simplicity and adaptability. Although questionnaire surveys may lack depth and context, they provide efficiency, standardization, and anonymity.
The questionnaire devised for this study was divided into two segments. The first segment aimed to gather sociodemographic information, encompassing details like age, gender, profession, academic qualifications, and years of professional experience. Although not directly utilized in the study’s analysis, these data offer a general understanding of the population characteristics. The second segment explored a series of statements addressing the core topics under investigation (i.e., Healthcare Organization Leadership—Four Elements (HOL-4); Healthcare Organization Work Engagement—Three Elements (HOWE-3); and Healthcare Organization Teamwork—Three Elements (HOTW-3)). Participants were prompted to select the option(s) that aligned with their opinions on each statement. If they had no opinion, they could choose the “I don’t know” option, which represented uncertainty or vagueness, thus, preventing them from answering questions randomly. Furthermore, they were also requested to indicate the progression tendency of his/her answer, e.g., for the HOL-4 an increasing tendency (never → very frequently) or the opposing (very frequently → never).
Each section was designed to assess HCWs mindsets regarding the HO working environment. HCWs were asked to share their perspectives by responding to statements on topics such as leadership, work engagement, and teamwork, where the reason for the individual’s answers lies in the query “As a member of the healthcare organization how much would you agree with each one of the statements?”. The statements associated with each of the topics mentioned earlier can be found in
Table 1.
The primary goal of the HOL-4 topic include the statements as the ones presented on Carless et al. [
29], using a five-level Likert scale (i.e., never (1), rarely (2), occasionally (3), frequently (4), very frequently (5)). The purpose is to evaluate the HCWs’ general judgements regarding their leader’s capability to lead. The existent complexity in a HO creates a huge constrain on the development of the organization leadership; they are confronted with multiple environmental regulations and numerous hierarchies of experts on both the management and medical sides of the organization [
30]. Strong leadership is needed due to its effects, not only on their workforce but also on their patients. Leadership can be interpreted as the conduct that an individual has when guiding the function of a group to achieve a common goal. In an HO, this leadership must be transformational; leaders should be capable of empowering and motivating their workforce by shearing their vision in a meaningful manner so that it will create union and commitment among the collective. Also, by using shared leadership, staff will have the opportunity to manage and develop within a team, improving both the workplace environment and the level of work satisfaction. It is a continuous process that involves constant assessment of the relationship between leaders and HCWs [
31].
Regarding the topic HOWE-3, it includes the statements as the ones presented in Schaufeli et al. [
32], using a five-level Likert scale (i.e., never (1), rarely (2), sometimes (3), often (4), always (5)). The purpose is to evaluate how engaged a HCW is in their work. Work engagement is linked to work motivation in terms of performance and behavior that a worker has, being an essential factor in the improvement of the performance of the organization. Therefore, the objective is to identify the characteristics of the organization that provides engagement to the worker [
33]. Work engagement can be viewed as a positive state of mind related to the workers’ sentiment of fulfillment in executing their daily tasks. The notion is that high levels of vigor, dedication, and absorption from the worker can be implemented onto a more positive organizational behavior. HCWs with healthy work engagement maintain a balanced relationship with their work, avoiding compulsive behaviors or addictive tendencies. In contrast, those driven by workaholism and excessive exhaustion face a higher risk of burnout, as their work takes control of their lives [
34].
Finally, the set of statements included in the topic HOTW-3 include the statements as the ones presented in Salanova et al. [
35], using a five-level Likert scale (i.e., strongly disagreeing (1), disagreeing (2), neutral (3), agreeing (4), strongly agreeing (5)). Teamwork is essential for HOs and is an ongoing procedure of collaboration between team members while working, regardless of which team they are designated. It requires unanimous cooperation on meeting the shared goal, where members abdicate their independence and engage in the team decisions. With effective teamwork, better decisions are executed, complex tasks are accomplished, and coordination and knowledge are enriched, leading to better patient outcomes and a decrease in medical mistakes and costs. Factors such as hierarchies between professionals, the shift in daily routines and the difficulty of managing human relationships and personalities tend to be the root for unsuccessful teamwork. Thus, investigators have tried to extract essential information from data to help improve teamwork management within HOs. With efficient teamwork, there is an improvement in the happiness and health of the HCW and an increase in the care provided to the patients [
36,
37].
To guarantee the questionnaire’s validity and relevance, a group of specialists reviewed the Portuguese version and suggested improvements, which were incorporated into the updated version. The revised questionnaire’s clarity and validity were then tested with a small pilot group, excluded from the main study, and their feedback helped further refine the instrument. Finally, the reliability of the updated questionnaire was evaluated using Cronbach’s alpha, yielding a coefficient of 0.84 for the second segment. The questionnaires were administered monthly for a period of six months, spanning from September 2023 to February 2024. Each participant received a hard copy of the questionnaire in person. All 68 distributed questionnaires were always returned, resulting in a 100% return rate. The questionnaire was answered anonymously, and all participants agreed to participate over a period of six months by completing the questionnaire monthly. The participants received a secret personal code when they first answered the questionnaire, enabling researchers to identify responses from the same participant across multiple instances.
3.3. Participants
The study involved an opportunity sample of 68 HCWs from a hospital in Northern Portugal. Participants voluntarily completed a questionnaire during the study period. The age of the participants ranged from 30 to 50 years, with a mean age of 37 years. Gender distribution included 65% women and 35% men.
The group represented various healthcare professions, with the majority being nurses (39.7%), followed by physiotherapists (19.1%), doctors (16.2%), medical technicians (11.8%), pharmacists (10.3%), and radiology technicians (2.9%). Participants had diverse academic qualifications, primarily bachelor’s degrees (58.8%), with some holding master’s degrees (26.5%) or professional specializations (14.7%).
The participants reported professional experience ranging from 5 to 25 years, reflecting a broad spectrum of expertise across different roles. This diversity in professional backgrounds and experience provided a well-rounded perspective for the study, capturing insights into healthcare organization within the hospital setting.
3.4. Qualitative Data Processing
The information obtained in the second segment of the questionnaire uses for the topic of HOL-4 a five-level Likert scale (i.e., never (1), rarely (2), occasionally (3), frequently (4), very frequently (5)). However, since the tendency of progression of the HCW’s response was also asked, the Likert scale can be expanded to consider nine levels:
The same logic is applied to the Likert scale of the other topics. The expanded Likert scales should be read either from left to middle, indicating a progression from very frequently (5) to never (1), or from middle to right, indicating a progression from never (1) to very frequently (5). The first reading suggests a shift towards a more negative perspective or a disagreement with the statements presented, whereas the second suggests a shift towards a more positive perspective or an agreement with the statements.
Following the methodological framework introduced in [
28], the non-numeric information was transformed into numerical information. In accordance with this methodology, the z responses associated with each theme are visualized in a circle with a radius of
within the circle, z sections are delineated, with a mark on the axis indicating each response option, as described in
Section 4.
3.5. Ethical Aspects
The research was conducted in accordance with existing legal norms and ethical standards. All participants were fully informed about the objectives of the study and provided voluntary consent before participation. Confidentiality and anonymity of the participants were strictly maintained throughout the study. All responses were securely stored and accessible only to the research team.
4. Case Study
The case study makes use of LP for KRR, where data are implanted and transformed according to the Laws of Thermodynamics [
38]. The HCWs’ mindset in relation to the organization working environment was obtained and examined at the individual level.
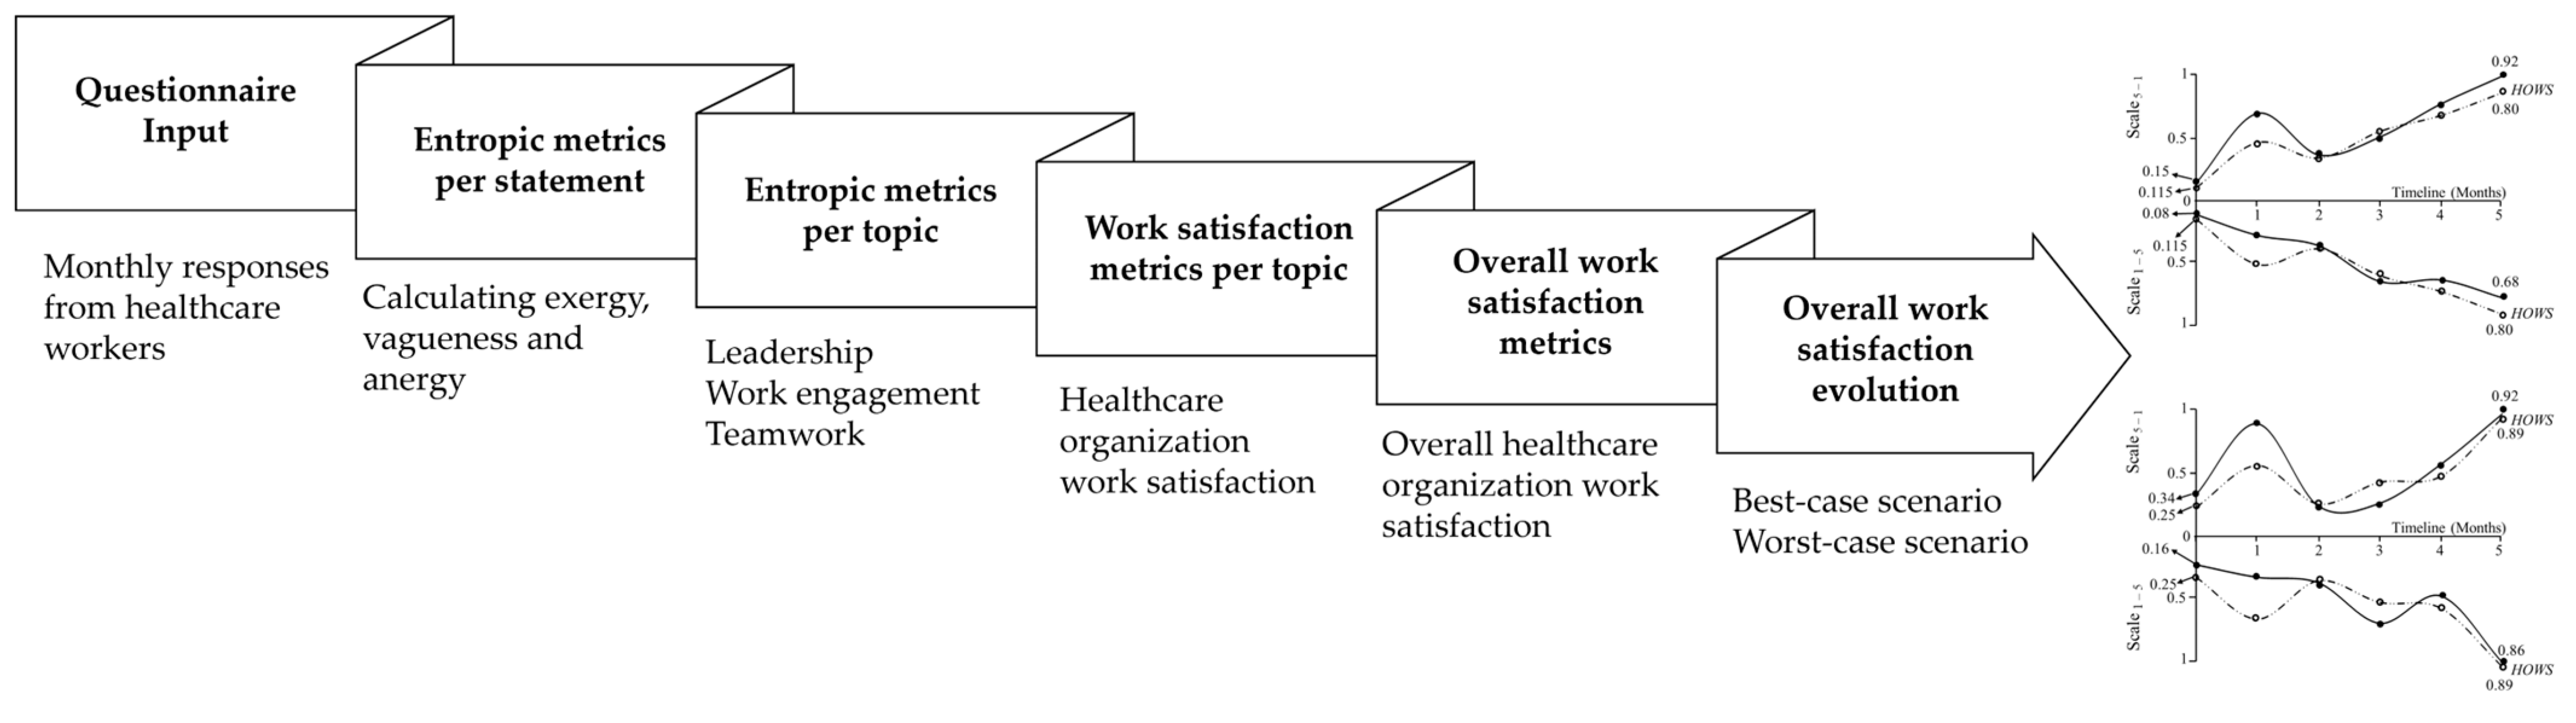
Figure 1 illustrates the framework followed in this study, which includes transforming participants’ responses into a symmetrical nine-level Likert scale, evaluating exergy, vagueness, and anergy for each statement and topic, assessing healthcare organization work satisfaction (HOWS) per topic, and analyzing the overall HOWS and its evolution over a six-month period.
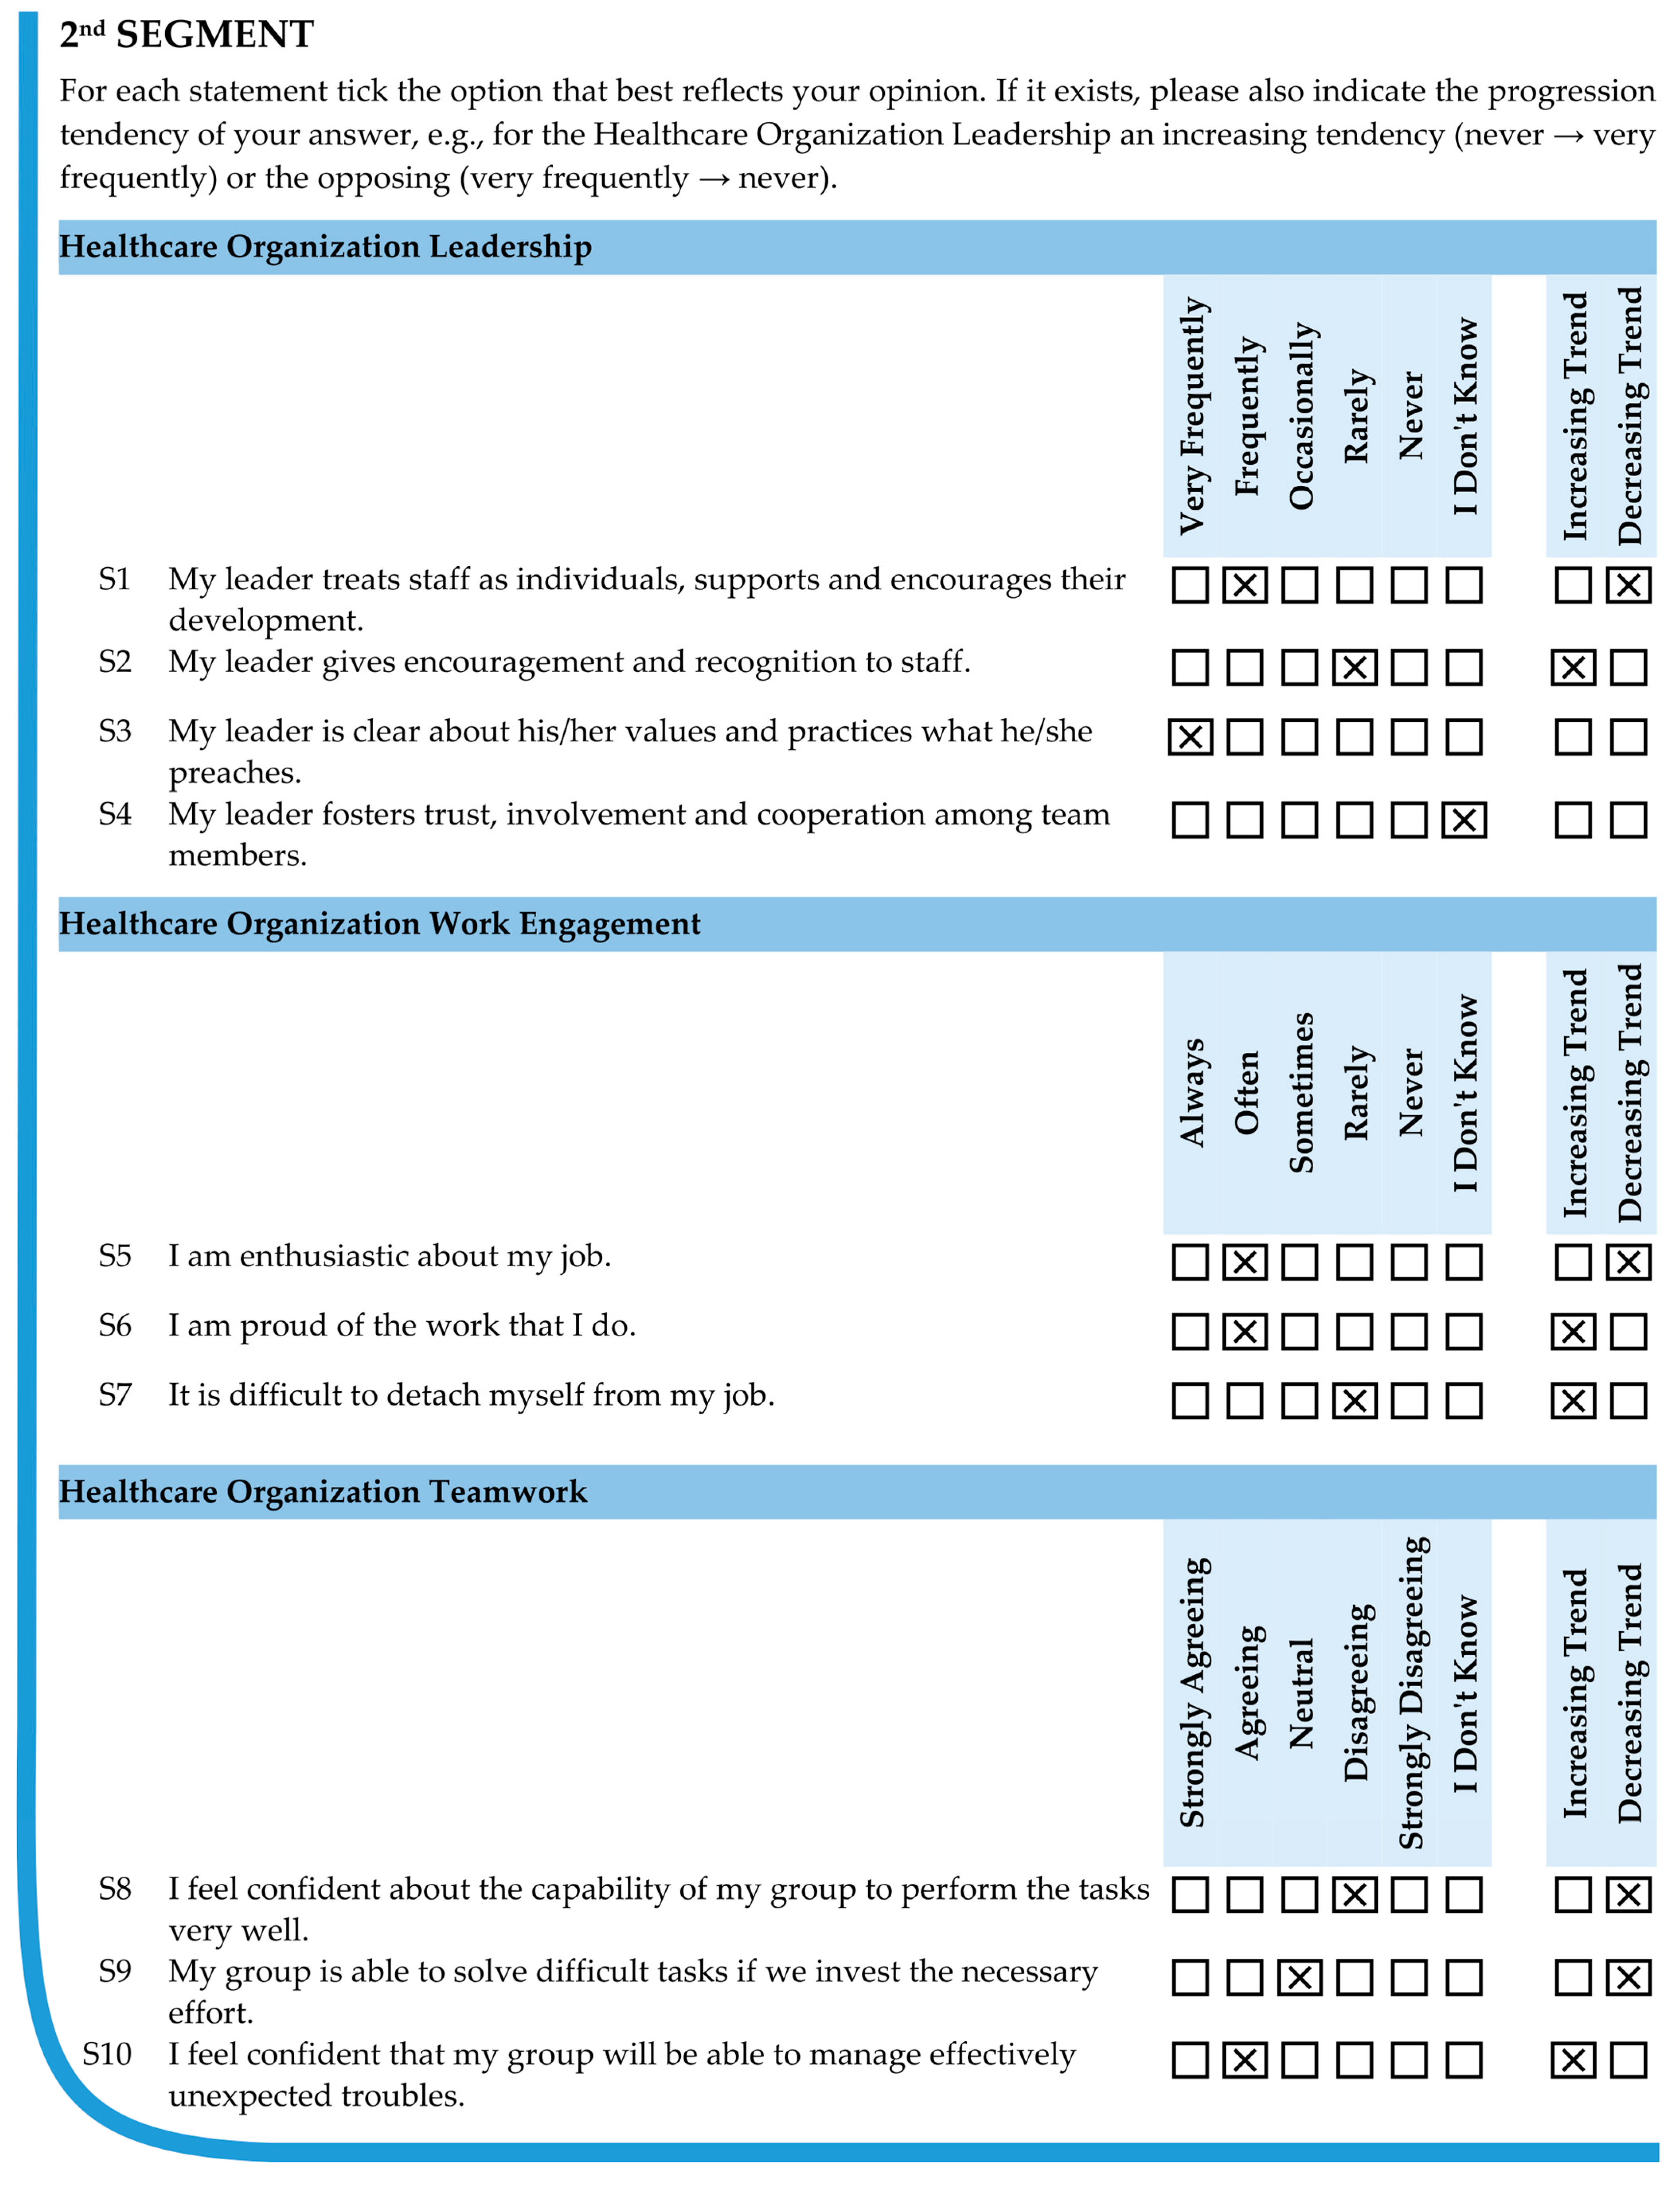
Figure 2 presents the responses of participant one to the second segment of the questionnaire at month 0.
Table 1 presents the conversion of those responses taking into account the expanded Likert scale. For example, for the HOL-4 topic at month 0, the answer to S1 was frequently (4) indicating a decreasing tendency in his/her opinion. Therefore, this response should be evaluated on a scale from very frequently (5) to never (1), with frequently representing the best-case scenario (BCS) and occasionally as the worst-case scenario (WCS), as illustrated in
Table 2. For S2, the response was rarely (2), indicating an increasing tendency in his/her opinion. In this case, the response should be placed on the positive scale, ranging from never (1) to very frequently (5), with occasionally as the BCS and rarely as the WCS (
Table 2). Regarding S3, participant one selected very frequently (5) without indicating any trend. This response should be positioned on the negative scale, ranging from very frequently (5) to never (1), as it may either remain unchanged or deteriorate over time. Finally, for S4, no options of the scale were marked, corresponding to a vague situation. In this case, although the values of the different forms of energy (i.e., exergy, vagueness, and anergy) are unknown, it is known that the bandwidth is the interval 0, …, 1 [
15].
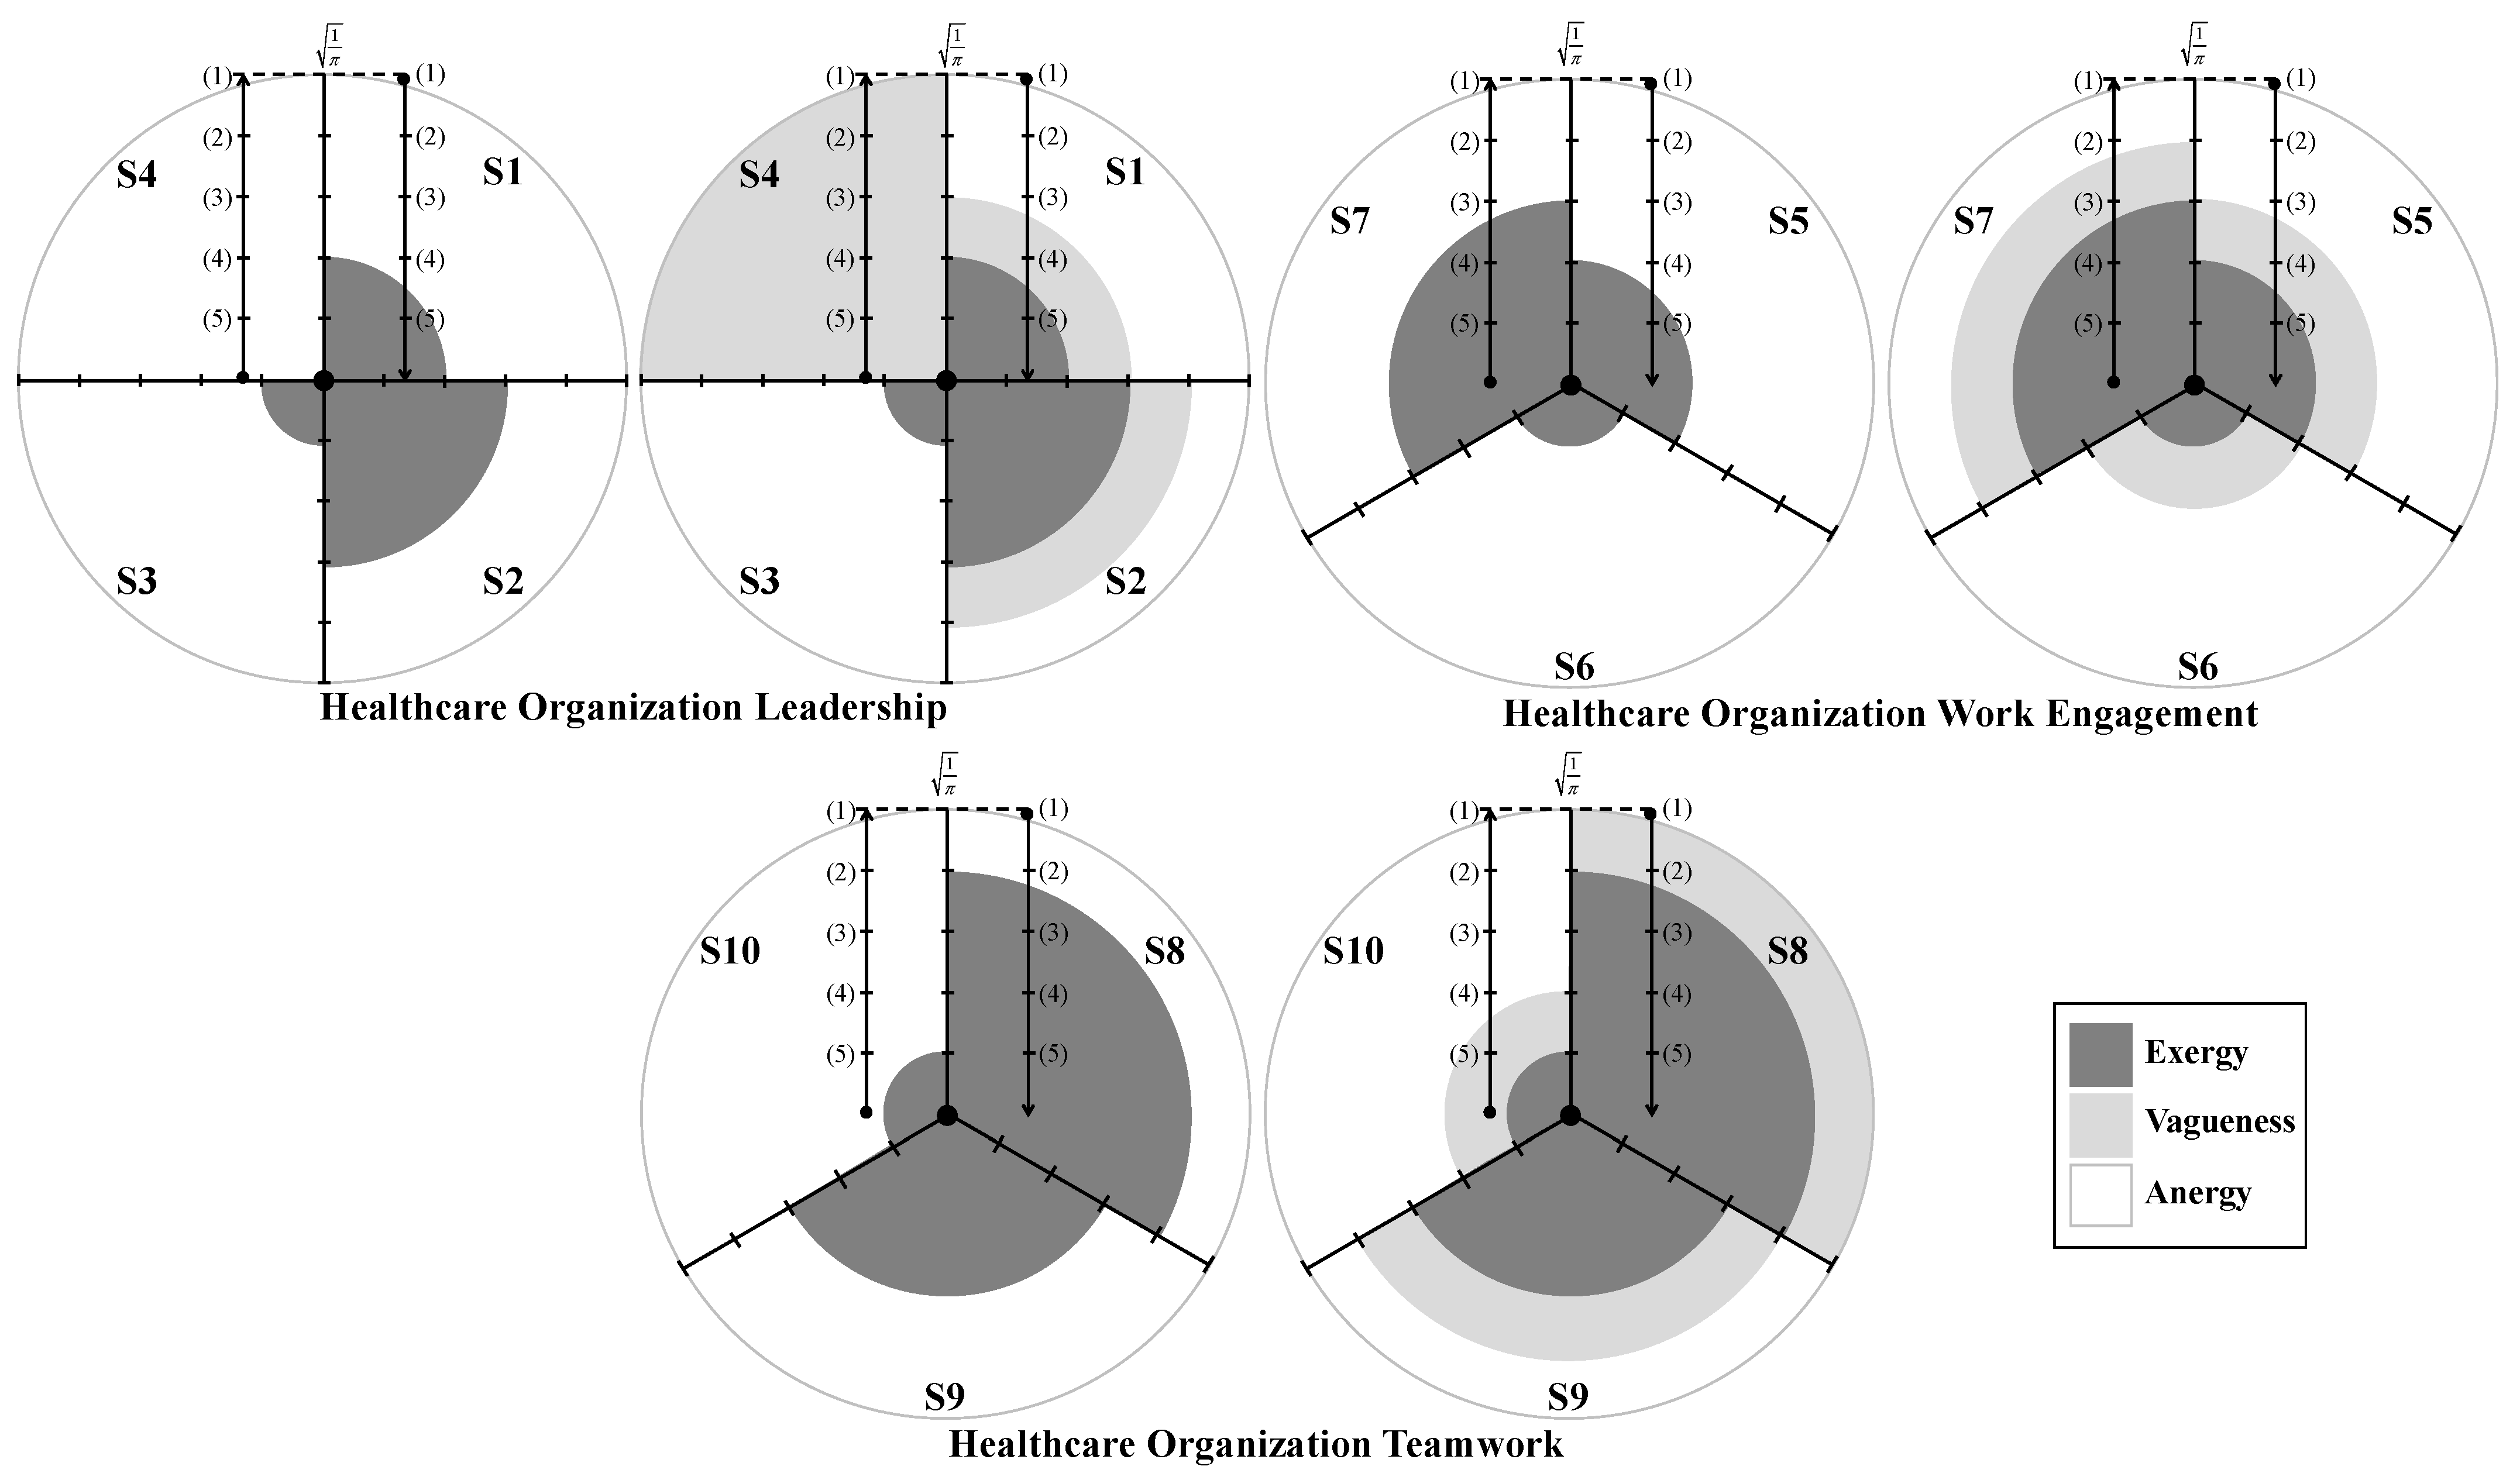
Figure 3 presents the visual interpretation of participant one’s answers to the topics considered in the study at month 0. The dark areas represent exergy, indicating high-energy states or useful energy; the gray areas symbolize vagueness, suggesting uncertainty or indeterminate energy states; and the white ones stand for anergy, where energy cannot be harnessed for work [
15,
28,
39]. Since the symmetrical nine-level Likert scale can be read from left to middle, indicating a shift toward a more negative perspective, or from middle to right, indicating a shift toward a more positive perspective, the axis markings in
Figure 3 are interpreted as follows:
From bottom to top (i.e., from the most positive to the least positive answer), meaning increasing entropy and a decline in system performance;
From top to bottom (i.e., from the least positive to the most positive answer), meaning decreasing entropy and an improvement in system performance.
Figure 3.
A pictorial reading of the participant one answers to statements S1 through S10, segmented by topics (healthcare organization leadership (HOL-4), healthcare organization work engagement (HOWE-3) and healthcare organization teamwork (HOTW-3)), at month 0, in the best-case and worst-case scenarios. (1), (2), (3), (4), and (5) denote, respectively, never, rarely, occasionally, frequently, and very frequently for HOL-4; never, rarely, sometimes, often, and always for HOWE-3; and strongly disagreeing, disagreeing, neutral, agreeing, and strongly agreeing for HOTW-3. The dark, gray, and white colored areas correspond to exergy, vagueness, and anergy.
The colored regions in
Figure 3 correspond to circular areas representing exergy (dark zones) and annular areas representing vagueness and anergy (gray and white zones, respectively). Since the participants’ answers are plotted along a radial axis of
, divided into five equal sections, the axis marks correspond to the radii
and
. Exergy (dark zones) was computed using the formula for the area of a circle:
where
represents the number of statements per topic (i.e.,
for healthcare organization leadership, and
for the remaining topics), and
denotes the radius corresponding to the most positive response.
Regarding vagueness (gray regions), the best-case scenario results in zero, as only the most positive response is considered. In the worst-case scenario, both the most positive and least positive responses are included. Therefore, the area representing vagueness corresponds to the annular region, calculated using the formula:
where
denotes the radius of the larger circle, while
denotes the radius of the smaller circle. Thus,
corresponds to the radius of the most positive response, and
corresponds to the radius of the least positive response.
With respect to anergy (white zones), it also corresponds to the area of an annular region. Here, is the radius of the outer circle, i.e., . In the best-case scenario, corresponds to the radius of the most positive response, while in the worst-case scenario, corresponds to the radius of the least positive response.
4.1. Evaluating the Entropic State of the Healthcare Workers for the Best-Case Scenario
The answers of participant one to topic HOL-4 at month 0 will be used to illustrate the assessment of the areas shown in
Figure 3 for the BCS. Thus, for this topic, one may have:
In statement S1, the options frequently and occasionally were considered (
Table 2), so
and
;
In statement S2, the options occasionally and rarely were considered (
Table 2), so
and
;
In statement S3, only the option very frequently was considered (
Table 2), so
.
In statement S4, the option I don’t know was selected corresponding to a vague situation (
Table 2), so
and
;
The quantitative values of the areas shown in
Figure 3 for HOL-4, at month 0, for both scales (ranging from very frequently (5) to never (1) and vice versa) are presented in
Table 3 for the BCS.
Thus, for participant one, the overall values of exergy, vagueness, and anergy related to the HOL-4 topic in the BCS are determined using the values from
Table 3 on the scale from very frequently (5) to never (1), as follows:
whereas, for the scale from never (1) to very frequently (5), the values are as follows:
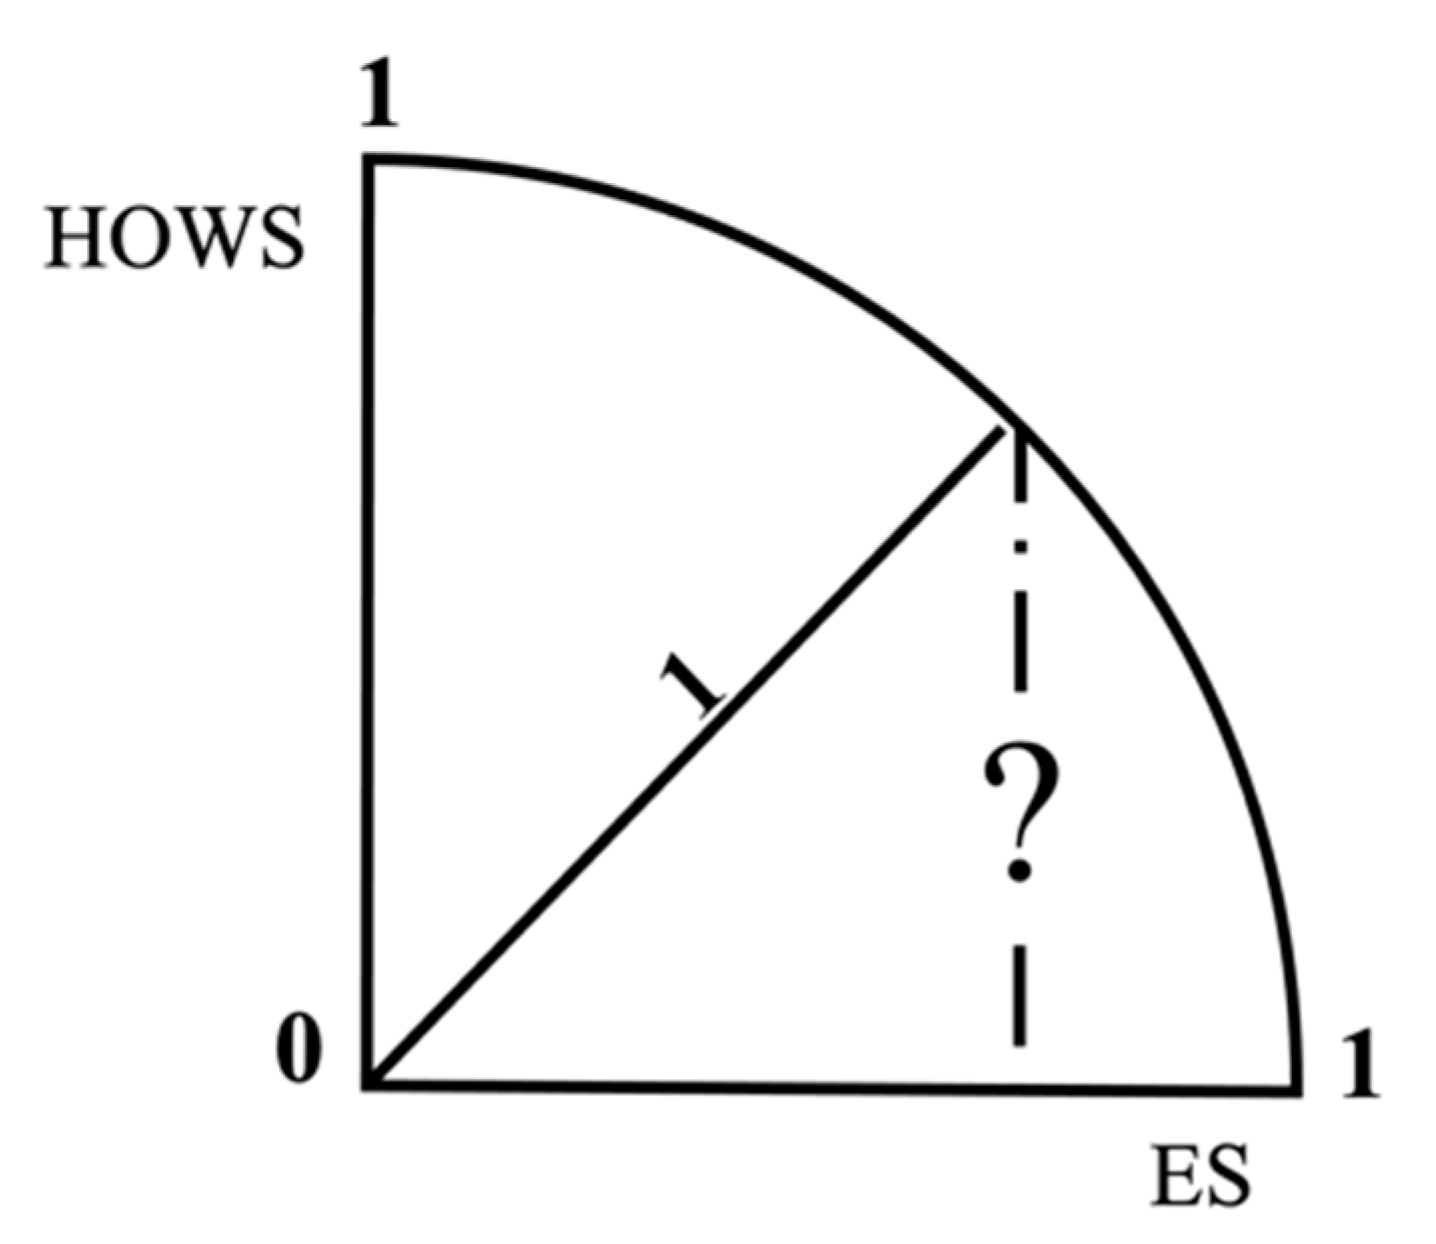
Additionally, HOWS and the quality of information (QoI) for each topic can be evaluated. HOWS is calculated based on
Figure 4 using Equation (3), while QoI is determined using Equation (4).
where
stands for entropic state, which is defined as the sum of exergy and vagueness.
The QoI is a multidimensional construct encompassing the economic, ecological, and social dimensions of sustainability in both qualitative (
Table 2) and quantitative forms (
Table 4). It helps determine the HCW’s entropic conditions within the HO, illustrating how HCWs identify with and adapt to the organizational environment. This is measured based on the truth values of multi-valued logic, with a bandwidth ranging from 0 to 1 [
40].
The answers of participant one to topic HOL-4 at month 0 will be used to illustrate the evaluation of HOWS and QoI. Thus, for this topic, one may have the following:
Similarly, using the framework outlined above, the values of exergy, vagueness, anergy, HOWS, and QoI for each participant can be calculated. For participant one, the values for each topic under investigation (i.e., HOL-4, HOWE-3, and HOTW-3) are presented in
Table 4 for the BCS.
4.2. Evaluating the Entropic State of the Healthcare Workers for the Worst-Case Scenario
Regarding the WCS, the calculation of the regions marked in
Figure 3 must consider both the most positive and least positive responses. Thus, for participant one, the quantitative values of the areas shown in
Figure 3 for HOL-4, at month 0, for both scales (ranging from very frequently (5) to never (1) and vice versa), are provided in
Table 5. Additionally,
Table 6 presents the overall values of exergy, vagueness, and anergy, along with HOWS and QoI for HOL-4, HOWE-3, and HOTW-3.
4.3. Case Study’s Formal Description
Logic programming is a creative process that applies deductive methods for problem olving, aiming to construct evidence for a given assumption. This framework establishes the foundation for a symbolic evaluation of HOWS and a measure of the quality of information associated with this process, creating a multi-valued logical framework where truth values range from 0 to 1 [
39,
40]. The formal representation of a HCW’s answers to the second segment of the questionnaire using LP can now be provided. Algorithm 2 presents participant one’s responses based on the data from
Table 4, related to the BCS, while Algorithm 3 provides the corresponding representation for the WCS using the data from
Table 6.
| Algorithm 2. The formal description of participant one’s answers to the second segment of the questionnaire for the best-case scenario at month 0, using logic programming. |
| { |
| /* The sentences below state that the extending of predicates hol-45–1, hol-41–5, howe-35–1, howe-31–5, hotw-35–1, and hotw-31–5, are based on explicitly specified clauses and those that cannot be dropped */ |
| { |
|
|
|
|
| } |
| { |
|
|
|
|
| } |
| { |
|
|
|
|
| } |
| { |
|
|
|
|
| } |
| { |
|
|
|
|
| } |
| { |
|
|
|
|
| } |
| } |
| Algorithm 3. The formal description of participant one’s answers to the second segment of the questionnaire for the worst-case scenario at month 0, using logic programming. |
| { |
| /* The sentences below state that the extending of predicates hol-45–1, hol-41–5, howe-35–1, howe-31–5, hotw-35–1, and hotw-31–5, are based on explicitly specified clauses and those that cannot be dropped */ |
| { |
|
|
|
|
| } |
| { |
|
|
|
|
| } |
| { |
|
|
|
|
| } |
| { |
|
|
|
|
| } |
| { |
|
|
|
|
| } |
| { |
|
|
|
|
| } |
| } |
It is, therefore, possible to evaluate the HCW’s awareness of a HO’s performance in the BCS, based on their responses to the questionnaire over a six-month period (
Figure 5). The HCW’s progression is determined by proving Theorems 1 and 2 using the values corresponding to the BCS (presented in
Table 4 for month 0).
Theorem 1. Scale (5) to (1).
Theorem 2. Scale (1) to (5).
In every possible way and according to the timeline (
Figure 5) and Program 2 [
39,
40], it is demonstrated that it is feasible to monitor and predict the evolution of HOWS with the state of affairs at the HO. This can be achieved by forecasting based on a mathematical proof, i.e., all possible sequences that combine the terms or clauses related to the extensions of the predicates HOL-4, HOWE-3, and HOTW-3, the number of which can be determined from Equation (5).
where
is the predicate extension combination subset. Thus, one may have a template that results from a proof of Theorem 1, under scale
5–1, for the different scenarios, viz.
Proof of Theorem 1. The logical programs with the combinations of the predicates for Theorem 1 under scale5–1 for different scenarios are expressed as follows:
outputting the results, viz.
HOWS may now be weighed under scale
5–1 according to the template, viz.
outputting the results, viz.
In turn, QoI may now be weighed under scale
5–1 according to the template, viz.
outputting the results, viz.
□
Subsequently, a template that results from a proof of Theorem 2 under scale1–5 for the different scenarios, viz.
Proof of Theorem 2. The logical programs with the combinations of the predicates for Theorem 2 under scale1–5, for different scenarios are expressed as follows:
outputting the results, viz.
HOWS may now be weighed under scale
1–5 according to the template, viz.
outputting the results, viz.
In turn, QoI may now be weighed under scale
1–5 according to the template, viz.
outputting the results, viz.
□
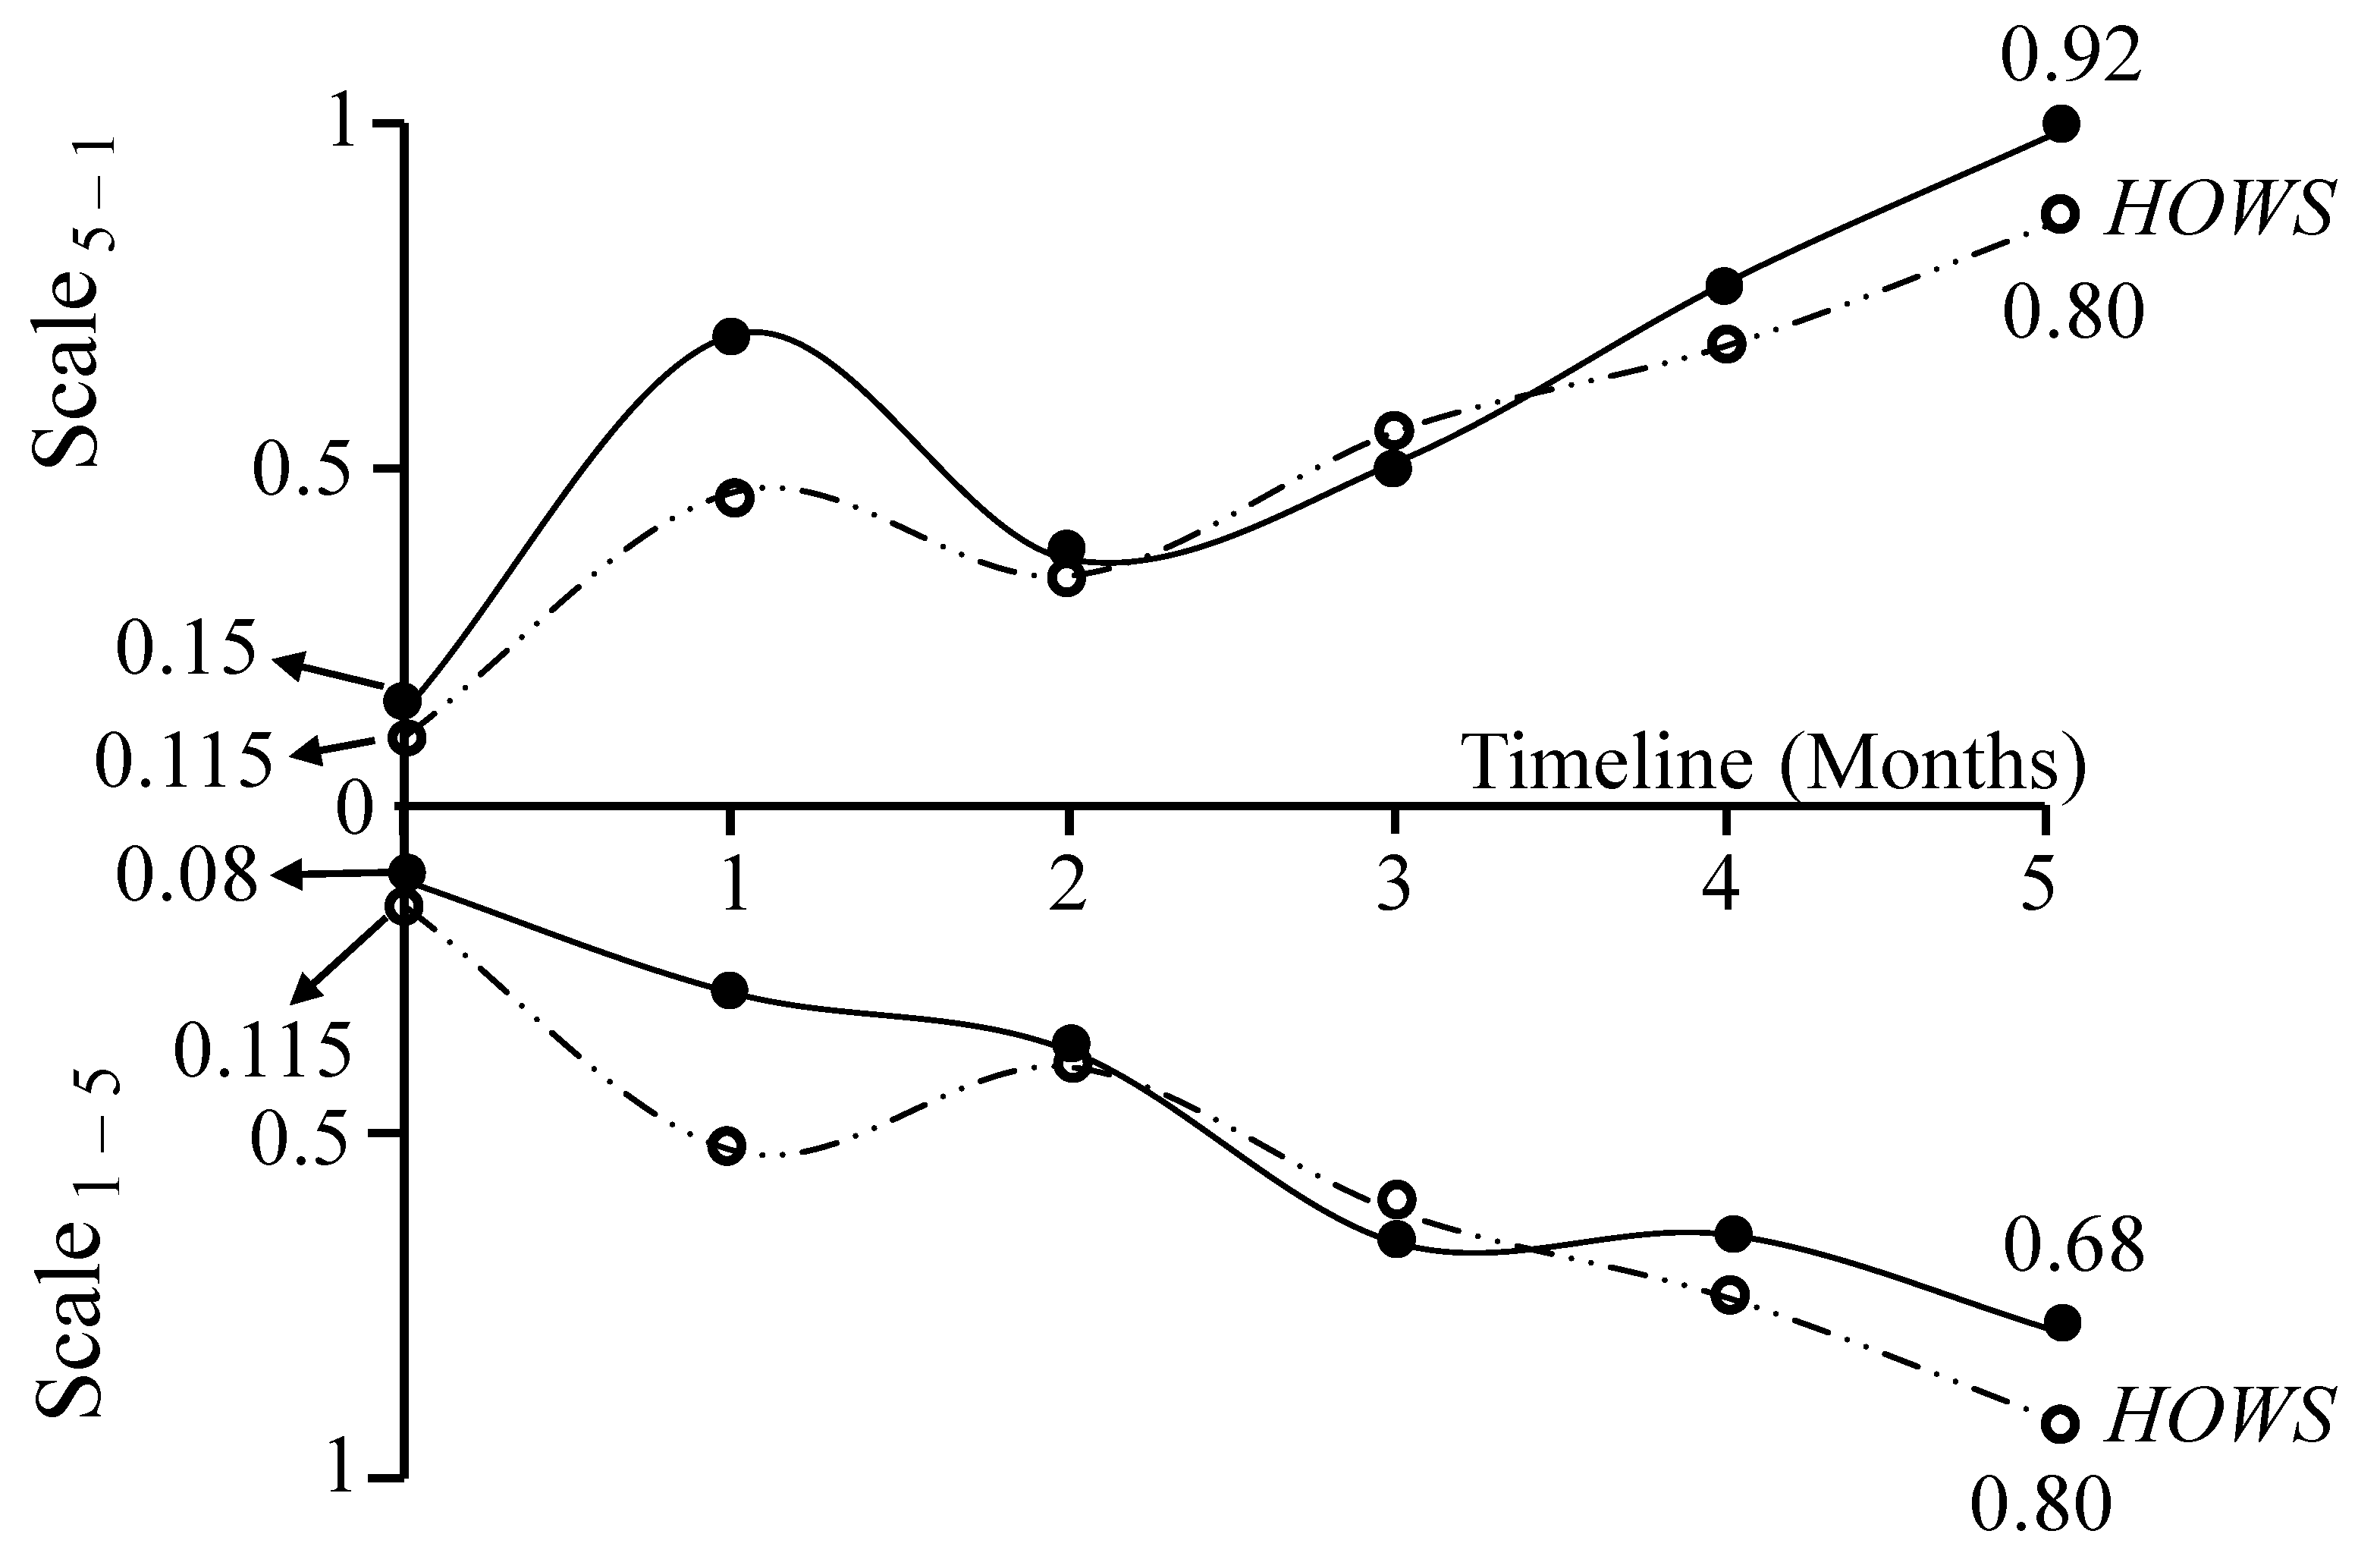
Over the six-month period during which the study took place, information was collected monthly. The calculations for the remaining months are not presented here, as they are similar to those presented for month 0. A visualization of the results of the theorems presented above, derived from the HCW’s responses to the questionnaire over six months, is shown in
Figure 5. The results for Theorem 1 are represented on the scale
5–1 axis, while the results for Theorem 2 are shown on the scale
1–5 axis. This visualization provides valuable insights into the patterns observed in the HCW’s perception of the HO’s working environment under both scales.
The quantification of overall HOWS, based on HCWs’ perception of HOs’ working conditions over time, is performed using Equation (6):
where
stands for entropic state, which is defined as the sum of the exergy (EX) and vagueness (VA). The overall HOWS considers the entropic state values associated with the catch-all clause, which covers all individual terms (
Table 4). Therefore, the values corresponding to months 0 and 5 are as follows:
When a HCW’s entropic state is near zero (low entropy), the corresponding overall HOWS value is also near zero, indicating a perception that the HO is functioning properly (e.g., in month 0, with a HOWS value of 0.115). Conversely, when a HCW’s entropic state is close to one (high entropy), it suggests that the HO is not functioning properly (e.g., in month 5, with an overall HOWS value of 0.80). The patterns observed in
Figure 5 suggest that HCWs perceive a tendency for deterioration in the HO’s functioning without a corresponding improvement to counterbalance it.
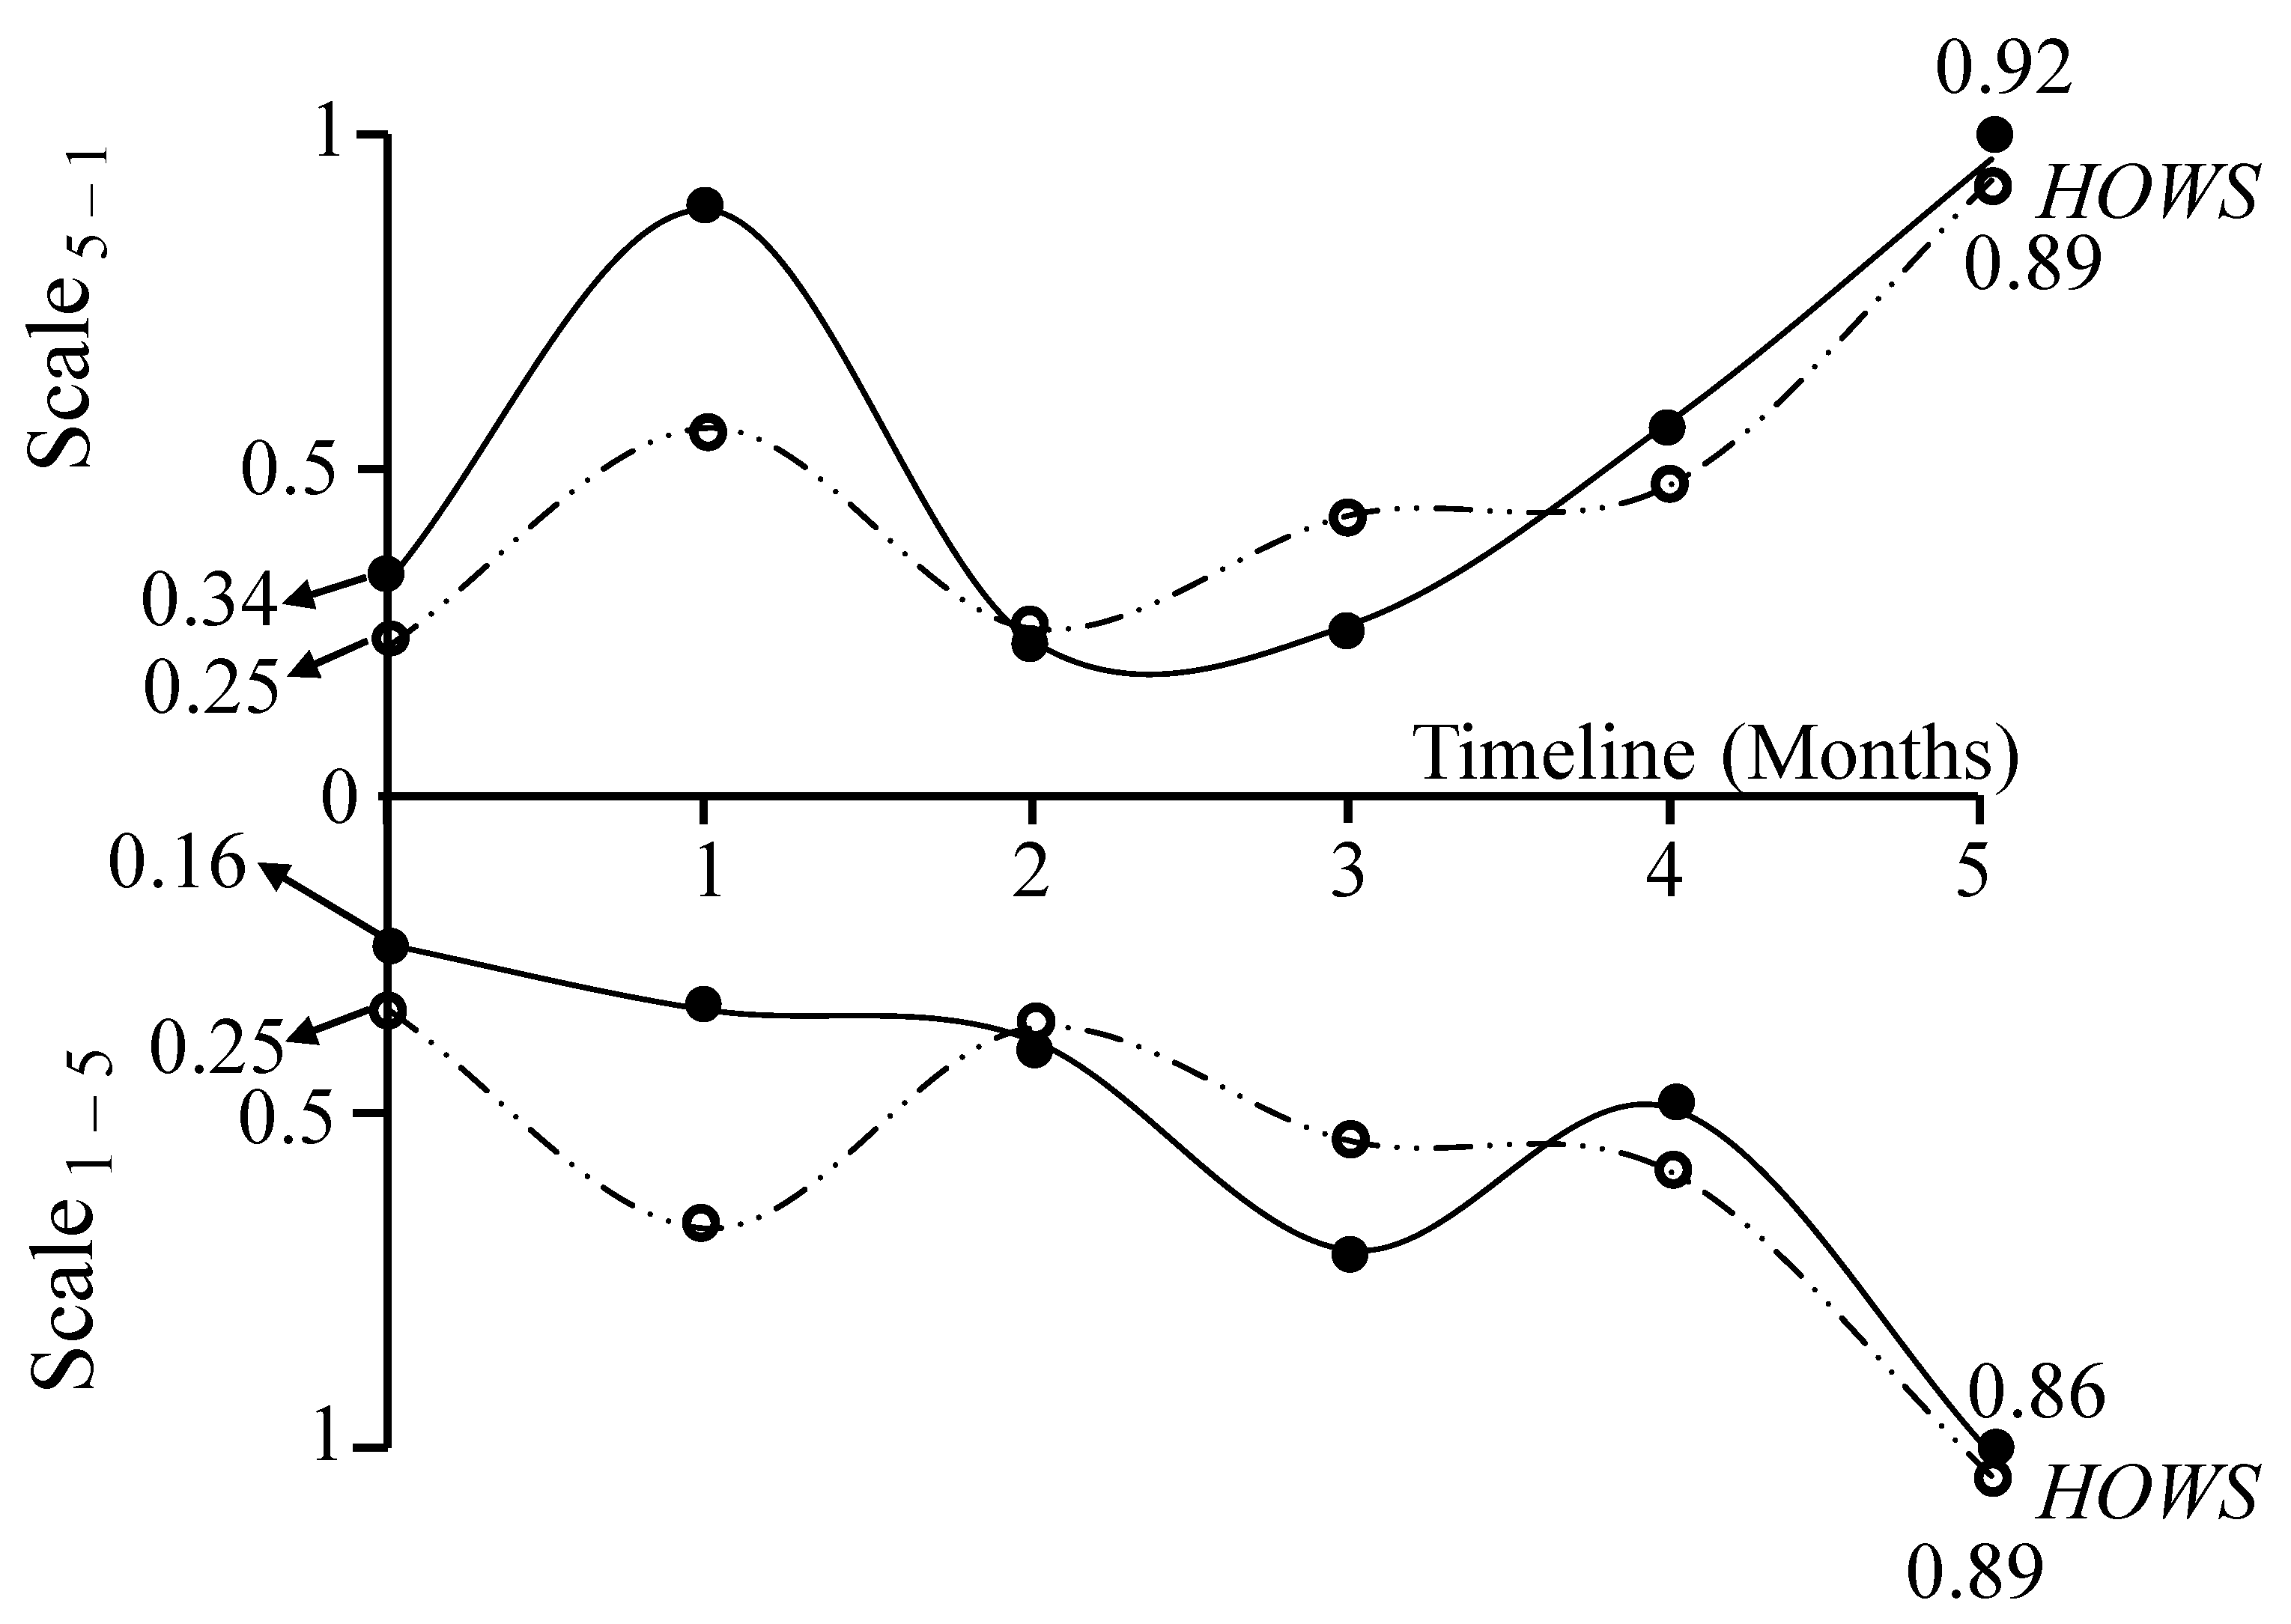
Regarding the WCS, it is also possible to evaluate the HCW’s awareness of a HO’s performance based on their responses to the questionnaire over a six-month period (
Figure 6). The HCW’s progression is determined by proving Theorems 1 and 2 using the values corresponding to the WCS (presented in
Table 6 for month 0).
The values HOWS corresponding to months 0 and 5, in the WCS are as follows:
The patterns observed in
Figure 6 align with those seen in the BCS (
Figure 5). However, in the WCS, the tendency for deterioration in the HO’s functioning is more pronounced, as the overall HOWS values are higher.
Using the corresponding values, it is possible to analyze the evolution of HOWS for each topic (
Table 4 and
Table 6) or statement (
Table 3 and
Table 5) following the same methodology. The analysis for specific professional groups (e.g., nurses) can also be conducted by considering only their responses. However, this requires a sufficiently large sample for reliable results.
4.4. Case Study’s Results Analysis
The results presented in this case study provide an in-depth exploration of the HCWs’ perceptions of the HO’s performance and work satisfaction. By examining both the BCS and WCS, a dual perspective emerges, highlighting optimistic and pessimistic interpretations of the same data. These analyses underscore the dynamic interplay of factors such as leadership, teamwork, and engagement within the HO, offering actionable insights into its operational strengths and challenges.
The BCS, illustrated in
Figure 5, represents the HCW’s perception of the overall HOWS under an optimistic lens. Derived from proofs of Theorems 1 and 2, the overall HOWS reflects critical dimensions of organizational dynamics within the scale
5–1 and scale
1–5 frameworks. Starting at 0.115 (
), the overall HOWS signals low entropy and a perception of stability, suggesting that the HCW initially viewed the HO as functional with minimal inefficiencies. Over six months, the overall HOWS steadily increases to 0.80 (
), revealing a progressive perception of growing inefficiency and disorder. This trajectory reflects the dominance of perceived deterioration over perceived improvement, emphasizing that the HCW viewed operational challenges as overshadowing positive developments. This is likely due to perceived lapses in leadership effectiveness, weakening teamwork, and reduced engagement, which collectively contributed to a growing sense of inefficiency by the HCW. This highlights not only growing dissatisfaction with the HO’s performance but also an increasing uncertainty by the HCW about their own stated views of the HO’s working environment. The erosion of confidence in the overall HOWS correlates with declining perceptions of leadership effectiveness, teamwork cohesiveness, and HCW engagement.
The WCS, presented in
Figure 6, contrasts the BCS by analyzing the same data through a more pessimistic lens. Beginning at 0.26 (
), the overall HOWS highlights an initial perception of inefficiencies and operational challenges, escalating sharply to 0.89 (
). This trajectory reflects a more critical evaluation, with HCWs emphasizing inefficiencies over potential improvements.
These findings illustrate how varying interpretations of the same data can reveal different aspects of organizational performance and areas for improvement. When compared, the BCS and WCS offer complementary insights. The BCS provides a tempered view of gradual decline under relatively favorable conditions, while the WCS amplifies perceptions of inefficiencies and challenges. Together, they provide a holistic view of the HCW’s perception. Both scenarios consistently highlight key issues in leadership, teamwork, and engagement from the perspective of the HCW regarding the HO’s effectiveness. Therefore, the integration of the BCS and WCS findings provides a comprehensive framework for understanding HCWs’ perceptions and their implications for organizational performance. By examining these scenarios together, organizations can identify strengths to build upon and weaknesses requiring immediate attention. This dual analysis emphasizes the need for targeted interventions that address inefficiencies, rebuild trust, and enhance engagement. The combined insights underscore the necessity of a strategic, data-driven approach to organizational development, leveraging both optimistic (BCS) and pessimistic (WCS) scenarios to ensure sustained improvement and resilience.
5. Discussion
This study offers a comprehensive exploration of the relationship between HO performance and HCW satisfaction, focusing on leadership, teamwork, and work engagement. A novel approach is introduced for evaluating entropic efficiency in problem-solving scenarios, drawing inspiration from thermodynamic principles to enhance knowledge organization for computational interpretation. By leveraging DS and integrating AI techniques, the study demonstrates how structured knowledge can inform intelligent decision making in HOs, paving the way for more adaptive and efficient management practices. The research emphasizes the critical role of HCW empowerment within HOs, arguing that improved leadership, teamwork, and engagement practices contribute significantly to navigating the complexities of these dynamic environments. By actively involving HCWs in decision-making processes and tailoring management practices to their needs, the study underscores the transformative potential of these technologies to reshape HOs. This perspective highlights the dual focus of technology and human-centric management, positioning the study as a bridge between computational advancements and organizational well-being.
The study employs a detailed questionnaire that captures the HCWs’ perceptions and awareness of their working environment, examining the impact of current management practices on their satisfaction and engagement. By analyzing responses over several months, the study provides a geometric interpretation of HCWs’ entropic states. This innovative metric offers valuable insights into the evolving dynamics of HOs, revealing the intricate interplay between management strategies and HCW empowerment in fostering organizational transformation. When analyzing the results of this study, it becomes evident that the achieved outcomes are intertwined with various other research findings, connecting technological advances with enhancements in HO settings [
41]. Zhu and Zheng [
42] and Ohno-Machado [
43] demonstrate the ability of predictive analytics and advanced algorithms to improve clinical and organizational outcomes. Similarly, Santamato et al. [
44] explore AI’s strategic benefits in quality assurance and resource management while acknowledging ethical challenges like data privacy. These align with this study’s use of AI-driven methods to interpret HCW feedback, enabling data-driven management strategies and fostering organizational adaptation. Additionally, Spruit et al. [
45] emphasize self-service DS tools, empowering healthcare professionals to independently analyze data, reducing reliance on Information Technology (IT) teams. This supports the study’s emphasis on engaging HCWs through participatory processes, enabling proactive involvement in organizational decision making and workplace satisfaction.
Leadership emerges as a cornerstone for HCW engagement and performance. Mazzetti and Schaufeli [
46] highlight engaging leadership styles that enhance team cohesion and effectiveness, resonating with the study’s focus on leadership fostering HCW empowerment. Similarly, Kumar [
47] underscores collective leadership’s role in sustaining quality improvement in HOs, while Stillman et al. [
48] advocate for empathetic leadership to mitigate burnout and improve workforce engagement. Hundie and Habtewold [
49] validate transformational leadership as an effective approach to fostering supportive and inspiring environments, aligning with this study’s conclusion that proactive leadership fosters satisfaction and engagement.
In terms of teamwork, Schmutz et al. [
50] demonstrate a strong correlation between teamwork and improved healthcare performance, emphasizing communication and coordination as key drivers. Zaheer et al. [
51] further highlight how collaborative efforts reduce errors and improve patient safety. These findings complement the study’s exploration of cohesive teamwork, which reduces organizational entropy and enhances efficiency.
Structured feedback mechanisms and psychosocial tools are essential for understanding HCW experiences. Karamitri et al. [
52] highlight the importance of knowledge-sharing practices, paralleling this study’s use of questionnaires to assess HCW perceptions and inform leadership strategies. Similarly, Kristensen et al. [
53] demonstrate how tools like the Copenhagen Psychosocial Questionnaire (COPSOQ) improve employee well-being and organizational outcomes, supporting this study’s approach to gathering nuanced insights to guide management practices. Additionally, Ilse [
54] emphasizes the need for ethical leadership training to navigate complex decision making in healthcare. Pestoff [
55] advocates for governance models prioritizing staff autonomy and patient inclusion, aligning with the study’s emphasis on empowering HCWs and integrating their insights into organizational strategies. These findings support this study’s focus on fostering a positive organizational culture through ethical and participatory governance.
This study situates its findings within a robust body of research, highlighting the critical role of DS, AI, leadership, work engagement, and teamwork in transforming healthcare management. By leveraging entropic metrics, predictive analytics, and structured feedback tools, the study bridges theoretical advancements and practical applications, demonstrating how technology and human-centric management practices converge to optimize HO performance and HCW satisfaction. The questionnaire design reflects a strong emphasis on engaging HCWs, generating empirical data that reinforces the need to improve management practices using DS knowledge. The findings align with previous studies, validating the significance of technology-driven methodologies in optimizing organizational performance. Moreover, the study extends this research landscape by proposing a synergistic approach where AI technologies are not merely tools but strategic enablers for enhancing HO efficiency and fostering HCW empowerment. The research highlights the importance of aligning empirical findings with theoretical advancements, creating a continuous dialog that refines our understanding of the synergies between technology and societal benefits. By interweaving its findings with the broader academic discourse, this study contributes to the interdisciplinary exploration of HO management, workforce empowerment, and the transformative role of technology in healthcare. Therefore, this study provides a constructive addition to the ongoing exploration of how emerging technologies can enhance HO performance, economic efficiency, and human resources management. By focusing on leadership, teamwork, and work engagement, the research emphasizes the strategic importance of HCW empowerment and the transformative potential of technology in healthcare management. The findings not only highlight immediate applications but also encourage a broader conversation about the future of HOs, where data-driven strategies, empowered workforces, and adaptive management practices collectively contribute to sustainable organizational development.
When considering the significance of the results obtained from analyzing questionnaire responses over a six-month period within the context of HOs, it is essential to evaluate the reliability and validity of these results to mitigate the influence of arbitrary factors. The study’s novel approach to evaluating entropic efficiency in problem-solving scenarios such as organizational dynamics suggests that the methodology is both rigorous and systematic, aiming to reflect the true relationship between the HO performance and work satisfaction of the HCWs in terms of leadership, teamwork, and work engagement in HOs. The premise that lower entropy values denote order and higher values reflect disorder provides a quantifiable measure of understanding. HCWs with structured and consistent responses display low entropy, suggesting a firm grasp of the concepts in question. Conversely, high entropy values indicate varied and possibly chaotic responses, characteristic of less understanding or misconceptions. For example, HCWs who perceive poor leadership, lack of teamwork, or minimal engagement may exhibit high entropy due to fragmented or inconsistent answers. In contrast, those with clear and positive perceptions of their organizational environment exhibit low entropy, demonstrating coherent and in-depth understanding.
By embracing a data-driven, interconnected management approach, the study leverages DS, incorporating AI techniques, to enable more proactive decision making within HOs. The methodology provides actionable insights into the true dynamics of the organization by extracting meaningful knowledge through HCWs’ responses. This work highlights the potential of data to foster systematic improvements in both organizational performance and workforce satisfaction. Firstly, the significance of the results lies in the trends observed over a continued period (
Figure 5 and
Figure 6). These findings are not one-off measurements but represent patterns emerging from systematically collected data over six months, minimizing the likelihood of random fluctuations or temporary biases. The geometric interpretation of HCWs entropic states provides a mathematical and visual representation of this evolution, reinforcing the argument that the observed changes are structured and significant. Secondly, the study employs a detailed and well-defined questionnaire, divided into specific topics (i.e., HOL
-4, HOWE
-3, and HOTW
-3), to capture the multifaceted dynamics of healthcare organizational life. By continuously monitoring, providing feedback, assessing, and reviewing the collected data, the tool fosters managerial and educational changes within the working environment. This process not only ensures consistency but also facilitates long-term organizational adaptation. Such systematic processes align with the dynamic nature of HOs, which require regular evaluation to meet the demands of complex and rapidly changing environments. The act of completing a questionnaire itself can raise awareness and prompt reflection on the topics covered. In this context, HCWs may be nudged to think about organizational dynamics—leadership, teamwork, and engagement—that they might not have otherwise considered, potentially altering their level of understanding. It is crucial to examine whether this heightened attention, spurred by the questionnaire itself, constitutes an artificial influence. Any form of measurement inherently impacts the subject being measured—a phenomenon comparable to the “observer effect” in quantum mechanics. In the case of completing a questionnaire, this effect could manifest as an increase in participants’ awareness of organizational dynamics. If answering the questionnaire leads to enduring engagement with these concepts, fostering continued reflection and curiosity, the influence can be deemed constructive. However, if the impact is fleeting, dissipating soon after the questionnaire is completed, it could be considered artificial—a transient spike in awareness without lasting value. The entropic approach employed in this study helps gauge the quality of understanding that arises from this process. By analyzing the evolution of HCWs’ entropic states over time, researchers can ascertain whether the questionnaires have a lasting impact or simply prompt momentary reflection. Indeed, the act of completing a questionnaire has the potential to both evaluate and influence HCWs’ understanding of organizational dynamics. While there is a risk that the influence could be artificial, it ultimately depends on the persistence of the effect. In the present case, if engagement with the concepts of leadership, teamwork, and work engagement continues beyond the questionnaire, it can lead to a genuine enhancement of understanding. Therefore, it is not the immediate influence that should be scrutinized but the long-term effects on HCWs’ comprehension and attitudes toward these critical organizational elements. This reflects the advantages of fostering a more organic organization, where HCWs feel valued and engaged. Empowerment of the workforce not only enhances job satisfaction but also contributes to better outcomes through a culture of participation, control, and mutual respect. These elements are essential for transitioning from traditional hierarchical structures, including professional bureaucracies, to network-oriented health organizations that emphasize cross-functional collaboration and data-driven decision making. While professional autonomy remains the foundation of clinical decision making, integrating networked communication structures and real-time feedback mechanisms enhances interprofessional teamwork and improves responsiveness to complex patient care needs. This approach preserves the benefits of the professional bureaucracy model while minimizing inefficiencies caused by rigid administrative processes. The questionnaires serve as advanced feedback tools, capturing comprehensive insights into organizational dynamics. By analyzing responses, management can identify resistance points, address misconceptions, and foster organizational transformation. This process ensures that leadership is better equipped to manage the high organizational entropy characteristic of HOs, enabling a balance between flexibility and structure. Furthermore, the insights derived from personal experiences, sentiments, and values shared by HCWs offer a nuanced understanding of their working environment.
The ability to process and manage entropy through these tools ensures that HOs can adapt and innovate effectively, fostering both improved organizational performance and HCW satisfaction. By enabling continuous monitoring and promoting meaningful feedback loops, the study demonstrates the potential for long-term, data-driven improvements. By supporting the transformation of HOs into network-oriented organizations and fostering an adaptable, empowered workforce, this study demonstrates how systematically collected and analyzed data can drive impactful changes. Through the integration of advanced methodologies, this work highlights the potential to create lasting improvements in organizational performance, workforce engagement, and patient care outcomes. Improvements in leadership, teamwork, and work engagement have a significant impact on both clinician performance and patient outcomes. Schmutz et al. [
50] found that effective teamwork enhances communication, reduces errors, and promotes a culture of shared decision making, ultimately improving healthcare performance. Additionally, high work engagement is strongly associated with lower burnout, greater motivation, and higher job satisfaction, leading to better patient-centered care and increased healthcare efficiency [
56]. Beyond leadership and engagement, interprofessional collaboration plays a crucial role in patient adherence and satisfaction. Valentine et al. [
36] found that workplace structures fostering open communication and participation enhance workforce morale and contribute to safer patient outcomes. These findings align with the present study’s focus on optimizing healthcare organizations through structured leadership, teamwork, and engagement strategies, reinforcing the broader organizational and clinical impact of its results.
Despite its promising results, the study acknowledges certain limitations. The primary constraint lies in the sample size, which consisted of an opportunity sample. Expanding the sample to include participants from across other Portuguese HOs would enhance the generalizability of the findings, allowing for broader insights into Portuguese HCWs’ perceptions. Additionally, incorporating more detailed socio-demographic and socio-economic data could provide a deeper understanding of the factors influencing HCWs’ satisfaction and engagement. Future research can build on these insights by exploring the longitudinal impacts of AI-driven tools and addressing emerging challenges in workforce dynamics and ethical governance. This interdisciplinary approach underscores the potential for DS to reshape healthcare organizations into more adaptive, empowered systems capable of meeting the complex demands of modern healthcare. However, it is important to emphasize that while the entropic-based approach enhances decision making, misinterpretation or misuse of data may lead to unfair workforce evaluations or overly rigid managerial actions. To mitigate these risks, it is essential to maintain ethical oversight, ensure transparency, and implement proper data governance to foster trust and support constructive organizational improvements.
Future studies could further validate the findings by examining variations in HCW perceptions across different regions, professions, and organizational structures. This would enable more robust conclusions about the role of leadership, teamwork, and engagement in HOs while better reflecting the employee structure within these organizations. Moreover, the research adopts a forward-looking perspective, focusing on the potential of emerging technologies for societal benefits while acknowledging the need to address associated risks and limitations. This optimistic stance reflects the aspirational goals of DS, AI, and HO management, which aim to harness innovation to optimize human life and promote sustainable development. While the study’s primary objective is to propose solutions and frameworks for iterative refinement, future research can expand on this foundation by critically examining the potential drawbacks and unintended consequences of technological integration in HOs. Thus, in the future, it would be beneficial to administer the surveys regularly (e.g., every four months) after the initial five-month period to better determine the persistence of the educational and reflective impact. Only through longitudinal studies is it possible to truly understand whether the questionnaires act as momentary catalysts for awareness or as effective tools for fostering lasting improvements in HCWs’ perceptions of their organizational environment.


