Article

Review-Aware Recommendation Based on Polarity and Temporality

1
School of Economics and Management, Chongqing University of Posts and Telecommunications, Chongqing 400065, China
2
Key Laboratory of Data Engineering and Visual Computing, School of Artificial Intelligence, Chongqing University of Posts and Telecommunications, Chongqing 400065, China
3
Global Development Institute, University of Manchester, Manchester M13 9PL, UK
4
Chongqing Talent Development Center, Chongqing 400065, China
*
Authors to whom correspondence should be addressed.
Algorithms 2025, 18(12), 756; https://doi.org/10.3390/a18120756
Submission received: 20 October 2025 / Revised: 17 November 2025 / Accepted: 27 November 2025 / Published: 28 November 2025

Abstract

Review-aware recommendation systems aim to enhance recommendation performance by leveraging user reviews and their associated attributes to model user preferences. However, most existing methods fail to address two critical challenges introduced by user reviews: polarity bias and temporal dynamics. Polarity bias refers to inconsistencies between a user’s numerical ratings and the sentiment expressed in their reviews—for example, a user might give a restaurant a high rating while writing a negative review. In addition, user preferences may evolve over time, as individuals can review the same item on multiple occasions. To address these issues, we propose RARPT, a review-aware recommendation framework that jointly models polarity and temporality. Specifically, we process positive and negative reviews separately and employ a sequential model to capture the temporal evolution of user preferences. We also introduce a polarity balance module, which uses a cross-attention mechanism to generate supplementary collaborative vectors from reviews of the opposite polarity, thereby mitigating both quantitative and relational imbalances. We conduct extensive experiments on two real-world datasets from Amazon and Yelp. The results show that our proposed model significantly outperforms several state-of-the-art baselines. Moreover, our model offers enhanced interpretability, helping deliver more effective personalized recommendations.

1. Introduction

Recent advancements in Natural Language Processing (NLP), exemplified by large language models such as GPT-5, have highlighted the growing importance of textual information across various domains. This development coincides with the rapid expansion of e-commerce platforms like Amazon, Taobao, and JD.com, which has driven the widespread adoption of recommendation systems in areas ranging from movie suggestions and talent acquisition to advertising. Among these, e-commerce stands out as a key domain due to the massive volume of user- and item-related textual data it generates—particularly user reviews. As a result, review-aware recommendation has become an increasingly important research area within the recommender systems community [1].
Traditional recommendation systems primarily rely on collaborative filtering, which generates recommendations based on similarities among users or items. To address the data sparsity issue inherent in user-item rating matrices, matrix factorization techniques such as Singular Value Decomposition (SVD) have been widely used. These approaches decompose the rating matrix to extract latent features of users and items, thereby enabling the prediction of ratings for previously unrated items. For example, Sarwar et al. [2] proposed an SVD-based algorithm that effectively predicted ratings for unrated items in movie recommendation systems. More recent work, such as that by Fan et al. [3], has integrated self-attention networks with low-rank decomposition to construct context-aware representations from users’ historical interactions, achieving strong performance. Despite these advances, traditional collaborative filtering methods remain susceptible to persistent issues such as data sparsity and the cold-start problem.
With the rise of deep learning in recommendation systems, review-aware approaches have gained traction as an effective strategy to mitigate data sparsity. Early work by Jakob et al. [4] showed that incorporating textual features such as price, service quality, and sentiment from user reviews could reduce prediction error. However, their method primarily focused on modeling one-to-one correlations between explicit features, overlooking potential latent features [5]. Most existing review-aware recommendation methods rely on probabilistic topic models to uncover latent feature distributions of users and items from textual content. Nonetheless, these models adopt bag-of-words representations, which disregard word order and lack the essential local contextual information crucial for sentiment analysis [6].
Furthermore, these methods primarily capture shallow, linear features and fail to fully exploit nonlinear latent features [7]. To address this limitation, deep learning models have been effectively applied to capture word order information and incorporate various attention mechanisms, thereby enhancing the quality of text-based feature extraction [8,9,10]. However, modeling user reviews remains a challenging task due to the inherent noise and sentiment embedded in the text. These factors hinder the extraction of key information from reviews and limit the ability to accurately associate it with user preferences.
To tackle this problem, attention-based models have been proposed. For example, NRM [11] captures crucial review information using an attention mechanism, while D-ATT [12] employs a dual-attention structure to model user context and interests. With the advent of the Transformer architecture [12], BERT [13] has emerged as a powerful tool for textual representation. DSMR [14] adopts BERT to model user reviews for recommendation tasks and has achieved promising results.
Nevertheless, existing review-aware recommendation systems typically extract semantic information by computing the similarity between review embeddings, often overlooking the multi-dimensional nature of user reviews. For instance, some users may prefer brief reviews, which may still convey strong sentiment. We argue that incorporating these multi-dimensional aspects can lead to more accurate modeling of user preferences and more effective personalized recommendations.
In addition, user ratings are often inconsistent with their corresponding reviews—a phenomenon we refer to as polarity bias. For instance, a significant portion of 5-star ratings may be accompanied by lukewarm or even negative review texts, creating conflicting signals that degrade model performance. This bias is particularly evident when users tend to give extremely high or low ratings, regardless of the review content. While some recommendation models, such as CARP [15] and U-BERT [16], employ contrastive learning to model different polarities independently and obtain a more comprehensive understanding of user preferences [17,18,19], they often fail to account for the imbalanced distribution of positive and negative reviews. This oversight may cause models to lean toward the dominant polarity, leading to biased recommendations.
Moreover, user preferences are inherently dynamic. These two challenges—polarity bias and temporal dynamics—are often intertwined. Many existing models incorporate temporal information to track the evolution of user behavior and improve recommendation accuracy [20,21]. However, external factors such as promotional events or holidays can also shape user behavior, often leading to concentrated purchasing activity over short periods. For example, a user’s polarity preference (e.g., being a ‘critical’ or ‘generous’ rater) may itself change over time, or a negative review from three years ago should carry less weight than a recent positive review. Existing models often treat these as independent problems, failing to capture their interaction.
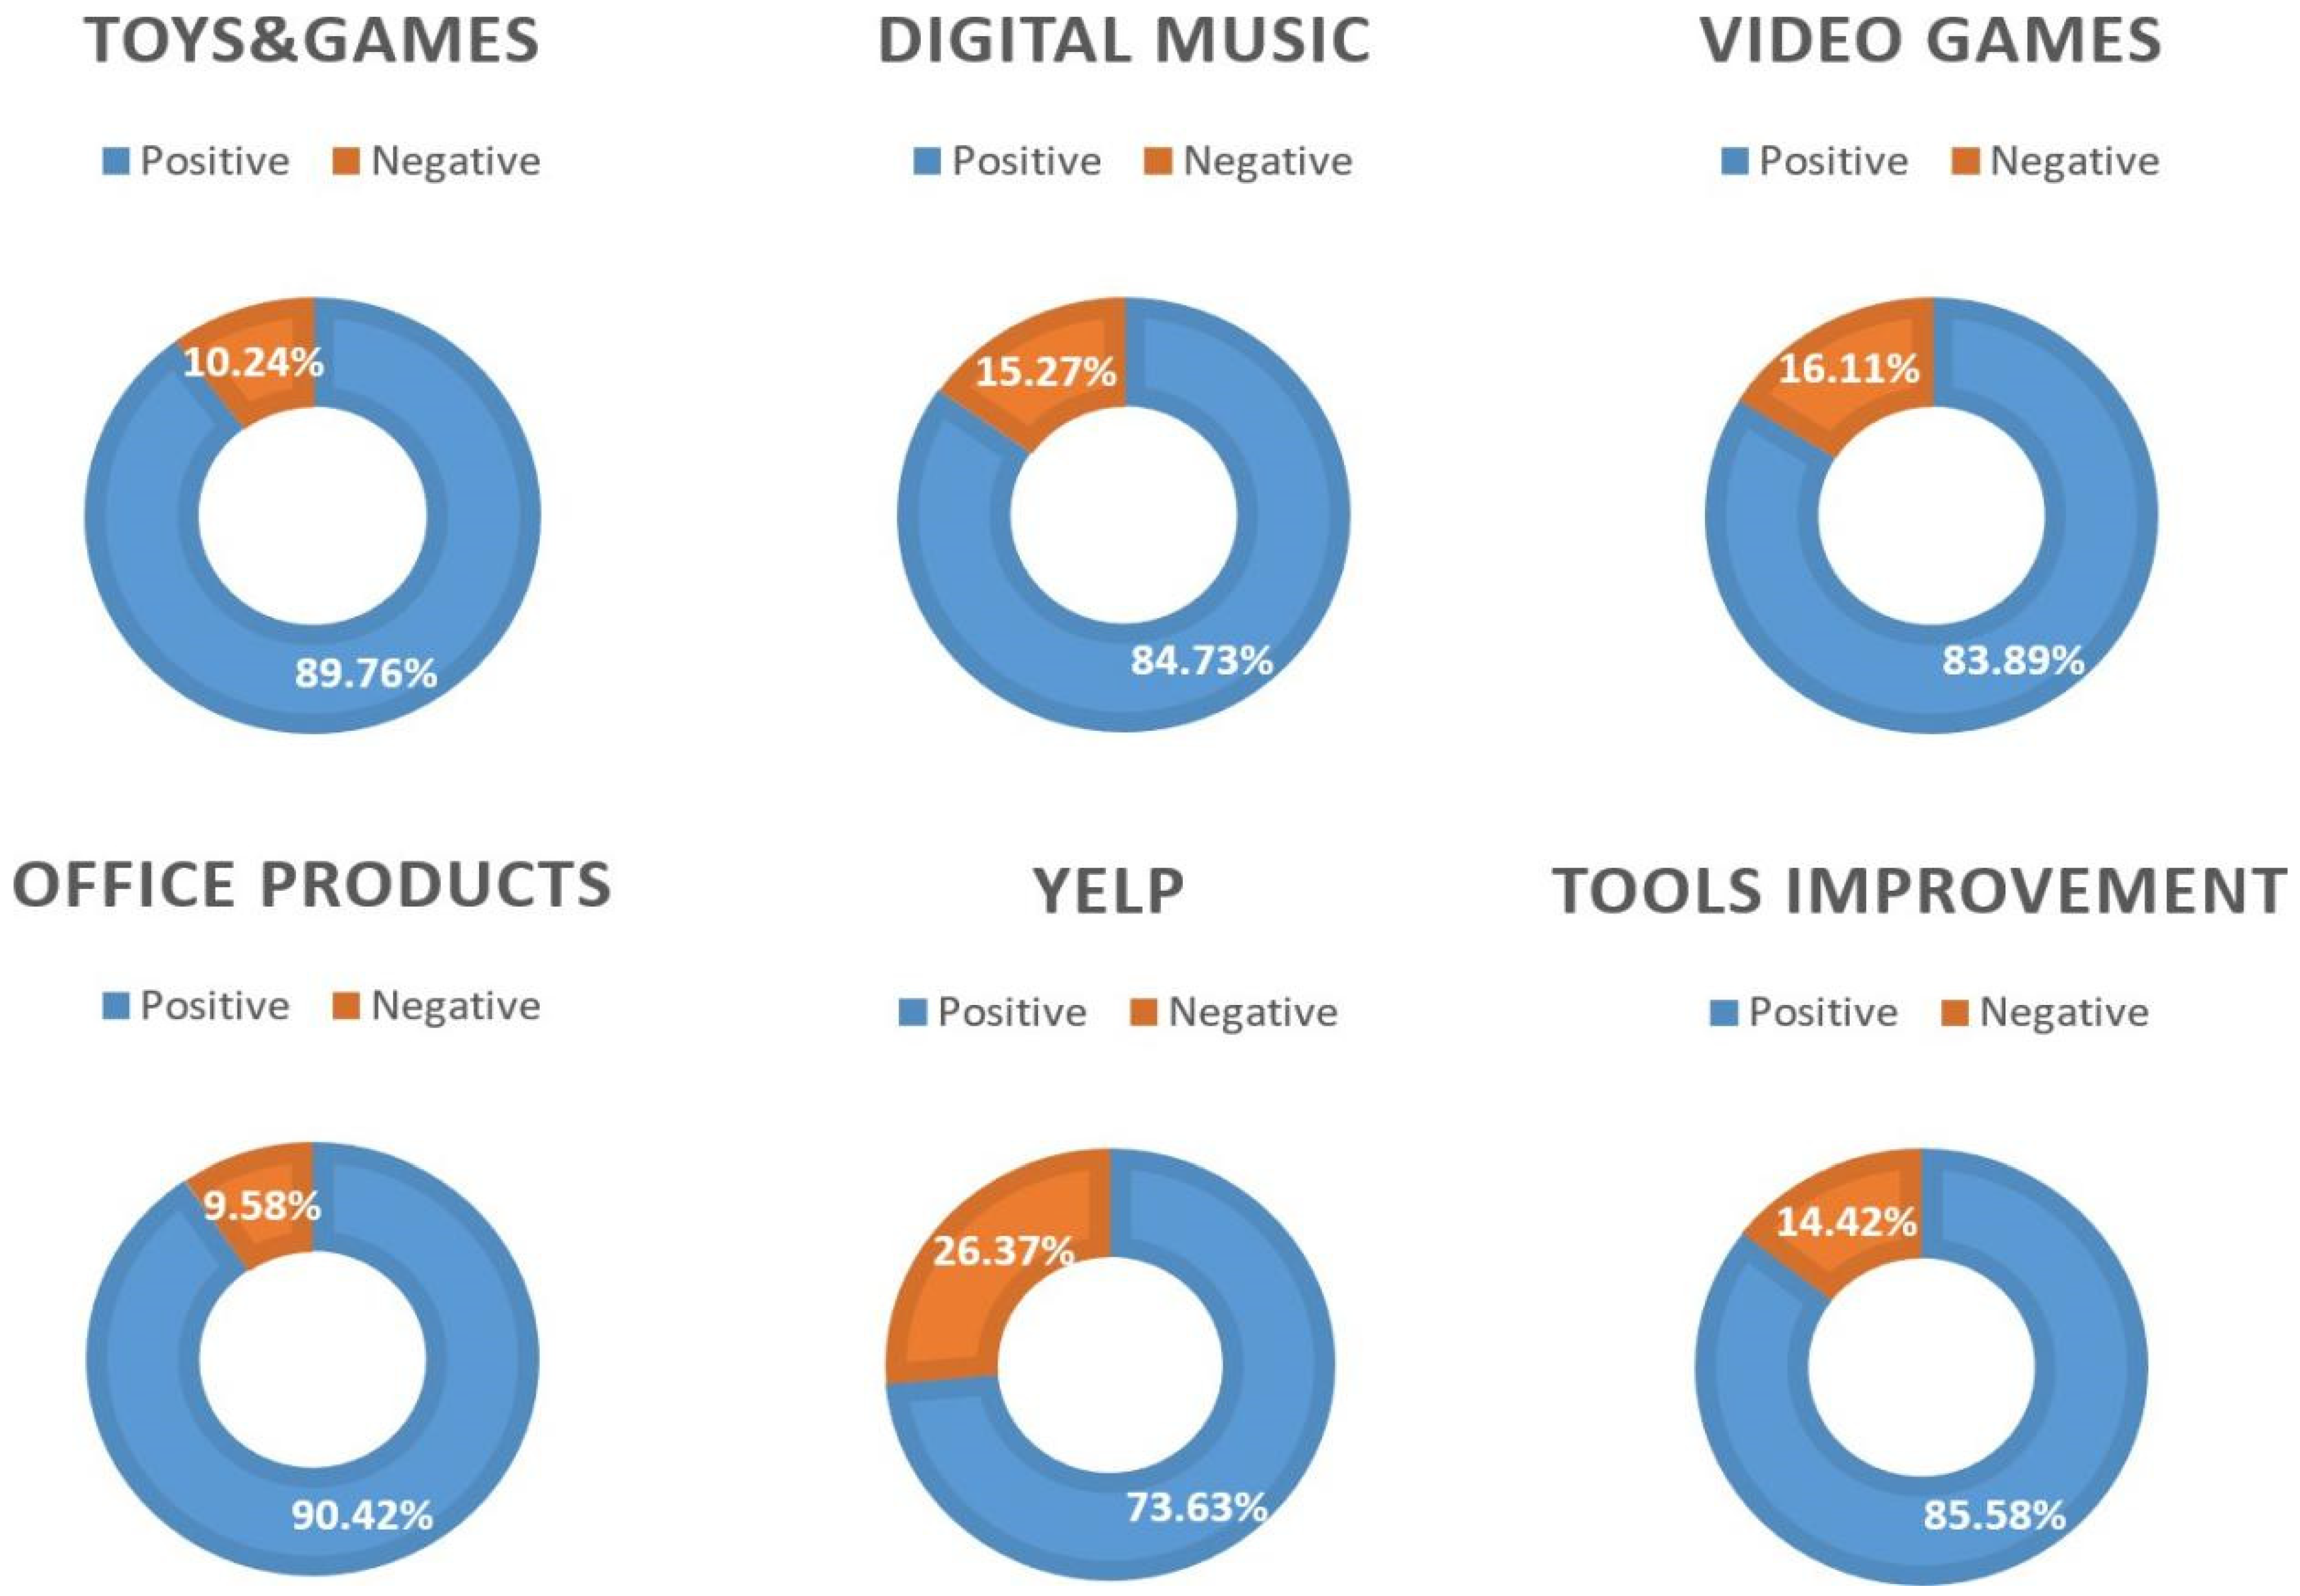
In light of these challenges, we propose RARPT, a review-aware recommendation model that incorporates both polarity and temporality. To capture user preferences, RARPT applies dot-product attention to fuse review vectors with their associated attributes. At the same time, to model temporal shifts in user preferences, we adopt a sequential model to learn features from review sequences. Specifically, to address polarity imbalance, we introduce a cross-attention module that generates supplementary collaborative vectors from reviews of the opposite polarity. As shown in Figure 1, our dataset analysis confirms the presence of polarity skew. Experimental results demonstrate that the proposed module effectively mitigates this issue and improves recommendation performance.
In summary, the primary contributions of this paper are as follows:
We propose RARPT, a new recommendation model that introduces a novel polarity balance mechanism to explicitly address data imbalance in review-aware recommendation. Unlike existing methods, RARPT models both polarity and temporality simultaneously.
Our primary technical contribution is the Polarity Balance Layer, which utilizes a cross-attention mechanism in a novel way to synthesize supplementary collaborative vectors from the dominant polarity class to augment the sparse class, effectively mitigating polarity bias.
We conduct a comprehensive set of experiments across five benchmark datasets to evaluate the effectiveness of our model. The results demonstrate that RARPT outperforms several classical and state-of-the-art baselines.
The remainder of this paper is organized as follows:
Section 2 reviews related work. Section 3 presents the details of the proposed RARPT framework, including its key components. Section 4 reports the experimental results that validate the effectiveness of our approach. Finally, Section 5 concludes the paper and outlines directions for future work.

2. Related Work

2.1. Review-Based Recommendation

Early recommendation algorithms that utilized user reviews typically learned user–item representations from the rating matrix, giving rise to methods such as collaborative filtering [22]. However, numerical ratings are coarse-grained (e.g., 1 to 5 stars), making it difficult to infer users’ fine-grained preferences based on ratings alone. The early approaches often employed matrix factorization (MF) [23] or topic modeling [24]. In recent years, with the rapid development of deep learning in natural language processing, textual information, such as users’ review and item description, has been widely utilized for generating more effective recommendations.
Kim et al. [8] proposed ConvMF, which uses convolutional neural networks to extract deeper latent features from product descriptions. By incorporating local word order, this method generates more accurate latent vectors for items. However, a key limitation of ConvMF is that it focuses solely on item-related textual data and ignores user-specific information. To address this, Zheng et al. [9] introduced DeepCoNN, which employs two parallel CNNs to separately process review sets from users and items. This framework has inspired much subsequent work in the field.
Despite these advancements, the sheer volume of user reviews can hinder preference modeling, as excessive input may introduce noise and reduce accuracy. To mitigate this, some researchers have adopted attention mechanisms. Catherine et al. [10] extended DeepCoNN and proposed TransNet, which uses a dual CNN structure to first reconstruct the review corresponding to a predicted rating, thereby improving prediction accuracy. They explored both local and global attention, and proposed a new architectural design. Similarly, Chen et al. [12] proposed the NRM model, which leverages the representational power of deep neural networks to extract key information from user reviews. By introducing attention mechanisms, NRM effectively identifies important content and improves recommendation accuracy. Elahi et al. [16] proposed a hybrid recommendation method using both ratings and sentiments of reviews. Darraz et al. [25] leverage the power of BERT to incorporate the sentiment analysis into collaborative filtering and content-based recommendation. These methods do not consider polarity bias and temporal influence.
However, merely extracting key information from review data is not sufficient. User preferences are dynamic and evolve over time; overlooking this temporal aspect can significantly degrade recommendation performance. To address this, Seo et al. [13] proposed the D-ATT model, which employs a dual-attention mechanism to simultaneously focus on salient features in both user and item reviews. By capturing contextual cues and user interests, D-ATT generates more accurate recommendations. More recently, Wang et al. introduced the DSMR model [26], which integrates a pre-trained BERT model for textual encoding with a Long Short-Term Memory (LSTM) network to model the temporal evolution of user interests. While these methods have improved the understanding of review content, we argue that relying solely on review text is insufficient to capture users’ dynamic preferences comprehensively.
In addition, a significant discrepancy often exists between user reviews and ratings. Different users may write highly varied reviews despite assigning the same numerical score. This inconsistency, along with the prevalent skew toward high ratings, introduces polarity bias into the data. To address these challenges, we propose leveraging review attributes as auxiliary information and introduce a dedicated polarity balance module to mitigate this bias.

2.2. Recommendations Using Review Properties

In addition to modeling review text as vectors, many existing methods incorporate review attributes as side information to better capture user behavior and preferences. Early approaches often relied on topic models to extract attribute-level insights from review text. For instance, the RMR model [27] combined review attributes with LDA-based topic modeling using collaborative matrices. This research direction has inspired numerous subsequent models aimed at improving recommendation performance by incorporating supplementary side information.
Some models, such as TOIS [28], have integrated other types of contextual information by embedding not only review text but also users’ temporal and spatial data into a low-dimensional space. This enables the model to capture latent spatiotemporal patterns and associations, thereby enhancing the accuracy of behavioral prediction.
Although these review-based recommendation models extract different aspects of user information, many fail to recognize that not all real-world reviews are equally informative [29]. The NARRE model [30], a well-known review-based approach, addresses this issue by applying an attention mechanism to assign importance weights to individual reviews, thereby mitigating the influence of low-value content. Sentiment analysis is another common strategy in this area [30]. For example, the GeoSoCa model [31] replaces traditional ratings with sentiment scores to make recommendations and has shown strong performance. Similarly, although originally designed for news recommendation, the NRMS model [32] also utilizes review text and user feedback, employing a multi-head self-attention mechanism to mine semantic information across multiple dimensions.
While these methods leverage a range of review attributes as contextual signals to boost recommendation performance [33], a considerable amount of personalized user preference information embedded in the reviews remains underutilized. Such information reflects distinct user characteristics, including typical review length, rating tendencies, and polarity preferences [34,35]. For instance, a 4-star rating may represent a high level of satisfaction for a user who rarely gives high scores, but only moderate approval for someone who typically rates generously [35]. Additionally, many existing models assume that review length is positively correlated with informativeness, overlooking users’ differing preferences for review verbosity.
To address these issues, this paper explores multiple key review attributes to more accurately model user preferences and deliver more effective personalized recommendations.

3. Methodology

3.1. Preliminaries

We begin by formalizing the recommendation task and introducing the notation used throughout this paper. We then present our proposed model, RARPT, which incorporates review attributes to enrich user and item representations. By learning the importance of different review attributes, the model captures more personalized user preferences and item characteristics.
In addition, RARPT models the temporal dynamics of user reviews and employs a cross-attention mechanism to effectively fuse information from both positive and negative reviews, thereby enhancing overall recommendation performance.
Our recommendation task aims to effectively recommend items to users based on their personalized preferences. Similar to traditional recommendation tasks, this problem involves two sets of entities: a user set U = { u 1 , u 2 , , u N } consisting of N users and item set V = { v 1 , v 2 , , v M } including M items.
Our approach leverages user reviews, which we divide into two categories: the user related reviews Su and the item related reviews Sv, where |Su| and |Sv| represent the number of the user reviews and the item reviews, respectively.
To capture multiple review attributes from both user and item reviews, we define an attribute set P = { p 1 , p 2 , , p k } . For a given user U and attribute p 1 , we estimate the corresponding attribute scores for all user’s reviews as D p 1 , u = { d p 1 , u , 1 , , d p 1 , u , t , , d p 1 , u , | S u | } , where d p 1 , u , t represents the attribute score of p 1 for user U in their t-th review. The important notations used in our method are listed in Table 1.
To ensure comparability across attributes with different units or scales, we apply a normalization operation to each attribute dimension. This maps the original attribute values to scalars within the range [0, 1], thereby facilitating weighting and comparison across heterogeneous attribute types.

3.2. The RARPT Model

This section presents the overall architecture of our proposed model. To address the challenges discussed in the previous sections, we design a Review Attribute Recommendation system based on Polarity and Temporality (RARPT). RARPT is a deep learning framework that takes review text and its associated attributes as input.
The model embeds users and items into vector representations based on review polarity (positive or negative) and subsequently fuses these polarity-specific representations using a polarity balance module. By integrating polarity-aware and temporal information, RARPT generates more accurate and personalized recommendations.
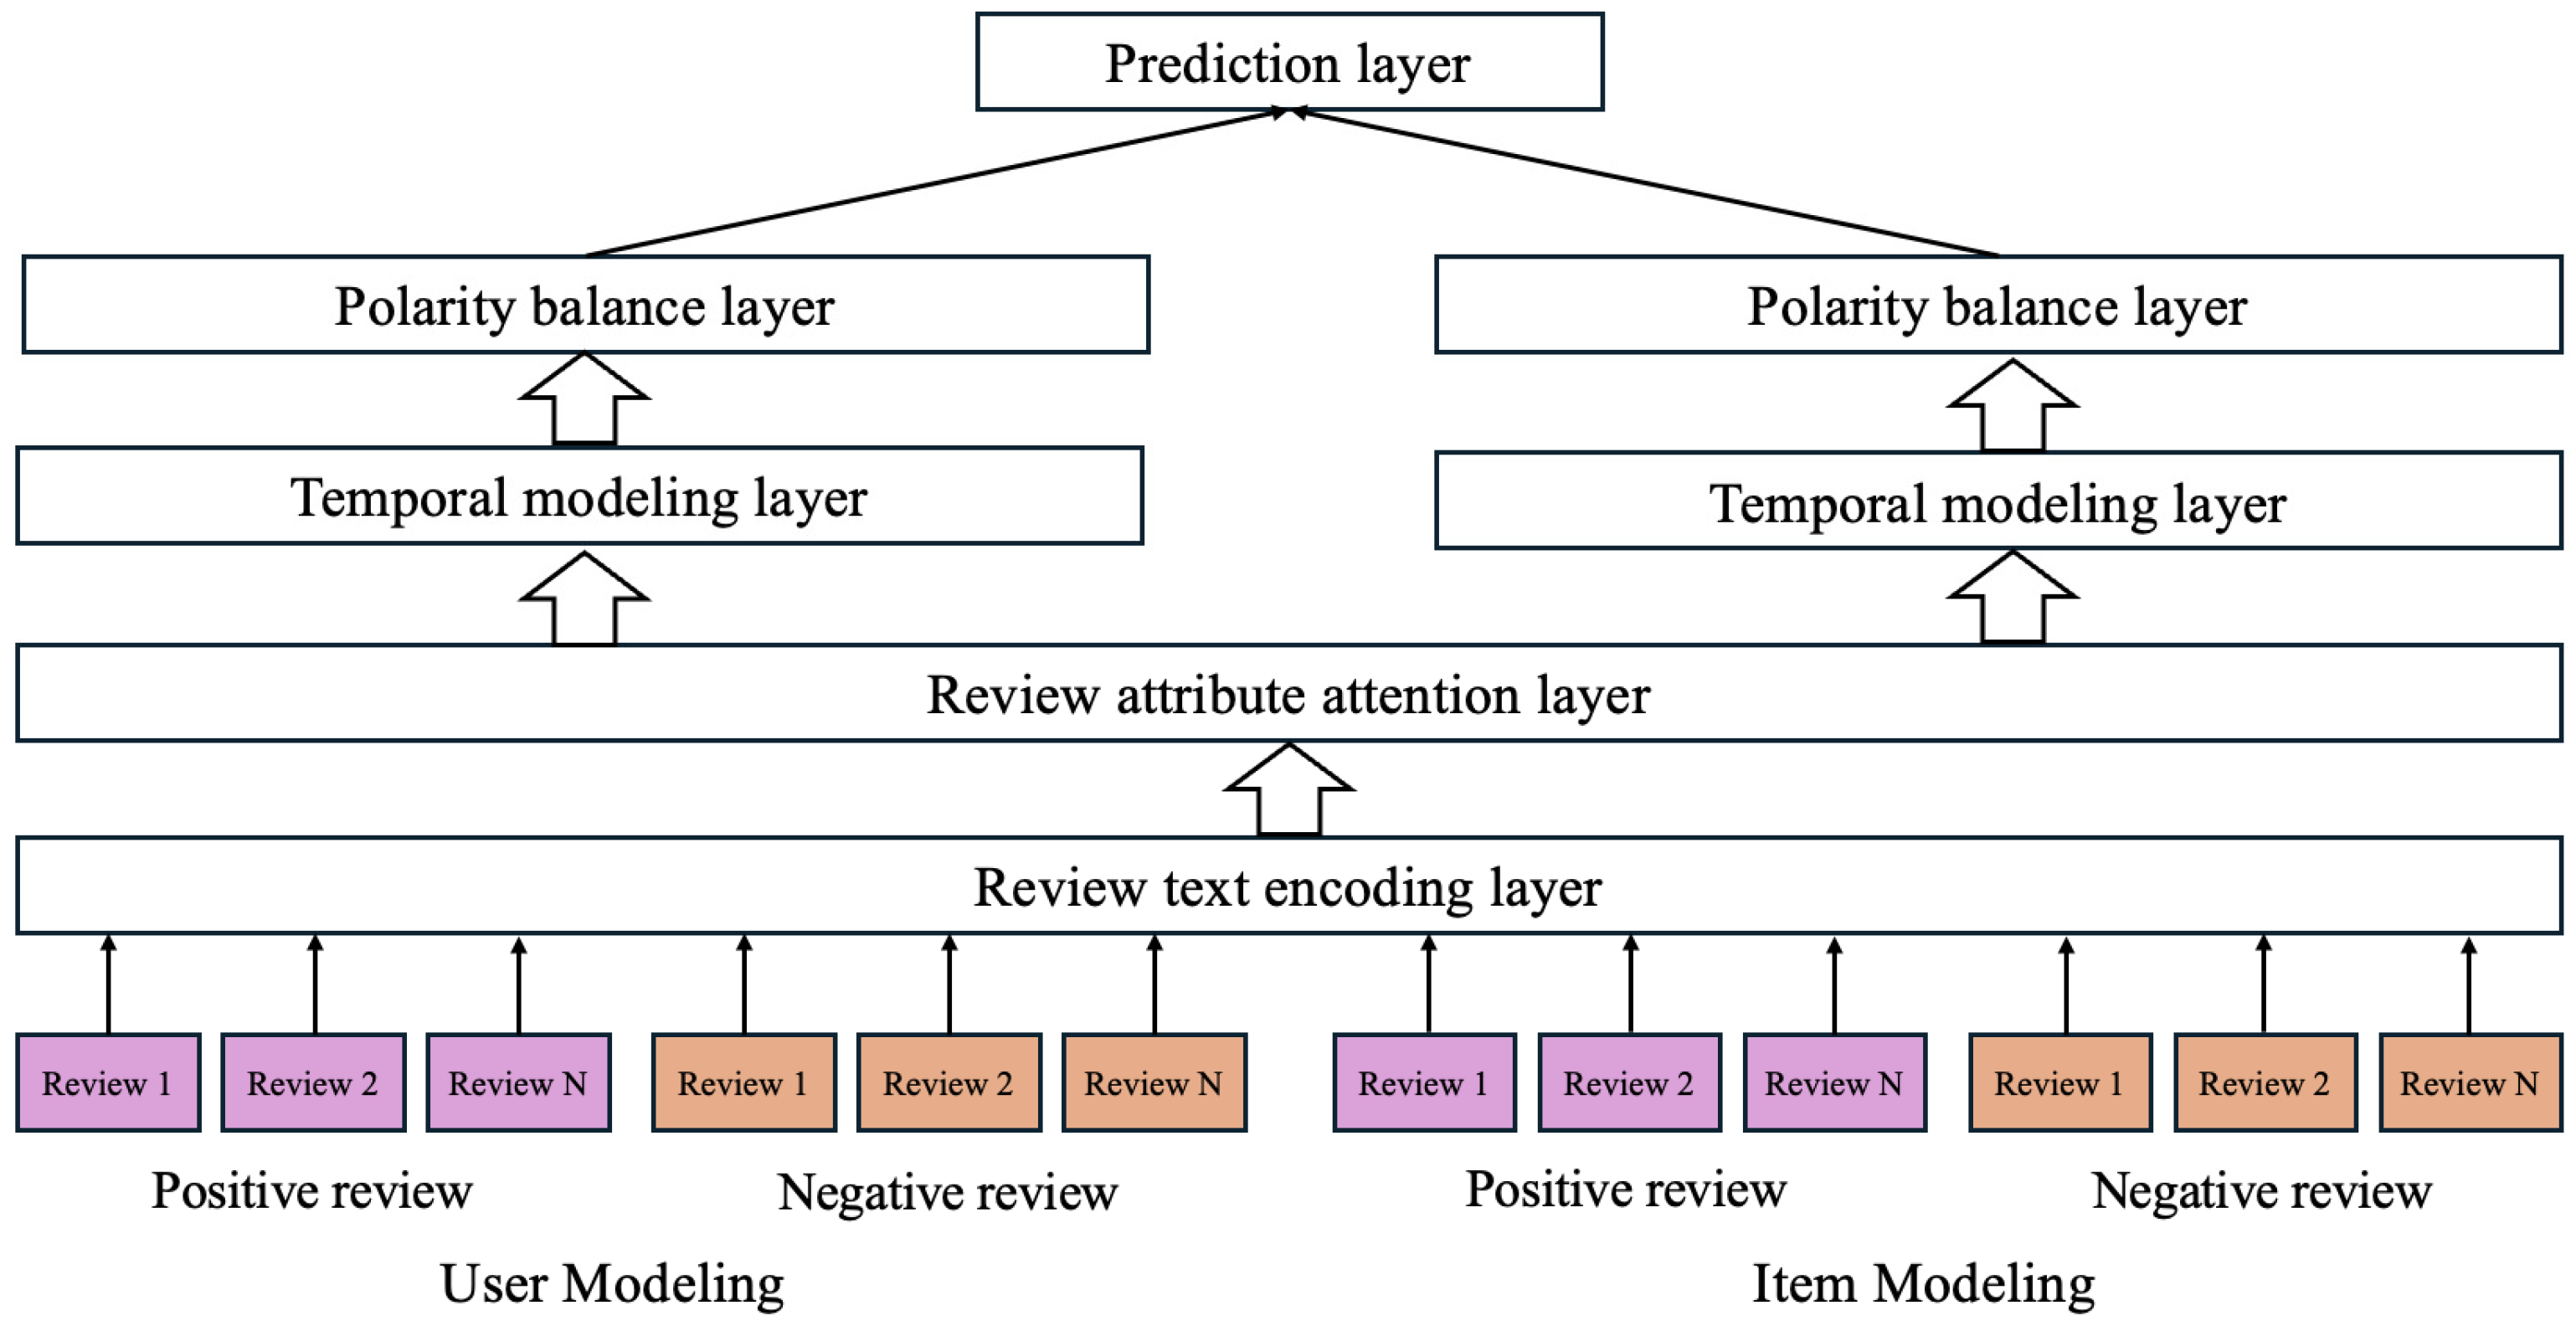
Specifically, our model employs a dot-product attention mechanism to weight the importance of different review attributes, thereby generating more accurate recommendations. The overall architecture of the proposed RARPT model is illustrated in Figure 2. RARPT is a collaborative filtering–based framework that models interactions between users and items. Notably, it adopts a symmetrical neural network architecture to encode both user and item information, as depicted in the figure.
The RARPT architecture consists of four main components, described as follows:
Review text encoding layer (Section 3.2.1) utilizes the BERT model to embed review texts into vector representations. In parallel, various review attributes are extracted during data preprocessing for use in subsequent layers.
Attribute attention layer (Section 3.2.2) determines the relative importance of different review attributes, allowing the model to generate more representative embeddings of user preferences and item characteristics.
Temporal modeling layer (Section 3.2.3) captures temporal dependencies among user and item reviews. We incorporate positional encoding based on review timestamps and input the resulting sequence into a Transformer encoder, enabling the model to learn temporal dynamics and contextual relationships within the review sequence.
Polarity balance layer (Section 3.2.4) aims to address the imbalance between positive and negative reviews, this layer introduces a cross-attention mechanism to fuse polarity-specific review embeddings. This enhances the model’s robustness and overall recommendation performance.

3.2.1. Review Text Encoding Layer

According to the model architecture, RARPT processes user and item reviews symmetrically, grouping them further based on polarity (positive or negative). For each group of reviews, we utilize a pre-trained BERT model [15] to encode the review text into fixed-length vectors. Trained on a large-scale corpus, BERT not only captures the contextual semantics of natural language but also effectively models the sentiment tendencies embedded in review texts, helping interpret user intentions more accurately.
Let S u = { s u , 1 , , s u , i , , s u , n }   denote the set of all reviews written by user u , where s u , i is the review written by user u about item i. Each review s u , i is first tokenized into word-level units using a tokenizer. Since our model directly embeds the entire review text for downstream recommendation tasks, we do not differentiate between paragraphs or sentence boundaries. Instead, each review is concatenated with a special token [CLS], and then either truncated or padded (zero-filled) to a fixed length before being passed to BERT as input:
t u , i = B E R T C L S ; w 1 , w 2 , , w B ,
Here, w i represents the i-th word in the tokenized sequence, and t u , i R d denotes the final hidden representation of the [CLS] token, which summarizes the semantics of the entire review. The symbol “[;]” indicates vector concatenation.
After encoding all reviews, we obtain the review representation set for user U as:
T u = { t u , 1 , t u , 2 , , t u , n }
Each review is now embedded into a fixed-dimensional vector (of size 768, matching BERT’s output), which serves as input for subsequent feature fusion steps.
We further divide the encoded reviews into positive and negative sets based on their associated rating scores. Reviews rated 1–2 are categorized as negative, while those rated 3–5 are treated as positive. We denote the corresponding sets of embedded vectors as Tpos and Tneg, respectively.

3.2.2. Review’s Attribute Focus Layer

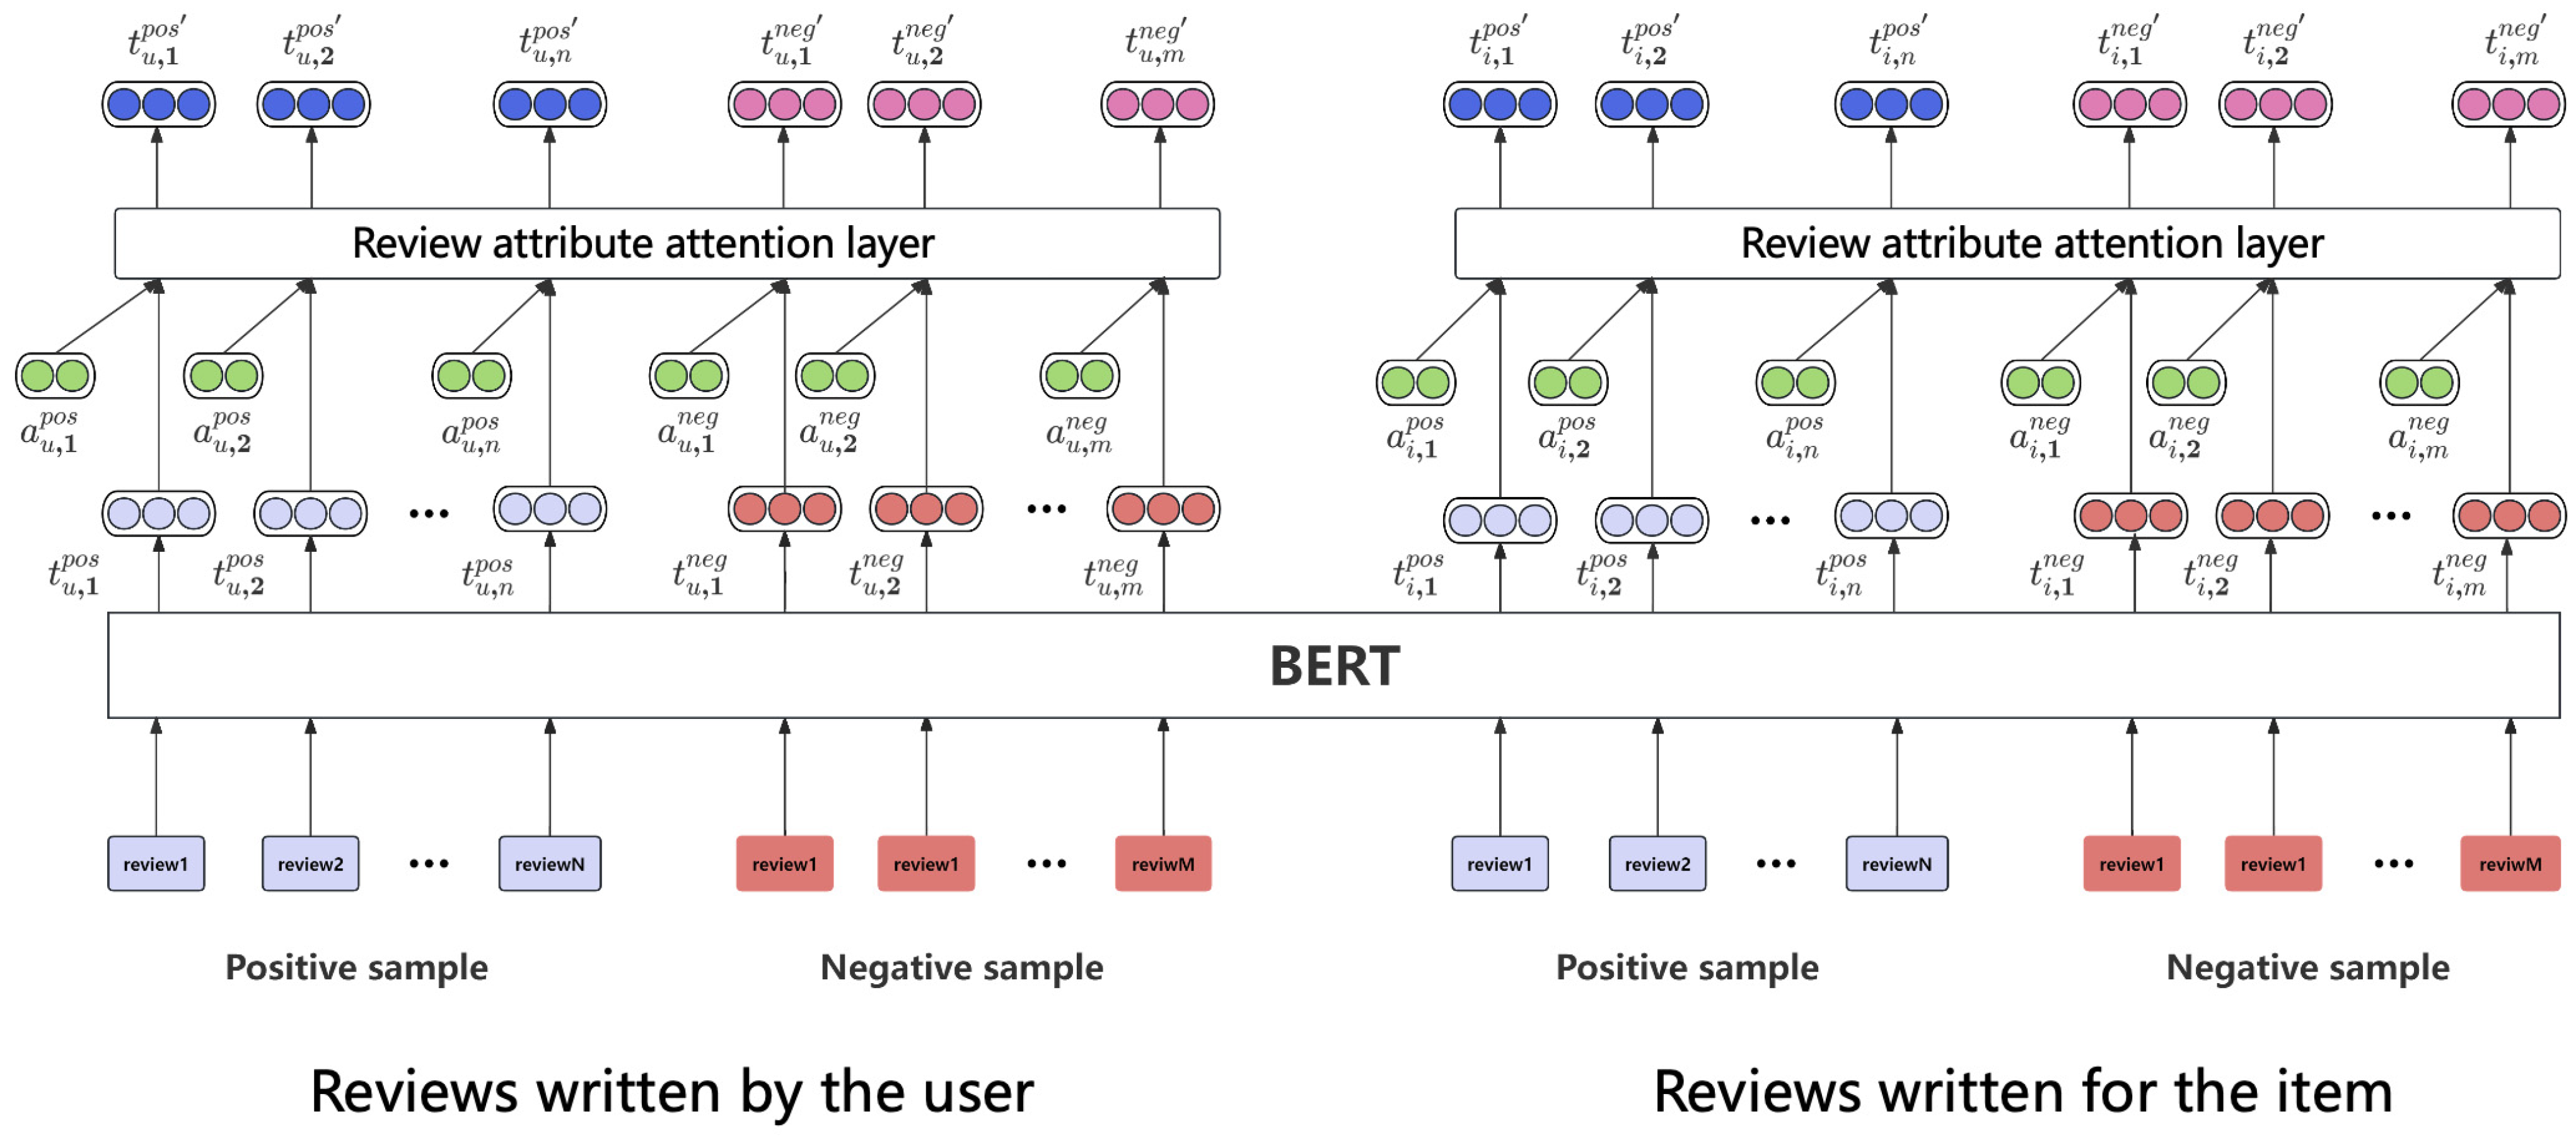
This section introduces the Review Attribute Focus Layer, which performs attention-based association operations on the review embedding vectors and review attributes obtained from the previous layer. The structure of this module is illustrated in Figure 3.
All review attributes are extracted through a series of data preprocessing techniques before training. Specifically, we first utilize an existing sentiment word vocabulary (https://www.cs.uic.edu/~liub/FBS/sentiment-analysis.html accessed on 2 December 2024) to locate all sentiment words in the review. As mentioned in Section 3.1, our model adopts the following 9 review attributes to characterize reviews. To ensure comparability across attributes with different units and scales, all attribute values are normalized to the range [0, 1] using min–max normalization. This step produces dimensionless scalar values, allowing the model to weigh and compare heterogeneous attributes consistently within the attention mechanism.
We define the following nine review attributes, each normalized to the range [0, 1]: (1) Timestamp of reviews in the dataset, represented in the form of Unix timestamps, representing the time difference from 00:00:00 UTC on 1 January 1970. We normalized the value of the timestamps to [0, 1], meaning that the closer the review is, the closer it is to 1. This linear normalization is a common and effective technique for representing recency. We considered alternative temporal weighting schemes, such as exponential decay, but found that this simple normalization provided stable performance while integrating cleanly into the attribute attention mechanism. (2) The total number of words in the review is regarded as a basic attribute of the review. (3) The number of emotional words in review can reflect the strength of positive or negative sentiment of the review. (4) The positive words proportion is the ratio of positive sentiment words to the total number of words in the review. The positive words are identified using the sentiment extraction method described earlier in this section. (5) The negative words proportion is the ratio of negative sentiment words to the total number of words in the review, identified using the same sentiment extraction method. (6) Average review length is the average number of reviews written by a user. This attribute reflects a user’s preference for the length of review and helps mitigate bias introduced by varying user expression styles. (7) Rating (from 1 to 5 stars) is assigned by the user to the corresponding item. (8) The number of “likes” or positive feedback received by the review from users. This serves as a proxy for the review’s influence or perceived usefulness. (9) Sentiment information of the review is derived by a CNN-based sentiment classifier RPRM [36]. As validated in [37], this model achieves 0.95 accuracy in distinguishing between positive and negative reviews.
Since both positive and negative reviews are processed identically in this layer, we do not differentiate between them symbolically. Consistent with Equation (2), the corresponding review attribute vector set for user u is defined as:
  A u = { a u , 1 , a u , 2 , , a u , | T u | }
The number of vectors in the user review attribute set Au is equal to that in the review embedding set Tu. Each attribute vector a u , i corresponds to one review embedding tu,i, and is defined as:
a u , i = d p 1 , u , d p 2 , u , , d p 9 , u
Each review attribute vector is a 9-dimensional vector, where each dimension represents the normalized value of one of the nine review attributes described earlier.
In our model, we apply batch processing over reviews in a deep neural network setting. Accordingly, the review embedding set |Tu| and the attribute vector set Au are represented as two-dimensional tensors. The first dimension in both tensors corresponds to the number of reviews, denoted as |Tu|, representing batch size. The second-dimensional size of Au is 768 times that of the reviews after BERT embedding, and the second-dimensional size of Tu is 9 times the number of review attributes. To illustrate this intuitively, we use the ith review embedding vector tu,i and the corresponding i-th review attribute vector au,i as examples to explain the subsequent operations of our model.
Since the two vectors differ in dimensionality, we introduce a learnable weight matrix Wa (WaRdk) to align them for attention weight computation, where d = 768 (BERT embedding dimension) and k = 9 (the number of attributes). Note that k can also be treated as a tunable hyperparameter for model adjustment.
For the review, we first map its attribute vector au,i to the same dimension space as BERT embedding through Wa, and then apply the softmax function to obtain the attention weight vector fu,i:
f u , i = s o f t m a x W a a u , i
Among them, the softmax function is applied to each element of the vector to normalize the weights, so that the sum of the weights of all attributes is 1. fu,i is a vector of length 9, where each element represents the attention weight of the attribute corresponding to the current position. Specifically, the jth element of fu,i,j has the following relationship:
f u , i , j = exp W a a u , i j k = 1 9 exp W a a u , i k
where W a a u , i j denotes the j-th element of the vector after matrix multiplication. Next, we use attention weights f u , i to weight the attribute vector a u , i . We use a learnable parameter matrix W b R d × k to transform the vector into the same dimension space as BERT embedding. W a is mainly used to complete the dimension transformation of the attribute vector to calculate the softmax weight score, while Wb mainly completes the dimension transformation of the rating matrix to learn how to better fuse with the original review vector:
a u , i = W b a u , i f u , i
where ⊙ represents element-wise multiplication, i.e., Hadamard product. In this way, a u , i an t u , i have the same dimension and a u , i contains attribute information with attention weights. Finally, we add the original embedding t u , i and weighted attribute embedding a u , i to obtain the final embedding vector t u , i , which is the final output representation of this layer. Compared with t u , i , the final representation contains information about the corresponding review attribute:
t u , i = t u , i + a u , i
The final input vector T u is processed by the review attribute attention layer and changes to T u :
T u = { t u , 1 , , t u , i , , t u , T u }
The dimensionality of the attribute vector remains unchanged. However, it now encodes personalized information reflecting various review attributes of the user. Since the processing steps for item reviews are identical to those for user reviews, we omit a separate introduce for brevity.

3.2.3. Temporal Processing Layer

Temporal information plays an important role in capturing user preferences accurately. In this layer, we incorporate temporal information into both the positive and negative review sequences with Transformer. Since we use the same method to process item reviews and user reviews, we introduce our method by taking user reviews as an example. Based on the rating score of each review (1–2 as negative and 3–5 as positive), we divide the user reviews into two groups: T u = { T u pos ,   T u neg } . Each group forms a review sequence, where one sequence represents the user’s positive reviews and the other represents their negative reviews. Note that, each sequence is represented as a two-dimensional tensor. The first dimension indicates the sequence length, and the second corresponds to the review embedding dimension.
Because the standard Transformer architecture does not natively model sequential information, positional encoding should be introduced to inject temporal structure into the model. There are two common approaches of positional encoding: absolute encoding and relative encoding. In the review attribute attention layer, we already normalized the timestamp of each review and integrated it into the review attribute embedding via the attention mechanism. Therefore, we adopt absolute positional encoding, which allows us to consider the temporal information of user reviews explicitly.
Absolute positional encoding is typically computed using sinusoidal functions, ensuring that each position in the sequence receives a unique encoding vector. For a given position pos and dimension index k, the encoding value is computed as follows:
P E ( p o s , 2 k ) = sin pos 10000 2 k d
P E ( p o s , 2 k + 1 ) = cos pos 10000 2 k d
where PE(pos, 2k) and PE(pos, 2k + 1) represent the positional encoding values of position pos in dimension index 2k and 2k + 1, respectively. The positional encodings have the same dimension d as the review embedding. Therefore, the positional encoding and the review embedding can be summed:
x u , i = t u , i + P E i  
where x u , i includes the temporal information of the i-th review embedding in T u . We define the review embedding sequence after adding positional encoding as X u = { x u , 1 , , x u , i , , x u , T u } . After that, we input X u into the Transformer, and we obtain a new review embedding sequence set V u with the same dimension:
V u =   Transformer ( X u )
In this way, each review embedding obtains information from other reviews and captures the temporal information of user review. The final V u contains both positive and negative review sequences, i.e., V u = { V u pos ,   V u neg } .

3.2.4. Polarity Balance Layer

In this section, we begin by reviewing the typical prediction process used in standard review-based recommendation systems and highlight their limitations in handling review polarity. We then explain how our proposed RARPT model addresses this issue.
In most review-based recommendation models, multiple user reviews are aggregated into a unified user embedding Mu. Similarly, multiple item reviews are aggregated into an item embedding Mi. These two embeddings are then concatenated and passed through a fully connected layer, which applies a nonlinear transformation to learn the interaction between the user and the item. The final output of this process is the predicted rating score:
r ^ u , i = [ M u ; M i ] T W c + b c
where Wc and bc denote the learnable weight matrix and bias vector used in the fully connected layer, respectively. [ M u ; M i ] denotes the concatenation of the user embedding M u and item embedding M i .
Based on positive and negative review embeddings, it is common to fuse the two polarity-specific representations into a final embedding. The fusion method is often performed via a weighted average of the two embeddings, where the weights are typically based on the number of positive and negative reviews as follows:
M u = N u p o s M u p o s + N u n e g M u n e g N u p o s + N u n e g
where N u p o s and N u n e g denote the number of positive reviews and that of negative reviews provided by user u, respectively. While polarity-specific representations of users and items have been encoded, this alone is insufficient to generate accurate rating predictions. In real-world scenarios, most of users provide more positive reviews than negative reviews, as shown in Figure 1. This imbalance introduces data bias, which can lead to skewed recommendations and degraded performance.
To overcome this problem, we make the intuitive assumption that if a user writes positive reviews due to certain favorable characteristics of an item, they are also likely to generate negative reviews in response to corresponding unfavorable characteristics in other items. For example, if a user praises a product for its “high cost-effectiveness” or “affordable price,” we may infer that he/she would express dissatisfaction with products perceived as “overpriced”.
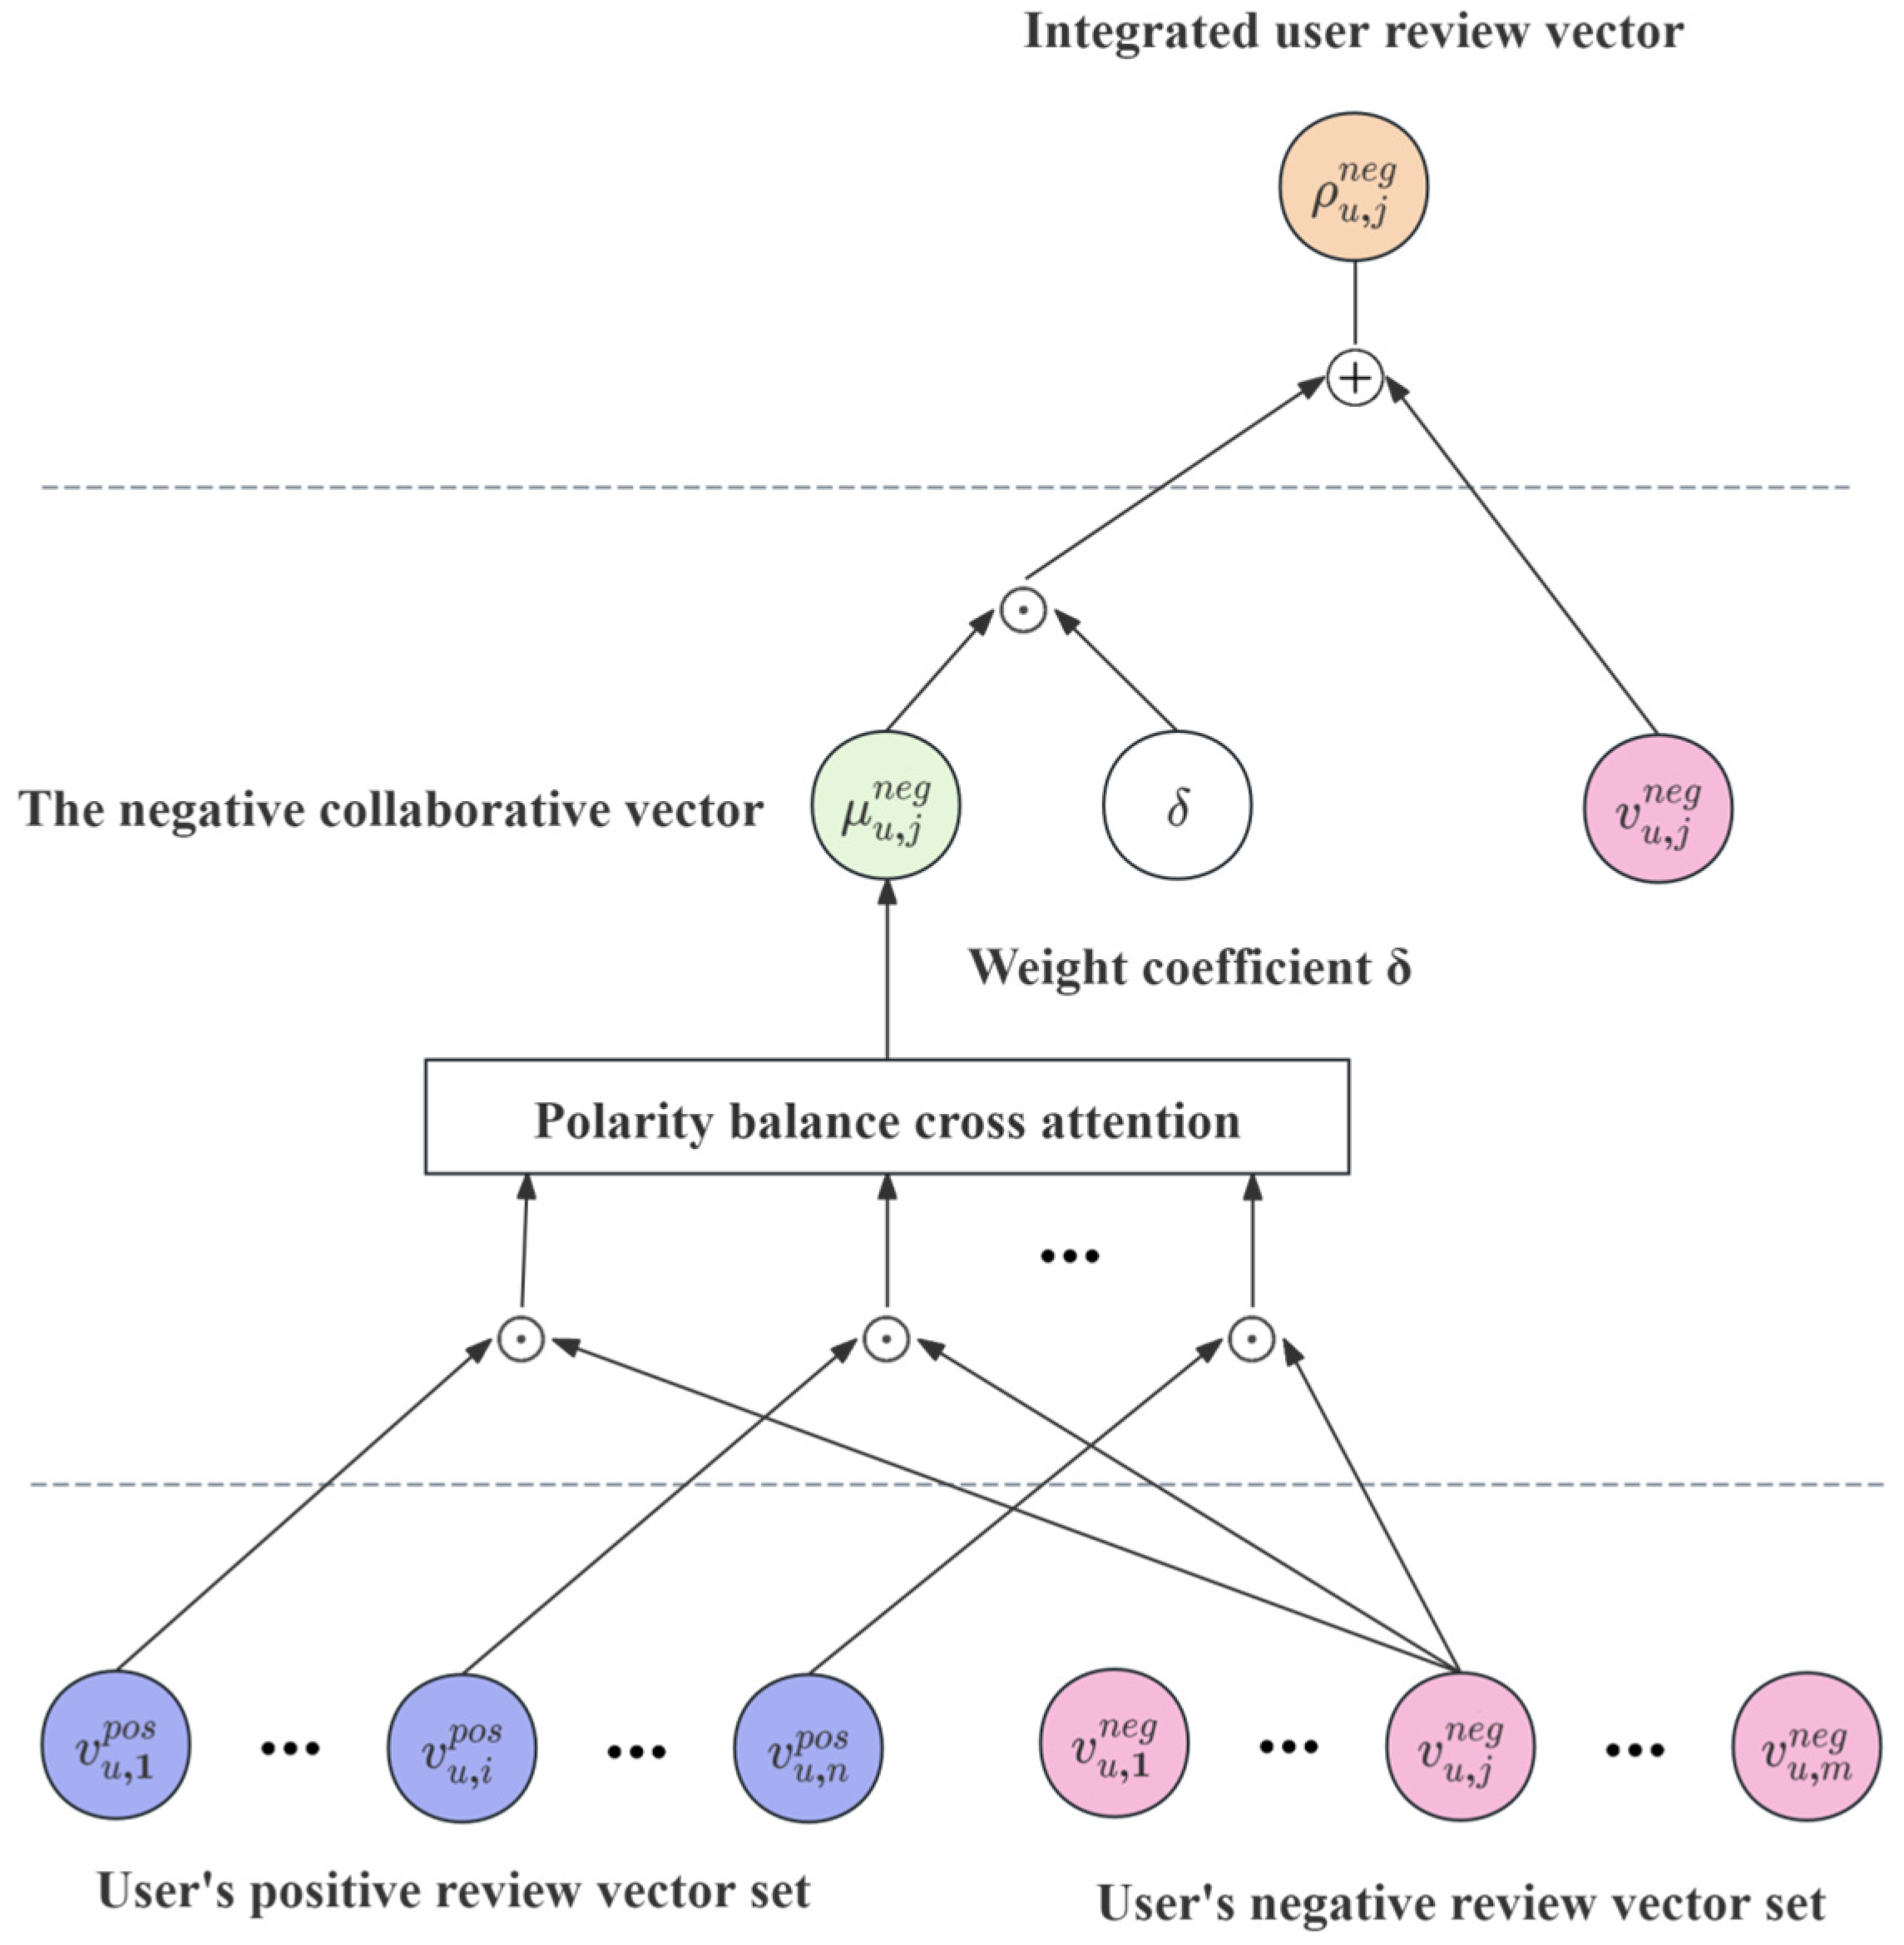
Based on this assumption, we introduce a cross-attention mechanism to model interactions between all positive and negative reviews. This allows the model to generate collaborative polarity-aware vectors that integrate complementary signals from both sides. These enriched representations are then fused to form the final user and item embeddings, which are used in the prediction layer. We specifically chose cross-attention for this task because it excels at learning representations by attending to information from a different sequence. In our context, it allows the model to “ask” the abundant positive reviews (as the key/value) for information that is most relevant to each specific negative review (as the query), thereby generating contextually relevant supplementary vectors rather than simple averages.
Here, we take user reviews as an example and the operations for item reviews follow the same procedure. After processing in the previous layer, we obtain two polarity-specific review vector sets for user u : V u = { V u pos , V u neg } . Assuming that user u wrote n positive reviews and m negative reviews, we define: V u pos R n × d , V u neg R m × d . In this layer, we utilize bidirectional cross-attention mechanism to establish relationship between each positive review embedding and each negative review embedding for the user. We first obtain three input matrices Q = V u pos W Q , K = V u neg W K and V = V u neg W V , where W Q ,   W K ,   W V R d × d . For positive review embedding V u pos , we utilize scaling dot-product attention function to calculate the output as follows:
H u pos = s o f t m a x Q K T d V
where H u pos denotes the collaborative positive review representations for user u and each of them considers the influences from the negative review provided by the same user. In a similar way, we can obtain the collaborative negative review representations H u neg for user u by defining three input matrices as Q = V u neg W Q , K = V u pos W K and V = V u pos W V . This process is shown in Figure 4.
In this way, even if the polarity of user reviews is imbalanced, the abundant positive reviews will provide information to the small number of negative reviews. Finally, we combine the original embedding with the generated collaborative embedding as follows:
F u pos = V u pos + δ H u pos
where δ is used to control the contribution of the collaborative review embedding. After that, we use average pooling on F u pos to obtain the user representation based on positive reviews:
M u pos = 1 n i = 1 n F u pos
The user representation based on negative reviews M u neg can be computed in the same way. The final user representation is defined as the weighted average of M u pos and M u neg as follows:
M u = n n + m M u pos + m n + m M u neg
Finally, we obtain the user embedding M u and item embedding M i separately. We concatenate the two and use a fully connected layer to conduct the linear transformation for rating prediction as follows:
r ^ u , i = M u ; M i T W c + b c
where r ^ u , i is the predicted rating for user u and item i; Wc and bc denote the learnable weight matrix and bias vector used in the fully connected layer, respectively.

3.3. Training

The overall loss function is defined as mean squared error between the predicted rating and the real rating with L1 and L2 regularization:
min W a , W b , W c 1 D u , i r u , i r ^ u , i 2 + λ 1 | | W a | | 1 + | | W b | | 1 + | | W c | | 1 + λ 2 | | W a | | 2 + | | W b | | 2 + | | W c | | 2
where D denotes the set of user ratings in dataset. The model parameters are updated through gradient descent. The parameters involved include the parameter matrix   W a from the review’s attribute attention layer, which is used to map the attribute vector to the same space as the review vector. The parameter matrix W b from the review’s attribute attention layer, used to learn the fusion of the original review embeddings and the review attribute embeddings. The final parameter matrix W c   comes from the polarity balance layer, which is used to learn the predicted score after linear transformation through the fully connected layer. | | · | | 1 and | | · | | 2 represent the regularization norms of L1 and L2, respectively, with corresponding hyperparameters λ 1 and λ 2 . We simultaneously use L1 and L2 regularization, known as Elastic Net, combines the strengths of both techniques while mitigating their individual weaknesses. Elastic Net provides a powerful and flexible regularizer that is particularly well-suited for datasets with highly correlated features or a very high dimension, yielding models that are both interpretable and stable.

4. Experimental Setup

In this section, we first present the datasets used in our experiments along with their key characteristics. We then describe the experimental settings and hyperparameters. Finally, we introduce the baseline algorithms used for comparison with the proposed RARPT model.

4.1. Datasets

We conducted experiments on two publicly available datasets: Amazon and Yelp.
The Amazon dataset, derived from the Amazon e-commerce platform, is widely used in recommendation system research. In our study, we selected five of its sub-datasets: Toys and Games, Digital Music, Video Games, Office Products, and Tools & Home Improvement. The Yelp dataset was sourced from the 13th round of the official Yelp Challenge, which contains reviews of businesses such as restaurants and bars.
In addition to basic fields such as user ID, item ID, rating, and review text, we also leveraged metadata including the number of likes each review received. To enhance the reliability of training, we removed cold-start users and items, following the practice of [38], ensuring that each user and item has at least five associated reviews. Reviews exceeding 512 tokens were truncated, and empty reviews were filtered out.
Ratings in both datasets range from 1 to 5 stars. We define reviews with ratings below 3 as negative, and those with ratings of 3 and above as positive. Notably, in real-world data, ratings are often skewed toward 4–5 stars, which can introduce bias and lead to overfitting. To address this, we balanced the dataset by randomly sampling reviews across all five rating levels in a 1:1:1:1:1 ratio, thereby ensuring equal representation and improving model robustness. We acknowledge that this balancing strategy is an abstraction and does not reflect the skewed, real-world distribution. However, this approach was intentionally chosen to create a controlled experimental environment. It specifically evaluates the model’s ability to handle polarity after removing the majority class advantage, thereby rigorously testing the effectiveness of our Polarity Balance Layer rather than allowing the model to simply overfit to the dominant 5-star ratings. A comparative study on the original, imbalanced data remains a key direction for future work.
Following the approach in [38], we divided both datasets into training (80%), validation (10%), and testing (10%) sets in a time-aware manner, maintaining the same split ratio within each user’s interactions to preserve temporal consistency.
To evaluate the model’s performance, we compute the loss between the predicted scores and the ground truth ratings. Table 2 presents detailed statistics for the evaluation datasets, including the distribution of positive and negative reviews based on our classification scheme.

4.2. Experimental Settings

To comprehensively evaluate the performance of our model and the baseline methods, we adopt Mean Squared Error (MSE) and Mean Absolute Error (MAE) as the primary evaluation metrics for rating prediction tasks.
We implemented our model using PyTorch 2.4 framework. The embedding matrix of each review text is initialized as a 768-dimensional vector using pretrained word embeddings from BERT. We use 12 heads and 12 layers in the Transformer component. Other training settings, such as the dropout rate and weight decay rate, remain the same as the original BERT. The multiple review attributes are incorporated during the data preprocessing stage, with the specific processing approach described in the review attribute attention layer.
We employ Xavier initialization [38] for all trainable weights in the model. Grid search is applied to tune hyperparameters based on validation set performance. To prevent overfitting, we add dropout layers after all fully connected layers and major modules, with a default dropout rate of 0.2. We use Adam optimizer with a learning rate of 3 × 10 5 . We vary the number of reviews used per user and per item in the set {4, 6, 8, 10}, and experiment with learning rates in { 1 × 10 5 ,   1 × 10 4 ,   1 × 10 3 ,   1 × 10 2 } . The training batch size is searched in {32, 64, 128, 256}.

4.3. Compared Methods

We compare the performance of our proposed method against a series of state-of-the-art review-based recommendation models, described as follows:
DeepCoNN [9]: A deep learning model that utilizes user and item reviews through two parallel convolutional neural networks, which are connected at the final layer. It independently learns user and item embeddings from reviews and then passes the concatenated embeddings into a Factorization Machine (FM) for rating prediction.
NARRE [29]: This model builds two parallel networks for users and items, each containing a convolutional layer followed by an attention mechanism. It not only aims to predict accurate ratings but also captures the usefulness of individual reviews.
DAML [39]: DAML incorporates a local attention layer to filter review information and a mutual attention layer to learn user–item interactions. It unifies both ratings and reviews in a single neural architecture, and further integrates a Neural Factorization Machine to model high-order nonlinear feature interactions.
DSMR [14]: DSMR adopts BERT for encoding review texts and uses an LSTM to model users’ temporal preference dynamics across reviews.
CARP [15]: This model extracts aspect–opinion pairs from user and item reviews and introduces an emotional capsule network based on a bidirectional routing mechanism, enhancing both interpretability and rating prediction performance.
U-BERT [16]: U-BERT leverages a pre-training and fine-tuning strategy to bridge the gap in user content sparsity by transferring knowledge from domains with rich review data to those with limited content.
MPCN [15]: Built on a co-attentive learning scheme, MPCN identifies key reviews from both users and items, and then performs fine-grained word-by-word matching. This approach enhances interpretability and enables deep-level semantic interaction between reviews.
RPRM [36]: RPRM explicitly links reviews with their associated attributes and introduces two novel loss functions along with a negative sampling strategy to jointly model user preferences and review attribute relationships.
To ensure a fair comparison across all baseline models, we applied early stopping during training and reproduced the models using the hyperparameters specified in their original papers. For consistency, we employed BERT-based embeddings for all comment inputs and adopted the same data preprocessing strategies across models. Specifically, we filtered comments based on their confidence scores, length, ratings, and temporal span to retain high-quality, informative reviews. Invalid entries—such as empty or overly short reviews—were removed. We also applied score-balancing preprocessing to ensure an equal distribution of ratings, as described in our approach.
For DeepCoNN and NARRE, we followed the configurations in [9,29], setting the learning rate to values in {0.005, 0.01, 0.02, 0.05}, batch size in {50, 100, 150}, dropout rate in {0.1, 0.3, 0.5, 0.7, 0.9}, and the number of latent factors in {8, 16, 32, 64}.
For DAML, the dimensionality of user and item latent vectors was set to 8, the sliding window size was set to 3, the dropout rate to 0.2, and the learning rate to 1 × 10 5 .
For DSMR, we initialized the learning rate at 0.01 and adopted the dynamic adjustment strategy via the NoamOpt optimizer, as detailed in the original paper. Dropout rates were tested within {0.05, 0.1, 0.3, 0.5}, batch sizes in {3, 5, 8, 16, 32}, and latent factor dimensions in {32, 64, 128, 256}.
For CARP, we followed the recommended setup in [40], setting the number of capsules and predefined thresholds to 5 and 3, respectively.
For U-BERT, we utilized the five domains used by the original authors—Books, CDs & Vinyl, Cell Phones, Electronics, and Video Games—for pre-training. Fine-tuning and testing were conducted on our selected Amazon subsets.
For MPCN, the number of pointers was adjusted across {1, 3, 5, 8, 10}.
For RPRM, the learning rate was varied between 1 × 10 5 and 1 × 10 3 , following the configurations provided in the original paper.

5. Experimental Results

To validate the effectiveness of our proposed method, we conducted extensive quantitative and qualitative experiments designed to address the following research questions:
Q1: Can our proposed method outperform both state-of-the-art review-based and traditional recommendation baselines?
Q2: How do different modules (such as review attribute attention layer) contribute to the overall performance of our proposed model?
Q3: How do key hyperparameters (such as the weights of collaborative vectors δ) affect the performance of our model?
Q4: Can the recommended results provide interpretability for the platform to complete other personalized services?

5.1. Q1: Performance Comparison

To address Q1, we first compare the performance of eight benchmark algorithms against our proposed RARPT model and its variants. To better illustrate the impact of individual review attributes on recommendation performance, we also conduct ablation experiments using only a single review attribute at a time. Additionally, we test the performance of RARPT under the full attribute attention setting, enabling us to assess which attributes have the greatest influence on the final recommendation results. The main findings are summarized below.
We observe that the basic MLP method shows a significant performance gap compared to other models across all datasets. This is primarily because the MLP lacks the capacity to model complex user–item interactions or leverage rich contextual information from review texts. By contrast, review-based models demonstrate substantial performance gains, confirming that user reviews serve as powerful auxiliary information to enhance recommendation effectiveness.
Among these, DeepCoNN performs consistently worse than NARRE and DAML, as the latter two integrate attention mechanisms to emphasize informative reviews, thereby learning more expressive user and item representations. Notably, MPCN achieves performance comparable to or even better than NARRE and DAML on certain datasets. We attribute this to MPCN’s ability to capture word-level interactions through its pointer mechanism, which enables fine-grained modeling of user preferences.
These results collectively underscore the importance of fine-grained review modeling, especially the ability to selectively attend to and interact with key textual elements in reviews, rather than treating them as flat sequences.
While RARPT demonstrates consistently lower MSE and MAE across all datasets, we note that formal statistical significance tests (e.g., paired t-tests) were not performed in this study. However, the consistency of the improvements across all six diverse datasets provides strong evidence of the model’s robust superiority. We recommend incorporating statistical significance testing in future validation work.
Table 3 presents the comprehensive performance comparison of RARPT against all baseline methods on the six datasets, evaluated by MSE and MAE. The ‘Module’ column lists all baselines and the different configurations of our RARPT model. The rows ‘Timestamp’ through ‘Emotional analysis’ represent RARPT using only that single review attribute for the attention layer, demonstrating the individual contribution of each attribute. The final ‘RARPT’ row shows the performance of our full model integrating all 9 attributes. Lower values indicate better performance.
The CARP model introduces capsule networks and employs a protocol routing mechanism while explicitly modeling both positive and negative reviews. Its performance shows a slight improvement over MPCN, suggesting that incorporating review polarity contributes to better generalization and thus enhances overall recommendation effectiveness.
Substantial performance gains are observed with U-BERT, DSMR, and RPRM, all of which leverage the powerful BERT language model for review representation. Among them, U-BERT benefits from cross-domain review knowledge transfer, using user reviews from domains with rich content to enhance those with sparse information. DSMR captures temporal dynamics of user preferences by integrating BERT-based embeddings with LSTM architectures. RPRM, on the other hand, achieves fine-grained modeling by jointly attending to multiple key review attributes, allowing the model to extract more nuanced preference signals.
Regarding our proposed RARPT model, we further performed attribute-level ablation studies to evaluate the contribution of individual review attributes as well as their combined effect. The results show that each single-attribute variant of RARPT consistently outperforms all baseline methods, and that the integration of all nine attributes yields the best overall performance. Notably, the review attributes ‘Timestamp’, ‘Positive proportion’, and ‘Negative proportion’ stand out with the strongest individual impact.
Timestamp aligns with RARPT’s Temporal Processing Layer, allowing the model to leverage sequential patterns in user behavior.
Positive/Negative proportions reflect the polarity distribution of user reviews and interact effectively with the Polarity Balance Layer, contributing to more balanced and context-aware embeddings.
Interestingly, the contribution of each attribute is dataset-dependent. For instance, polarity-related attributes are more influential in datasets with a higher proportion of negative reviews (e.g., Yelp and Video Games). This suggests that contextual characteristics of datasets (e.g., sentiment skew, domain specificity) should inform attribute weighting strategies, reinforcing the need for dynamic attention mechanisms.
Finally, based on Figure 1, we observe that RARPT delivers the most notable performance gains in datasets with higher negative review ratios, validating the effectiveness of the collaborative vector transfer mechanism employed by the Polarity Balance Layer. Even in datasets with relatively few negative reviews (e.g., Office Products), RARPT still achieves meaningful improvements, demonstrating its robustness and adaptability across domains.
From a practical standpoint, this consistent reduction in MSE/MAE is highly valuable. For a real-world e-commerce platform, this translates to predictions that are much closer to the user’s true satisfaction. This enhanced accuracy can lead to higher user trust in the recommendations, improved click-through rates, and ultimately, increased customer retention and sales.
In summary, these findings confirm that the RARPT model benefits from comprehensive review attribute modeling, temporal context, and polarity balancing, enabling it to address limitations of prior models and to significantly improve recommendation performance across diverse datasets.

5.2. Q2: Ablation Experiment

To answer Q2, we conducted a series of ablation experiments across multiple datasets to investigate the contribution of each module within the RARPT model. Specifically, we designed the following model variants:
RARPT (Full Model): The complete model configuration using optimal hyperparameters, consistent with the results reported in Table 2.
w/o BERT: This variant replaces BERT-based review embeddings with word2vec embeddings, reducing the semantic richness of review representations.
w/o attribute: This variant removes the review attribute attention layer, such that only individual reviews are modeled, without incorporating review attribute-level attention.
w/o sequence: This variant excludes the temporal modeling layer, thereby removing sequential modeling after the attribute attention step and directly proceeding to polarity balancing.
w/o polarity: This variant removes the polarity balance layer, which prevents the model from leveraging sentiment-based collaborative signals from reviews with opposite polarities.
The ablation experimental results are shown in Table 4. We can observe that removing any module leads to a performance decline. We can also see that the MSE and MAE scores of different modules are ranked as follows: w/o polarity > w/o BERT > w/o attribute > w/o sequence. This indicates that the polarity balance layer contributes the most significantly to the overall performance of RARPT, followed by the BERT-based text embedding, then the attribute attention layer, while the temporal modeling layer has a relatively smaller positive impact. Notably, even the weakest variant still outperforms traditional baselines, demonstrating the robustness of the overall architecture.
The performance drop in the w/o BERT variant highlights the critical role of rich semantic embeddings in enabling downstream modules to mine latent information from review texts. The contextualized embeddings with BERT provide representational capacity compared to static embeddings like word2vec, making it easier to capture subtle signals such as tone, intent, or fine-grained sentiment, which are essential for personalized recommendations.
The polarity balance layer contributes most significantly to the recommendation performance on most datasets. As shown in Figure 1, the performance gains are particularly notable on the datasets with a higher ratio of negative reviews (e.g., Yelp, Tools & Home Improvement). This demonstrates that distinguishing between positive and negative reviews and learning opposite-polarity collaborative signals can mitigate biases from imbalanced sentiment distributions and achieve better recommendation performance.
While the temporal modeling layer contributes the least among the four variants, it still improves performance compared to baseline models and single-attribute variants. Its effectiveness is more pronounced in domains where user behavior is temporally dynamic. On the other hand, the review attribute attention layer plays an essential role in enabling the model to assign different weights to various review attributes, which enriches representation learning beyond plain text.
Finally, our ablation study confirms the contribution of each component of RARPT to the overall performance. Among these components, the polarity balance layer and review embeddings with BERT are particularly critical. These findings further validate the effectiveness of our model and underscore the importance of multi-dimensional review modeling, textual richness, temporal dynamics, attribute-level attention, and sentiment-aware collaborative representation learning.

5.3. Q3: Experiments on Key Hyperparameters

To answer Q3, we conducted a set of controlled experiments to analyze how two key hyperparameters in the Polarity Balance Layer affect the overall performance of the RARPT model.
Our primary focus is on:
(1) The weight coefficient (δ) assigned to the balanced collaborative vector, and
(2) The number of reviews selected per user and item.
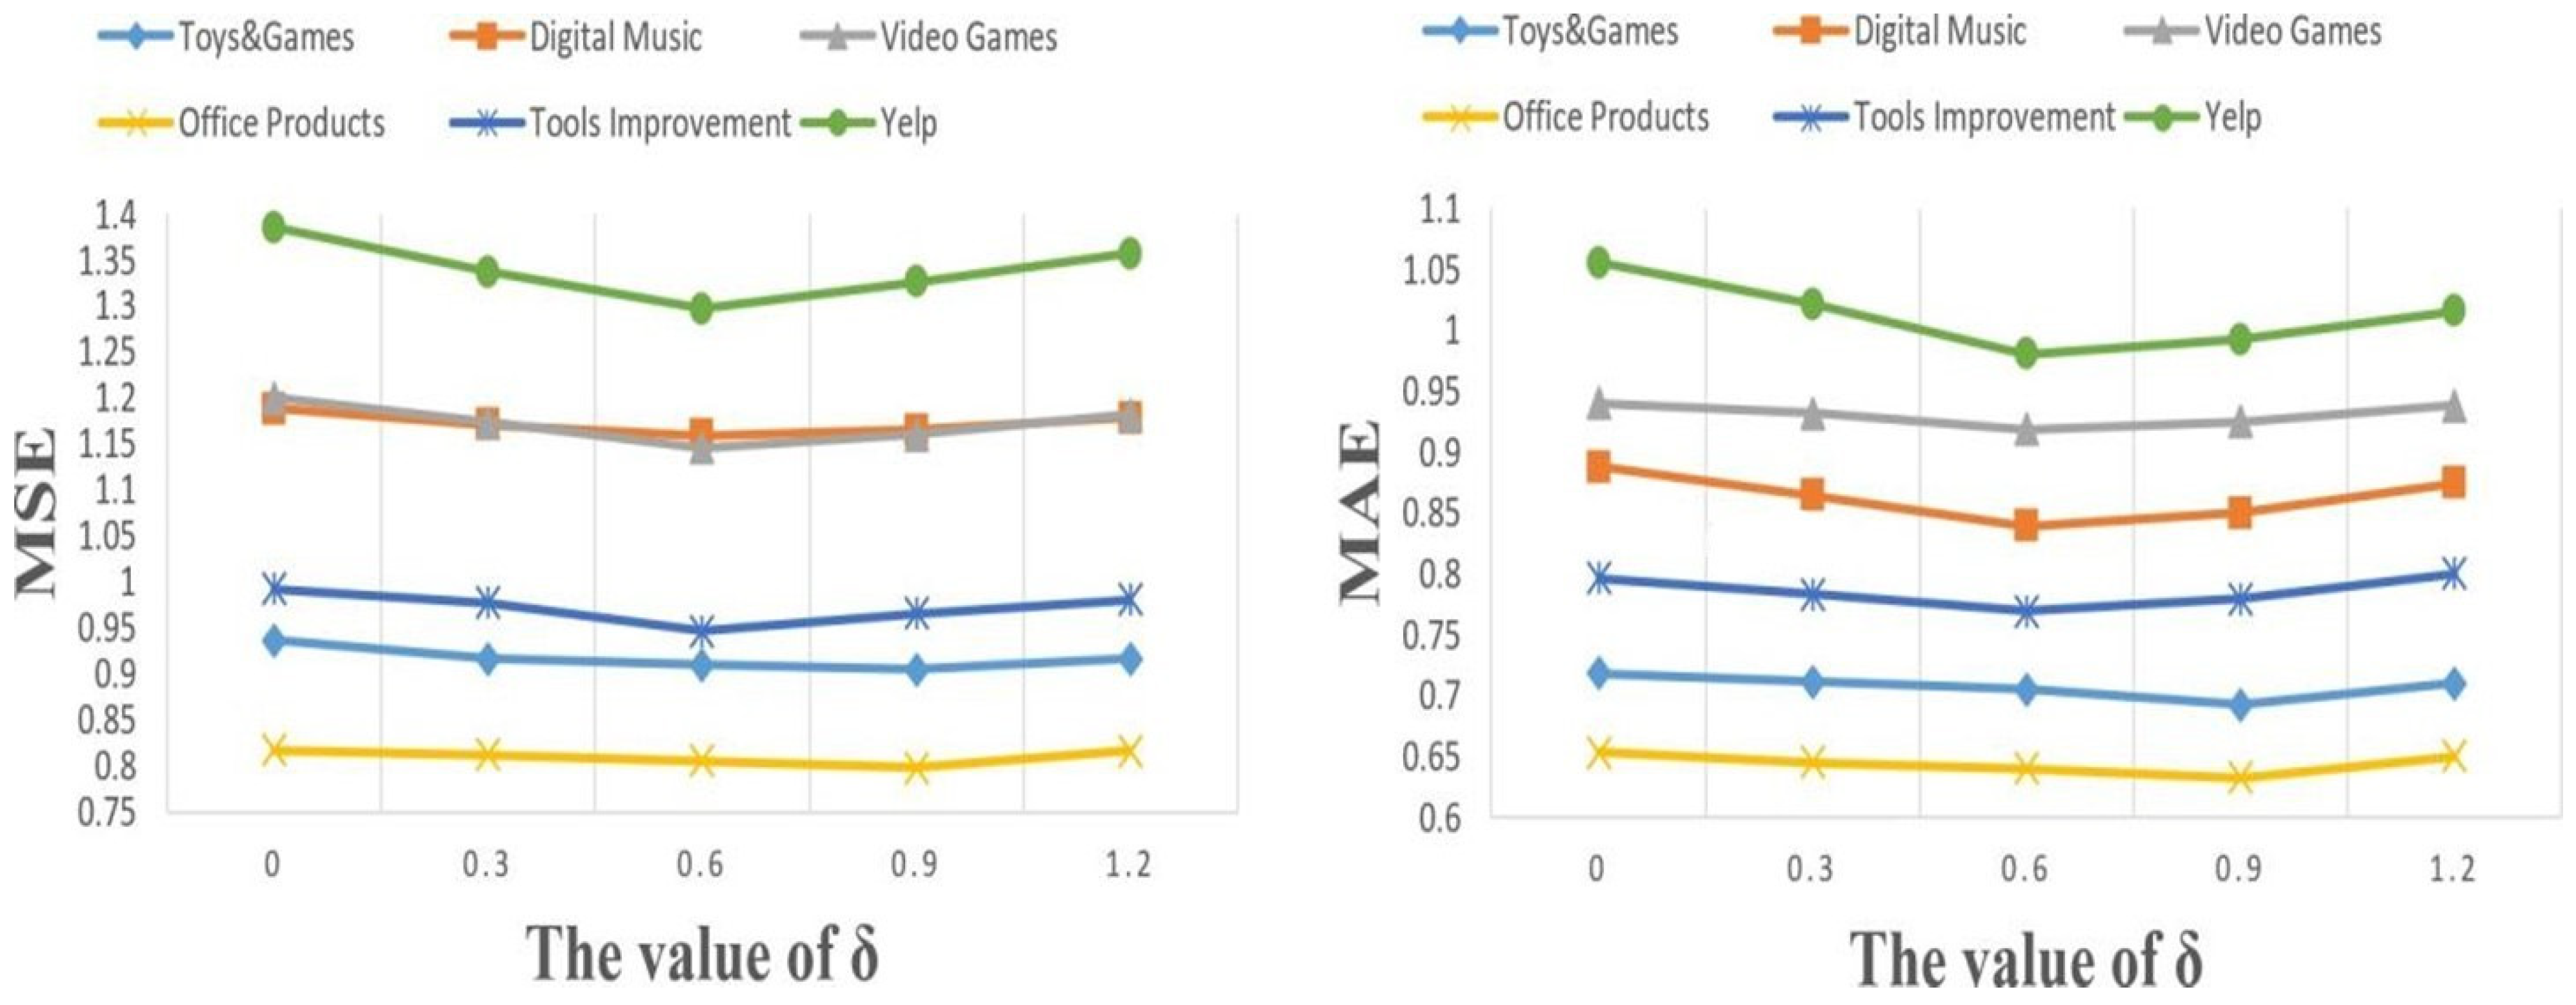
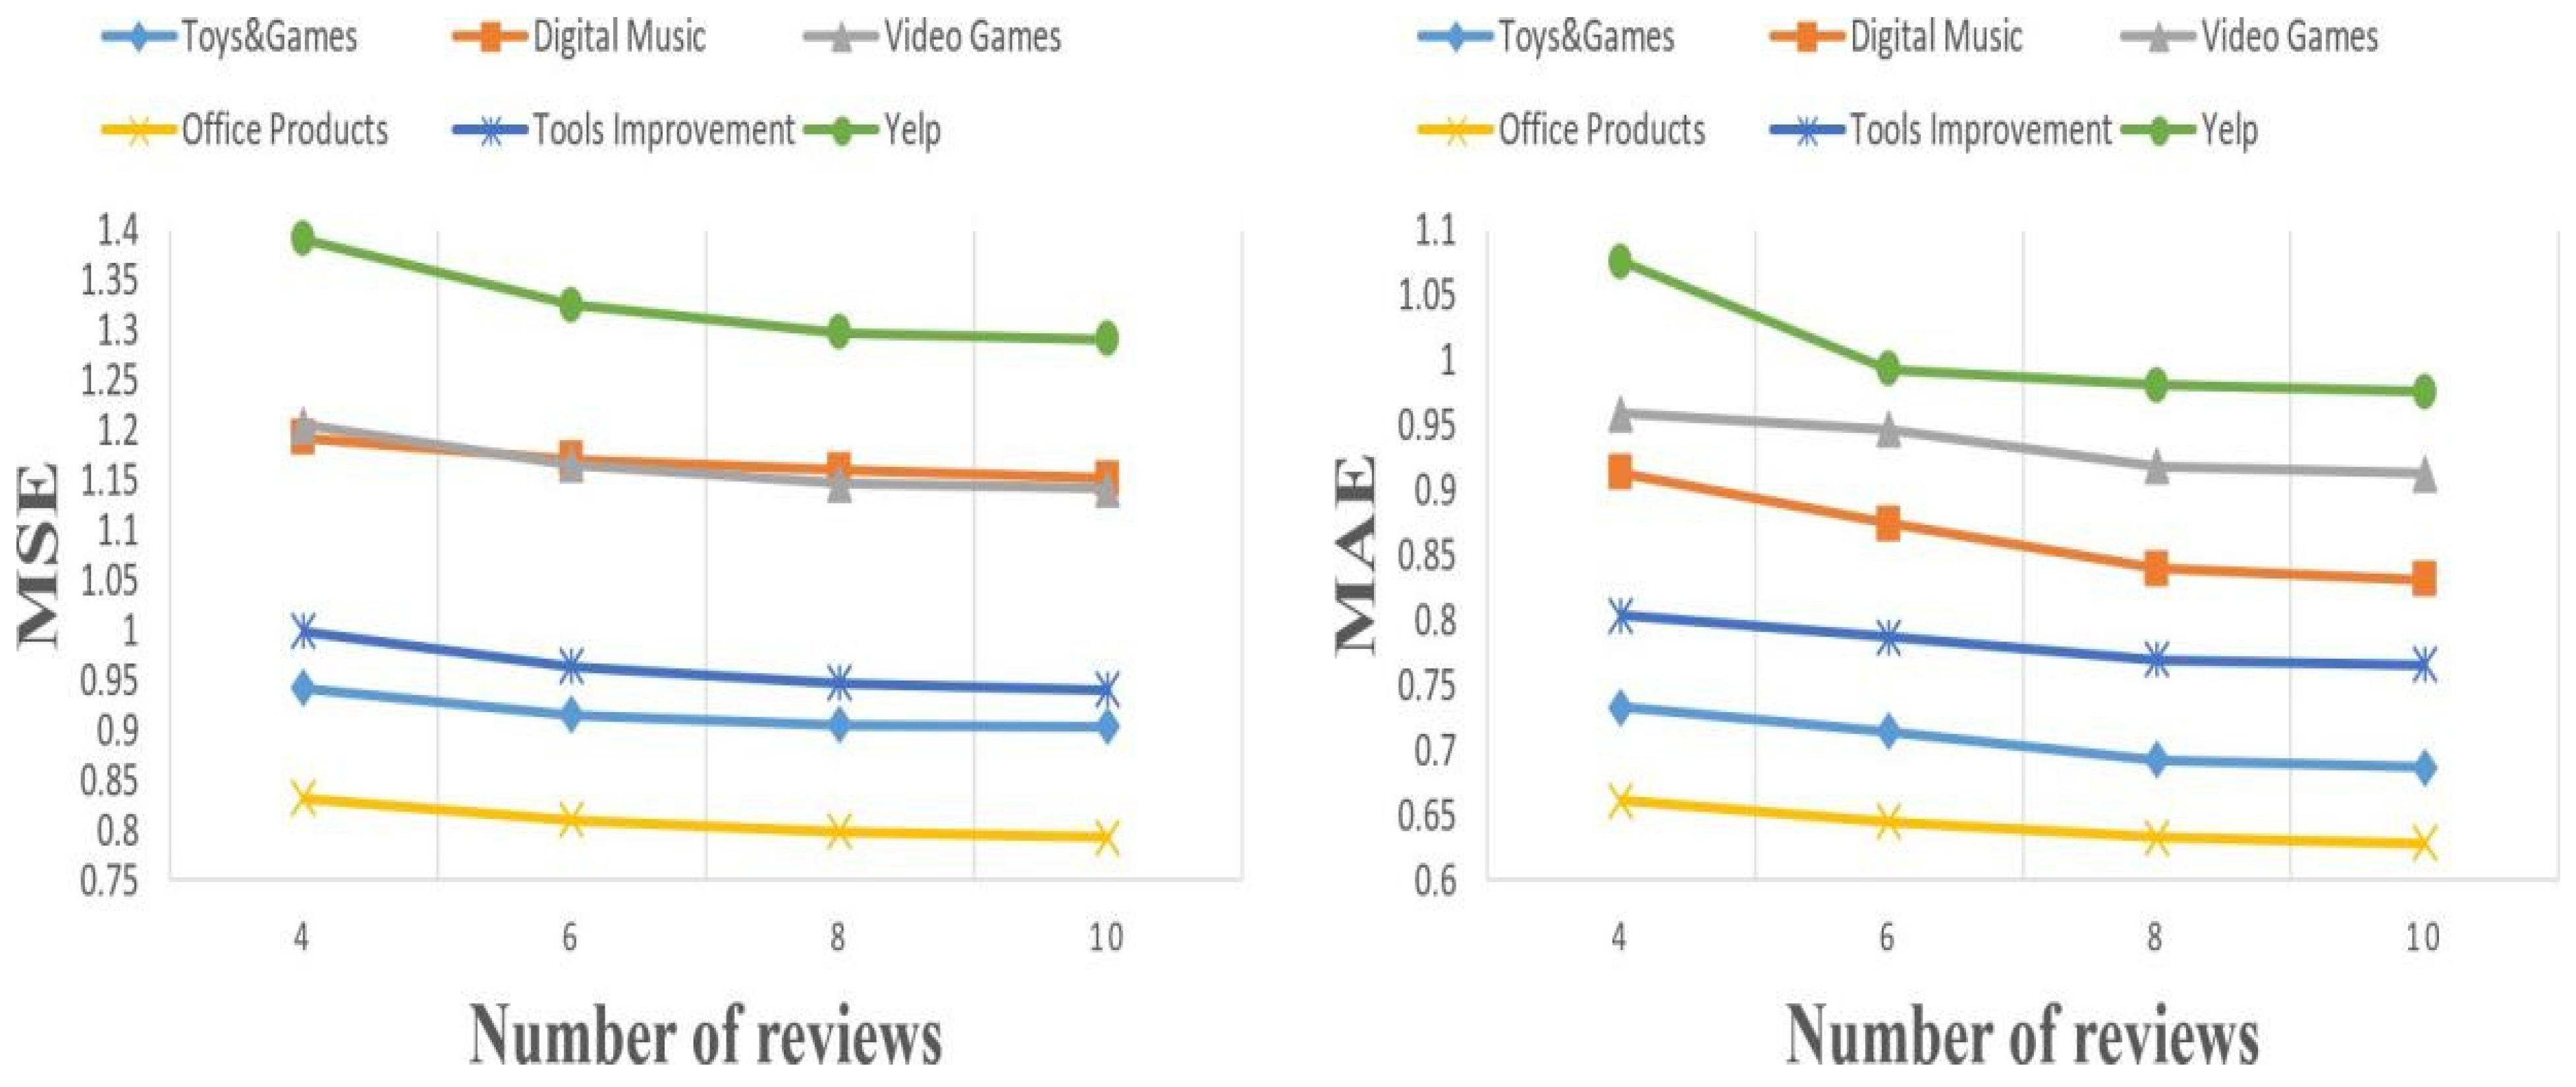
Figure 5 and Figure 6, respectively, illustrate the impact of these two parameters on the MAE and MSE evaluation metrics.
  • The Impact of the Weight Coefficient δ
To assess how the weight δ influences model performance, we tested values in the set {0, 0.3, 0.6, 0.9, 1.2}. As shown in Figure 5, we observed the following trends:
For datasets with a lower proportion of negative reviews (e.g., Toys, Games, Office Products), higher δ values yielded better results. This indicates that incorporating collaborative vectors from opposite-polarity reviews helps supplement limited sentiment diversity.
For datasets with a more balanced sentiment distribution (e.g., Yelp), moderate δ values performed best. In these cases, excessively large δ values degraded performance—likely due to overemphasizing polarity signals at the expense of semantic coherence.
Across all datasets, δ values greater than 1 consistently failed to improve performance, suggesting that collaborative vectors should serve as auxiliary signals, not dominant features. Overweighting them disrupts the primary semantic flow of the original user-item representation.
In practice, we found the optimal range for δ to be between 0.2 and 0.6, striking a balance between incorporating polarity-driven signals and maintaining the integrity of original representations.
2.
The Number of Reviews per User/Item
We also explored the effect of the number of user/item reviews incorporated into the model, testing values in the set {4, 6, 8, 10}. As depicted in Figure 6, the following patterns emerged:
Increasing the number of reviews generally led to better performance, with improvements tapering off as the count increased.
This diminishing return suggests that while a minimum number of reviews (e.g., ≥6) is essential to effectively characterize user behavior and support the model’s temporal sequence modeling, additional reviews beyond a certain point add marginal benefit while significantly increasing computational cost.
Based on these findings, we recommend selecting 6 to 8 reviews per user/item to balance accuracy and efficiency.
Summary:
Our hyperparameter analysis demonstrates that both the collaborative vector weight (δ) and the number of selected reviews play critical roles in optimizing RARPT performance. Tuning these parameters appropriately based on dataset characteristics—especially sentiment distribution and review density—is essential for maximizing the effectiveness of the Polarity Balance Layer and the overall model.

5.4. Q4: Interpretability

To address Q4, we analyze the interpretability dimension of the RARPT model’s recommendation mechanism. Since RARPT extracts multiple review attributes and integrates them with review polarity and temporal sequence features, interpretability can be derived from the attention weights assigned to each attribute during inference. These weights provide insight into which review characteristics most influence the final recommendation for different users.
To demonstrate this, we selected three users with distinct behavioral characteristics from the dataset using Python 3.12 for exploratory data analysis. Their profiles are summarized as follows:
User A ranks in the top 10% of all users in terms of number of reviews and temporal span (i.e., the time interval between their earliest and most recent reviews). Other attributes, such as average review length, are close to the 50th percentile, approximating the dataset mean.
User B ranks in the top 10% for average review length, suggesting a tendency to write longer and more detailed reviews. Other attributes, such as the emotional word ratio, are again around the 50th percentile.
User C ranks in the top 10% for the proportion of positive and negative emotional words, indicating a preference for emotionally expressive reviews. However, review length and other metrics remain close to the dataset average.
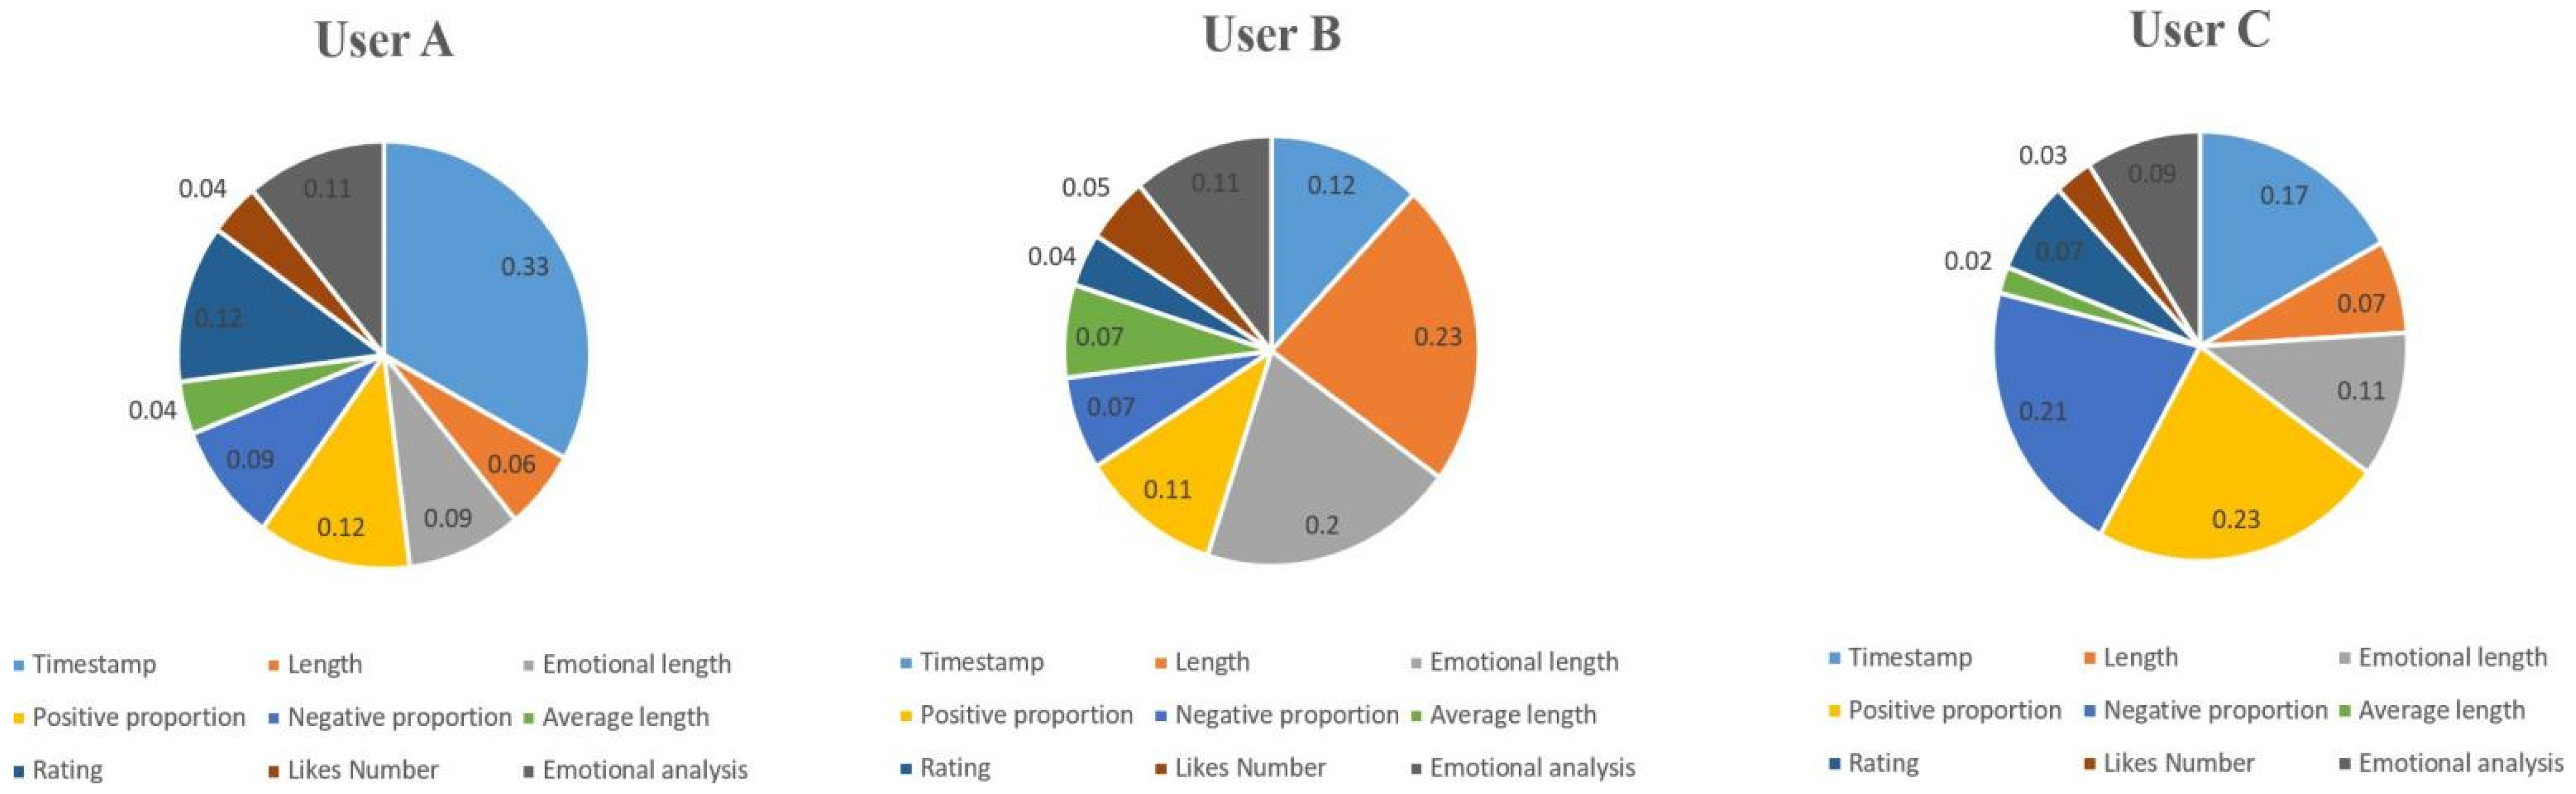
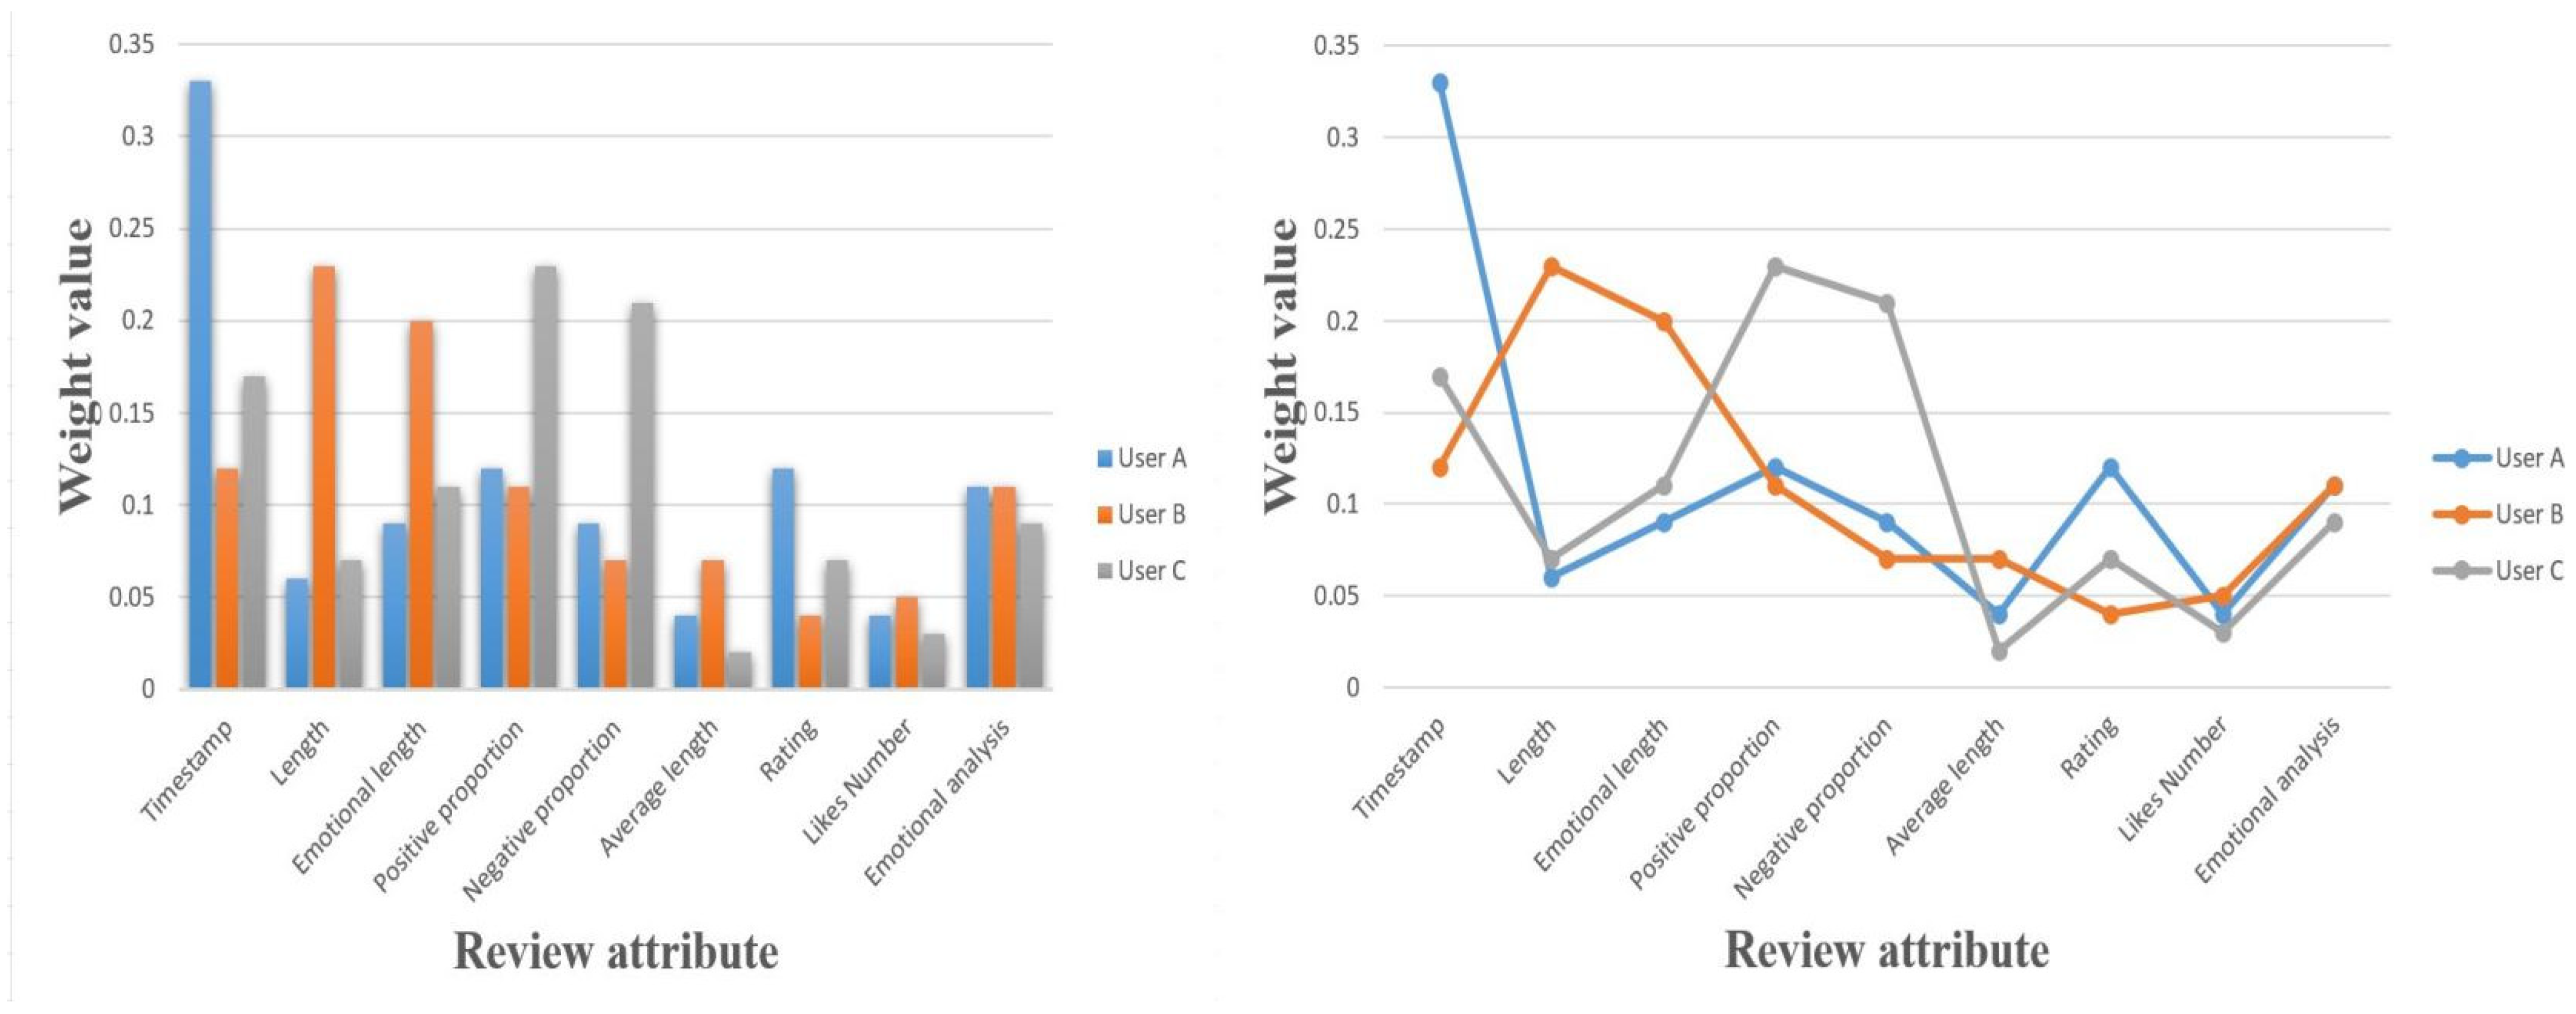
We then extracted attribute-level attention weights from multiple representative reviews written by each user. By averaging these weights, we derived a personalized attribute weight profile for each user, which is visualized in Figure 7 (pie chart of attribute weight ratios) and Figure 8 (histogram and line chart comparison of review attribute weights across users). In Figure 8, the chart on the left (histogram) allows for direct comparison of attribute weights across users, while the chart on the right (line plot) highlights the different ‘preference signatures’ of each user.
From Figure 7 and Figure 8, several trends emerge:
User A, characterized by a high review frequency and wide temporal span, exhibits stronger attention weight toward the Timestamp attribute, suggesting that recent reviews have a greater influence on their preferences.
User B, who tends to write longer reviews, demonstrates higher attention weights for Length and Emotional Length, indicating that emotionally rich and extensive reviews are more predictive of their preferences.
User C, known for a high frequency of emotional expression, shows significantly higher weights for Positive and Negative Emotion Proportions, highlighting the model’s ability to detect emotional sensitivity in user behavior.
Interestingly, Timestamp, Positive Proportion, and Negative Proportion consistently receive high attention across all three users. This finding aligns with the earlier experimental results in Section 5.1, reaffirming the importance of recency and emotional polarity in shaping recommendation accuracy.
These results indicate that RARPT not only improves predictive performance but also provides fine-grained interpretability at the user level. Online platforms can leverage such insights to deliver personalized recommendation explanations, support user segmentation, and design tailored content strategies based on dominant user traits.

6. Conclusions, Limitations, and Future Work

6.1. Conclusions

In this paper, we proposed a review-aware recommendation method, RARPT, based on polarity and temporality. Our method integrates user reviews, their attributes, and sequential information to address the challenge of imbalanced polarity distribution in user-generated content, thereby improving the performance of review-aware recommendations. Extensive experiments on real-world datasets demonstrate that RARPT outperforms several state-of-the-art recommendation algorithms. Furthermore, our results verify that generating collaborative vectors from opposite polarities effectively mitigates review imbalance, making recommendations less susceptible to the bias caused by an overabundance of positive reviews.

6.2. Limitation

Despite the strong performance, our work has several limitations that offer avenues for future research:
Dataset Balancing: As discussed in Section 4.1, our experimental design used a balanced 1:1:1:1:1 rating distribution. While this isolates the model’s polarity handling, it deviates from real-world skewed data. The model’s performance on the original, imbalanced distributions has not yet been validated.
Dataset Scope: The Amazon and Yelp datasets are exclusively in English and focus on consumer products. The generalizability of RARPT to other languages, domains (e.g., media, academic citations), or datasets with naturally balanced polarity remains to be explored.
Statistical Validation: This study relies on comparative MSE/MAE values. We did not perform formal statistical significance tests (e.g., t-tests) to rigorously confirm that the improvements over baselines are statistically significant.

6.3. Future Work

Based on these limitations and our findings, we plan to extend this framework in several directions:
Imbalanced Data Evaluation: Conduct extensive experiments on the original, skewed datasets to validate the effectiveness of the Polarity Balance Layer in a real-world setting.
Cross-Domain and Multilingual Extension: Adapt and evaluate RARPT for multilingual datasets and different domains (e.g., talent recommendation, as initially suggested) to test its generalizability.
Advanced Temporal Modeling: Explore more sophisticated temporal weighting schemes beyond linear normalization, such as exponential decay or self-attentive temporal encoding, to better capture the nuances of preference drift.
Integration with LLMs: Investigate the use of large language models (LLMs) to replace the BERT encoder or to provide richer, more nuanced attribute extraction, potentially identifying implicit polarity cues that sentiment dictionaries miss.
Scalability: Assessing the training and inference efficiency of RARPT on large-scale, industrial-sized datasets to ensure its feasibility in production environments.
Domain Transfer: While we tested on multiple domains, future work could explore formal domain transfer techniques to apply a model trained on a data-rich domain (like ‘Video Games’) to a sparse domain (like ‘Office Products’).
User Fairness: Analyzing the model for potential fairness issues, such as whether it disproportionately benefits users with many reviews (rich data) versus new or ‘cold-start’ users (sparse data).


Author Contributions

Conceptualization, Y.Y. and Y.D.; methodology, X.W.; software, Y.R.; validation, Q.Z. and Y.R.; formal analysis, Y.D.; investigation, X.W.; resources, Y.Y.; data curation, X.W.; writing—original draft preparation, Y.Y.; writing—review and editing, J.L. and Y.D.; visualization, X.W.; supervision, J.L.; project administration, Y.Y.; funding acquisition, Y.D. All authors have read and agreed to the published version of the manuscript.

Funding

This work is supported by the Science and Technology Research Program of Chongqing Municipal Education Commission (Grant No. KJQN202200649).

Data Availability Statement

The datasets presented in this article are not readily available because the data are part of an ongoing study.

Conflicts of Interest

The authors declare no conflict of interest.

References

  1. Kim, K.; Song, H.; Suh, B. Self-Referential Review: Exploring the Impact of Self-Reference Effect in Review. In Proceedings of the 47th International ACM SIGIR Conference on Research and Development in Information Retrieval, SIGIR ’24, New York, NY, USA, 11 July 2024; Association for Computing Machinery: New York, NY, USA, 2024; pp. 2624–2628. [Google Scholar]
  2. Baltrunas, L.; Ludwig, B.; Ricci, F. Matrix Factorization Techniques for Context Aware Recommendation. In Proceedings of the fifth ACM Conference on Recommender Systems, Chicago, IL, USA, 23–27 October 2011; Association for Computing Machinery: New York, NY, USA, 2011; pp. 301–304. [Google Scholar]
  3. Fan, X.; Liu, Z.; Lian, J.; Zhao, W.X.; Xie, X.; Wen, J.-R. Lighter and Better: Low-Rank Decomposed Self-Attention Networks for Next-Item Recommendation. In Proceedings of the 44th International ACM SIGIR Conference on Research and Development in Information Retrieval, SIGIR ’21, Montreal, QC, Canada, 11–15 July 2021; ACM: New York, NY, USA, 2021; pp. 1733–1737. [Google Scholar]
  4. Jakob, N.; Weber, S.H.; Müller, M.C.; Gurevych, I. Beyond the Stars: Exploiting Free-Text User Reviews to Improve the Accuracy of Movie Recommendations. In Proceedings of the 1st International CIKM Workshop on Topic-Sentiment Analysis for Mass Opinion, Hong Kong, China, 6 November 2009; Association for Computing Machinery: New York, NY, USA, 2009; pp. 57–64. Available online: https://dl.acm.org/doi/abs/10.1145/1651461.1651473 (accessed on 20 October 2025).
  5. Safavi, S.; Jalali, M.; Houshmand, M. Toward point-of-interest recommendation systems: A critical review on deep-learning approaches. Electronics 2022, 11, 1998. [Google Scholar] [CrossRef]
  6. Fan, J.; Gu, Y. Factor augmented sparse throughput deep relu neural networks for high dimensional regression. J. Am. Stat. Assoc. 2023, 119, 2680–2694. [Google Scholar] [CrossRef]
  7. Kim, D.; Park, C.; Oh, J.; Lee, S.; Yu, H. Convolutional Matrix Factorization for Document Context-Aware Recommendation. In Proceedings of the 10th ACM Conference on Recommender Systems, RecSys ’16, Boston, MA, USA, 15–19 September 2016; ACM: New York, NY, USA, 2016; pp. 233–240. [Google Scholar]
  8. Zheng, L.; Noroozi, V.; Yu, P.S. Joint Deep Modeling of Users and Items Using Reviews for Recommendation. In Proceedings of the Tenth ACM International Conference on Web Search and Data Mining, WSDM 2017, Cambridge, UK, 6–10 February 2017; ACM: New York, NY, USA, 2017; pp. 425–434. [Google Scholar]
  9. Catherine, R.; Cohen, W. Transnets: Learning to Transform for Recommendation. In Proceedings of the Eleventh ACM Conference on Recommender Systems, Como, Italy, 27–31 August 2017; Association for Computing Machinery: New York, NY, USA, 2017; pp. 288–296. Available online: https://dl.acm.org/doi/abs/10.1145/3109859.3109878 (accessed on 20 October 2025).
  10. Li, P.; Wang, Z.; Ren, Z.; Bing, L.; Lam, W. Neural Rating Regression with Abstractive Tips Generation for Recommendation. In Proceedings of the 40th International ACM SIGIR Conference on Research and Development in Information Retrieval, SIGIR ’17, Tokyo, Japan, 7–11 August 2017; ACM: New York, NY, USA, 2017; pp. 345–354. [Google Scholar]
  11. Seo, S.; Huang, J.; Yang, H.; Liu, Y. Interpretable Convolutional Neural Networks with Dual Local and Global Attention for Review Rating Prediction. In Proceedings of the Eleventh ACM Conference on Recommender Systems, RecSys ’17, Como, Italy, 27–31 August 2017; ACM: New York, NY, USA, 2017; pp. 297–305. [Google Scholar]
  12. Vaswani, A.; Shazeer, N.; Parmar, N.; Uszkoreit, J.; Jones, L.; Gomez, A.N.; Polosukhin, I. Attention is all you need. Adv. Neural Inf. Process. Syst. 2017, 1–11. Available online: https://proceedings.neurips.cc/paper/2017/hash/3f5ee243547dee91fbd053c1c4a845aa-Abstract.html (accessed on 20 October 2025).
  13. Kenton, J.D.M.W.C.; Toutanova, L.K. Bert: Pre-Training of Deep Bidirectional Transformers for Language Understanding. In Proceedings of the naacL-HLT, Minneapolis, MN, USA, 2–7 June 2019; Association for Computational Linguistics: Stroudsburg, PA, USA, 2019; Volume 1. Available online: https://au1206.github.io/assets/pdfs/BERT.pdf (accessed on 20 October 2025).
  14. Wang, M.; Liu, X.; Yin, M.; Qiao, M.; Jing, L. Deep Learning Recommendation Algorithm Based on Reviews and Item Description s. Comput. Sci. 2022, 49, 99–104. [Google Scholar]
  15. Tay, Y.; Luu, A.T.; Hui, S.C. Multi-Pointer Co-Attention Networks for Recommendation. In Proceedings of the 24th ACM SIGKDD International Conference on Knowledge Discovery & Data Mining, KDD ’18, London, UK, 19–23 August 2018; Association for Computing Machinery: New York, NY, USA, 2018; pp. 2309–2318. [Google Scholar]
  16. Elahi, M.; Kholgh, D.K.; Kiarostami, M.S.; Oussalah, M.; Saghari, S. Hybrid recommendation by incorporating the sentiment of product reviews. Inf. Sci. 2023, 625, 738–756. [Google Scholar] [CrossRef]
  17. Wei, Z.; Wu, N.; Li, F.; Wang, K.; Zhang, W. Moco4srec: A momentum contrastive learning framework for sequential recommendation. Expert Syst. Appl. 2023, 223, 119911. [Google Scholar] [CrossRef]
  18. Yang, Y.; Huang, C.; Xia, L.; Huang, C.; Luo, D.; Lin, K. Debiased Contrastive Learning for Sequential Recommendation. In Proceedings of the ACM Web Conference 2023, WWW ’23, Austin, TX, USA, 30 April–4 May 2023; Association for Computing Machinery: New York, NY, USA, 2023. [Google Scholar]
  19. Li, J.; Wang, Y.; McAuley, J. Time Interval Aware Self-Attention for Sequential Recommendation. In Proceedings of the 13th International Conference on Web Search and Data Mining, Houston, TX, USA, 3–7 February 2020; Association for Computational Linguistics: Stroudsburg, PA, USA, 2020; pp. 322–330. [Google Scholar]
  20. Blázquez-García, A.; Conde, U.; Mori, J.; Lozano, A. A review on outlier/anomaly detection in time series data. ACM Comput. Surv. 2021, 54, 1–33. [Google Scholar] [CrossRef]
  21. Srifi, M.; Oussous, A.; Lahcen, A.A.; Mouline, S. Recommender systems based on collaborative filtering using review texts—A survey. Information 2020, 11, 317. [Google Scholar] [CrossRef]
  22. de Handschutter, P.; Gillis, N.; Siebert, X. A survey on deep matrix factorizations. Comput. Sci. Rev. 2021, 42, 100423. [Google Scholar] [CrossRef]
  23. Shuai, J.; Wu, L.; Zhang, K.; Sun, P.; Hong, R.; Wang, M. Topic-Enhanced Graph Neural Networks for Extraction-Based Explainable Recommendation. In Proceedings of the 46th International ACM SIGIR Conference on Research and Development in Information Retrieval, SIGIR ’23, Taipei, Taiwan, 23–27 July 2023; Association for Computing Machinery: Stroudsburg, PA, USA, 2023; pp. 1188–1197. [Google Scholar]
  24. Devlin, J.; Chang, M.-W.; Lee, K.; Toutanova, K. Bert: Pre-Training of Deep Bidirectional Transformers for Language Understanding. arXiv 2018, arXiv:1810.04805. [Google Scholar]
  25. Darraz, N.; Karabila, I.; El-Ansari, A.; Alami, N.; Mallahi, E.M. Integrated sentiment analysis with BERT for enhanced hybrid recommendation systems. Expert Syst. Appl. 2025, 261, 125533. [Google Scholar] [CrossRef]
  26. Ling, G.; Lyu, M.R.; King, I. Ratings Meet Reviews, a Combined Approach to Recommend. In Proceedings of the 8th ACM Conference on Recommender Systems, RecSys’14, Foster City, CA, USA, 6–10 October 2014; ACM: New York, NY, USA, 2014. [Google Scholar]
  27. Qian, T.; Liu, B.; Nguyen, Q.V.H.; Yin, H. Spatiotemporal representation learning for translation-based poi recommendation. ACM Trans. Inf. Syst. 2019, 37, 1–24. [Google Scholar] [CrossRef]
  28. Xie, Z.; Singh, S.; McAuley, J.; Majumder, B.P. Factual and Informative Review Generation for Explainable Recommendation. In Proceedings of the AAAI Conference on Artificial Intelligence, Washington, DC, USA, 7–14 February 2023; Association for the Advancement of Artificial Intelligence: Palo Alto, CA, USA, 2023; Volume 37, pp. 13816–13824. [Google Scholar]
  29. Chen, C.; Zhang, M.; Liu, Y.; Ma, S. Neural Attentional Rating Regression with Review-Level Explanations. In Proceedings of the 2018 World Wide Web Conference on World Wide Web WWW ’18, Lyon, France, 23–27 April 2018; ACM Press: New York, NY, USA, 2018; pp. 1583–1592. [Google Scholar]
  30. Zhang, A.; Chen, Y.; Sheng, L.; Wang, X.; Chua, T.S. On Generative Agents in Recommendation. In Proceedings of the 47th International ACM SIGIR Conference on Research and Development in Information Retrieval, Washington, DC, USA, 14–18 July 2024; Association for Computing Machinery: New York, NY, USA, 2024; pp. 1807–1817. Available online: https://dl.acm.org/doi/abs/10.1145/3626772.3657844 (accessed on 20 October 2025).
  31. Wu, C.; Wu, F.; Ge, S.; Qi, T.; Huang, Y.; Xie, X. Neural News Recommendation with Multi-Head Self-Attention. In Proceedings of the 2019 Conference on Empirical Methods in Natural Language Processing and the 9th International Joint Conference on Natural Language Processing (EMNLP-IJCNLP), Hong Kong, China, 3–7 November 2019; Association for Computational Linguistics: Stroudsburg, PA, USA, 2019; pp. 6389–6394. [Google Scholar]
  32. Manotumruksa, J.; Macdonald, C.; Ounis, I. A Contextual Attention Recurrent Architecture for Context-Aware Venue Recommendation. In Proceedings of the 41st International ACM SIGIR Conference on Research & Development in Information Retrieval, SIGIR ’18, Ann Arbor, MI, USA, 8–12 July 2018; ACM: New York, NY, USA, 2018; pp. 555–564. [Google Scholar]
  33. Qahri-Saremi, H.; Montazemi, A.R. Factors affecting the adoption of an electronic word of mouth message: A meta-analysis. J. Manag. Inf. Syst. 2019, 36, 969–1001. [Google Scholar] [CrossRef]
  34. Zhou, Y.; Booth, S.; Ribeiro, M.T.; Shah, J. Do Feature Attribution Methods Correctly Attribute Features? In Proceedings of the AAAI Conference on Artificial Intelligence, Virtual Conference, 22 February–1 March 2022; AAAI Press: Palo Alto, CA, USA, 2022; Volume 36, pp. 9623–9633. [Google Scholar]
  35. Chen, T.; Yin, H.; Ye, G.; Huang, Z.; Wang, Y.; Wang, M. Try This Instead: Personalized and Interpretable Substitute Recommendation. In Proceedings of the 43rd International ACM SIGIR Conference on Research and Development in Information Retrieval, Xi’an, China, 25–30 July 2020; Association for Computing Machinery: New York, NY, USA, 2020; pp. 891–900. Available online: https://dl.acm.org/doi/abs/10.1145/3397271.3401042 (accessed on 20 October 2025).
  36. Wang, X.; Ounis, I.; Macdonald, C. Comparison of Sentiment Analysis and User Ratings in Venue Recommendation; Springer International Publishing: Cham, Switzerland, 2019; pp. 215–228. [Google Scholar]
  37. Sachdeva, N.; McAuley, J. How Useful are Reviews for Recommendation? A Critical Review and Potential Improvements. In Proceedings of the 43rd International ACM SIGIR Conference on Research and Development in Information Retrieval, SIGIR ’20, Xi’an, China, 25–30 July 2020; ACM: New York, NY, USA, 2020; pp. 1845–1848. [Google Scholar]
  38. Glorot, X.; Bengio, Y. Understanding the Difficulty of Training Deep Feedforward Neural Networks. In Proceedings of the Thirteenth International Conference on Artificial Intelligence and Statistics, JMLR Workshop and Conference Proceedings, Sardinia, Italy, 13–15 May 2010; PMLR: Cambridge, MA, USA, 2010; pp. 249–256. Available online: https://proceedings.mlr.press/v9/glorot10a (accessed on 20 October 2025).
  39. Li, C.; Quan, C.; Peng, L.; Qi, Y.; Deng, Y.; Wu, L. A Capsule Network for Recommendation and Explaining What You Like and Dislike. In Proceedings of the 42nd International ACM SIGIR Conference on Research and Development in Information Retrieval, SIGIR ’19, Paris, France, 21–25 July 2019; ACM: New York, NY, USA, 2019; pp. 275–284. [Google Scholar]
  40. Qiu, Z.; Wu, X.; Gao, J.; Fan, W. U-BERT: Pre-Training User Representations for Improved Recommendation. In Proceedings of the AAAI Conference on Artificial Intelligence, Virtual Conference, 2–9 February 2021; AAAI Press: Palo Alto, CA, USA, 2021; Volume 35, pp. 4320–4327. [Google Scholar]
Figure 1. Pie chart of the proportion of positive and negative reviews in different datasets.
Algorithms 18 00756 g001
Figure 2. The framework of our model. Different colors are used to distinguish positive reviews and negative reviews.
Algorithms 18 00756 g002
Figure 3. The fusion process of review attribute attention.
Algorithms 18 00756 g003
Figure 4. The details of polarity balance layer.
Algorithms 18 00756 g004
Figure 5. The influence of the RARPT hyperparameter δ value in the recommendation model on the MAE and MSE of the recommendation results.
Algorithms 18 00756 g005
Figure 6. The influence of the number of reviews extracted by RARPT users and projects in the recommendation model on the MAE and MSE of the recommendation results.
Algorithms 18 00756 g006
Figure 7. Pie chart of the weight ratio of review attribute weights for three users. Note: Pie chart of the average review attribute weights for three distinct user archetypes (User A, B, C). Each slice represents the mean attention weight assigned to that attribute across the user’s reviews, illustrating personalized preference patterns.
Algorithms 18 00756 g007
Figure 8. Histogram and line chart comparing the weight of review attributes for three users. Note: Comparative analysis of attribute weights for User A, B, and C. The histogram (left) and line chart (right) visualize the differing importance of each of the 9 review attributes, corresponding to the data in Figure 7.
Algorithms 18 00756 g008
Table 1. Summary of key notations.
NotationsDescription
U (uiU)The set of users
V (vjV)The set of items
P (pkP)The set of review attributes
SuThe set of user reviews
SvThe set of item reviews
Dpk,uUser u’s score for all reviews related to attribute
TuThe set of user u’s review embeddings
tu,iThe review embedding of user u’s i-th review
T posThe embeddings of positive reviews
T negThe embeddings of negative reviews
AThe set of reviews attribute embeddings,
where each attribute has been normalized
au,iThe attribute embedding of user u’s i-th review
Table 2. Statistical overview of the six datasets used for evaluation, including counts and polarity distributions.
#users#items#reviews#Pos (%)#Neg (%)
Toys & Games19,41211,924167,59789.76%10.24%
Digital Music5541356864,70684.73%15.27%
Video Games24,30310,672231,57783.89%16.11%
Office Products4905242053,25890.42%9.58%
Tools Improvement16,63810,217134,34585.58%14.42%
Yelp40,50058,7552,024,28376.63%23.37%
Table 3. Main performance comparison (MSE & MAE) of RARPT against baselines. Lower values indicate better performance. Our full RARPT model (bottom row) achieves the best results across all datasets.
Toys & GamesDigital MusicVideo GamesOffice ProductsTools
Improvement
Yelp
ModuleMSEMAEMSEMAEMSEMAEMSEMAEMSEMAEMSEMAE
MLP1.31451.21511.34471.16991.51241.22101.13541.08291.32631.15561.78751.4766
DeepCoNN [9]1.04140.91811.30211.07281.31641.13580.93700.80321.22481.04451.46611.3562
NARRE [29]1.02730.79621.28871.02521.27331.03490.86970.76911.09170.89811.45921.2367
DAML [39]1.03810.78251.27110.96601.26951.02380.85730.78291.08890.88451.45581.2011
MPCN [15]1.01810.76921.25560.95821.25981.00510.83120.69511.07250.87681.43841.1898
CARP [15]0.97410.74211.24140.93491.23080.97240.82710.67491.04970.85941.41611.1322
DSMR [14]0.96210.73981.21010.92351.22520.96150.82190.67331.03210.81711.41051.0916
U-BERT [16]0.94110.72521.19820.90531.20730.94760.82040.67161.02940.82081.40891.0832
RPRM [36]0.93660.71361.19660.89441.20050.94110.81870.66991.01620.80111.40621.0788
Timestamp0.91020.70291.16570.85171.16210.92270.80920.64610.95280.77521.33920.9901
Length0.92510.71121.18910.88521.18710.93960.81550.65051.00170.79521.39691.0492
Emotional
length
0.92140.71081.18660.87931.17890.94000.81890.65210.99350.79361.38061.0366
Positive
proportion
0.91640.70621.17350.85381.15810.92640.80770.64420.96770.77481.33650.9953
Negative
proportion
0.91770.70561.17320.85231.16420.92420.81040.64560.97250.78251.34621.0045
Average length0.92010.71731.18730.88991.18250.93730.81670.65390.98640.79061.37831.0528
Rating0.92680.70961.17490.86341.17620.92670.81950.66910.98320.79531.38931.0635
Likes Number0.92660.71521.18420.87261.18520.93410.81820.66110.98970.78611.39221.0677
Emotional
analysis
0.91920.70851.17640.86251.16010.93150.81520.65140.98220.79121.38181.0644
RARPT0.90510.69231.15950.83921.14610.91850.79830.63270.94660.76941.29730.9805
Table 4. The ablation study results.
Toys & GamesDigital MusicVideo GamesOffice
Products
Tools
Improvement
Yelp
ModuleMSEMAEMSEMAEMSEMAEMSEMAEMSEMAEMSEMAE
RARPT0.90510.69231.15950.83921.14610.91850.79830.63270.94660.76941.29730.9805
w/o BERT0.93140.71691.18210.87911.17910.93890.91650.64810.98070.79261.37221.0472
w/o attribute0.92690.71461.17890.86651.16260.93220.81540.64910.97530.78331.36721.0347
w/o sequence0.91910.70591.16740.85891.15920.92910.81090.64720.96810.77951.34281.0215
w/o polarity0.93320.71841.18830.88781.20010.94010.81700.65340.99250.79611.38551.0554
Disclaimer/Publisher’s Note: The statements, opinions and data contained in all publications are solely those of the individual author(s) and contributor(s) and not of MDPI and/or the editor(s). MDPI and/or the editor(s) disclaim responsibility for any injury to people or property resulting from any ideas, methods, instructions or products referred to in the content.