Article

A Data-Driven Intelligent Methodology for Developing Explainable Diagnostic Model for Febrile Diseases

by
Constance Amannah
1,
Kingsley Friday Attai
2,* and
Faith-Michael Uzoka
3
1
Department of Computer Science, Ignatius Ajuru University of Education, Port Harcourt 500102, Nigeria
2
Department of Mathematics and Computer Science, Ritman University, Ikot Ekpene 530101, Nigeria
3
Department of Mathematics and Computing, Mount Royal University, Calgary, AB T3E 6K6, Canada
*
Author to whom correspondence should be addressed.
Algorithms 2025, 18(4), 190; https://doi.org/10.3390/a18040190
Submission received: 14 January 2025 / Revised: 25 February 2025 / Accepted: 24 March 2025 / Published: 26 March 2025
(This article belongs to the Special Issue Algorithms for Computer Aided Diagnosis: 2nd Edition)

Abstract

:
Febrile diseases such as malaria, typhoid fever, tuberculosis, and HIV/AIDS pose significant diagnostic challenges in Low- and Middle-Income Countries (LMICs). Misdiagnosis leads to delayed treatment, increased healthcare costs, and higher mortality rates. This study presents a prototype diagnostic framework integrating machine learning (ML) and explainable artificial intelligence (XAI) to enhance diagnostic performance, interpretability, and usability in resource-constrained settings. A dataset of 3914 patient records from secondary and tertiary healthcare facilities was used to train and validate predictive models, employing Random Forest, Extreme Gradient Boost, and Multi-Layer Perceptron with optimized hyperparameters. To ensure transparency, XAI techniques such as Local Interpretable Model-Agnostic Explanations (LIME) and Large Language Models (LLMs) were integrated, enabling clinicians to understand model predictions. A prototype mobile-based diagnostic system was developed to explore its feasibility for real-time decision-making. The system features an intuitive interface, patient record management, and AI-driven diagnostic insights with visual and textual explanations. While usability testing with simulated case studies demonstrated its potential, real-world deployment and large-scale clinical validation are yet to be conducted. The system is designed with scalability in mind, allowing for future adaptation to different LMIC settings. However, limitations such as dataset imbalance and exclusion of pediatric data remain. Future research will focus on refining the model, expanding the dataset, and conducting extensive clinical validation before real-world implementation. This study serves as a foundational step toward AI-driven diagnostic tools in resource-limited healthcare environments.

1. Introduction

In tropical and Low- and Middle-Income Countries (LMICs), febrile diseases characterized by fever and frequently accompanied by other systemic symptoms present significant diagnostic and treatment challenges. Malaria, typhoid fever, urinary tract infections, Human immunodeficiency virus (HIV)/acquired immunodeficiency syndrome (AIDS), respiratory tract infections, and tuberculosis are among the illnesses that greatly increase morbidity and mortality, particularly in LMICs. These febrile diseases often present overlapping symptoms which results in misdiagnosis and suboptimal treatments, which prolongs illness, raises healthcare expenses, and in extreme situations, can lead to death [1,2,3]. This emphasizes the need for trustworthy and interpretable diagnostic tools to aid healthcare professionals in making timely and efficient decisions.
The Advancements in Artificial intelligence (AI) and machine learning (ML) have transformed the healthcare sector by providing data-driven insights into disease management, diagnosis, and treatment [4,5]. These technologies use massive datasets to find relationships and patterns that conventional diagnostic techniques might miss [6]. In healthcare diagnostics, data-driven approaches are becoming increasingly significant because they offer improved efficiency and precision such as in medical diagnosis [7,8,9,10,11], personalized medicine, and healthcare analytics [12,13,14]. They rely on medical data collection, processing, and analysis to identify trends, aid clinical decision-making, and enhance patient outcomes [15]. ML techniques such as unsupervised, supervised, and reinforcement learning can be applied to develop medical diagnostic systems. However, while ML models like Random Forest (RF), Extreme Gradient Boost (XGBoost), and Multi-Layer Perceptron (MLP) algorithms have demonstrated impressive predictive capabilities, they are often criticized for their “black-box” nature [16,17,18]. This “black-box” nature hinders their acceptance in crucial healthcare applications where transparency is essential by making it difficult for clinicians to comprehend the reasoning behind their predictions [19]. Explainable AI (XAI) has addressed this gap by enhancing the interpretability of making ML models without sacrificing their predictive capabilities [20]. Frameworks like Large Language Models (LLMs) and Local Interpretable Model-Agnostic Explanations (LIME) offer visual representations and textual outputs that make model decisions easy to understand, especially by non-experts [21,22]. Combining these frameworks allows diagnostic models to provide valuable insight, clarifying complex algorithm decisions and fostering professional trust. This strategy is important for febrile diseases, where early diagnosis and medical attention are essential for favorable patient outcomes.
This study aims to develop a data-driven, intelligent methodology for building explainable and accurate diagnostic models for febrile diseases, integrating ML algorithms with interpretability frameworks to enhance clinical decision-making and promote transparency in AI-driven healthcare systems. The study employs a data-driven approach, using a rich dataset of patient records and symptoms to develop an explainable disease diagnostic model. ML algorithms like Random Forest, XGBoost, and Multi-Layer Perceptron can provide the basis for precise disease prediction, optimizing their performance through extensive hyperparameter tuning and validation techniques, and XAI techniques such as LIME can ensure that the predictions are transparent and give clinicians confidence they need to comprehend and trust the system. Large Language Models such as ChatGPT can offer explanations in natural language, improving interpretability and making the diagnostic process easier for patients and medical professionals to understand. This study’s significant contributions are as follows:
  • The integration of ML models (Random Forest, XGBoost, MLP) with LIME and ChatGPT for explainability in diagnosing six febrile diseases;
  • A comparative evaluation of ML models, demonstrating their effectiveness in multi-label classification for febrile diseases;
  • The validation of model outputs with explainability techniques to ensure clinicians can understand and trust AI-driven diagnoses.
In this study, Section 2 presents the methodology, which includes the enhanced diagnostic framework, dataset description and preprocessing; the integration of XAI; system implementation; and model performance metrics. Section 3 discusses the results, which include an analysis of the models’ performance and the explainability of ChatGPT and LIME. Section 4 concludes the study, presenting the innovative aspect of the system as well as limitations and areas for further research.

2. Methodology

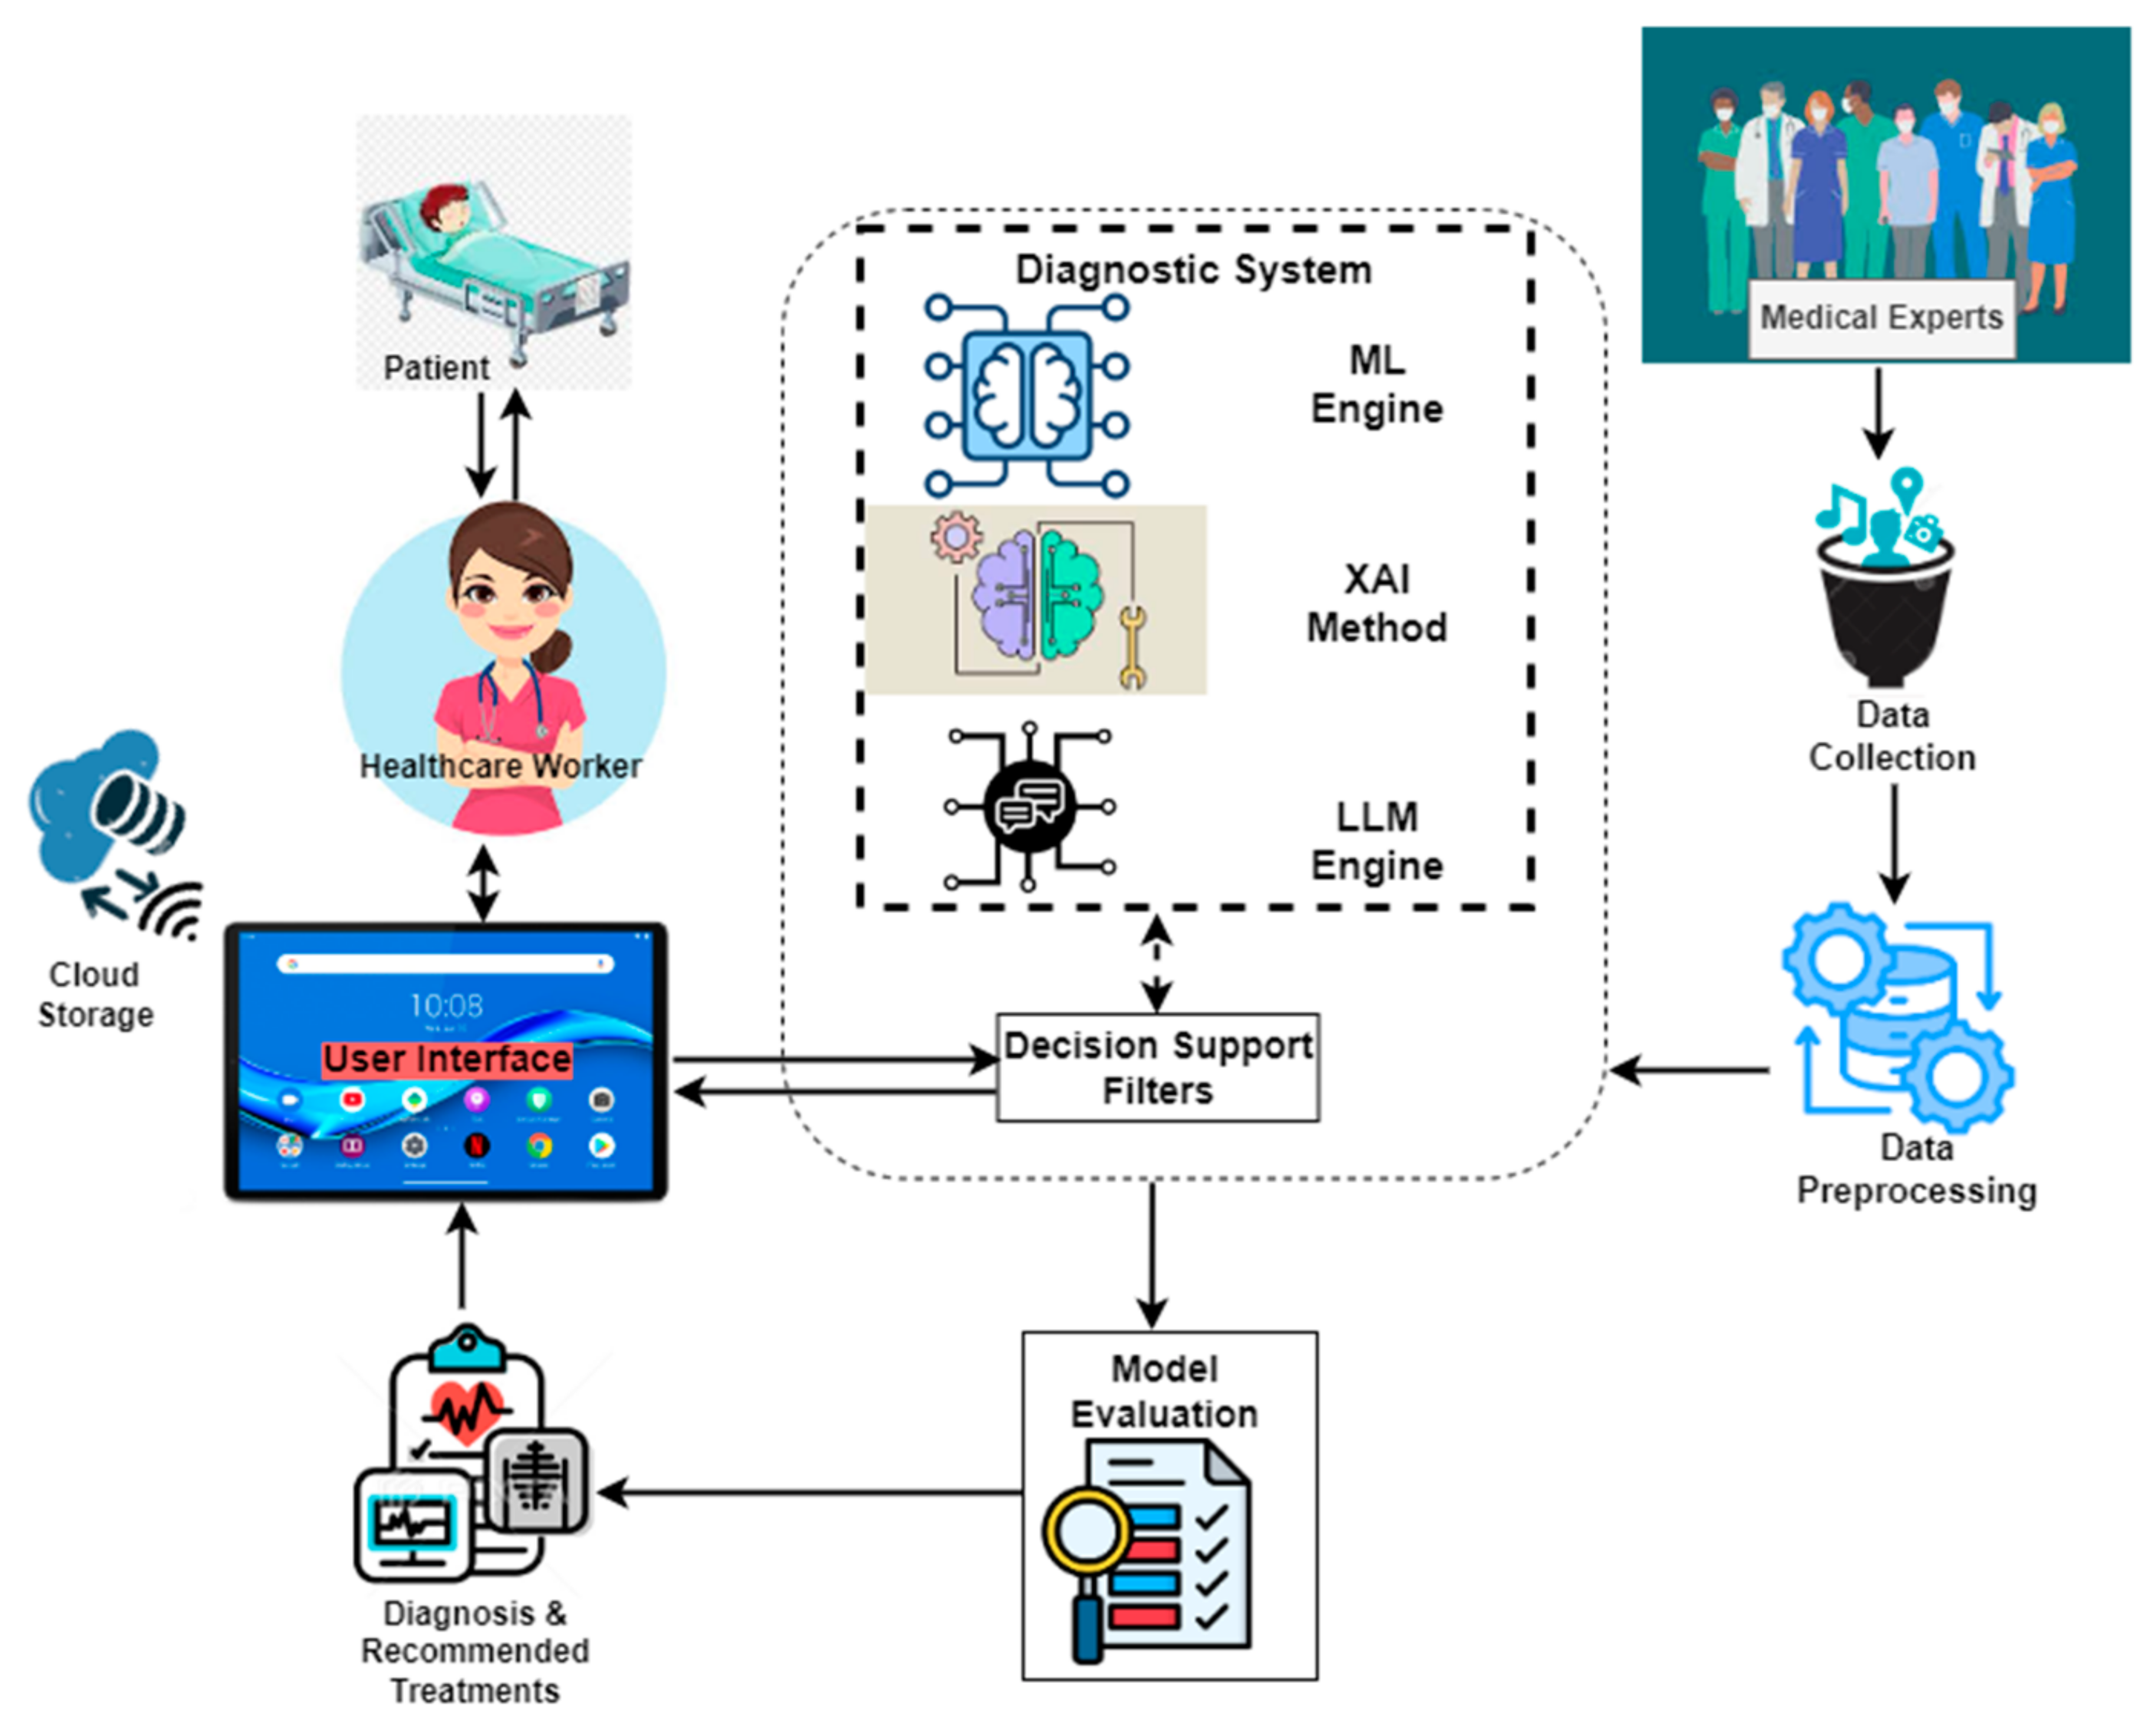
2.1. Enhanced Diagnostic Framework

The components of the enhanced diagnostic framework and their interrelationships comprise medical experts from which patient data were collected, data preprocessing, diagnostic system, model evaluation, healthcare providers, the patient, the mobile device, and the cloud storage, as illustrated in Figure 1. The Android-based mobile device serves as the interface between healthcare providers and the diagnostic system. Through the app’s user-friendly interface, the healthcare provider interacts directly with the system to enter personal data, and patient medical history, including temperature, blood pressure, respiratory rate, height, weight, and symptoms. The decision filter correctly groups patient vitals and symptoms for diagnostic decisions, simulating the reasoning of a knowledgeable physician. The diagnosis and recommended treatment component gives medical professionals the patient’s diagnosis based on the diagnostic system, which includes the RF diagnosis, LIME interpretation, and ChatGPT explanations. Diagnostic results, patient data, model data, and other system records are stored in the cloud. The medical experts are skilled doctors with experience in tropical diseases from secondary and tertiary hospitals who gathered information from patients with febrile diseases during clinic days.

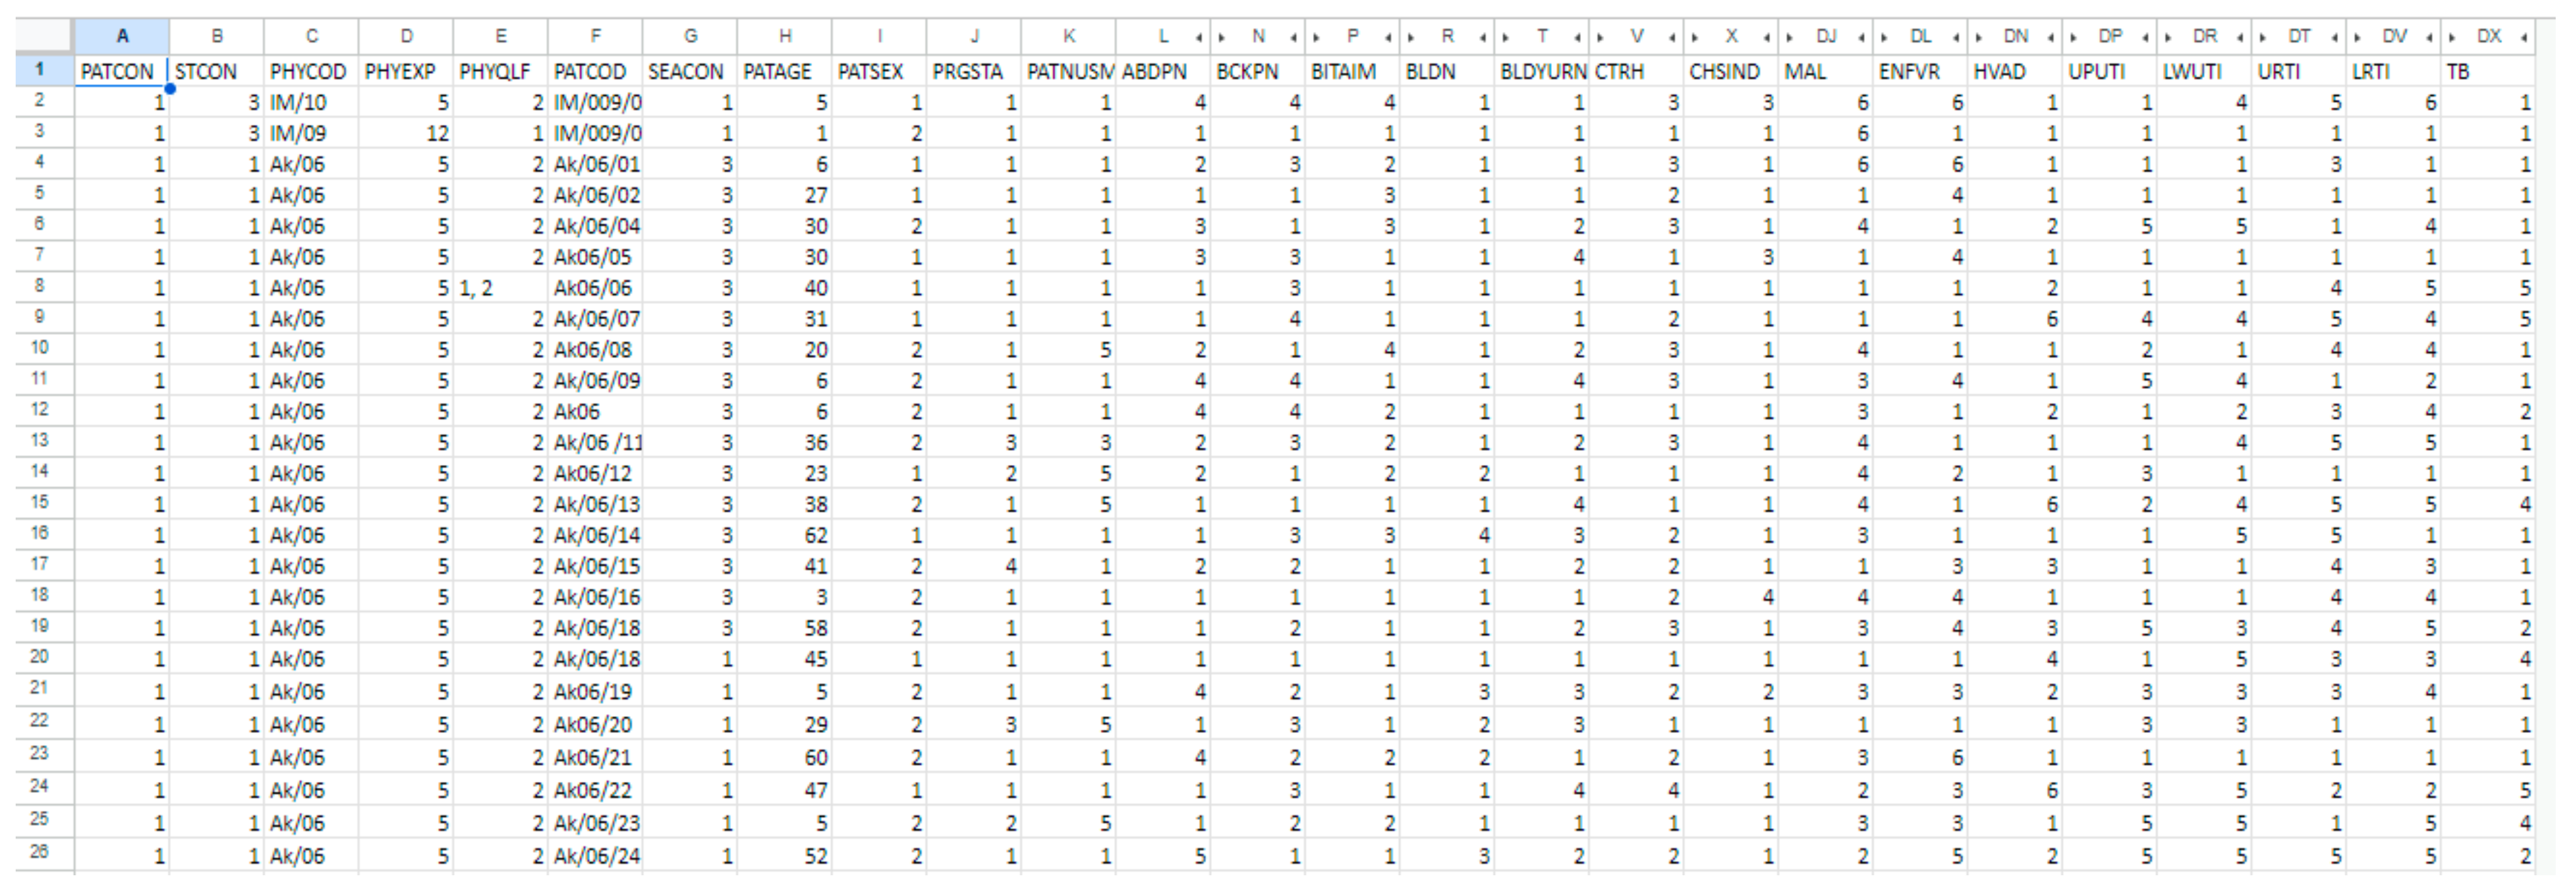
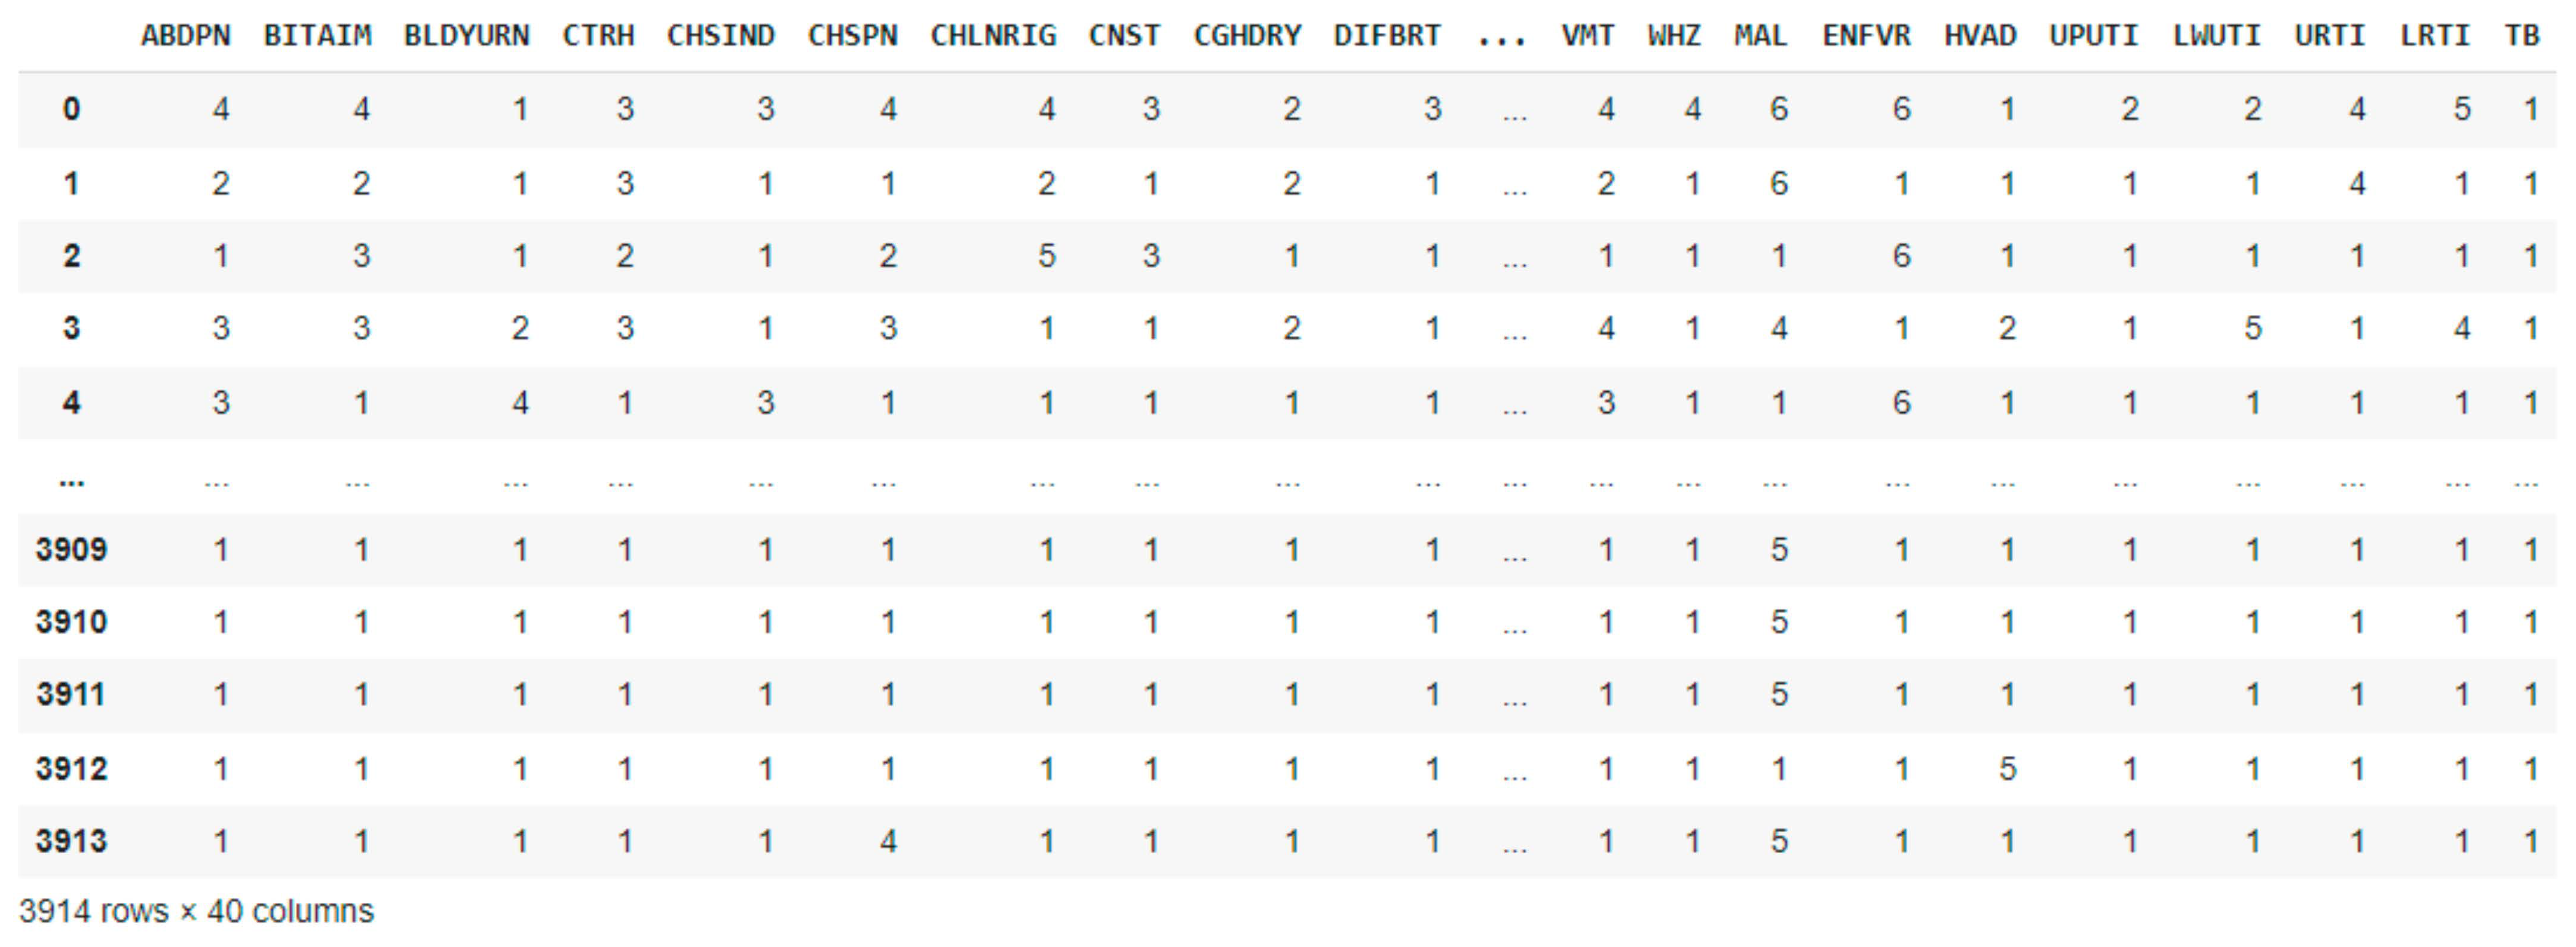
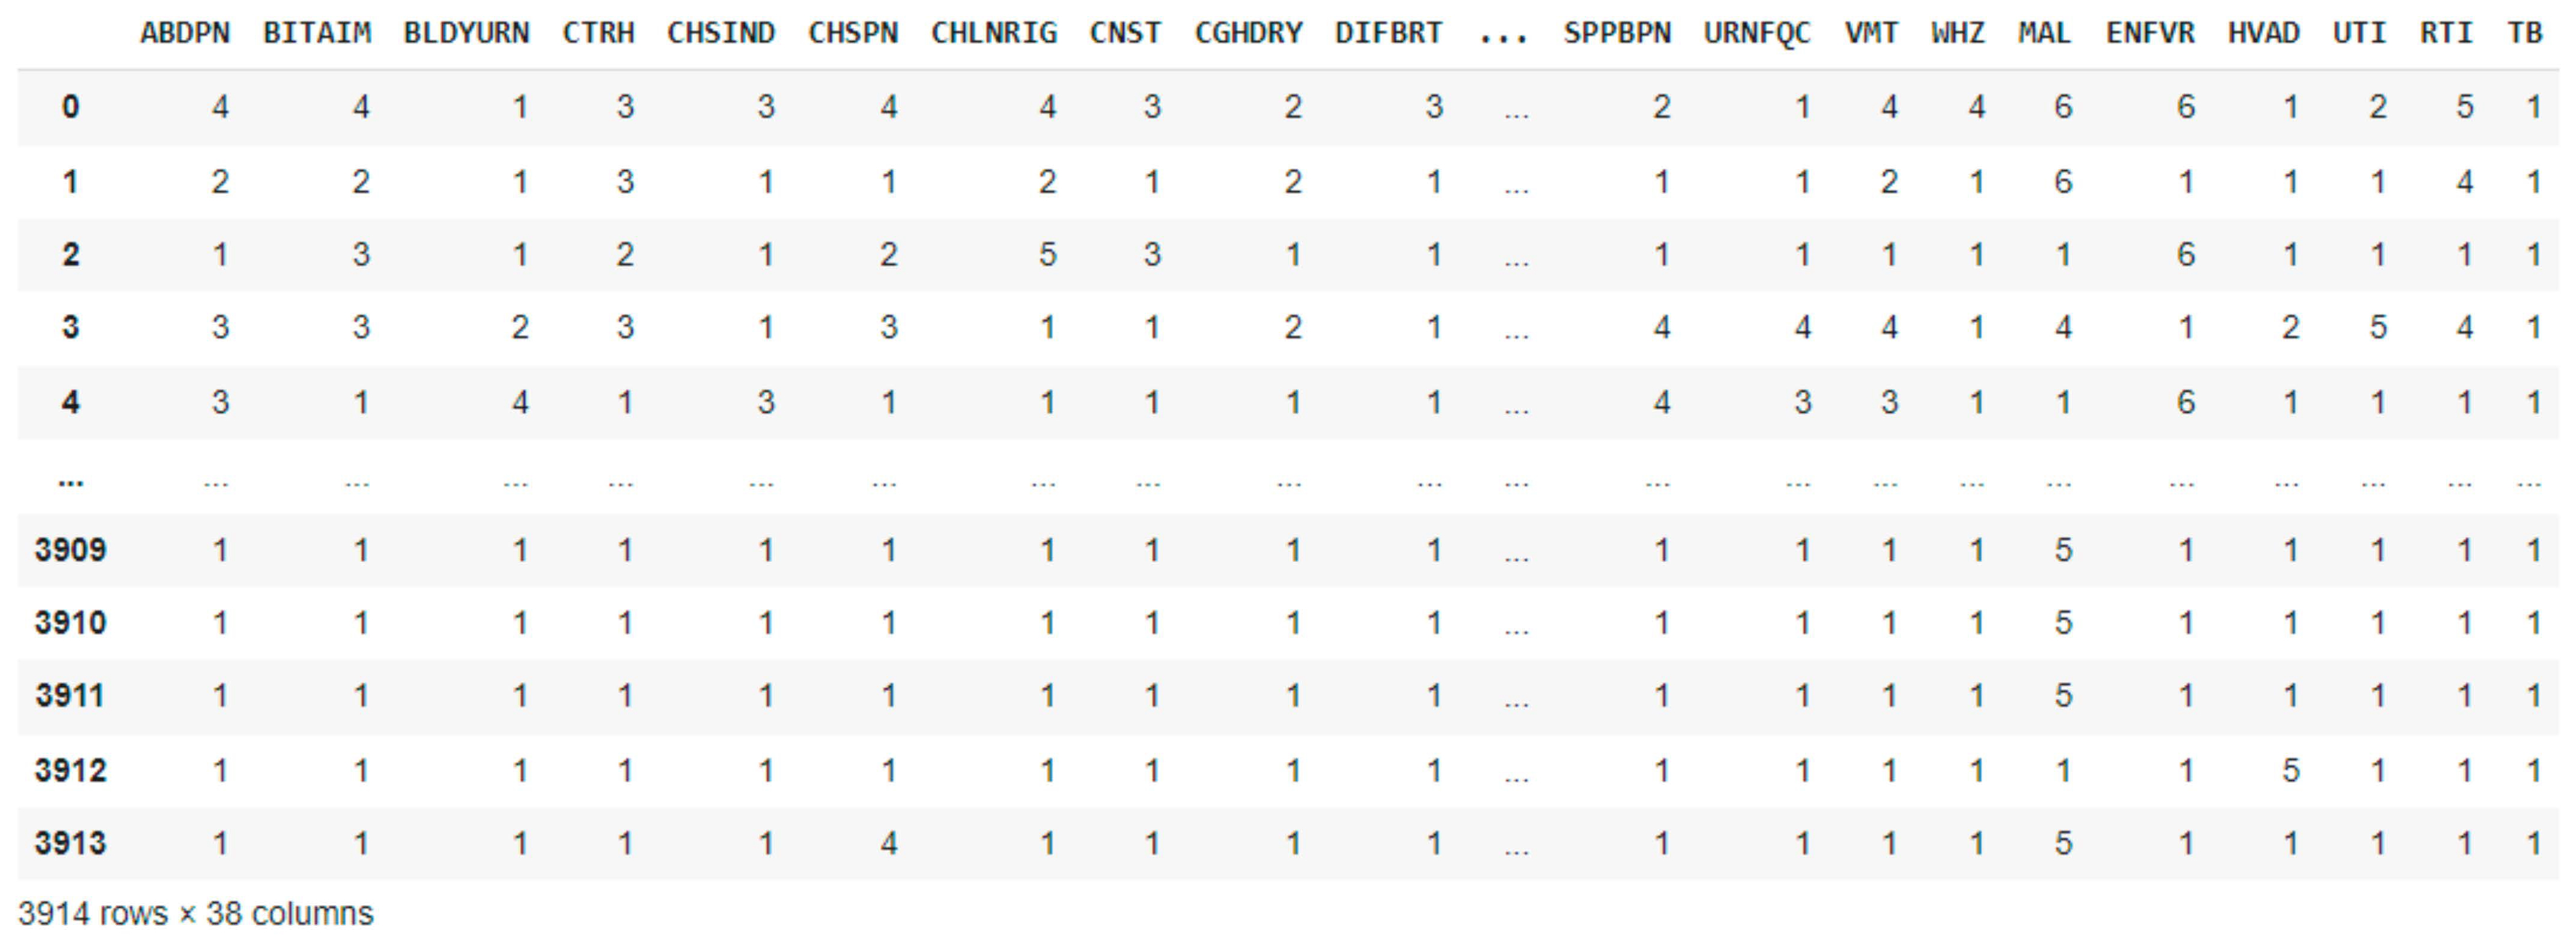
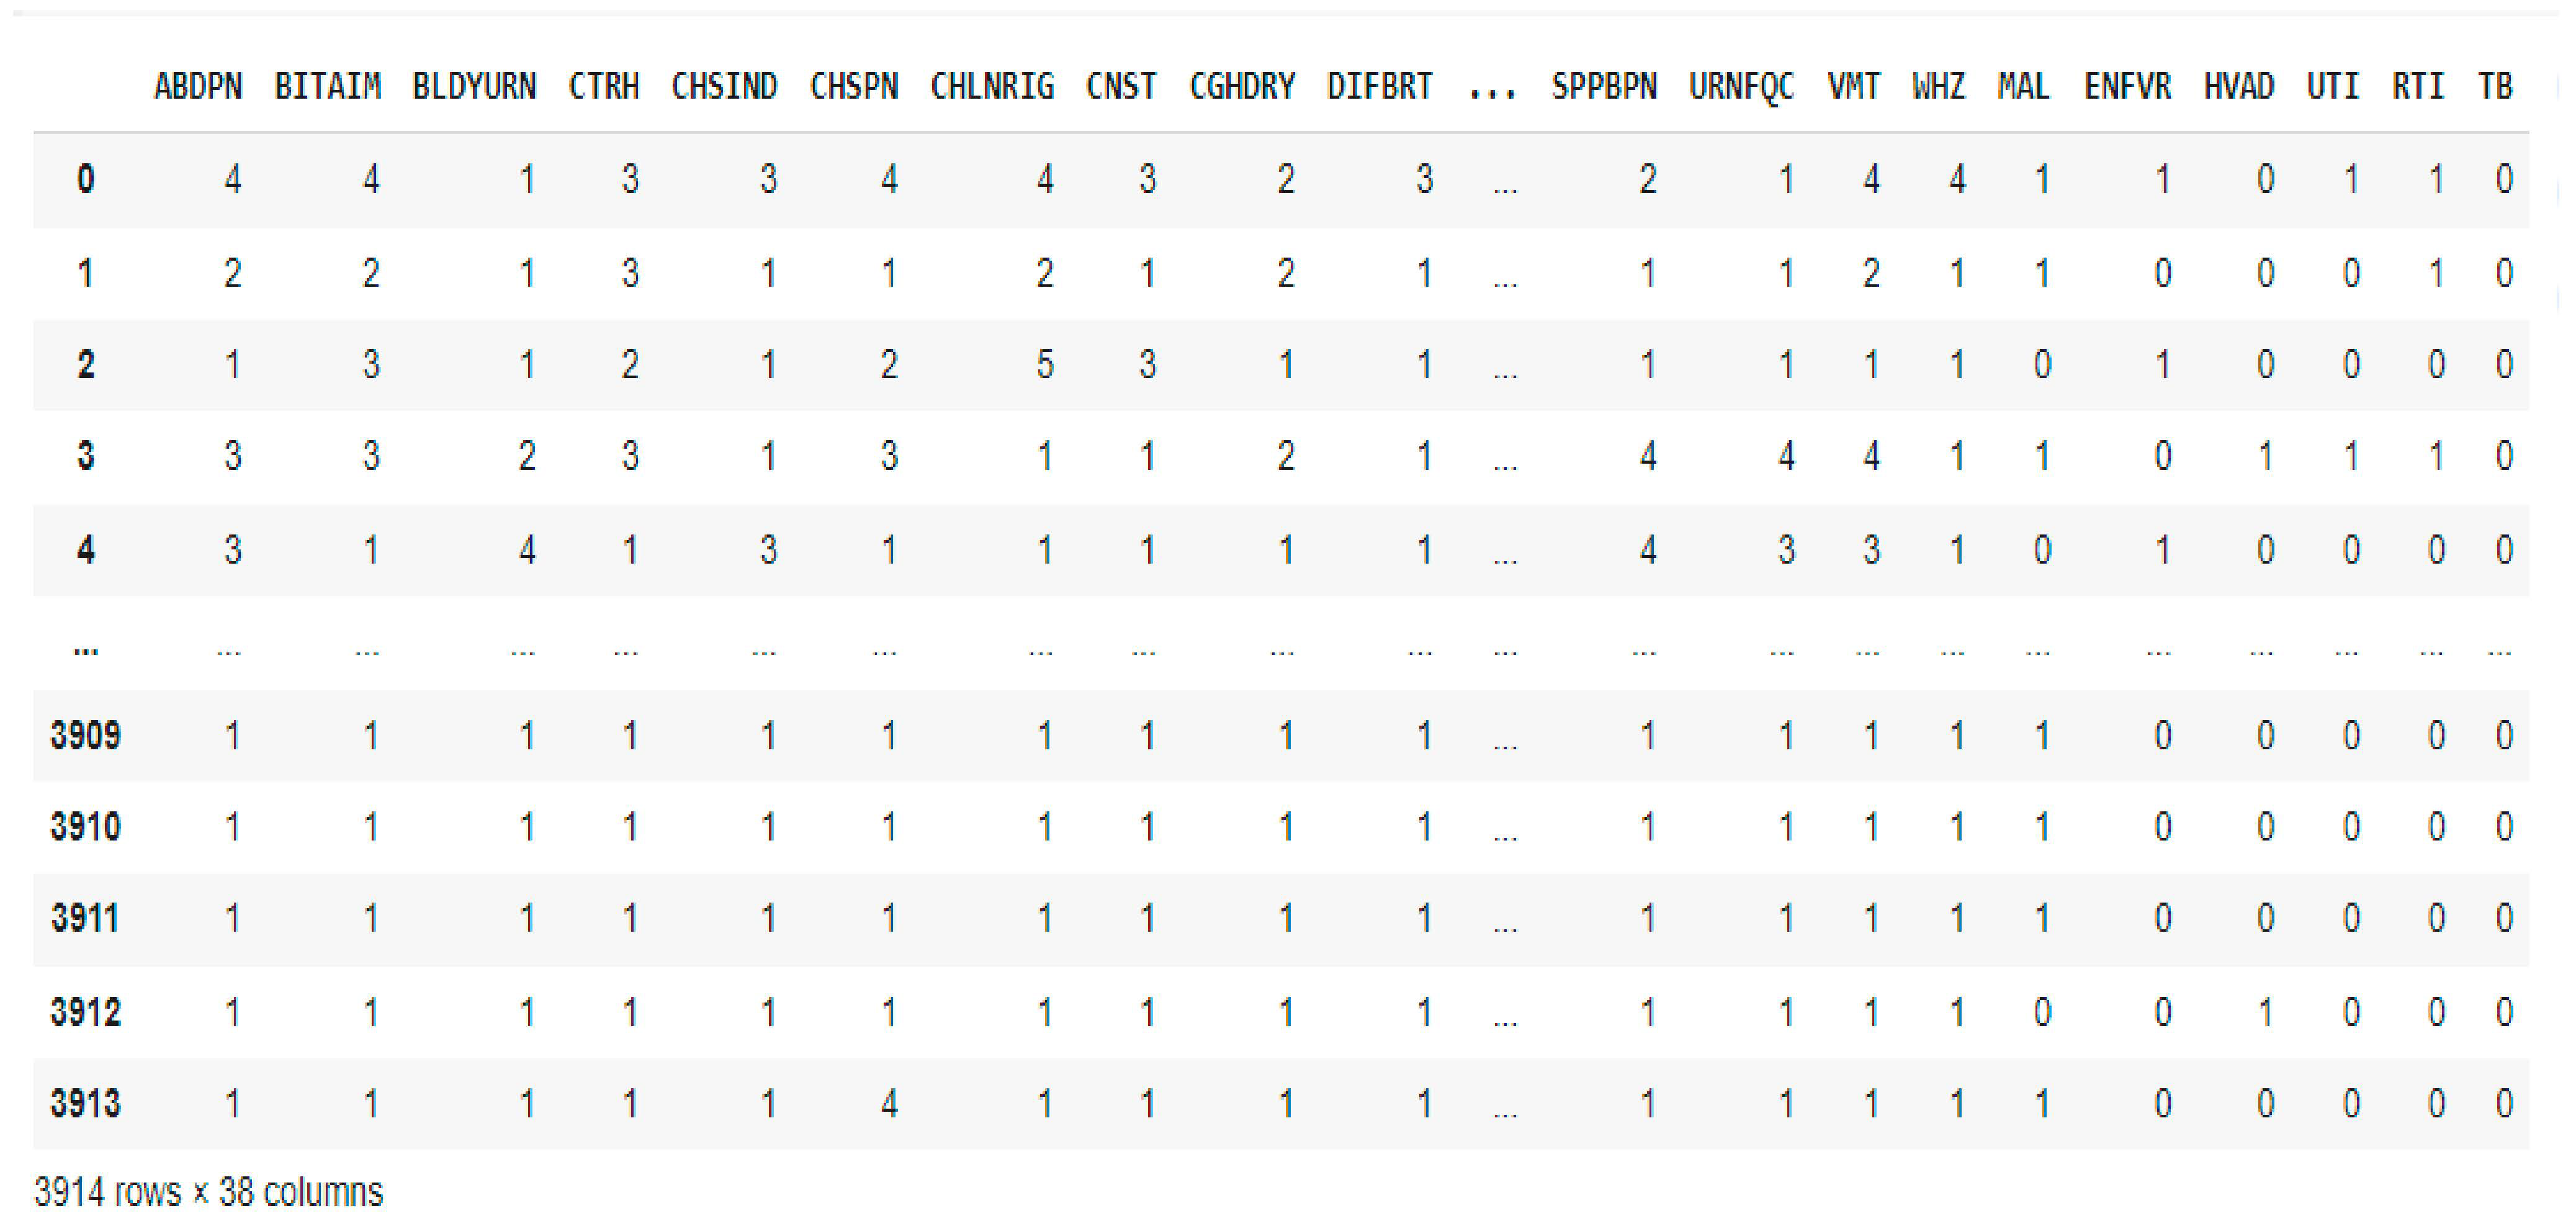
2.2. Dataset Description and Preprocessing

The dataset used in the work was obtained from a study funded by the New Frontiers in Research Fund (NFRF) to develop a system to help frontline health workers make early differential diagnoses of tropical diseases. The dataset contains 4870 patient records comprising patient symptoms, risk factors, demographic data, suspected diagnoses, further investigation, and confirmed diagnoses [23].
Following the data collection, data exploration was required to examine the size, features, types of data, and structure of the dataset. According to the dataset, 225 patient records were obtained during the dry season, 40 during harmattan, and 4605 during the rainy season. There were 2175 male and 2695 female patients in the dataset, according to the descriptive statistics in Table 1. The data exploration also displayed the number of patients who were nursing mothers and those who were pregnant in the first, second, and third trimesters, along with the corresponding months. Table 2 presents the number of suspected and confirmed diagnoses as well as the symptoms in the dataset.
A five-point rating system was used to describe the patient’s symptoms (1 = absent; 2 = mild; 3 = moderate; 4 = severe; 5 = very severe), and a six-point rating system was used to describe the diagnoses (1 = absent; 2 = very low; 3 = low; 4 = moderate; 5 = high; 6 = very high). The sample patient dataset is shown in Figure 2. Because patients under the age of five (5) were unable to adequately express certain symptoms and the data collection tool did not account for certain symptoms of patients under the age of five, records of these patients were eliminated from the data during the preprocessing stage. Additionally, the doctor’s suspected diagnosis columns were eliminated from the dataset, leaving only the symptoms and verified diagnoses following additional research. Additionally, the symptoms of the hemorrhagic fevers (dengue, yellow, and Lassa fever) were eliminated because these illnesses were not taken into account in this study. As shown in Figure 3, the dataset was cleaned up and reduced to 3914 records with 32 symptoms and 8 confirmed diagnoses, while Table 3 lists the symptoms and diseases along with their abbreviations.
To further reduce the number of confirmed diseases to the six diseases that were included in the scope of this study, upper respiratory tract infections (URTI), lower respiratory tract infections (LRTI), as well as upper urinary tract infections (UPUTI), and lower urinary tract infections (LWUTI), were combined into respiratory tract infections (RTI) and urinary tract infections (UTI), respectively. Max operation, also known as max function, was applied to combine the two sets of severity levels into a single value [24]. The max operation combines severity scales, emphasizing the highest severity recorded across multiple metrics, by taking the maximum value from two or more related measurements. Given that U and L are the severity levels of upper and lower urinary tract infections respectively, the max operation M ( U , L ) can be expressed as follows:
M ( U , L ) = m a x ( U , L )
where U represents the first input to the max operation while L represents the second input to the max operation, the max function returns the maximum value between U and L . This process guarantees that the worst-case scenario from the two columns is appropriately represented by the combined severity level. The max operation is a dependable method of combining severity scales when the objective is to identify the most severe medical condition. Figure 4 displays the dataset following the application of the max operation.
Figure 5 illustrates the results of the disease severity. Absent (1) was mapped to binary 0 using custom mapping, and very-low to very-severe (2 to 6) were mapped to binary 1. A lambda function mapping the disease severity to 0 and 1 was employed, with c o n d i t i o n   0   i f   x = = 1   e l s e   1 . By mapping the diseases, the dataset was prepared, and the disease severity was represented in a straightforward, binary format for efficient training of machine learning models.
Three machine learning algorithms were taken into consideration in this study: MLP, RF, XGBoost, and Random Forest, which was the model with the highest performance and was used to develop the diagnostic system. Using multiple decision trees, the RF model leveraged the power of ensemble learning to provide reliable diagnoses. Each tree independently predicts a possible diagnosis based on the input symptoms, and the final diagnosis is determined by aggregating these predictions through majority voting. This ensemble approach enhances the diagnostic performance of febrile diseases. RF uses patient data, including symptoms and diseases, to construct numerous decision trees on identical nodes. Then, it combines the decisions from these decision trees to arrive at a solution that is the average of all the decision trees [25]. XGBoost was chosen due to its advanced gradient boosting implementation and ensemble technique, which makes it a portable, flexible, and efficient option for disease diagnosis. XGBoost builds classification trees sequentially, training the subsequent tree with the residuals from the previous tree. As its basis, XGBoost uses gradient-boosted decision trees and regularization techniques to enhance model generalization. In a stepwise fashion, weak learners are progressively added to the group, with each member concentrating on fixing the mistakes of the others. It minimizes a predetermined loss function during training using the gradient descent optimization technique [25,26]. MLP was also chosen due to its capacity to model intricate relationships, learn from high-dimensional datasets, and handle various data types, making it a useful tool for disease diagnosis [27]. When paired with the right interpretability and training strategies, MLPs can provide accurate and useful information for medical diagnosis. This feedforward artificial neural network consists of three layers: an output layer, one or more hidden layers, and an input layer. The dataset consisted of 3914 patient records after preprocessing, distributed as follows: malaria (2719), typhoid fever (1157), HIV/AIDS (424), urinary tract infection (907), respiratory tract infection (1094), and tuberculosis (381). The class distribution of the training and testing sets, obtained by allocating 80% of the dataset for training and 20% for testing, is shown in Table 4.
To optimize the model’s performance, hyperparameter tuning was carried out using Grid search cross-validation (GridSearchCV) with 5-fold cross-validation (CV = 5). For cross-validation, the training data were split into five equal subsets or folds. The model was trained on four folds, and testing was done on the last fold. This procedure was carried out five times, each time using a different fold as the test set to ensure that every observation in the training data was used for validation. Cross-validation is a helpful method for assessing the model’s resilience and reducing the possibility of overfitting. Finding the best hyperparameters is also aided by averaging the performance across all folds. The hyperparameters for each model were adjusted using GridSearchCV to determine which combination produced the best results. Hyperparameter tuning is used to optimize the model’s performance by controlling how it learns from the data, and it has a significant impact on the model’s performance and efficiency. For Random Forest (RF), max_depth, which specifies the maximum depth of each tree, was set to [None, 10, 20], and n_estimators, which determines the number of trees in the forest, was tested with values [100, 200, 300]. For the Multi-Layer Perceptron (MLP), three hyperparameters were adjusted: the activation function (which transforms input data in the neural network) with [“relu”, “tanh”, “logistic”), the regularization term alpha with [0.0001, 0.001, 0.01], and the hidden_layer_sizes (number of neurons in each layer) with [(100,), (50, 50), (50, 25, 10)]. Finally, for XGBoost, [100, 200, 300] and [3, 5, 7] were used to adjust the n_estimators and max_depth parameters. The pseudocode given in Algorithm 1 describes the detailed process used in this study, which includes the data split, severity combination, hyperparameters, model selection, interpretability with LIME, and ChatGPT integration for improved explanation.
Algorithm 1. Explainable AI-based febrile disease diagnosis with hyperparameter tuning pseudocode
BEGIN
# Step 1: Dataset Preparation
Load dataset D = {X, Y}
Preprocess dataset
Split dataset into training and testing:
D_train, D_test ← split(D, 0.8)

# Step 2: Severity Combination Using Max Operation
FOR each patient record DO
M(U, L) ← max(U, L) # Combine severity scores

# Step 3: Hyperparameter Tuning and Model Training
# Random Forest (RF)
RF_params = {max_depth: [None, 10, 20], n_estimators: [100, 200, 300]}
best_RF ← GridSearchCV(RandomForest, RF_params, D_train)

# Multi-layer Perceptron (MLP)
MLP_params = {activation: [“relu”, “tanh”, “logistic”],
alpha: [0.0001, 0.001, 0.01],
hidden_layer_sizes: [(100,), (50, 50), (50, 25, 10)]}
best_MLP ← GridSearchCV(MLP, MLP_params, D_train)

# XGBoost
XGB_params = {n_estimators: [100, 200, 300], max_depth: [3, 5, 7]}
best_XGB ← GridSearchCV(XGBoost, XGB_params, D_train)

# Step 4: Model Selection
Evaluate best_RF, best_MLP, best_XGB on D_test
Select best_model ← model with highest F1 score

# Step 5: Interpretability with LIME
FOR each prediction in D_test DO
explanation ← LIME(best_model, X_test)

# Step 6: ChatGPT Integration for Enhanced Explanation
FOR each patient DO
P ← {best_model_prediction, explanation}
response ← ChatGPT(P)

# Step 7: Deployment
FOR each patient DO
Display {best_model_prediction, M(U, L), explanation, response}
END

2.3. Integration of Explainable AI

Interpretability was provided locally through the use of LIME, which approximated the model’s behavior around a specific diagnosis using a simpler model. LIME helps healthcare professionals understand why a model diagnoses a disease for a specific patient based on their symptoms, which is very useful when diagnosing diseases where patient cases may differ significantly from one another. This localized explanation aids in identifying any irregularities or errors in the diagnosis, thereby increasing the diagnostic model’s performance and dependability. LIME offers versatility and broad applicability in a range of diagnostic scenarios because it is model-agnostic and works with a variety of machine-learning models [28,29]. ChatGPT uses its powerful natural language processing capabilities to analyze and understand complex medical data, significantly improving the diagnosis of febrile diseases [30,31].
To enhance the interpretability of our diagnostic model, we integrated LIME and ChatGPT, at different stages of the diagnostic process. First, LIME was applied to the machine learning models (Random Forest, XGBoost, and MLP) to generate local explanations for individual diagnoses. After a model predicted the probability of a patient having a particular febrile disease, LIME approximated the model’s behavior by creating a simpler, interpretable surrogate model. This was achieved by slightly changing the input symptoms, monitoring how the ML model’s prediction varied, and determining which symptoms had the most influence on the final diagnosis. This step ensured that healthcare professionals could understand the reasoning behind each prediction and verify its reliability. Next, ChatGPT was integrated as a secondary explainability layer to provide more comprehensive, natural-language explanations. The output probabilities and predicted disease labels from the ML models and the LIME explanations were structured into a prompt, which was fed into ChatGPT. ChatGPT then generated a human-understandable explanation by combining domain knowledge with the ML model’s results. The structured interaction between ML models and ChatGPT ensured that healthcare workers received transparent explanations, improving trust in the system. By integrating LIME for feature attribution and ChatGPT for contextualized explanations, our approach ensures that the diagnostic process is interpretable, ultimately aiding in better clinical decision-making.

2.4. System Implementation

The proposed system is a cloud-based, AI-driven diagnostic tool designed to assist healthcare workers in diagnosing febrile diseases using ML models and an XAI technique. It integrates multiple components to ensure efficient data processing, model execution, and user interaction. The system workflow includes the following:
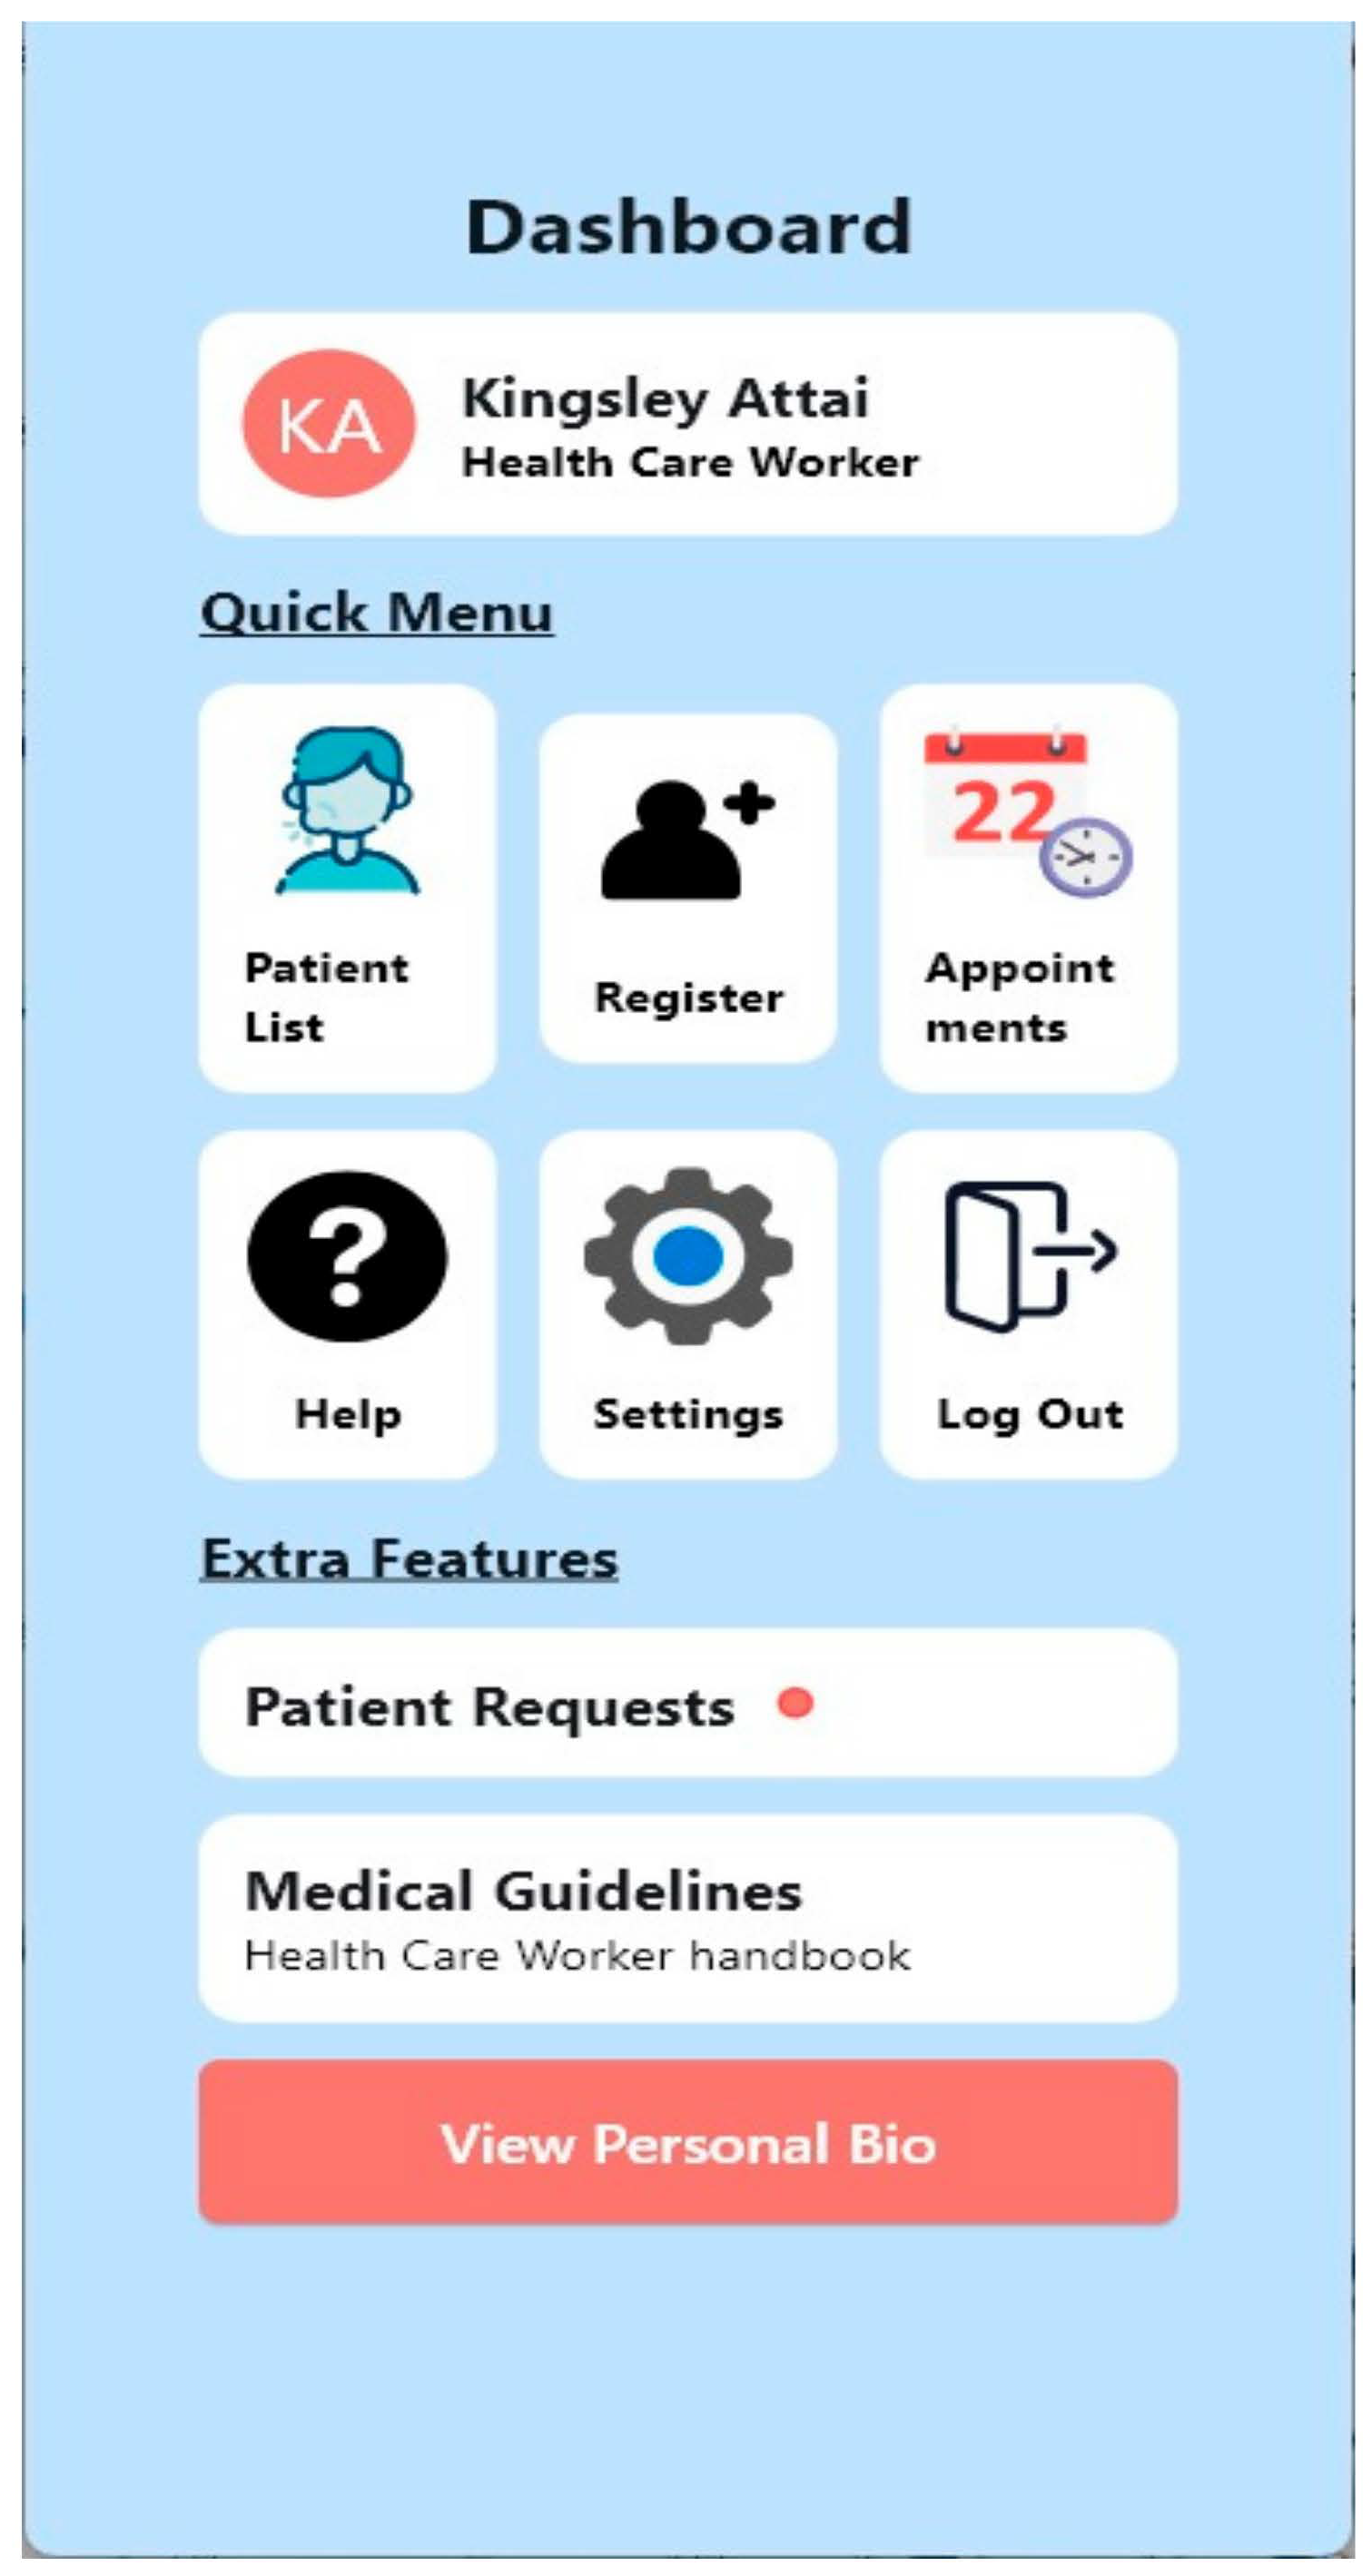
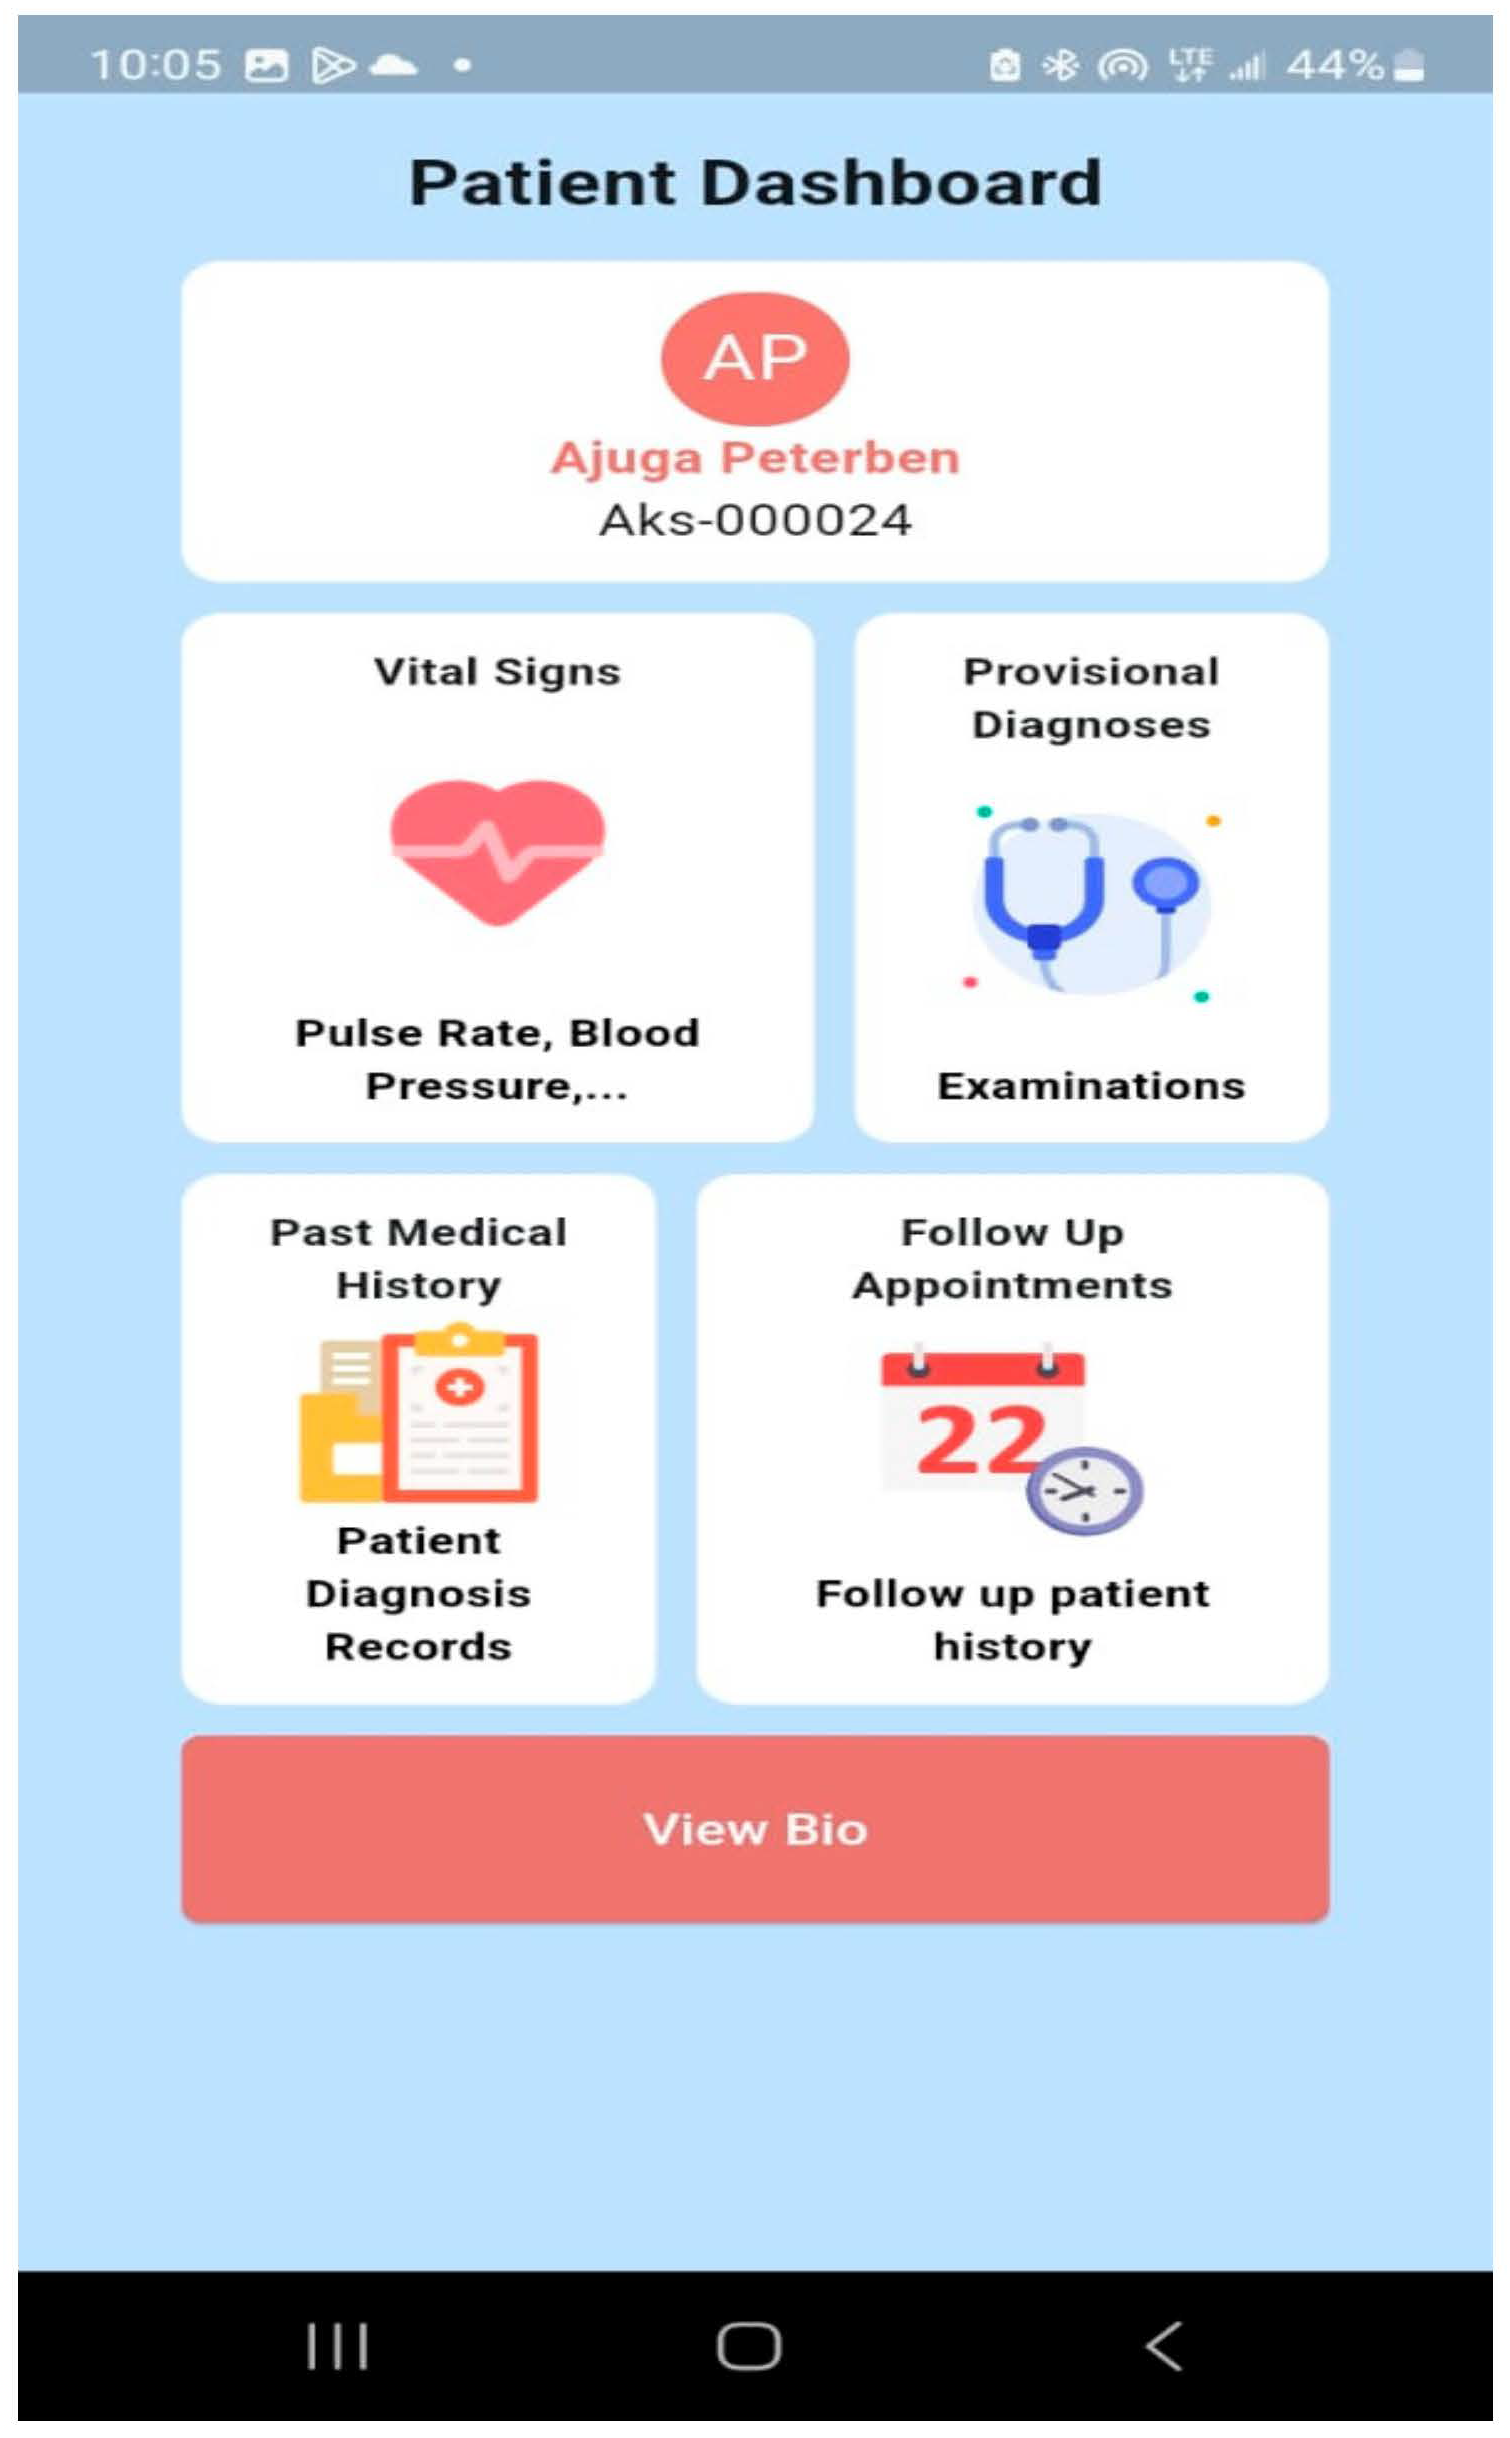
  • User Interaction: Healthcare professionals and patients access the system through a mobile interface, designed using Figma and developed with Flet-0.24.0 for an intuitive user experience;
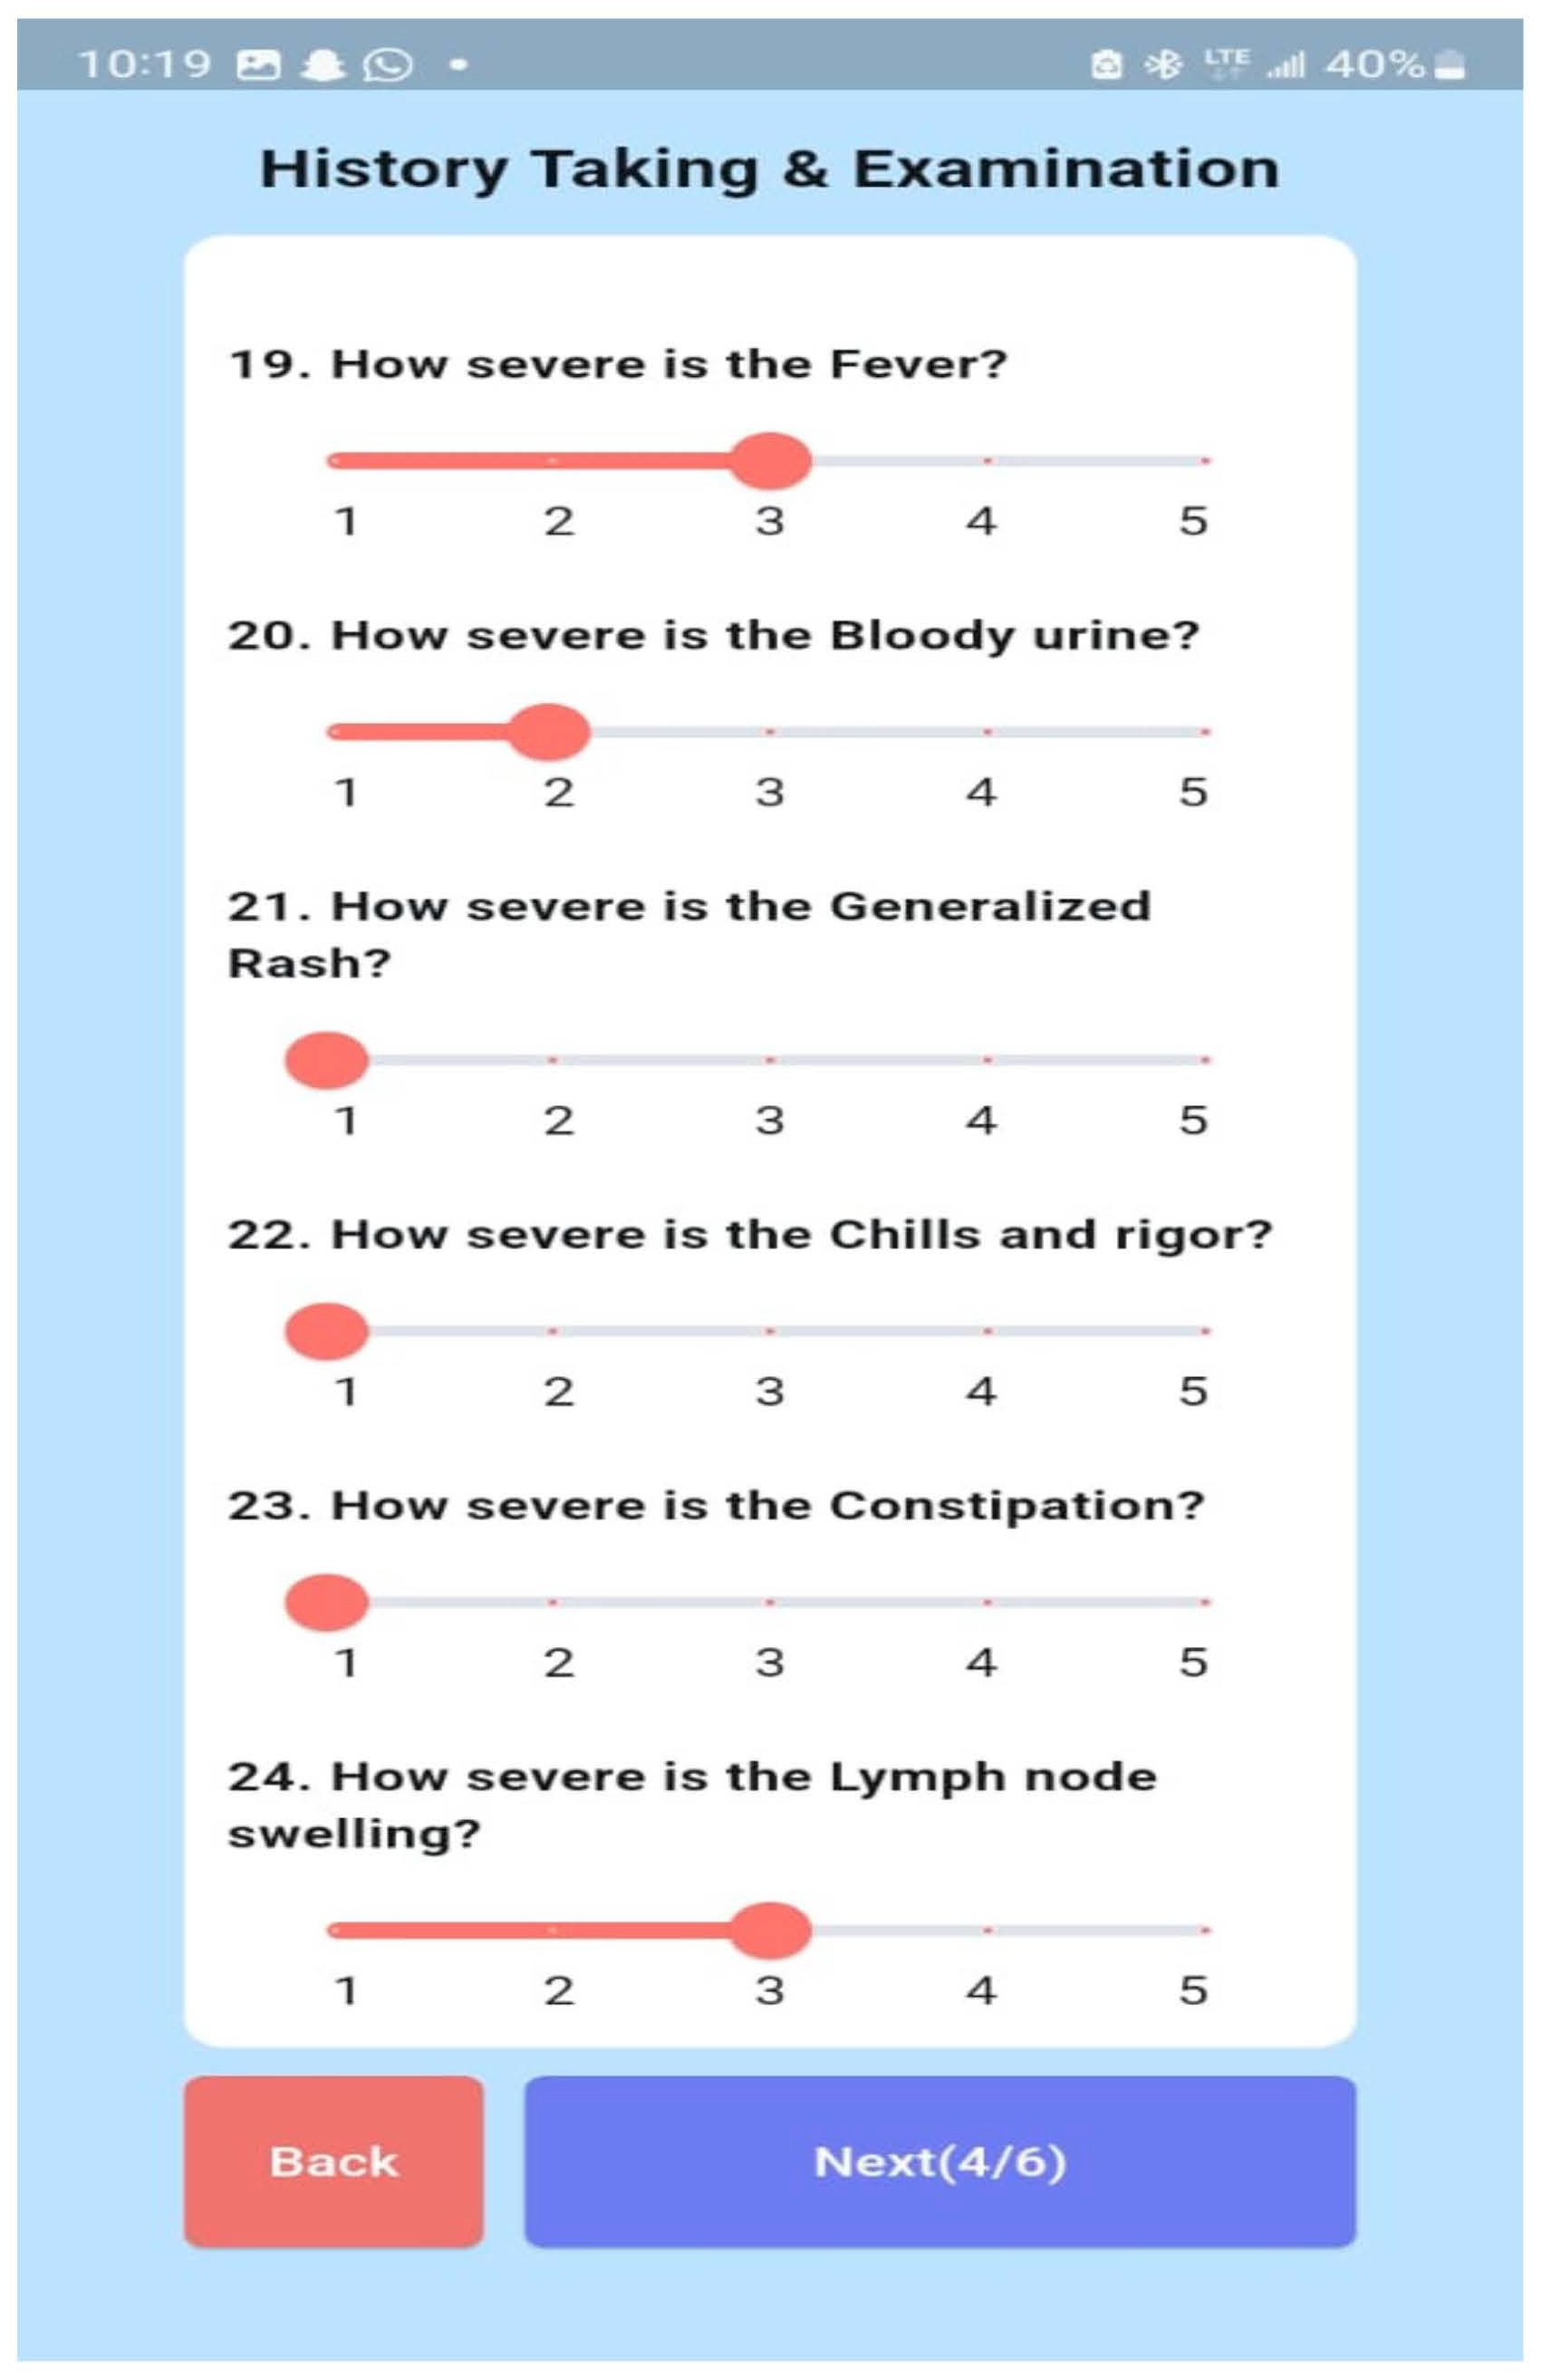
  • Data Input and Processing: Users provide symptom details, which are processed by the backend, built using PythonAnywhere for online hosting.
  • Machine Learning Diagnosis: The input symptoms are fed into a trained ML model (Random Forest), and this model generates disease predictions based on the given symptoms;
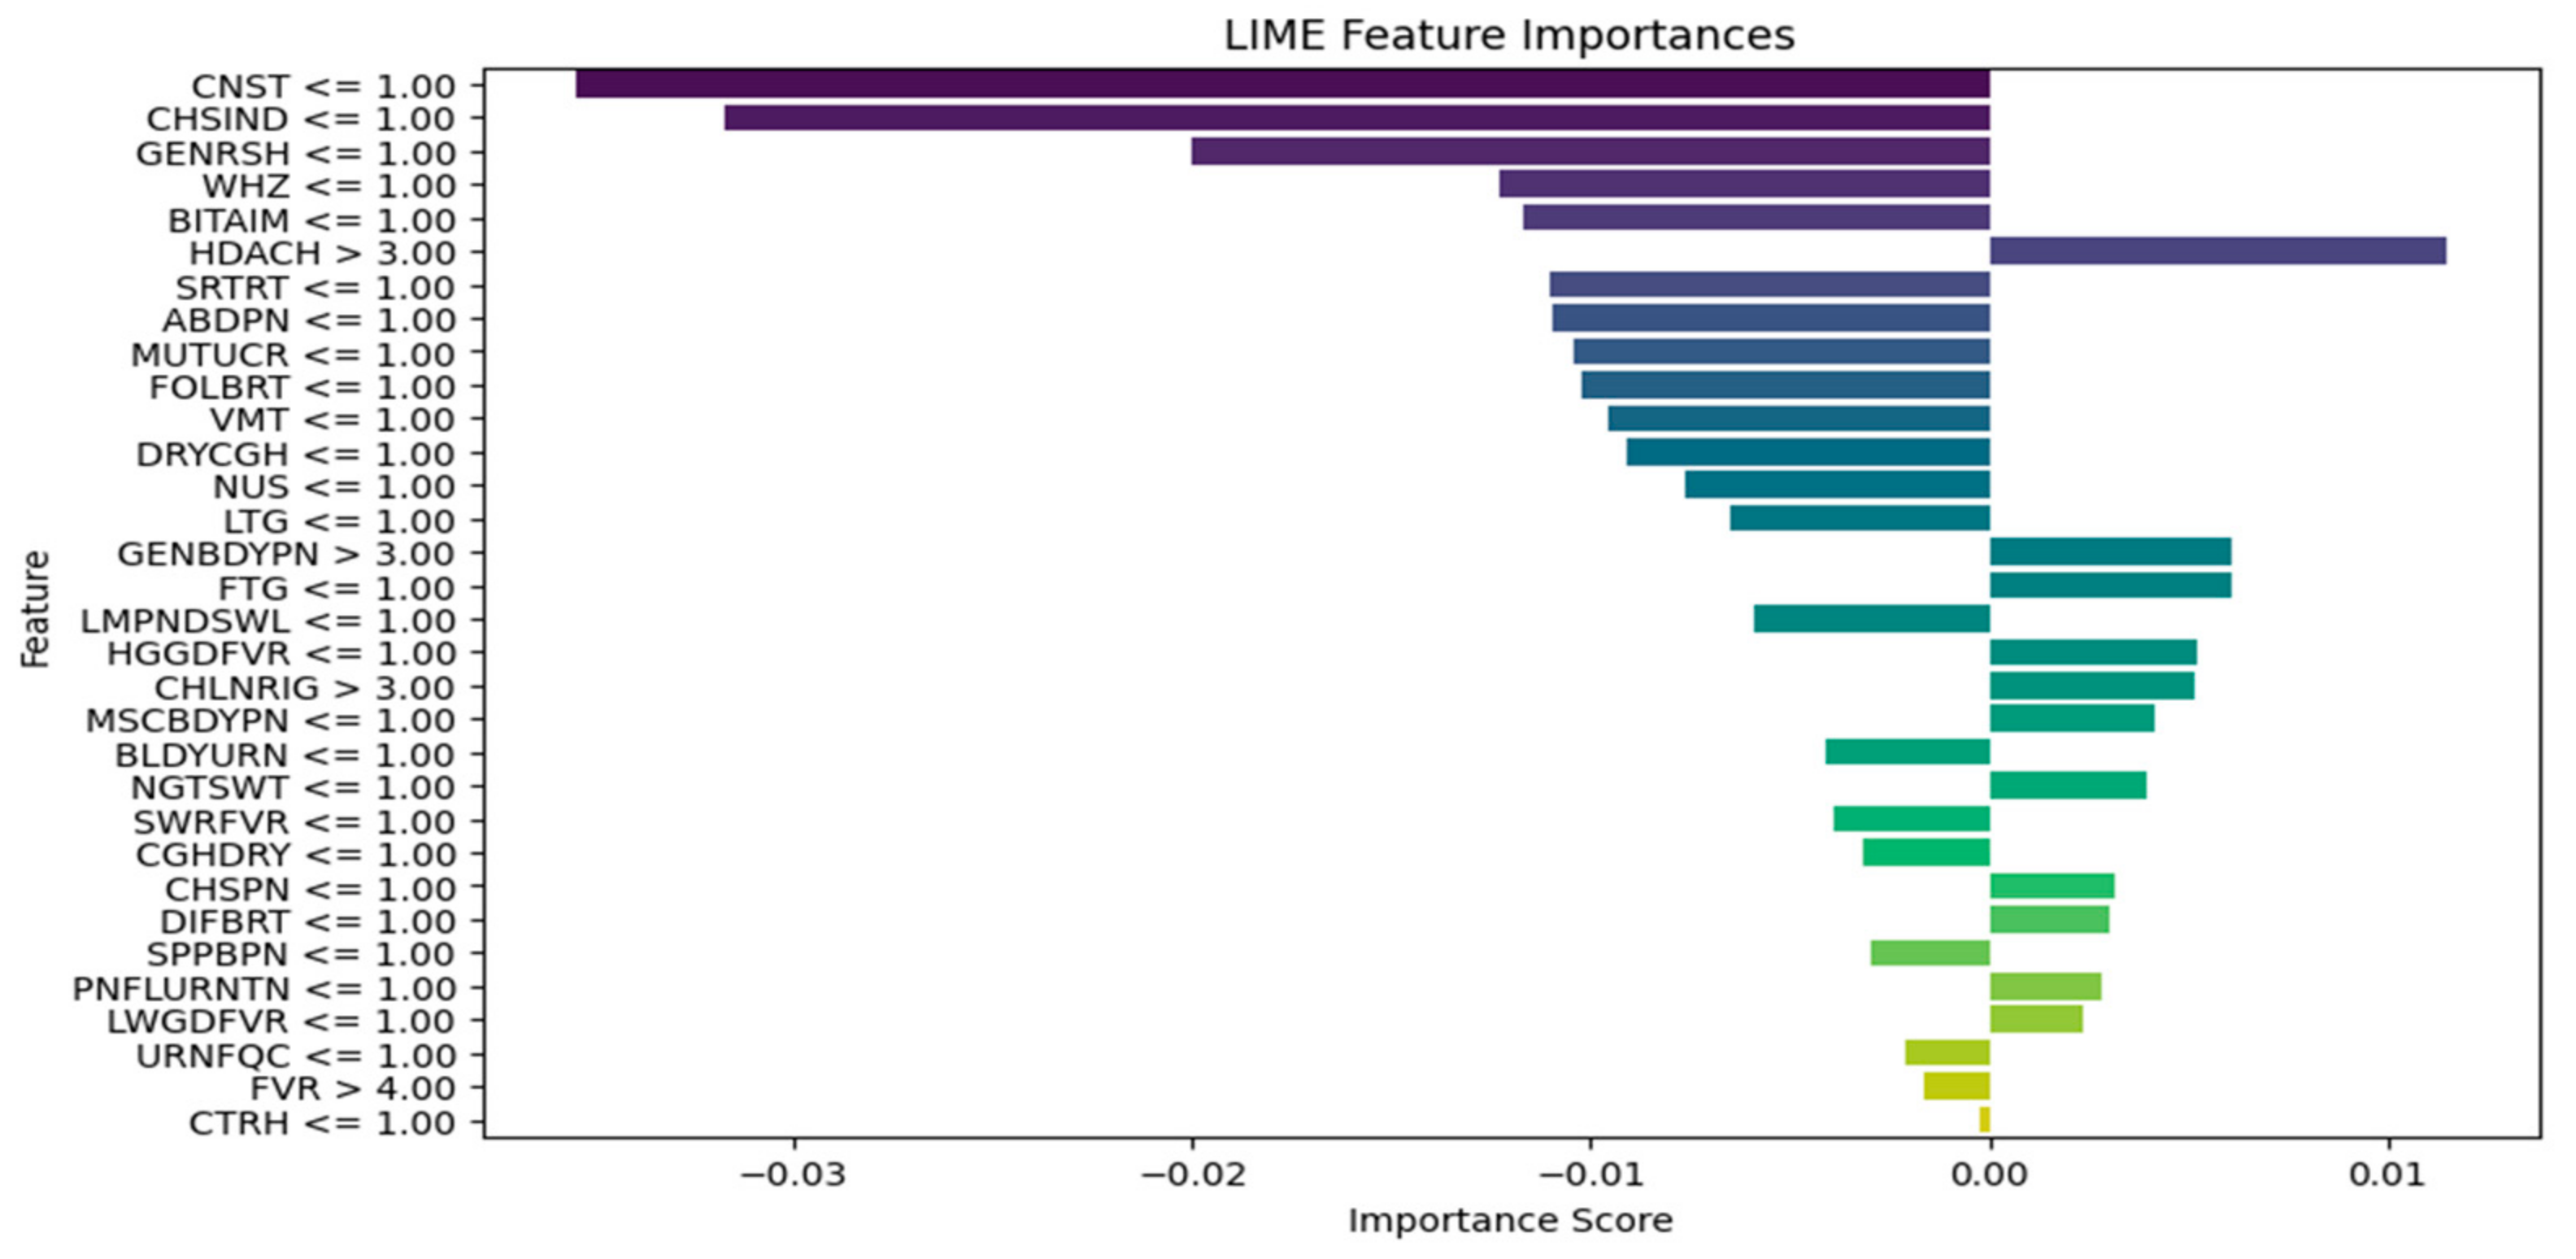
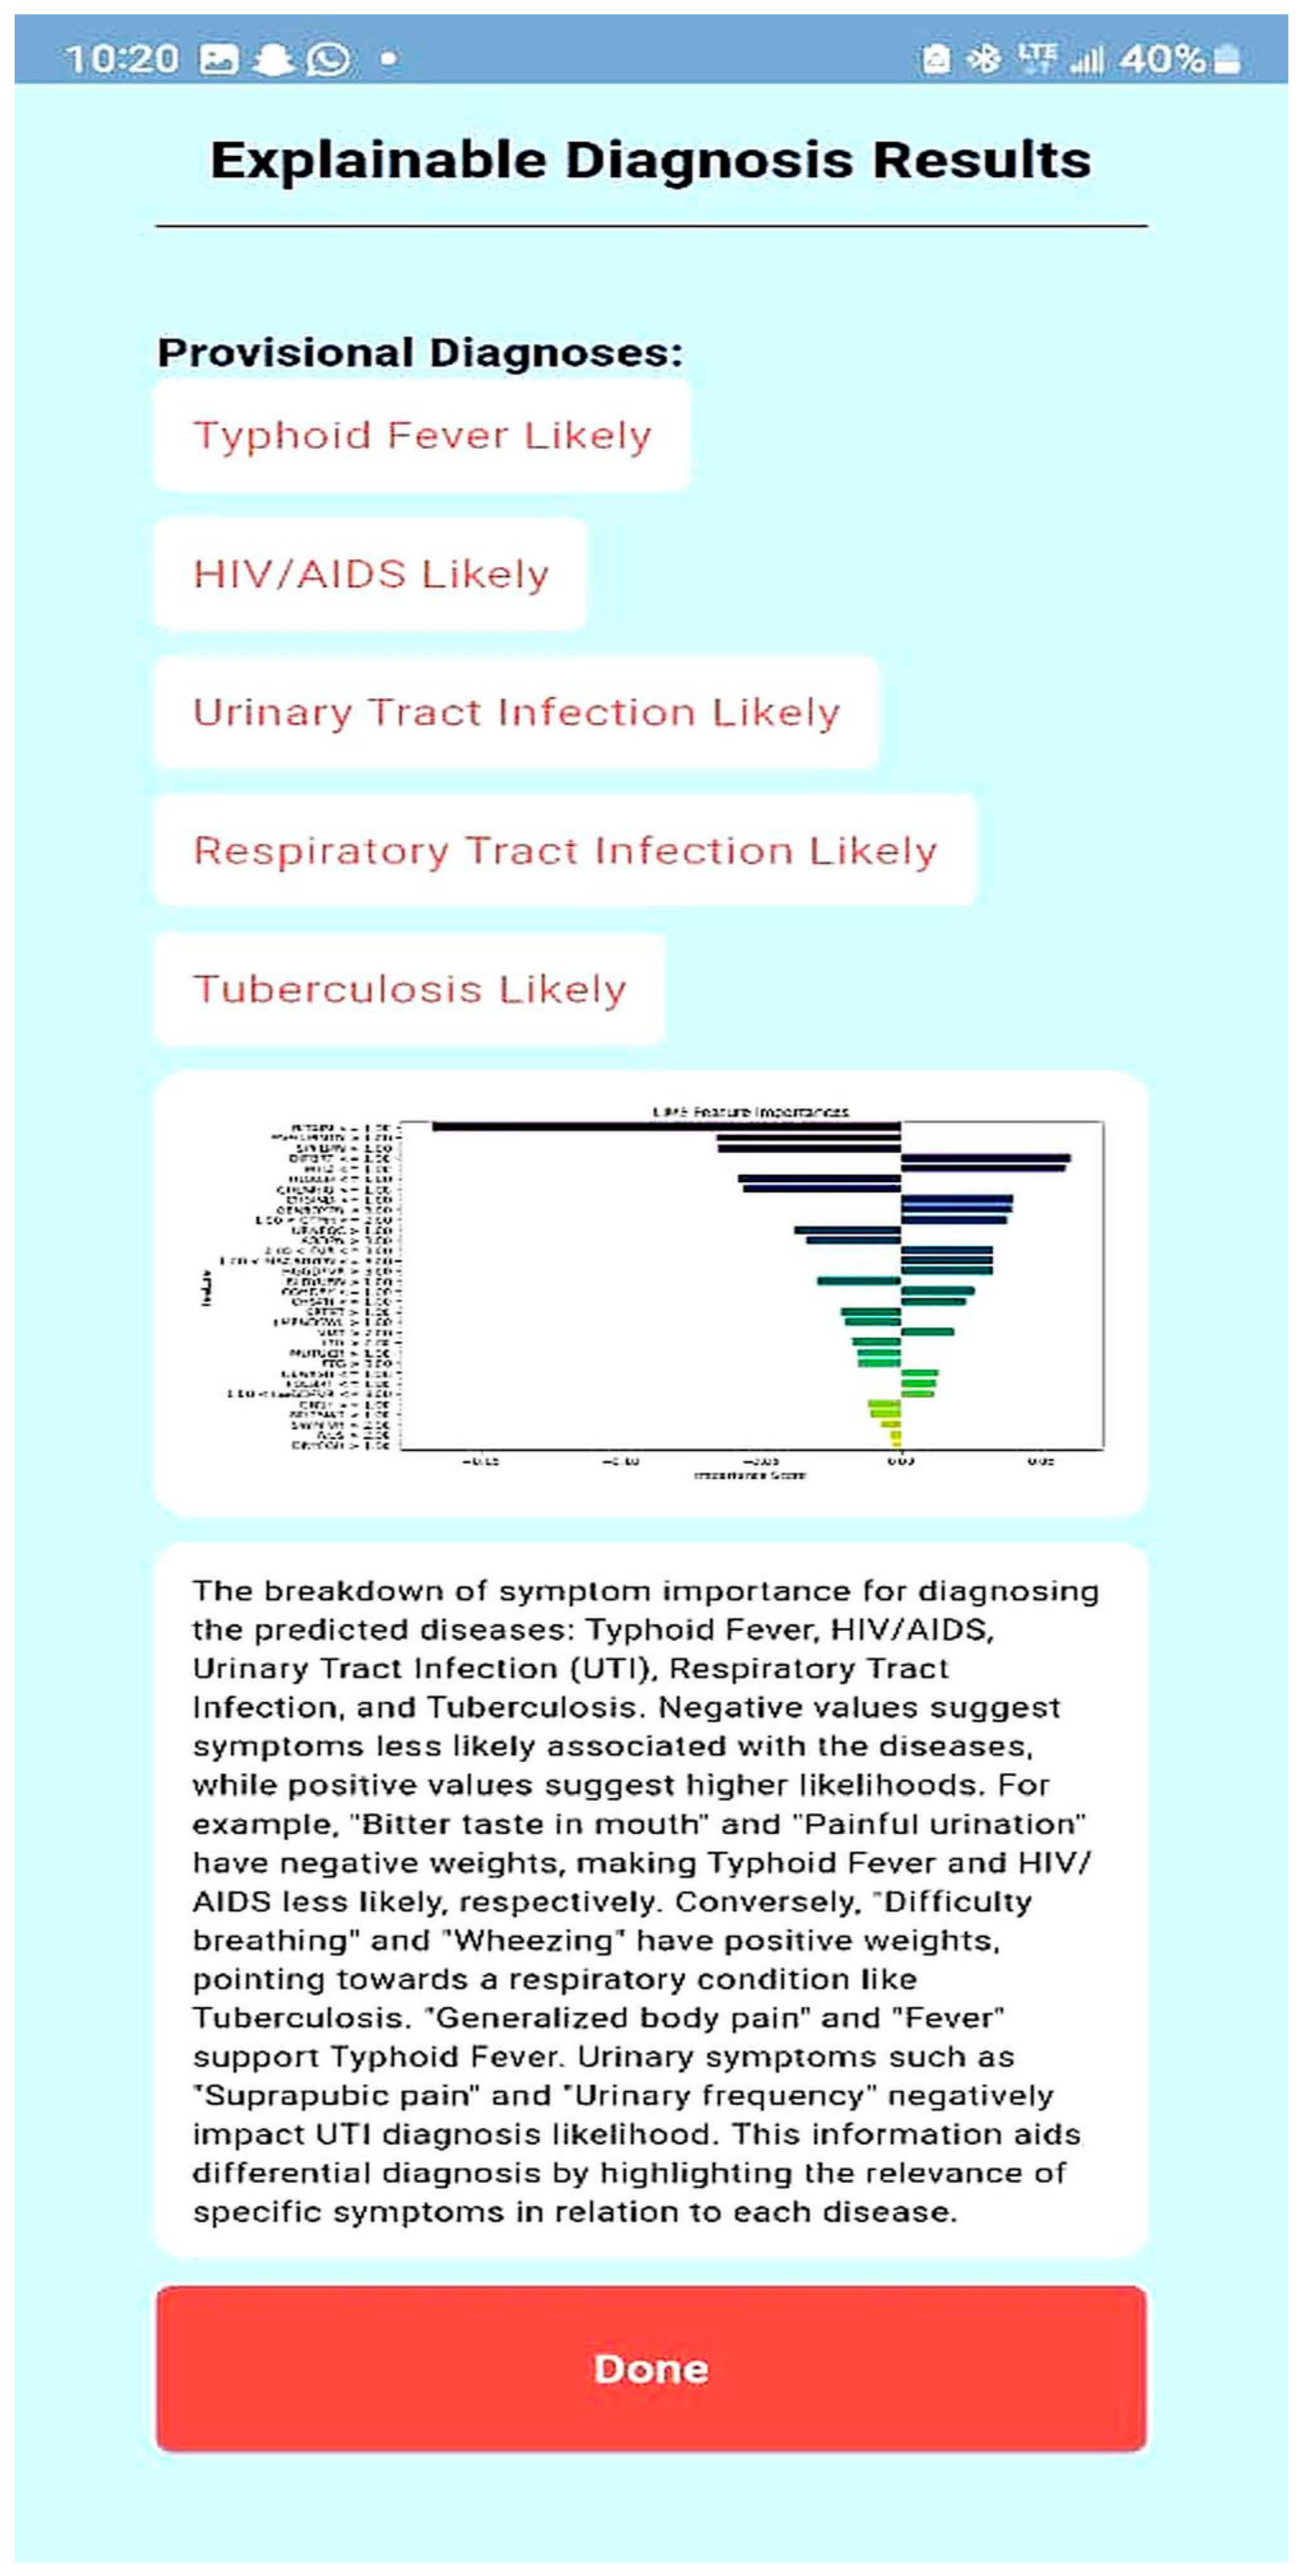
  • Explainability Layer: To enhance interpretability, LIME-0.2.0.1 is applied to highlight the most important symptoms influencing the diagnosis. Additionally, ChatGPT processes the model’s outputs to generate human-readable explanations;
  • Database Management: Patient records and diagnostic results are securely stored and retrieved using MySQL-9.0, which ensures compliance with medical data privacy regulations;
  • Result Presentation: The final diagnosis, along with explanations from LIME and ChatGPT, is presented to the user in a clear and understandable format, aiding clinical decision-making.

2.5. Model Performance Metrics

The performance of the ML models was assessed using recall, precision, and F1 score because they ensure that the model’s diagnoses are reliable. The equations below are standard performance metrics in machine learning [32].
Recall: Recall quantifies the ratio of accurately anticipated positive observations to all observations made during the actual class. It shows how well positive samples can be identified by the model. In medical screenings, for example, where missing a positive case (false negative) can be crucial, recall is crucial when the cost of false negatives is high.
R e c a l l = T r u e   P o s i t i v e s T r u e   P o s i t i v e s   +   F a l s e   N e g a t i v e s
Precision: This metric quantifies the ratio of accurately predicted positive observations to all predicted positive observations. It shows how accurate positive forecasts are. When the cost of false positives is high, accuracy is essential. For instance, a false positive in a medical diagnosis could result in needless treatments.
P r e c i s i o n = T r u e   P o s i t i v e s T r u e   P o s i t i v e s   +   F a l s e   P o s i t i v e s
F1 Score: The F1 score is calculated by taking the harmonic mean of recall and precision. It offers a balance between recall and precision, which is especially helpful for unbalanced datasets. When precision and recall must be balanced, the F1 score can be helpful, particularly when there is an unequal distribution of classes.
F 1   S c o r e = 2 P r e c i s i o n     R e c a l l r e c i s i o n   +   R e c a l l

3. Results and Discussion

Three algorithms were used in this study to model the complex relationships in the dataset. RF was selected as the better-performing model of the three models and has practical suitability for deployment, considering its balance between precision and recall. While MLP displayed limitations in recall and F1 scores for specific diseases, suggesting possible limitations in handling imbalanced data within the dataset, XGBoost showed promising results but required intensive tuning. Across all models, the Random Forest algorithm emerged as the best-performing model and achieved the highest diagnostic performance across most diseases with an F1 score of 88% for malaria, 60% for enteric fever, 51% for HIV and AIDS, 72% for urinary tract infection, 72% for respiratory tract infection, and 60% for tuberculosis, followed by XGBoost (87%, 60%, 48%, 70%, 72%, and 65%) and the MLP (85%, 51%, 46%, 70%, 69%, 64%) model, as presented in Table 5 and Figure 6.
All three models demonstrated strong performance for malaria, with Random Forest (F1 score = 0.88) achieving the highest performance, followed closely by XGBoost (0.87) and MLP (0.85). This trend suggests that malaria symptoms are well-represented in the dataset, making them easier to classify. Additionally, RF’s high recall (0.91) indicates its effectiveness in detecting malaria cases, likely due to its ability to handle structured tabular data efficiently.
The classification of enteric fever was relatively weak, especially in recall, with MLP (0.42), XGBoost (0.56), and RF (0.53). This suggests a class imbalance issue, where enteric fever cases are underrepresented in the dataset. However, RF achieved the highest precision (0.69), likely due to its ensemble learning strategy, which improves robustness when dealing with imbalanced data. HIV/AIDS classification was notably challenging, with MLP (F1 score = 0.46), XGBoost (0.48), and RF (0.51). The low recall scores (ranging from 0.34 to 0.40) indicate that many true HIV/AIDS cases were misclassified. This can be attributed to the non-specific nature of early HIV symptoms, which overlap with other febrile illnesses. However, RF achieved the highest precision (0.75), suggesting it was more conservative in its classifications. UTI classification showed moderate performance, with MLP (F1 score = 0.70), XGBoost (0.70), and RF (0.72). RF outperformed the others in precision (0.80), meaning it had fewer false positives, while MLP had better recall (0.65), suggesting it detected more actual UTI cases. This trade-off highlights the importance of balancing precision and recall based on the diagnostic goal (e.g., reducing false negatives vs. false positives). RTI classification was relatively stable, with XGBoost and RF achieving identical F1 scores (0.72), while MLP had a slightly lower F1 score (0.69). The recall values (0.63 to 0.68) indicate that all models were moderately effective at detecting RTI cases, possibly due to their distinct symptom profiles. For tuberculosis, the models showed significant variation. MLP achieved the lowest F1 score (0.64), while XGBoost and RF performed slightly better (0.65 and 0.60, respectively). Notably, RF had the lowest recall (0.49), indicating that many TB cases were misclassified as other diseases. This could be due to TB’s long incubation period and overlapping symptoms with RTI, making it harder for the model to distinguish.
The Random Forest model was chosen due to its balance between interpretability and diagnostic performance. While RF models operate based on simple logical rules, their ensemble nature helps improve prediction reliability. To mitigate potential inconsistencies in rule-based decision-making, we incorporated explainability techniques such as LIME to ensure transparency and provide insights into model decisions.
Regarding model performance, while the F1 score for malaria was 88%, some diseases such as HIV/AIDS (51%) and tuberculosis (60%) had lower scores. It is important to note that AI-based diagnostic tools are not meant to replace professional diagnoses but rather to assist healthcare practitioners by highlighting potential conditions based on patient symptoms. Lower F1 scores in certain categories suggest that additional improvements such as data augmentation and hyperparameter optimization could further enhance performance. Future work will focus on refining the model to improve predictive stability and increase the reliability of diagnoses for diseases with lower performance metrics.
A Model Interpretability Framework (MIF) was incorporated into the diagnostic system to address the vital need for explainability and transparency in disease diagnosis. The LIME framework and LLM (ChatGPT) were selected for their ability to provide intuitive visual and textual explanations of model decisions. By applying LIME to the Random Forest model, it became clear how particular symptoms influenced the diagnostic predictions. By applying LIME to the test subset and locally approximating the model with an interpretable substitute model, this study was able to identify important symptoms that influenced the model’s diagnoses for particular instances, as illustrated in Figure 7, Figure 8 and Figure 9 for the three models. How much each symptom contributed to the final diagnosis is shown by the length of the bars. The diagnosis is moved into the positive class, which is the presence of disease, by the symptoms on the right, and into the negative class, which is the absence of a disease, by the symptoms on the left. This makes it possible for medical professionals to comprehend the logic behind predictions, and the system promotes adoption, builds trust, and facilitates well-informed decision-making.
Complex diagnostic outputs were translated into natural language using ChatGPT via its API. Since the development environment was based on Python, the OpenAI API was integrated into the system to automate this process. As shown in Table 6, a structured prompt was generated using the LIME model’s diagnosed illnesses, patient symptoms, and their contributions to the diagnosis. This prompt was formatted as a JSON object and sent to the ChatGPT API for processing. The API returned an explanation of the diagnosis, highlighting key contributing symptoms and their respective influences.
The minimum requirements for this basic app are an Android OS version 4.0 or higher, 4 GB of RAM (at least 2 GB), 8 GB of ROM, a portrait display layout, and an Internet connection. The healthcare worker can create an account following a successful installation. Once an account has been created, the system administrator must confirm the healthcare worker’s information before sending the password to the healthcare worker’s email address so they can log in. The healthcare professional logs into the system using their email address and password. The healthcare worker is shown a user-friendly dashboard in Figure 10 following a successful system login. The dashboard allows the healthcare professional to register new patients and view the list of registered patients. The healthcare professional can either automatically navigate to the patient’s dashboard (Figure 11) following a successful patient registration or search for and click on the patient’s name from the patient list. The patient’s dashboard allows them to view their past medical history as well as take and examine their history (Figure 12). As seen in Figure 13, the mobile app provides provisional diagnoses following a successful history taking and examination. It lists all probable diseases the patient may have along with a LIME chart and a ChatGPT explanation of the diagnoses.
This tool could aid healthcare workers in diagnosing febrile diseases while addressing the critical need for transparency in AI-driven healthcare solutions. With a good balance between interpretability and diagnostic performance, Random Forest was reliable and easily interpreted, showing a strong performance in diagnosing most of the febrile diseases, and its moderate complexity makes it easier to integrate into mobile apps for real-time diagnoses. RF’s interpretability through LIME makes it easier for healthcare professionals to understand the diagnoses and validate the system, crucial for real-world application in healthcare settings. The ChatGPT model explanation is suitable for use in our system because of its context-based explanations of complex results. ChatGPT, as a large language model, can generate relevant and contextually appropriate diagnostic information based on patient symptoms. In this case, the diagnoses for diseases like typhoid fever, HIV/AIDS, urinary tract infection, respiratory tract infection, and tuberculosis are aligned with known medical presentations. The combination of symptom-specific input and advanced language processing allows the ChatGPT model to interpret complex medical data, making it valuable for diagnosis in resource-scarce settings.
Our study, which diagnoses six febrile diseases, improves efficiency by integrating multiple disease predictions into one workflow, reducing the need for separate models for each disease. This is in contrast to previous studies that focus on diagnosing only malaria [33,34], typhoid fever [35], or malaria and typhoid [36,37,38]. By simplifying differential diagnosis, this multi-disease capability can improve clinical decision-making, especially in settings with limited resources where multiple infections are common. The lack of explainability in traditional models limits their use in clinical settings because they produce black-box predictions. Through the integration of LIME-based interpretability, our model will enable clinicians to visualize the significance of symptoms in the diagnosis process and be more receptive because of the increased transparency, which fosters trust. Although ML models have been effectively used in previous research to diagnose febrile illnesses, none of these studies have used XAI and LLMs to produce understandable explanations. Our system offers textual insights into disease predictions by combining Random Forest, LIME, and ChatGPT with ML.

4. Conclusions

This study successfully developed a prototype of a data-driven and explainable diagnostic model for febrile diseases, integrating machine learning algorithms with an Explainable AI technique and a Large Language Model. The model demonstrated good predictive performance, with Random Forest achieving the highest diagnostic performance and interpretability. By incorporating LIME for feature attribution and ChatGPT for textual explanations, the system will enhance clinical decision-making and increase user trust among healthcare providers. The prototype system was designed to be scalable and adaptable, making it particularly relevant for resource-limited settings where access to expert medical diagnosis is constrained. The model’s potential mobile deployment will offer frontline healthcare workers a tool for rapid disease screening and decision support, especially in rural and underserved communities. By simulating expert reasoning, the system aims to assist and not replace medical professionals in making timely, evidence-based diagnoses. To ensure practical implementation, several steps are recommended:
  • Pilot testing in clinical environments—A real-world evaluation is necessary to assess the model’s usability, effectiveness, and integration within existing healthcare workflows;
  • Dataset expansion—Including more diverse populations, particularly pediatric patients under five years old, and incorporating additional febrile diseases such as hemorrhagic fevers will enhance generalizability;
  • Handling imbalanced data—Diseases like tuberculosis and HIV/AIDS had fewer records in the dataset, affecting model performance. Future iterations should explore data augmentation or ensemble techniques to address this limitation;
  • Continuous model updates—The system should be retrained periodically with new patient data to reflect emerging disease trends and improve diagnostic accuracy over time;
  • Mobile and cloud deployment—Deploying the model via mobile health (mHealth) apps will facilitate accessibility, particularly in low-resource regions where medical infrastructure is limited.
Despite its strengths, the study acknowledges key limitations. The prototype has not yet been deployed, and its real-world effectiveness has yet to be validated. Additionally, while LIME and ChatGPT enhanced interpretability, further refinements are needed to reduce biases and improve the clarity of model explanations. Long-term validation in clinical settings will be essential to establish its reliability and usability. This study highlights the transformative potential of combining ML, XAI, and LLMs to address the diagnostic challenges of febrile diseases, particularly in Low- and Middle-Income Countries. By emphasizing transparency, scalability, and real-world applicability, the system represents a step forward in AI-assisted healthcare. Future work should focus on bridging the gap between research and real-world deployment, ensuring that the model can be effectively integrated into clinical practice to improve global health outcomes.

Author Contributions

Conceptualization, F.-M.U., C.A. and K.F.A.; methodology, K.F.A., C.A. and F.-M.U.; validation, F.-M.U., K.F.A. and C.A.; formal analysis, K.F.A.; data curation, K.F.A.; writing—original draft preparation, K.F.A., C.A. and F.-M.U.; writing—review and editing, K.F.A., C.A. and F.-M.U. supervision, F.-M.U. and C.A.; project administration, F.-M.U. funding acquisition, F.-M.U. All authors have read and agreed to the published version of the manuscript.

Funding

This research was funded by the New Frontier Research Fund, grant number NFRFE-2019-01365 between April 2020 and March 2024.

Institutional Review Board Statement

Not applicable.

Informed Consent Statement

Not applicable.

Data Availability Statement

The data used in this study are publicly available at https://doi.org/10.5281/zenodo.13756418.

Conflicts of Interest

The authors declare no conflicts of interest.

References

  1. Premaratna, R. Dealing with acute febrile illness in the resource-poor tropics. Trop. Med. Surg. 2013, 1, 101. [Google Scholar] [CrossRef]
  2. Butcher, L. Prognosis? Misdiagnosis! The High Price of Getting It Wrong. Manag. Care 2019, 28, 32–36. [Google Scholar] [PubMed]
  3. Attai, K.; Amannejad, Y.; Vahdat Pour, M.; Obot, O.; Uzoka, F.M. A systematic review of applications of machine learning and other soft computing techniques for the diagnosis of tropical diseases. Trop. Med. Infect. Dis. 2022, 7, 398. [Google Scholar] [CrossRef] [PubMed]
  4. Bagam, N. Applications of Machine Learning in Healthcare Data Analysis. Int. J. Sci. Res. Comput. Sci. Eng. Inf. Technol. 2020, 6, 373–386. [Google Scholar] [CrossRef]
  5. Naveed, M.A. Transforming healthcare through artificial intelligence and machine learning. Pak. J. Health Sci. 2023, 4, 1. [Google Scholar] [CrossRef]
  6. Kupusinac, A.; Doroslovački, R. An Overview of the Algorithmic Diagnostics Methodology: A Big Data Approach. In Proceedings of the 2018 Zooming Innovation in Consumer Technologies Conference (ZINC), Novi Sad, Serbia, 30–31 May 2018; pp. 104–105. [Google Scholar] [CrossRef]
  7. Wu, W.; Zhou, H. Data-driven diagnosis of cervical cancer with support vector machine-based approaches. IEEE Access 2017, 5, 25189–25195. [Google Scholar] [CrossRef]
  8. Gupta, D.; Kose, U.; Le Nguyen, B.; Bhattacharyya, S. Artificial Intelligence for Data-Driven Medical Diagnosis; De Gruyter: Berlin, Germany, 2021. [Google Scholar] [CrossRef]
  9. Jiang, S.; Wang, T.; Zhang, K.H. Data-driven decision-making for precision diagnosis of digestive diseases. Biomed. Eng. Online 2023, 22, 87. [Google Scholar]
  10. Arif, M.S.; Mukheimer, A.; Asif, D. Enhancing the Early Detection of Chronic Kidney Disease: A Robust Machine Learning Model. Big Data Cogn. Comput. 2023, 7, 144. [Google Scholar] [CrossRef]
  11. Asif, D.; Bibi, M.; Arif, M.S.; Mukheimer, A. Enhancing Heart Disease Prediction through Ensemble Learning Techniques with Hyperparameter Optimization. Algorithms 2023, 16, 308. [Google Scholar] [CrossRef]
  12. Hu, J.; Perer, A.; Wang, F. Data-Driven Analytics for Personalized Healthcare. In Healthcare Information Management Systems: Cases, Strategies, and Solutions; Springer: Berlin, Germany, 2016; pp. 529–554. [Google Scholar] [CrossRef]
  13. Melnykova, N.; Shakhovska, N.; Gregus, M.; Melnykov, V.; Zakharchuk, M.; Vovk, O. Data-driven analytics for personalized medical decision-making. Mathematics 2020, 8, 1211. [Google Scholar] [CrossRef]
  14. Mendhe, D.; Dogra, A.; Nair, D.S.; Punitha, S.; Preetha, D.S.; Babu, G.T. AI-Enabled Data-Driven Approaches for Personalized Medicine and Healthcare Analytics. In Proceedings of the 2024 Ninth International Conference on Science Technology Engineering and Mathematics (ICONSTEM), Chennai, India, 4–5 April 2024; pp. 1–5. [Google Scholar] [CrossRef]
  15. Ivanović, M.; Autexier, S.; Kokkonidis, M. AI Approaches in Processing and Using Data in Personalized Medicine. In Proceedings of the Symposium on Advances in Databases and Information Systems, Turin, Italy, 5–8 September 2022. [Google Scholar] [CrossRef]
  16. Ekanayake, I.U.; Meddage, D.P.; Rathnayake, U.S. A novel approach to explain the black-box nature of machine learning in compressive strength predictions of concrete using Shapley additive explanations (SHAP). Case Stud. Constr. Mater. 2022, 16, e01059. [Google Scholar] [CrossRef]
  17. Kulaklıoğlu, D. Explainable AI: Enhancing Interpretability of Machine Learning Models. Hum.-Comput. Interact. 2024, 8, 91. [Google Scholar] [CrossRef]
  18. Alblooshi, M.; Alhajeri, H.; Almatrooshi, M.; Alaraj, M. Unlocking Transparency in Credit Scoring: Leveraging XGBoost with XAI for Informed Business Decision-Making. In Proceedings of the 2024 International Conference on Artificial Intelligence, Computer, Data Sciences and Applications (ACDSA), Mahe, Seychelles, 1–2 February 2024; pp. 1–6. [Google Scholar] [CrossRef]
  19. Quinn, T.P.; Jacobs, S.; Senadeera, M.; Le, V.; Coghlan, S. The Three Ghosts of Medical AI: Can the Black Box Present Deliver? Artif. Intell. Med. 2020, 124, 102158. [Google Scholar] [CrossRef] [PubMed]
  20. Inukonda, J.; Rajasekhara Reddy Tetala, V.; Hallur, J. Explainable Artificial Intelligence (XAI) in Healthcare: Enhancing Transparency and Trust. Int. J. Multidiscip. Res. 2024, 6, 30010. [Google Scholar] [CrossRef]
  21. Huang, S.; Mamidanna, S.; Jangam, S.; Zhou, Y.; Gilpin, L. Can Large Language Models Explain Themselves? A Study of LLM-Generated Self-Explanations. arXiv 2023, arXiv:2310.11207. [Google Scholar] [CrossRef]
  22. Hsu, C.; Wu, I.; Liu, S. Decoding AI Complexity: SHAP Textual Explanations via LLM for Improved Model Transparency. In Proceedings of the 2024 International Conference on Consumer Electronics—Taiwan (ICCE-Taiwan), Taching, China, 9–11 July 2024; pp. 197–198. [Google Scholar] [CrossRef]
  23. University of Uyo Teaching Hospital; Mount Royal University. NFRF Project Patient Dataset with Febrile Diseases [Data Set]; Zenodo: Meyrin, Switzerland, 2024. [Google Scholar] [CrossRef]
  24. Bellman, R.E.; Zadeh, L.A. Decision-making in a fuzzy environment. Manag. Sci. 1970, 17, B-141. [Google Scholar] [CrossRef]
  25. Murphy, A.; Moore, C. Random Forest (Machine Learning). 2019. Available online: https://radiopaedia.org/articles/67772 (accessed on 23 March 2025). [CrossRef]
  26. Yadav, D.C.; Pal, S. Analysis of Heart Disease Using Parallel and Sequential Ensemble Methods with Feature Selection Techniques. Int. J. Big Data Anal. Healthc. 2021, 6, 40–56. [Google Scholar] [CrossRef]
  27. Yu, H.; Samuels, D.C.; Zhao, Y.; Guo, Y. Architectures and Accuracy of Artificial Neural Network for Disease Classification from Omics Data. BMC Genom. 2019, 20, 167. [Google Scholar] [CrossRef]
  28. Ribeiro, M.; Singh, S.; Guestrin, C. “Why Should I Trust You?”: Explaining the Predictions of Any Classifier. In Proceedings of the 22nd ACM SIGKDD International Conference on Knowledge Discovery and Data Mining, San Francisco, CA, USA, 13–17 August 2016. [Google Scholar] [CrossRef]
  29. Thakkar, P. Drug Classification Using Black-Box Models and Interpretability. Int. J. Res. Appl. Sci. Eng. Technol. 2021, 9, 1518–1529. [Google Scholar] [CrossRef]
  30. Sirriani, J.; Sezgin, E.; Claman, D.M.; Linwood, S. Medical Text Prediction and Suggestion Using Generative Pretrained Transformer Models with Dental Medical Notes. Methods Inf. Med. 2022, 61, 195–200. [Google Scholar] [CrossRef]
  31. Kumar, T.; Kait, R.; Ankita; Rani, S. Possibilities and Pitfalls of Generative Pre-Trained Transformers in Healthcare. In Proceedings of the 2023 International Conference on Advanced Computing & Communication Technologies (ICACCTech), Banur, India, 23–24 December 2023; pp. 37–44. [Google Scholar] [CrossRef]
  32. Erickson, B.J.; Kitamura, F. Magician’s corner: 9. Performance metrics for machine learning models. Radiol. Artif. Intell. 2021, 3, e200126. [Google Scholar] [CrossRef] [PubMed]
  33. Barracloug, P.A.; Were, C.M.; Mwangakala, H.; Fehringer, G.; Ohanya, D.O.; Agola, H.; Nandi, P. Artificial Intelligence System for Malaria Diagnosis. Int. J. Adv. Comput. Sci. Appl. 2024, 15, 100806. [Google Scholar] [CrossRef]
  34. La-Ariandi, H.; Setyanto, A.; Sudarmawan, S. Classification of Malaria Types Using Naïve Bayes Classification. J. Indones. Sos. Teknol. 2024, 5, 2311–2327. [Google Scholar] [CrossRef]
  35. Bhuiyan, M.A.; Rad, S.S.; Johora, F.T.; Islam, A.; Hossain, M.I.; Khan, A.A. Prediction of Typhoid Using Machine Learning and ANN Prior to Clinical Test. In Proceedings of the 2023 International Conference on Computer Communication and Informatics (ICCCI), Coimbatore, India, 23–25 January 2023; IEEE: Piscataway, NJ, USA, 2023; pp. 1–7. [Google Scholar]
  36. Awotunde, J.B.; Imoize, A.L.; Salako, D.P.; Farhaoui, Y. An Enhanced Medical Diagnosis System for Malaria and Typhoid Fever Using Genetic Neuro-Fuzzy System. In Proceedings of the International Conference on Artificial Intelligence and Smart Environment, Errachidia, Morocco, 24–26 November 2022; Springer International Publishing: Cham, Switzerland, 2022; pp. 173–183. [Google Scholar]
  37. Odion, P.O.; Ogbonnia, E.O. Web-Based Diagnosis of Typhoid and Malaria Using Machine Learning. Niger. Def. Acad. J. Mil. Sci. Interdiscip. Stud. 2022, 1, 89–103. [Google Scholar]
  38. Apanisile, T.; Ayeni, J.A. Development of an Extended Medical Diagnostic System for Typhoid and Malaria Fever. Artif. Intell. Adv. 2023, 5, 28–40. [Google Scholar] [CrossRef]
Figure 1. Enhanced diagnostic framework.
Algorithms 18 00190 g001
Figure 2. The sample patient dataset.
Algorithms 18 00190 g002
Figure 3. Pre-processed data.
Algorithms 18 00190 g003
Figure 4. Pre-processed dataset after max operation.
Algorithms 18 00190 g004
Figure 5. Pre-processed dataset after custom mapping.
Algorithms 18 00190 g005
Figure 6. Performance evaluation of the ML models.
Algorithms 18 00190 g006
Figure 7. LIME explanation for the MLP model, illustrating the contribution of different symptoms to the model’s diagnostic decision.
Algorithms 18 00190 g007
Figure 8. LIME explanation for the XGBoost model, highlighting the most influential symptoms in the model’s decision-making process.
Algorithms 18 00190 g008
Figure 9. LIME explanation for the RF model, showing the impact of different symptoms on the model’s diagnostic predictions.
Algorithms 18 00190 g009
Figure 10. Healthcare dashboard.
Algorithms 18 00190 g010
Figure 11. Patient dashboard.
Algorithms 18 00190 g011
Figure 12. History taking and examination.
Algorithms 18 00190 g012
Figure 13. Explainable diagnosis page.
Algorithms 18 00190 g013
Table 1. Descriptive statistics of male and female patients in the dataset.
Age RangeMaleFemalePregnant WomenNoNursing MothersNo
<5 years5344191st trimester1390–3 months27
5 years to 12 years3463232nd trimester1844–6 months35
13 years to 19 years1502133rd trimester867–9 months28
20 years to 64 years10121605 Over 9 months63
65 years and above133135
Total21752695Total409Total153
Table 2. Patient symptoms and diseases in the dataset.
SNSymptom/DiseaseAbbreviationSNSymptom/DiseaseAbbreviation
1Abdominal painsABDPN33Muscle and body painMSCBDYPN
2Back painBCKPN34Mouth ulcerMUTUCR
3Bitter taste in mouthBITAIM35NauseaNUS
4BleedingBLDN36Night sweatsNGTSWT
5Bloody urineBLDYURN37Pain behind the eyesPNBHEYE
6CatarrhCTRH38Upper back pain (loin)UPBCKPN
7Chest indrawCHSIND39Painful urinationPNFLURNTN
8Chest painCHSPN40PeritonitisPERTN
9Chills and rigorsCHLNRIG41Red eyesREDEYE
10Cloudy urineCLDYURN42Red eyes, face, tongueREDEYEFCTNG
11ConstipationCNST43Sensitivity to lightSENLHT
12Cough (initial dry)CGHDRY44ShockSHK
13DiarrheaDRH45Skin rashSKNRSH
14Difficulty breathingDIFBRT46Sore throatSRTRT
15DizzinessDIZ47Suprapubic painsSPPBPN
16Dry coughDRYCGH48Urinary frequencyURNFQC
17FatigueFTG49VomitingVMT
18FeverFVR50WheezingWHZ
19High persistent feverHGPSFVR51MalariaMAL
20High-grade feverHGGDFVR52Typhoid feverENFVR
21Stepwise rise feverSWRFVR53HIV and AIDSHVAD
22Sudden onset feverSUDONFVR54Upper urinary tract infectionUPUTI
23Low-grade feverLWGDFVR55Lower urinary tract infectionLWUTI
24Foul breathFOLBRT56Upper respiratory tract infectionURTI
25Body itchingBDYICH57Lower respiratory tract infectionLRTI
26Generalized body painGENBDYPN58TuberculosisTB
27Generalized rashesGENRSH59Lassa feverLASFVR
28HeadachesHDACH60Yellow feverYELFVR
29Intestinal bleeding and perforationINTBLEPRF61Dengue feverDENFVR
30Joint swellingJNTSWL
31LethargyLTG
32Lymph node swellingLMPNDSWL
Table 3. Patient symptoms and diseases used in the study.
Symptom/DiseaseAbbreviation Symptom/DiseaseAbbreviation
1Abdominal painsABDPN20HeadachesHDACH
2Bitter taste in mouthBITAIM21LethargyLTG
3Bloody urineBLDYURN22Lymph node swellingLMPNDSWL
4Catarrh CTRH23Muscle and body painMSCBDYPN
5Chest indrawCHSIND24Mouth ulcerMUTUCR
6Chest painCHSPN25NauseaNUS
7Chills and rigorsCHLNRIG26Night sweatsNGTSWT
8ConstipationCNST27Painful urinationPNFLURNTN
9Cough (initial dry)CGHDRY28Sore throatSRTRT
10Difficulty breathingDIFBRT29Suprapubic painsSPPBPN
11Dry coughDRYCGH30Urinary frequencyURNFQC
12FatigueFTG31VomitingVMT
13FeverFVR32WheezingWHZ
14High-grade feverHGGDFVR33MalariaMAL
15Stepwise rise feverSWRFVR34Typhoid feverENFVR
16Low-grade feverLWGDFVR35HIV and AIDSHVAD
17Foul breath FOLBRT36Urinary tract infectionUTI
18Generalized body painGENBDYPN37Respiratory tract infectionRTI
19Generalized rashesGENRSH38TuberculosisTB
Table 4. Class distribution of training and testing sets after dataset splitting.
DiseaseTotal CasesTraining Set (80%)Test Set (20%)
Malaria27192175544
Typhoid fever1157926231
HIV/AIDS42433985
Urinary tract infection907726181
Respiratory tract infection1094875219
Tuberculosis38130576
Table 5. ML diagnostic model performance.
MALENFVRHVADUTIRTITB
MLPPrecision0.840.650.750.770.750.59
Recall0.870.420.340.650.630.59
F1 score0.850.510.460.700.690.64
XGBoostPrecision0.840.640.620.770.770.72
Recall0.900.560.400.630.680.60
F1 score0.870.600.480.700.720.65
RFPrecision0.850.690.750.800.770.77
Recall0.910.530.390.650.680.49
F1 score0.880.600.510.720.720.60
Table 6. Sample prompt of ML and XAI results.
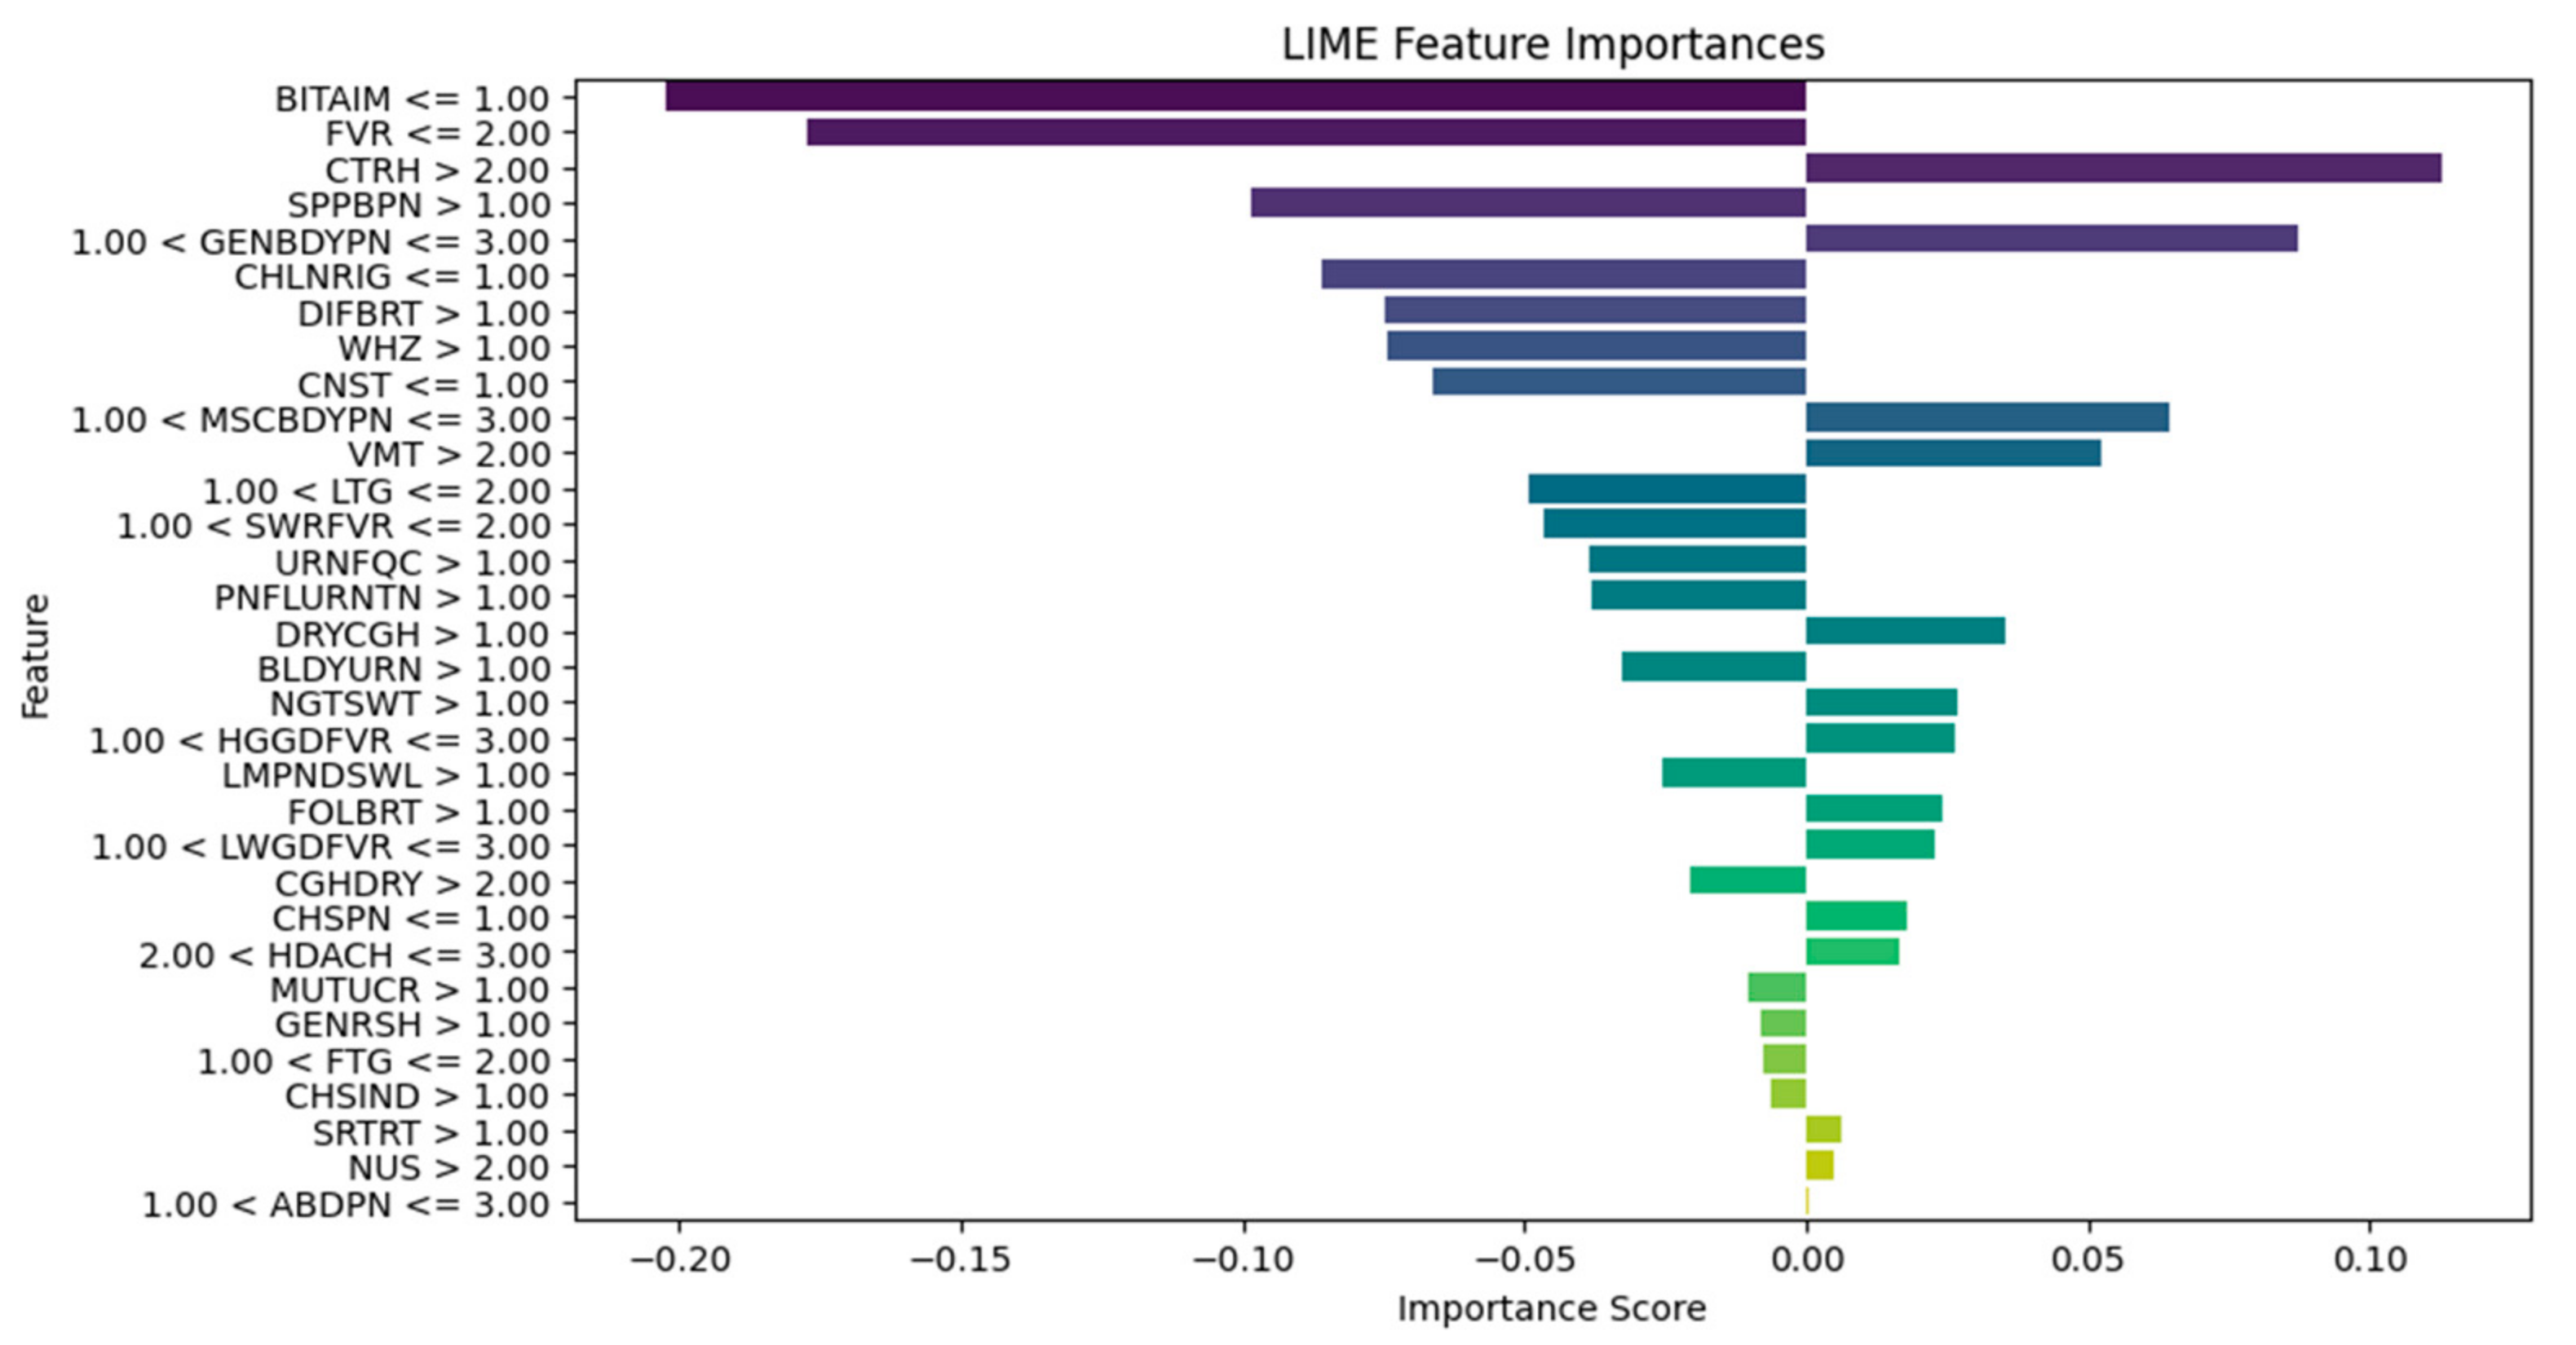
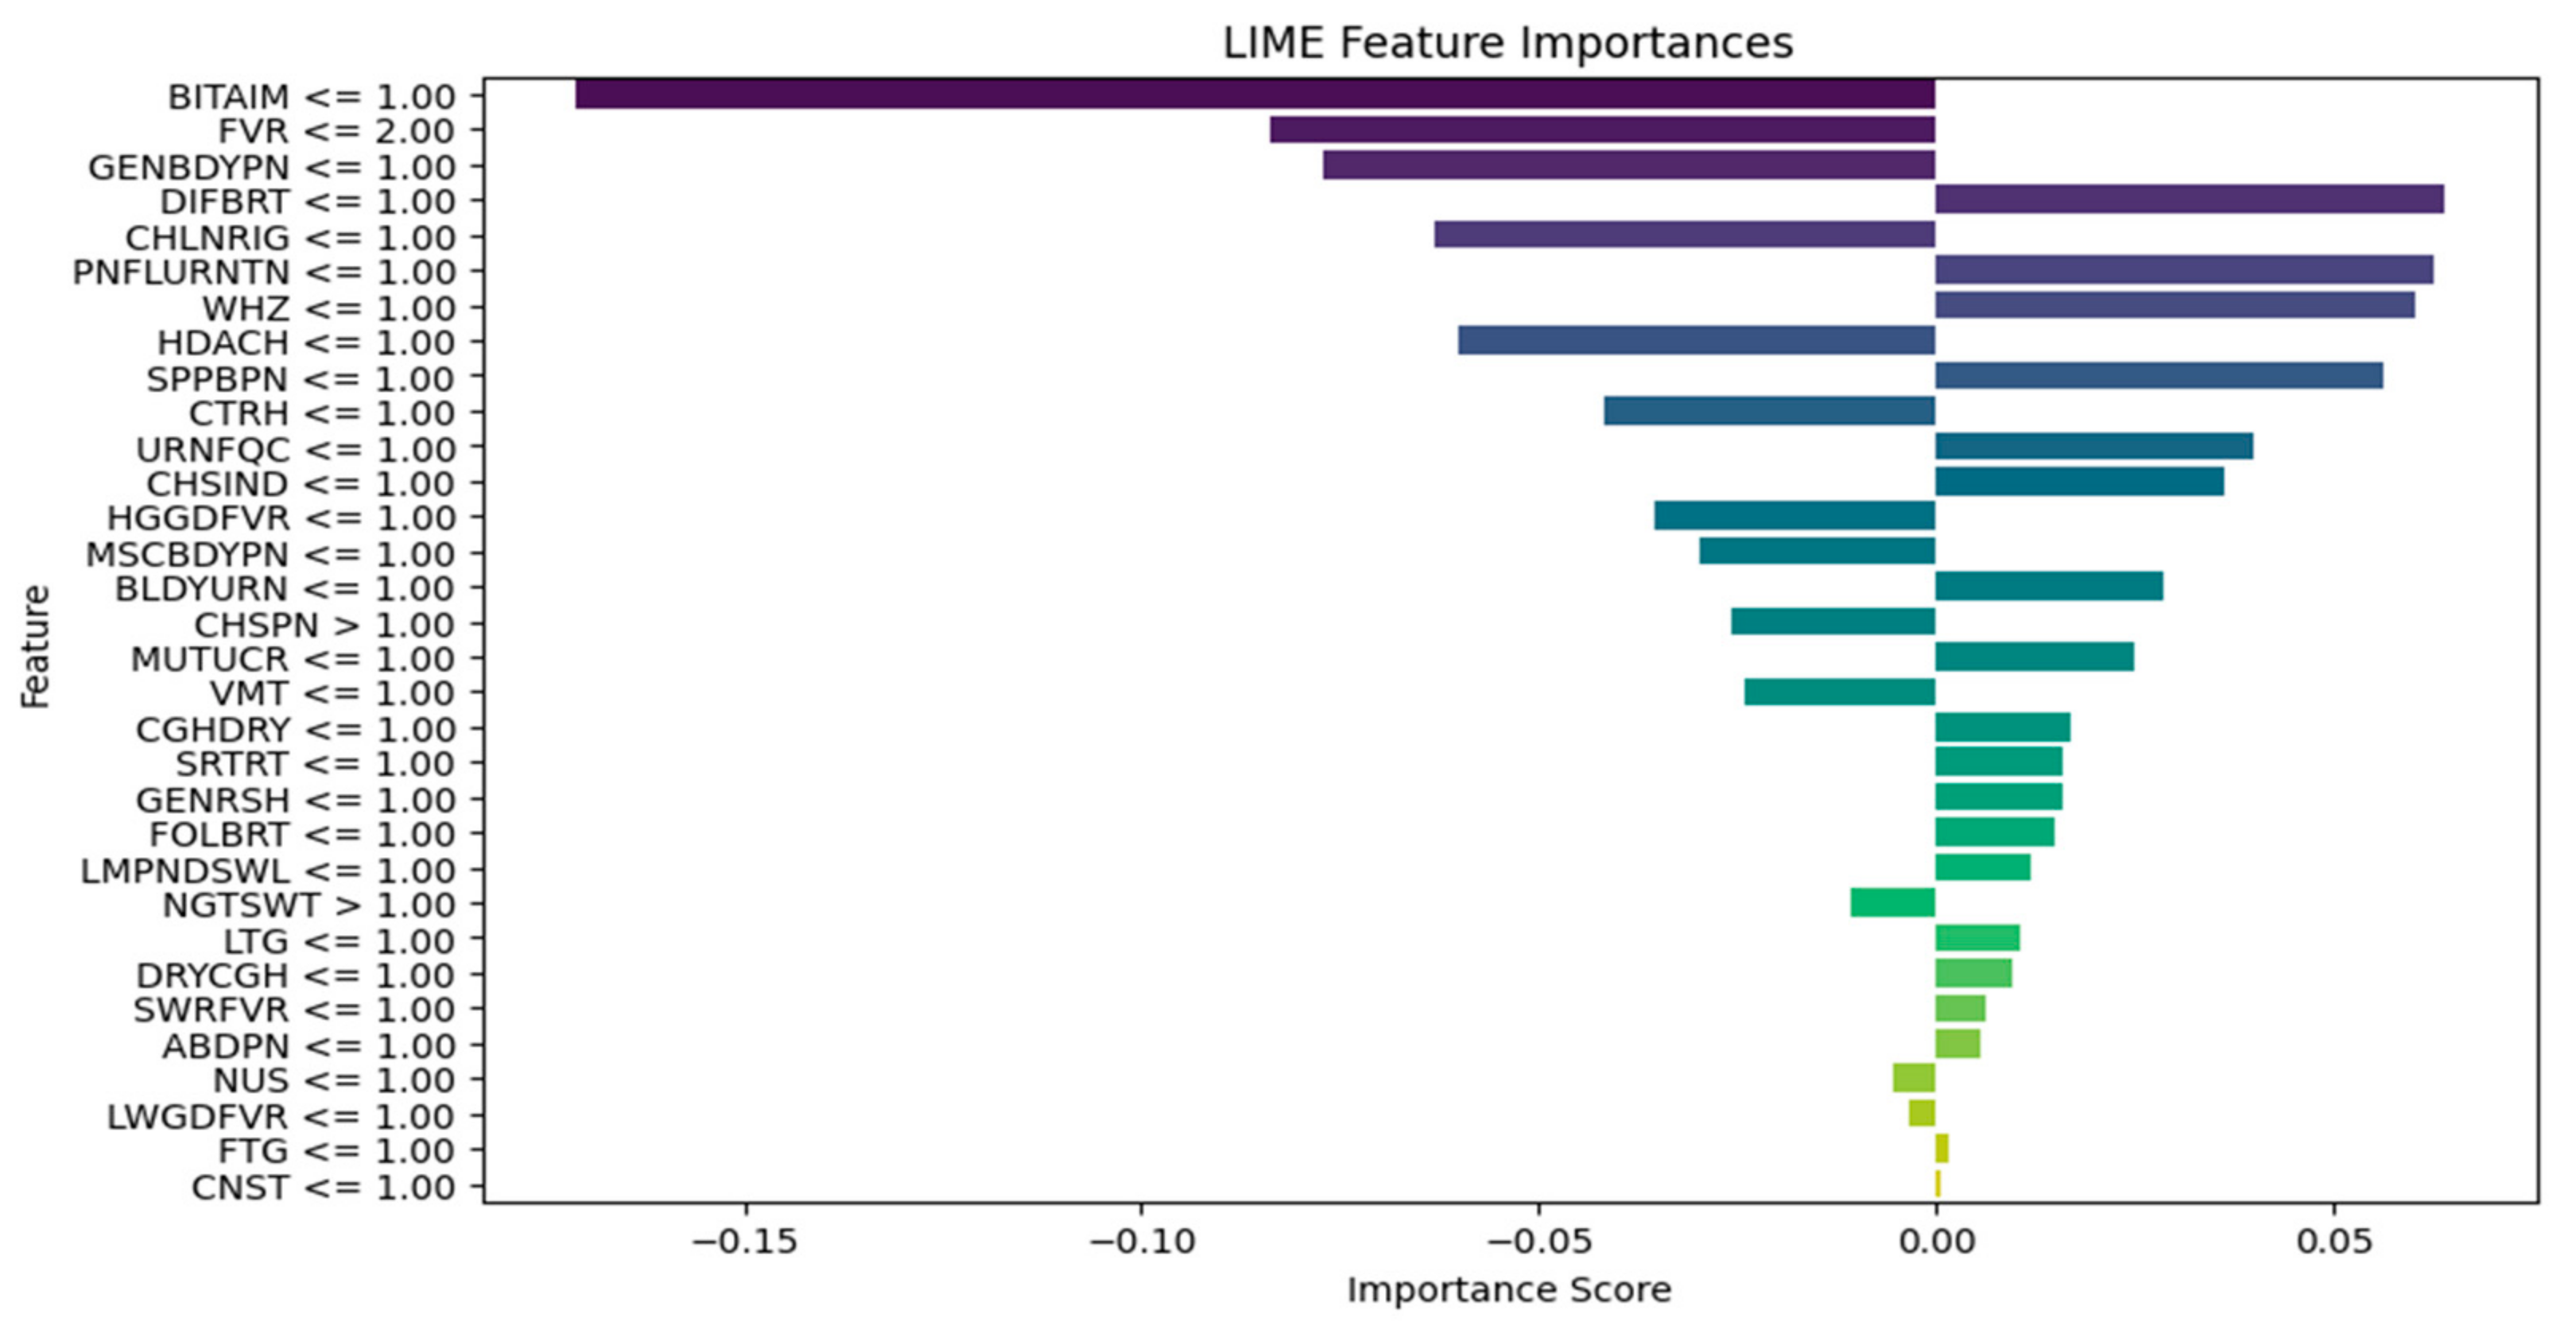
Explain the LIME results below (disease or diseases and significant symptoms) to a physician with not more than 300 words:
Predictions [“Typhoid Fever Likely”, “HIV/AIDS Likely”, “Urinary Tract Infection Likely”, “Respiratory Tract Infection Likely”, “Tuberculosis Likely”]
LIME Explanation;
BITTER TASTE IN MOUTH <= 1.00; −0.16758919765052108
Painful Urination > 1.00; −0.06605868111597245
Suprapubic_Pain > 1.00; −0.06550467141471979
Difficulty Breathing <= 1.00; 0.06071678705925383
Wheezing <= 1.00; 0.0590462921972035
Headache <= 1.00; −0.05826547312462451
CHILLS AND RIGORS <= 1.00; −0.05630271637802242
CHEST INDRAW <= 1.00; 0.04070095788472542
Generalized Body Pain > 3.00; 0.03974979336103006
1.00 < CATARRH <= 2.00; 0.03816070620416529
Urinary_Frequency > 1.00; −0.03770207672685268
ABDOMINAL PAIN > 3.00; −0.033902377938511155
2.00 < Fever <= 3.00; 0.032999053123995245
1.00 < Muscle and Body Pain <= 3.00; 0.03295097711760973
HGGDFever > 3.00; 0.032768000129691194
BLOODY URINE > 1.00; −0.029955841393233477
Cough (Initial Dry) <= 1.00; 0.026364166193042264
CHEST PAIN <= 1.00; 0.02354889167461192
Sore_Throat > 1.00; −0.021402483028506374
Lymph Node Swelling > 1.00; −0.0202552321969518
Vomiting > 2.00; 0.019057721531348118
Lethargy > 2.00; −0.017371438160508137
Mouth Ulcer > 1.00; −0.015856144250446513
Fatigue > 3.00; −0.015122895567807396
Generalized Rash <= 1.00; 0.014081682731125898
Foul Breath <= 1.00; 0.01260963643914623
1.00 < LWGDFever <= 3.00; 0.012187835432654306
CONSTIPATION <= 1.00; −0.012145436356090885
Night Sweat > 1.00; −0.010556292961671602
SWRFever > 2.00; −0.007451681601225083
Nausea > 2.00; −0.00406587833157149
Dry Cough > 1.00; −0.003064108573649665
Disclaimer/Publisher’s Note: The statements, opinions and data contained in all publications are solely those of the individual author(s) and contributor(s) and not of MDPI and/or the editor(s). MDPI and/or the editor(s) disclaim responsibility for any injury to people or property resulting from any ideas, methods, instructions or products referred to in the content.

